Sample Category Title
EURAUD Wave Analysis
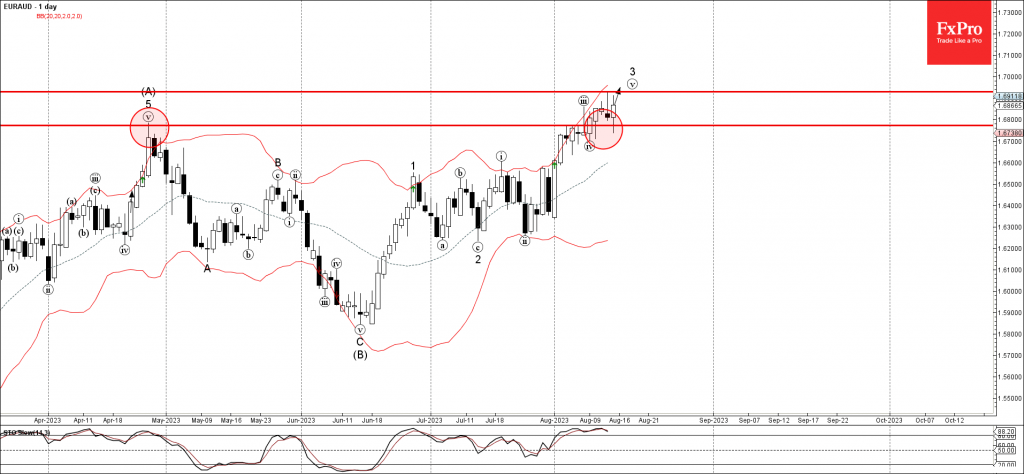
- EURAUD reversed from support level 1.6770
- Likely to rise to resistance level 1.6930
EURAUD currency pair recently reversed up from the pivotal support level 1.6770 (former multi-month high from April).
The upward reversal from the support level 1.6770 continues the minor impulse waves v and 3, which belong to the intermediate impulse wave (C) from June.
Given the clear daily uptrend, EURAUD can be expected to rise further toward the next resistance level 1.6930, target for the completion of the active impulse waves v and 3.
Stocks Drop on China Jitters and as Global Bond Selloff Continues
US stocks remained heavy after a robust retail sales report sent yields higher and raised the odds that the Fed might not be done raising rates. A healthy consumer was supposed to drive soft landing calls, but too much consumer resilience will drive the Fed to keep rates higher for longer. This US retail sales report showed spending is picking up, especially given the upward revisions for June's report.
Equities were heavy in early trade as concerns grow that China is in a lot worse shape than initially thought. Ahead of some key data, the PBOC decided to be proactive and delivered a surprise rate cut. China cut the 1-year medium term lending rate facility from 2.65% to 2.50%, which was the steepest reduction since 2020. The data that followed the rate cut was uninspiring for the rest of the year and will force officials into delivering a lot more easing. Key Chinese industrial production, retail sales, and investment data all came in softer-than-expected.
UK
Record wage growth will keep the pressure on the BOE to deliver more tightening. The economy still has a tight labor market as companies need to pay their employees more money. The rise in the unemployment rate was due to more people returning to the workforce. Average pay excluding bonuses easily exceeded the consensus estimate of 7.4%, rising 7.8% in the three months through June from a year ago.
This hot wage data is giving the BOE hawks a win as they were right in calling for a half-point rate increase last meeting. The British pound is starting to look attractive again as it seems the BOE will easily be raising rates at both the September and November meetings.
Canadian CPI
The Canadian dollar rallied after the July inflation rose back the Bank of Canada’s inflation-control target range of 1% to 3%. This was not entirely hot as both core readings remained subdued. This report means that the BOC will remain data-dependent and that the odds of one more rate hike might be growing.
Gas Prices
European natural gas futures are surging as the risk for Australian LNG workers to strike grow. If talks collapse, the world could see about 10% of global LNG exports at risk. Europe has bolstered their inventories, but a hot end to summer could lead to a surge in cooling demand. Inventories are not a concern right now, but if we get further disruptions and if weather trends in the summer and winter lead to many spikes in demand, we could see natural gas surge significantly higher.
Jackson Hole
We are a week away from Jackson Hole and Wall Street is not expecting any major surprises. Fed Chair Powell will remain upbeat regarding the progress with bringing inflation down. July PCE data to be sticky and keep risk of one more hike on the table. Given the US economic resilience backdrop, the Fed will want to keep optionality here, so an end of tightening will not be signaled.
Oil
Crude prices continue to pullback after both disappointing Chinese industrial production data and the German ZEW survey that showed concerns with recovery are elevated. The oil market might remain tight, but most of the headlines are turning bearish for the demand side. Oil’s pullback might need to continue a while longer before buyers emerge.
Gold
Gold prices are falling as real yields continue to rise. Gold could be stuck in the house of pain a little while longer if the bond market selloff does not ease. The 30-year Treasury yield rising above 2% is a big red flag for some traders. We haven’t seen yields on the 30-year at these levels since 2011, which is making non-interest bearing gold less attractive even as China’s property market rattle markets.
Home Depot
Home Depot delivered mostly in-line results, but they were able to hold onto their guidance. Big ticket projects are under pressure, but small projects remain in demand. Share prices rose given the lowered May outlook was reaffirmed and after they set a $15 billion buyback.
Fed’s Kashkari feels good about falling inflation, but it’s still too high
Minneapolis Fed Neel Kashkari remarked at an event today, "Inflation is coming down. We have made progress and good progress. I feel good about that."
But it wasn't all accolades. Highlighting lingering concerns, Kashkari pointedly added, "It's still too high," making it clear that the current inflation rates, though improved, are not yet at Fed's comfort zone.
Kashkari also questioned, "Have we done enough to actually get inflation all the way back down to our 2% target. Or do we have to do more?"
This introspection underscores the broader debate within FOMC: whether the existing measures are adequate or if there's a need for further tightening action.
Canadian Dollar Steady Despite Rise in Inflation
- Canada’s inflation rises to 3.3%
- US retail sales climb 0.7%, core rate soars 1%
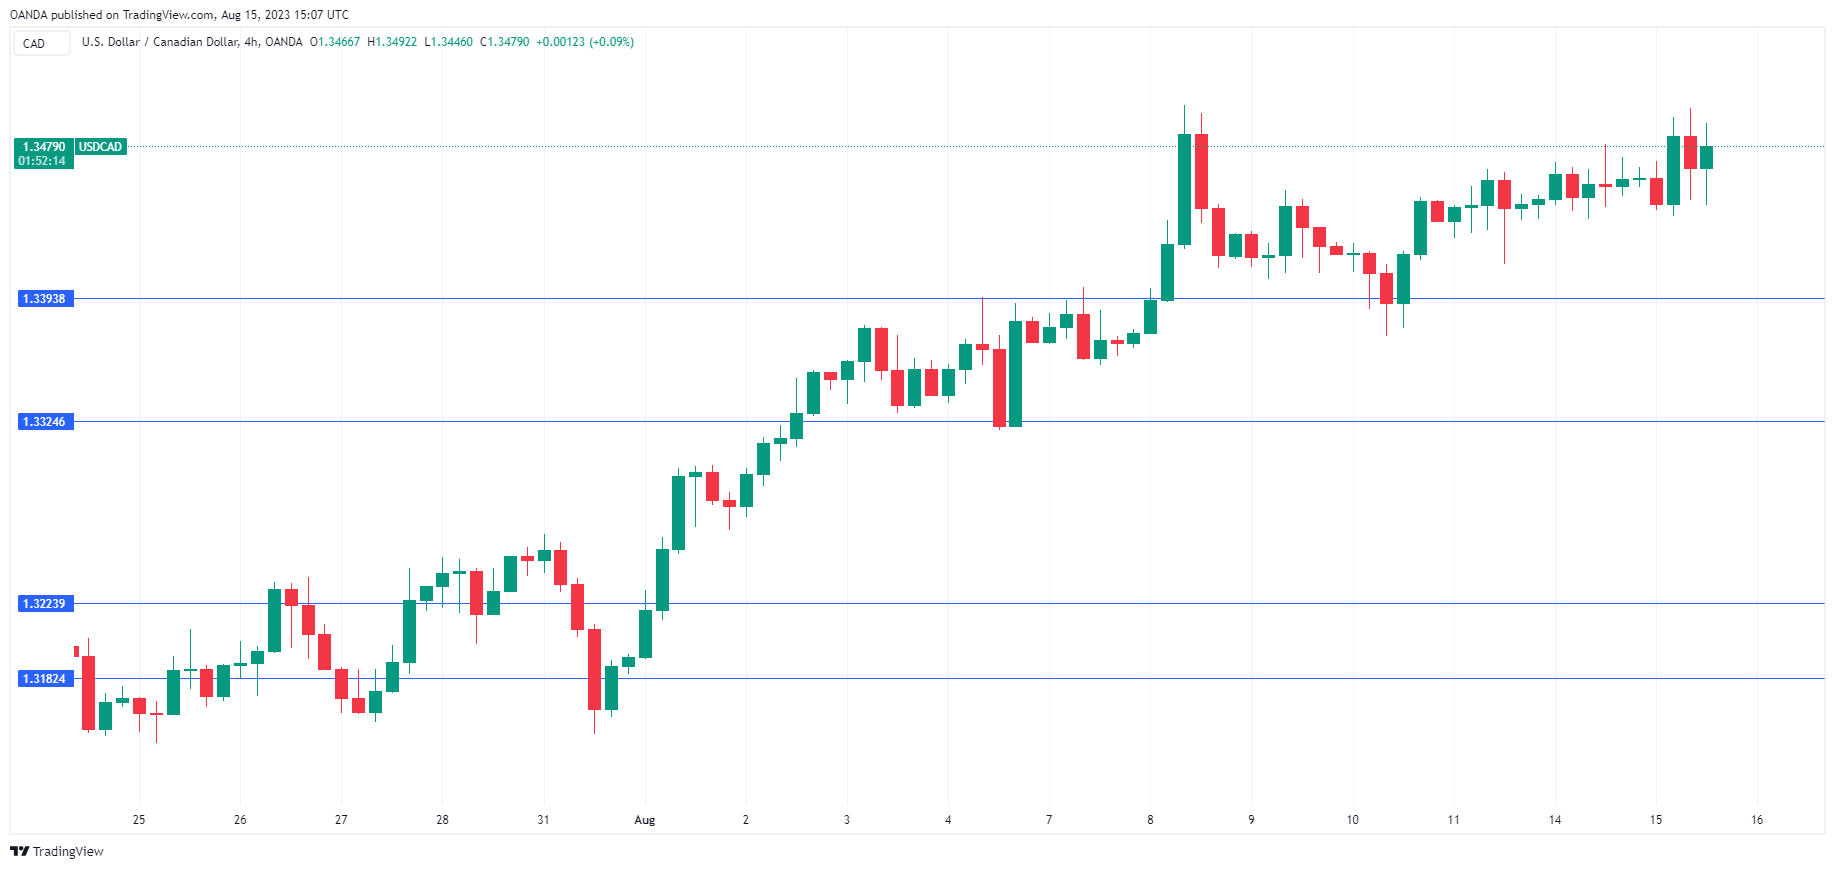
The Canadian dollar is showing limited movement on Tuesday. In the North American session, USD/CAD is trading at 1.3477, up 0.13%.
Canada’s inflation jumps
Canada released the July inflation report earlier today. CPI rose 3.3% y/y, up from 2.8% in June and above the consensus estimate of 3.0%. On a monthly basis, CPI was up 0.6% in June, compared to 0.1% in May and higher than the estimate of 0.3%.
The average of two of the Bank of Canada’s core measures came in at 3.65% y/y in June, a drop lower than the 3.7% gain in May. Core CPI, which is considered more reliable than headline CPI, remains uncomfortably high for the Bank of Canada.
The June inflation reading managed to fall within the BoC’s 1%-3% target, for the first time since March 2021. The rise in the July reading is a reminder that the fight against inflation is not over and it will be a challenge for the BoC to keep inflation below 3%.
The Bank of Canada holds its next meeting on September 6th. The BoC has said that its rate decisions will be based on the data, and the rise in July CPI could provide support for a rate hike at that meeting. Reuters reported that the money markets have raised the probability of a 25 basis point hike in September to 31% currently, up from 22% prior to the inflation report release.
Consumer spending remains resilient
In the US, retail sales for July surprised on the upside. Headline retail sales rose 0.7% m/m, above the June reading of 0.3% (upwardly revised from 0.2%). The core rate jumped 1.0%, blowing past the 0.2% gain in June. Both readings beat the consensus estimate of 0.4%. The Fed is widely expected to hold rates in September, but November is less clear-cut, with a 64% chance of a pause, a 32% likelihood of a 25-basis point hike and a 3% chance of a 50-bps increase.
USD/CAD Technical
- There is resistance at 1.3513 and 1.3580
- 1.3434 and 1.3367 are providing support
Yuan Nears Multi-Year Lows on the Weaker Economy
Another set of statistics from China has added to the wave of disappointment over the momentum of the world’s second-largest economy, prompting a dichotomic response from regulators.
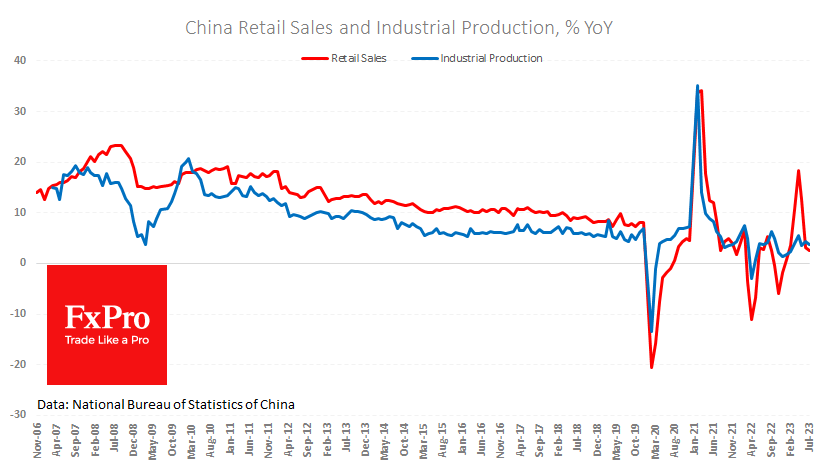
Retail sales in July were only 2.5% y/y, down from 3.1% y/y in the previous month and in stark contrast to the expected acceleration to 4.2% y/y. Until now, there has been a lack of visible results from the measures taken to stimulate final demand. China continues to struggle to rely on domestic demand as a source of growth.
Industrial production failed to impress either, rising 3.7% y/y after 4.4% in the previous month and worse than expected at 4.3%.
The unemployment rate unexpectedly rose to 5.3%, and urban youth unemployment figures were “suspended” after the numbers exceeded 21.3% in June.
Shortly after the statistics release, the People’s Bank of China cut its medium-term lending rate by 0.15 percentage points to 2.5%. The weak economic data and the rate cut put pressure on the Yuan. The USD/CNH exchange rate was above 7.32 on Tuesday and was only higher for a few days in October-November last year. Consistently higher, it was traded until 2008. This is an explainable market reaction to the dramatic shift in expectations and the divergence in US and Chinese monetary policy.
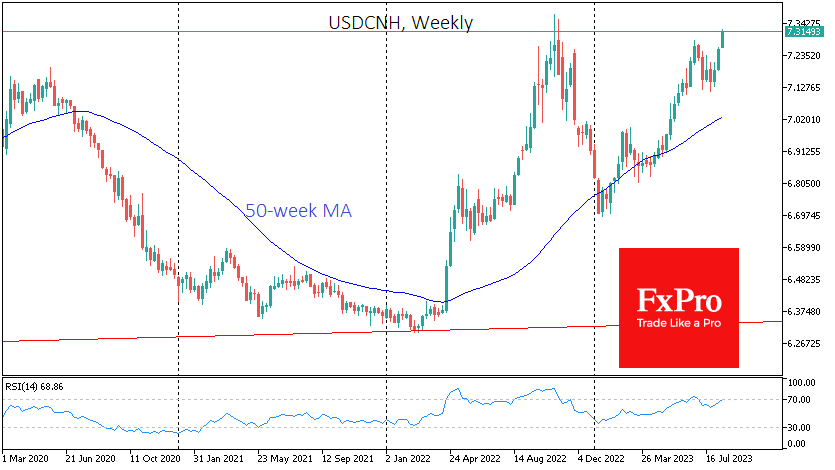
What is more difficult to explain are reports that state banks have become active in the foreign exchange market to protect the national currency from depreciation. The dichotomy of such moves is that the weakening of the exchange rate can boost exports and stimulate domestic purchases. In contrast, attempts to stop the exchange rate deterioration against macro data only lead to the burning of reserves.
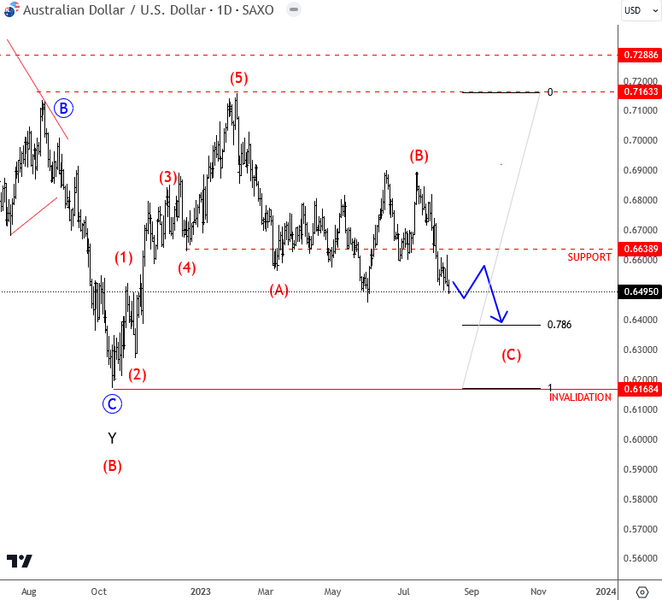
Aussie Trading South, Targeting 78.6% Fib at 0.64
Aussie has been bearish since start of the year, with a higher degree A-B-C decline that is still in progress after a recent sharp turn down from 0.69 area. We see wave (C) in play down to 78.6% Fib, where pair may look for new buyers. However, before the trend may turn here, we need five subwaves within wave (C), which is not the case yet when looking at the 4h time frame. Notice that there can be a new drop after subwave (4) rally which is not far away as extended wave (3) can be in late stages here around 2023 lows.
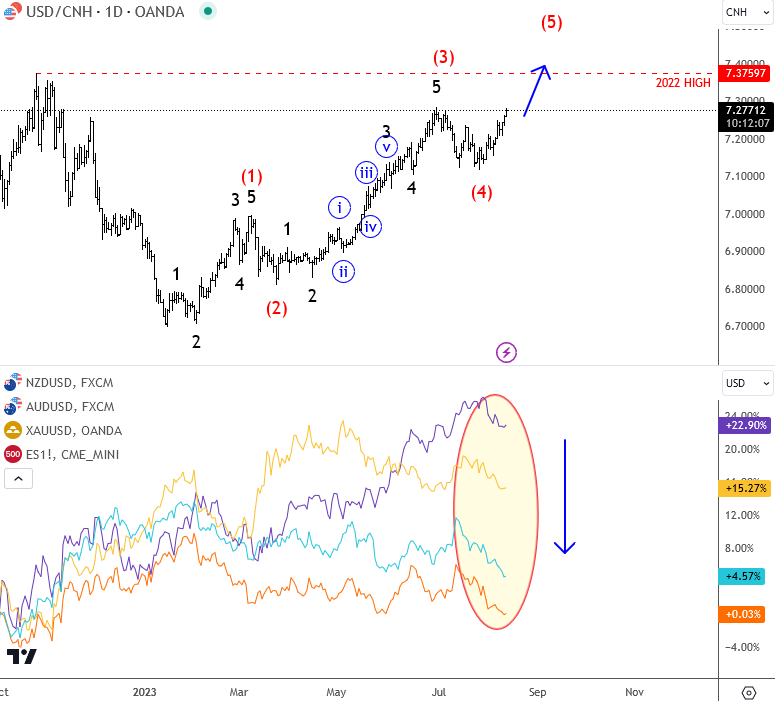
Regarding Aussie, the most important "indicator" these days seem to be USDCNH. Still in an uptrend, and has room for 2022 highs after the recent fourth-wave setback. Pair has to complete the current upward pattern, before we may start looking for risk-on again. So as long USDCNH is higher, aussie can face more weakness.
AUD/USD 4h Elliott Wave analysis
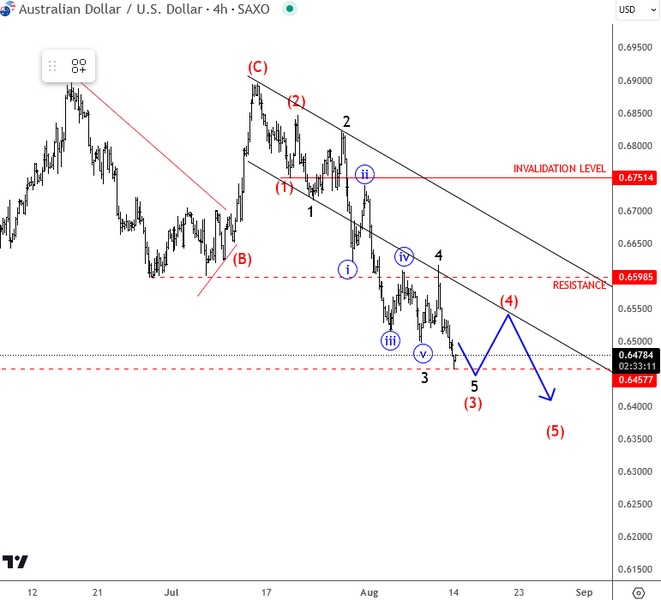
AUD/USD Elliott Wave analysis
USD/CNH vs Aussie, Kiwi, Gold, es_f
Canada: Inflation Back Above 3% in July, Thanks to Higher Energy Prices
Consumer price inflation ticked up to 3.3% on a year-on-year (y/y) basis in July, up from 2.8% in June, largely thanks to base-year effects on gasoline prices.
Even so, gasoline prices are 12.6% below year ago levels in July. But, the fact that they were 21.6% below year ago levels in June has resulted in significantly less downward pressure on headline inflation from energy prices.
Food inflation remained the highest of the eight main categories, up 7.8% y/y in July. But, the pace of increase is gradually cooling thanks to fresh fruit prices, and to a lesser extent bakery products. The cost of a typical basket of groceries has risen nearly 20% over the past two years, the largest such increase in over 40 years.
Shelter inflation heated up again to 5.1% y/y in July, from 4.8% in June. This contributed to an uptick in overall services inflation to 4.3% y/y from 4.2% y/y. Higher electricity prices lifted shelter inflation in July primarily thanks to higher prices in Alberta, as provincial rebates and the price cap ended in the spring and demand was high in the summer. Scratching beneath the surface, our measure of "supercore" inflation cooled to 2.1% y/y from 3.4% y/y in June, thanks to softer inflation for travel-related services.
The Bank of Canada's underlying inflation measures made very little progress in July. CPI-trim eased to 3.6% y/y in July from 3.7% in June and CPI-median was unchanged at 3.7% y/y.
Key Implications
Although headline inflation moving back above to 3% is likely to catch some attention, it is what's going on under the hood that is more concerning for the Bank of Canada. The BoC's median and trim inflation measures continued to make progress in July, but at a glacial pace. Underlying inflation remains a long way from the 2% goal.
Domestic demand in Canada's economy continues to hum along, and as a result we expect progress on inflation to remain disappointing through the remainder of the year. This is pushing up expectations that the BoC may pursue another rate hike in the fall months as it gathers more information on the jobs market and overall inflation. We will hear more on the Bank's thinking when the deliberations from the July decision are released on Wednesday.
US: Retail Sales Rise More than Expected in July
Retail sales rose by 0.7% month-on-month (m/m) in July, up from the upwardly revised 0.3% (previously 0.2%) reading in June. This was notably above the median consensus forecast calling for a more muted gain of 0.4%.
Trade in the auto sector was weaker, declining by -0.3% m/m, relative to a 0.7% m/m gain in June. This largely reflected a decline of sales at motor vehicle dealers which fell 0.4% (down notably from last month's 0.6% m/m gain). Meanwhile, sales at automotive parts and accessory stores were up 1.1% for the month.
Sales across other more volatile categories were generally higher in July. The building materials and equipment category rose by 0.7% m/m (after a -1.5% m/m decline in June) and sales at gasoline stations rose 0.4% m/m (the first monthly increase after eight consecutive months of decline) . The rebound at gas stations partly reflects recent upward movements in gas prices.
Sales in the retail sales "control group", which excludes the above volatile components (autos, building materials and gas) and is used to estimate personal consumption expenditures (PCE) came in at 1.0% m/m - double the consensus forecast. Data for June was revised marginally lower to show an increase of 0.5% instead of the previously reported 0.6%.
- Among the control group, the largest contribution came from sales at non-store retailers (+1.9% m/m), followed by sporting goods stores (+1.5% m/m), and clothing and accessory stores (+1.0% m/m).
- The only two categories posting declines were furniture & electronics stores (-1.6% m/m) and miscellaneous stores retailers (-0.3% m/m).
Food services & drinking places – the only services category in the retail sales report – was up 1.4% m/m.
Key Implications
U.S. consumers kicked off the third quarter on a strong note with retail sales coming in well above expectations. Though still early yet, sales are currently tracking 4.7% annualized in 2023 Q3 relative to the revised 0.6% posted for Q2. Despite the strong start, looking ahead, we expect consumer spending to slow over the remainder of the year as past rate hikes continue to filter through the economy.
These expectations incorporate the view that the resumption of student debt payments and tightening credit conditions are likely to weigh on spending. Nonetheless, recent surveys suggest that consumers are more upbeat about their financial situation, job prospects and the downward direction of inflation. That outlook, along with a still-robust job market and solid real wage gains should provide some counterbalance and hold consumer spending near a stall speed over the coming quarters.
USD/JPY Mid-Day Outlook
Daily Pivots: (S1) 144.94; (P) 145.26; (R1) 145.86; More...
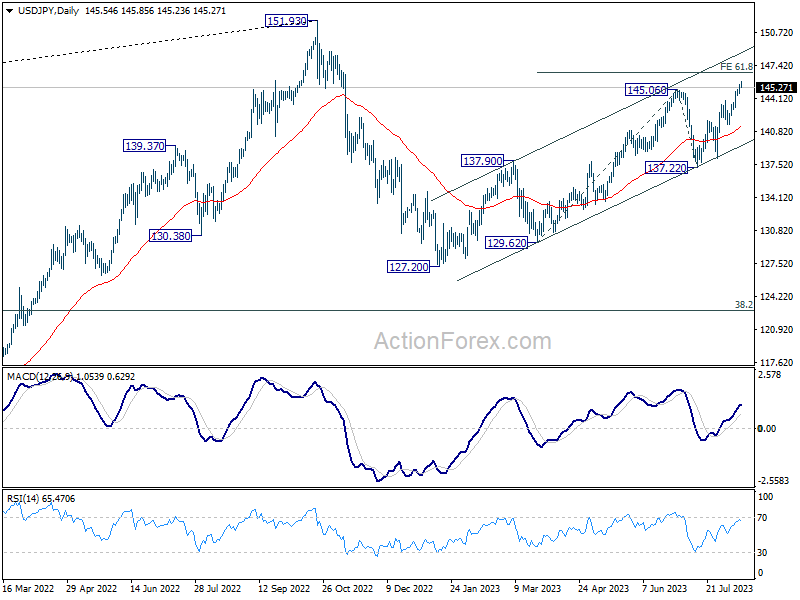
Intraday bias in USD/JPY stays on the upside for the moment. Current rise from 127.20 is in progress for 61.8% projection of 129.62 to 145.06 from 137.22 at 146.76. On the downside, below 144.62 minor support will turn intraday bias neutral and bring consolidations first, before staging another rally.
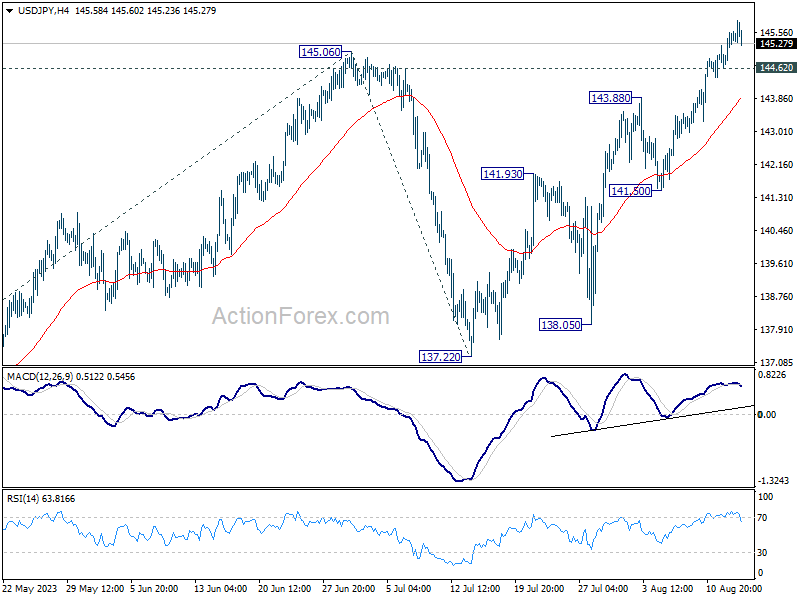
In the bigger picture, overall price actions from 151.93 (2022 high) are views as a corrective pattern. Rise from 127.20 is seen as the second leg of the pattern and could still be in progress. But even in case of extended rise, strong resistance should be seen from 151.93 to limit upside. Meanwhile, break of 137.22 support should confirm the start of the third leg to 127.20 (2023 low) and below.