Sample Category Title
Dollar Gears Up as Eyes Turn to FOMC Minutes; Sterling Staying Firm
In early US trading sessions, Dollar is showing signs of regaining momentum as market participants eagerly anticipate the release of FOMC minutes from July 25-26 meeting, where a 25bps hike was delivered. Recent comments from Fed officials suggest an increasing divergence in views regarding the need for additional monetary tightening.
Presently, fed funds futures reflect an approximately 90% likelihood of rates remaining unchanged in September, with the odds for another rate hike by year-end staying well below 40%. Although the minutes might not paint a clear roadmap for future rate adjustments, the deliberations between the more aggressive 'hawks' and the cautious 'doves' are set to garner significant attention.
In the broader currency landscape, Sterling has emerged as today's frontrunner, buoyed by UK's CPI data. However, its climb lacks substantial vigor. Hot on its heels is New Zealand Dollar, followed by Euro. Swiss Franc, meanwhile, finds itself at the opposite end of the spectrum as today's weakest performer, shadowed closely by the Australian Dollar and the Yen.
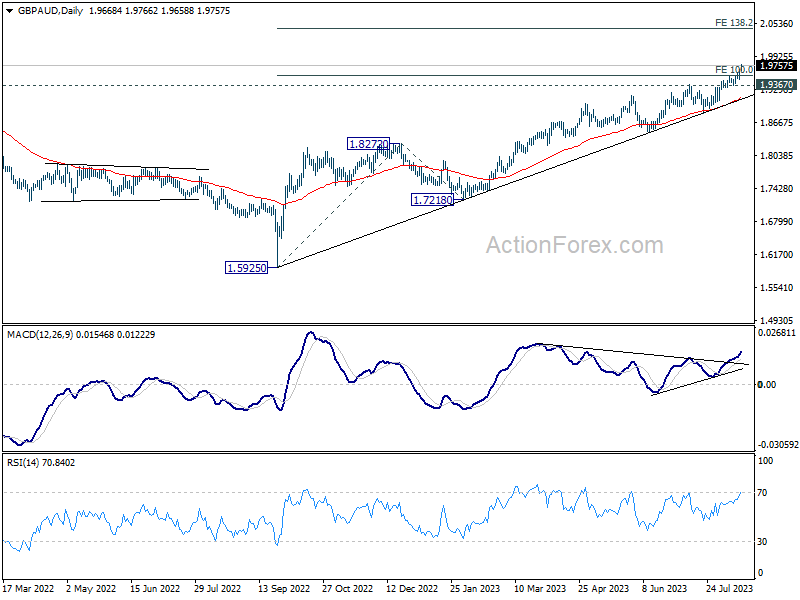
Technically, GBP/AUD up trend continues this week, and D MACD clearly indicates upside reacceleration. Further rise is expected as long as 1.9367 support holds. With 100% projection of 1.5925 to 1.8272 from 1.7218 at 1.9565 taken out, next target is 138.2% projection at 2.0462. While both currencies are risk-sensitive, the development in GBP/AUD suggests that Aussie is the one to go against in case of intensifying risk aversion, not the Pound.
In Europe, at the time of writing, FTSE is down -0.59%. DAX is up 0.02%. CAC is down -0.11%. Germany 10-year yield is down -0.006 at 2.670. Earlier in Asia, Nikkei dropped -1.46%. Hong Kong HSI dropped -1.36%. China Shanghai SSE dropped -0.82%. Singapore Strait Times dropped -0.59%. Japan 10-year JGB yield rose 0.0002 to 0.632.
Eurozone industrial production up 0.5% mom on energy
Eurozone industrial production rose 0.5% mom in June, well above expectation of 0.1% mom. Production of energy grew by 0.5%, while production of durable consumer goods fell by -0.1%, capital goods by -0.7%, intermediate goods by -0.9% and non-durable consumer goods by -1.1%.
EU industrial production rose 0.4% mom. Among Member States for which data are available, the highest monthly increases were registered in Ireland (+13.1%), Denmark (+6.3%) and Lithuania (+3.2%). The largest decreases were observed in Sweden (-5.3%), Finland and Malta (both -3.3%) and Belgium (-3.0%).
UK CPI slowed to 6.8% in Jul, services inflation hit highest since 1992
July saw a marked deceleration in UK's CPI, falling from 7.9% yoy to 6.8% yoy , precisely in line with market expectations. Core CPI, which strips out variables like energy, food, alcohol, and tobacco, stood unchanged at 6.9% yoy, above the expected 6.8%.
CPI figures pertaining to goods showed a noticeable slowdown, dropping from 8.5% yoy to 6.1% yoy. On the flip side, CPI services ramped up from 7.2% yoy to 7.4% yoy , registering its peak since the staggering 9.5% yoy rate observed in March 1992.
On a month-to-month analysis for July, CPI receded by -0.4%, a figure slightly above than forecasted decline of -0.5%. Core CPI saw a monthly rise of 0.3% mom. While the CPI for goods plunged by -1.7% mom. , services CPI exhibited an increase, registering growth of 1.0% mom. .
Office for National Statistics remarked, "The slowdown in the annual CPI rate into July 2023 was driven by downward contributions to change from 8 of the 12 divisions."
Notably, housing and household services emerged as the primary sectors applying downward pressure. Expanding on this, ONS stated, "Within this division, the downward effect came mainly from gas and electricity."
RBNZ on hold, OCR to stay high for longer
RBNZ has decided to maintain OCR unchanged at 5.50% again, aligning with broad market expectations. Making its stance clear, the bank asserted that the "OCR needs to stay at restrictive levels for the foreseeable future."
Reflecting a neutral stance, the central bank emphasized its confidence in the current monetary policy, "that with interest rates remaining at a restrictive level for some time, consumer price inflation will return to within its target range of 1 to 3% per annum, while supporting maximum sustainable employment."
Adding depth to its economic perspective, "The nominal neutral OCR has increased by 25 basis points to 2.25% within the projections," the Committee noted. They were in consensus that the existing OCR level was contractionary, asserting that it's effectively curbing domestic spending as intended.
Shifting the lens to future projections, the forecasts in the Monetary Policy Statement hint at the OCR potentially reaching a peak of 5.6% in the first quarter of 2024. This marks a slight shift from the earlier prediction of 5.5% in Q3 2023, hinting at the possibility of an additional rate hike. As for subsequent rate cut expectations are now set for the second quarter of 2025, a slight delay from the previously anticipated period between Q4 2024 and Q1 2025.
Australia's Westpac leading index ticks up, but below-par growth set to persist
Australia's Westpac Leading Index figures reveals that growth rate has shown a marginal uptick, moving from -0.67% to -0.60% in July. But alarmingly, this marks the twelfth consecutive month in red, representing the longest stretch of such negative prints in a span of seven years, barring the COVID-affected period.
The subdued, below-par growth momentum witnessed throughout 2023 seems set to persist into the subsequent year. Westpac predicts deceleration in GDP growth to a mere 1% for the current year. Any potential rebound is anticipated to be minimal, with projections indicating a slight rise to 1.4% annually in 2024 – with the bulk of this growth concentrated towards the year-end.
Regarding RBA meeting on September 5, Westpac sets its expectations clear. The institution foresees cash rate remaining stable at 4.10%, denoting the zenith of this current tightening phase.
Referring the recent remarks of RBA Governor before the House of Representatives Standing Committee on Economics, the note emphasized, "Policy is now in a 'calibration' phase with small adjustments still possible if the data starts to show clear risks of a slower return to low inflation."
Nevertheless, given the evident frailty in growth momentum – as underscored by the most recent Leading Index update – coupled with the broader dynamics of price and wage inflation aligning with RBA's forecasts, "the threshold for additional tightening is high and unlikely to be met."
USD/JPY Mid-Day Outlook
Daily Pivots: (S1) 145.17; (P) 145.52; (R1) 145.93; More...
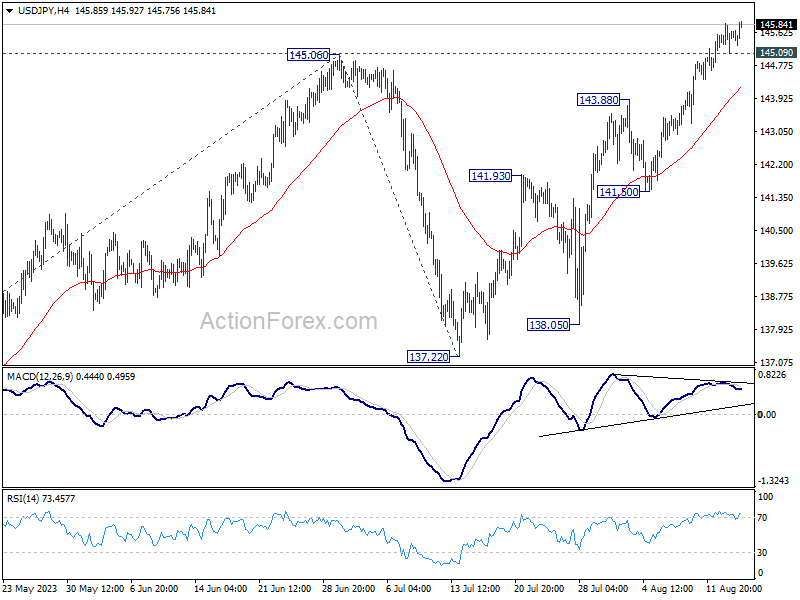
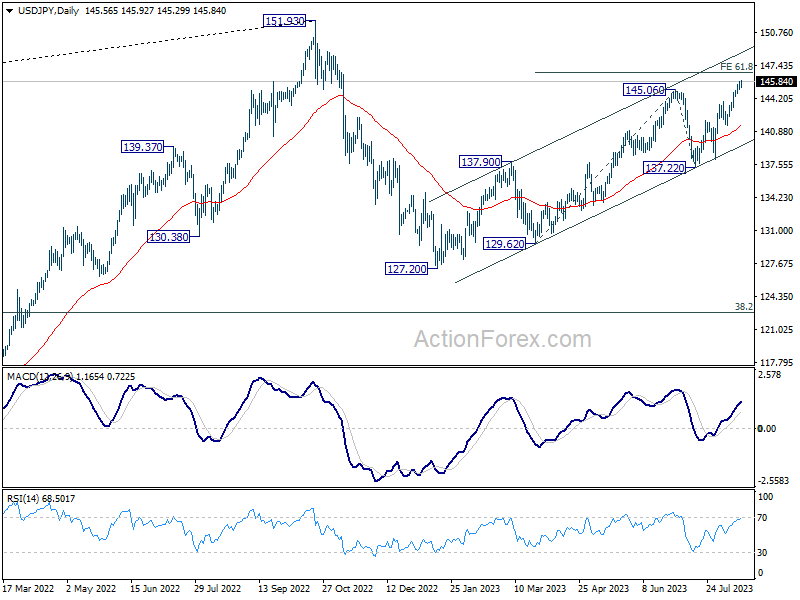
Intraday bias in USD/JPY remains on the upside at this point, despite some loss of momentum. Current rally from 127.20 is in progress for 61.8% projection of 129.62 to 145.06 from 137.22 at 146.76. On the downside, below 144.62 minor support will turn intraday bias neutral and bring consolidations first, before staging another rally.
In the bigger picture, overall price actions from 151.93 (2022 high) are views as a corrective pattern. Rise from 127.20 is seen as the second leg of the pattern and could still be in progress. But even in case of extended rise, strong resistance should be seen from 151.93 to limit upside. Meanwhile, break of 137.22 support should confirm the start of the third leg to 127.20 (2023 low) and below.
Economic Indicators Update
| GMT | Ccy | Events | Actual | Forecast | Previous | Revised |
|---|---|---|---|---|---|---|
| 00:30 | AUD | Westpac Leading Index M/M Jul | 0.00% | 0.12% | ||
| 02:00 | NZD | RBNZ Interest Rate Decision | 5.50% | 5.50% | 5.50% | |
| 03:00 | NZD | RBNZ Press Conference | ||||
| 06:00 | GBP | CPI M/M Jul | -0.40% | -0.50% | 0.10% | |
| 06:00 | GBP | CPI Y/Y Jul | 6.80% | 6.80% | 7.90% | |
| 06:00 | GBP | Core CPI Y/Y Jul | 6.90% | 6.80% | 6.90% | |
| 06:00 | GBP | RPI M/M Jul | -0.60% | -0.70% | 0.30% | |
| 06:00 | GBP | RPI Y/Y Jul | 9.00% | 9.00% | 10.70% | |
| 06:00 | GBP | PPI Input M/M Jul | -0.40% | 0.00% | -1.30% | |
| 06:00 | GBP | PPI Input Y/Y Jul | -3.30% | -5.10% | -2.70% | -2.90% |
| 06:00 | GBP | PPI Output M/M Jul | 0.10% | -0.40% | -0.30% | -0.20% |
| 06:00 | GBP | PPI Output Y/Y Jul | -0.80% | -1.20% | 0.10% | 0.30% |
| 06:00 | GBP | PPI Core Output M/M Jul | 0.10% | -0.30% | -0.20% | |
| 06:00 | GBP | PPI Core Output Y/Y Jul | 2.30% | 1.60% | 3.00% | 3.10% |
| 09:00 | EUR | Eurozone GDP Q/Q Q2 P | 0.30% | 0.30% | 0.30% | |
| 09:00 | EUR | Employment Change Q/Q Q2 P | 0.20% | 0.40% | 0.60% | |
| 09:00 | EUR | Eurozone Industrial Production M/M Jun | 0.50% | 0.10% | 0.20% | |
| 12:15 | CAD | Housing Starts Y/Y Jul | 255K | 260K | 281.4K | |
| 12:30 | CAD | Wholesale Sales M/M Jun | -2.80% | -4.40% | 3.50% | 2.90% |
| 12:30 | USD | Housing Starts Jul | 1.45M | 1.45M | 1.43M | 1.40M |
| 12:30 | USD | Building Permits Jul | 1.44M | 1.47M | 1.44M | |
| 13:15 | USD | Industrial Production M/M Jul | 1.00% | 0.30% | -0.50% | -0.80% |
| 13:15 | USD | Capacity Utilization Jul | 79.30% | 79.00% | 78.90% | 78.60% |
| 14:30 | USD | Crude Oil Inventories | -2.4M | 5.9M | ||
| 18:00 | USD | FOMC Minutes |
New Zealand Dollar Rises after RBNZ Maintains Cash Rate
- RBNZ holds cash rate at 5.5%, as expected
- New Zealand dollar stems slide
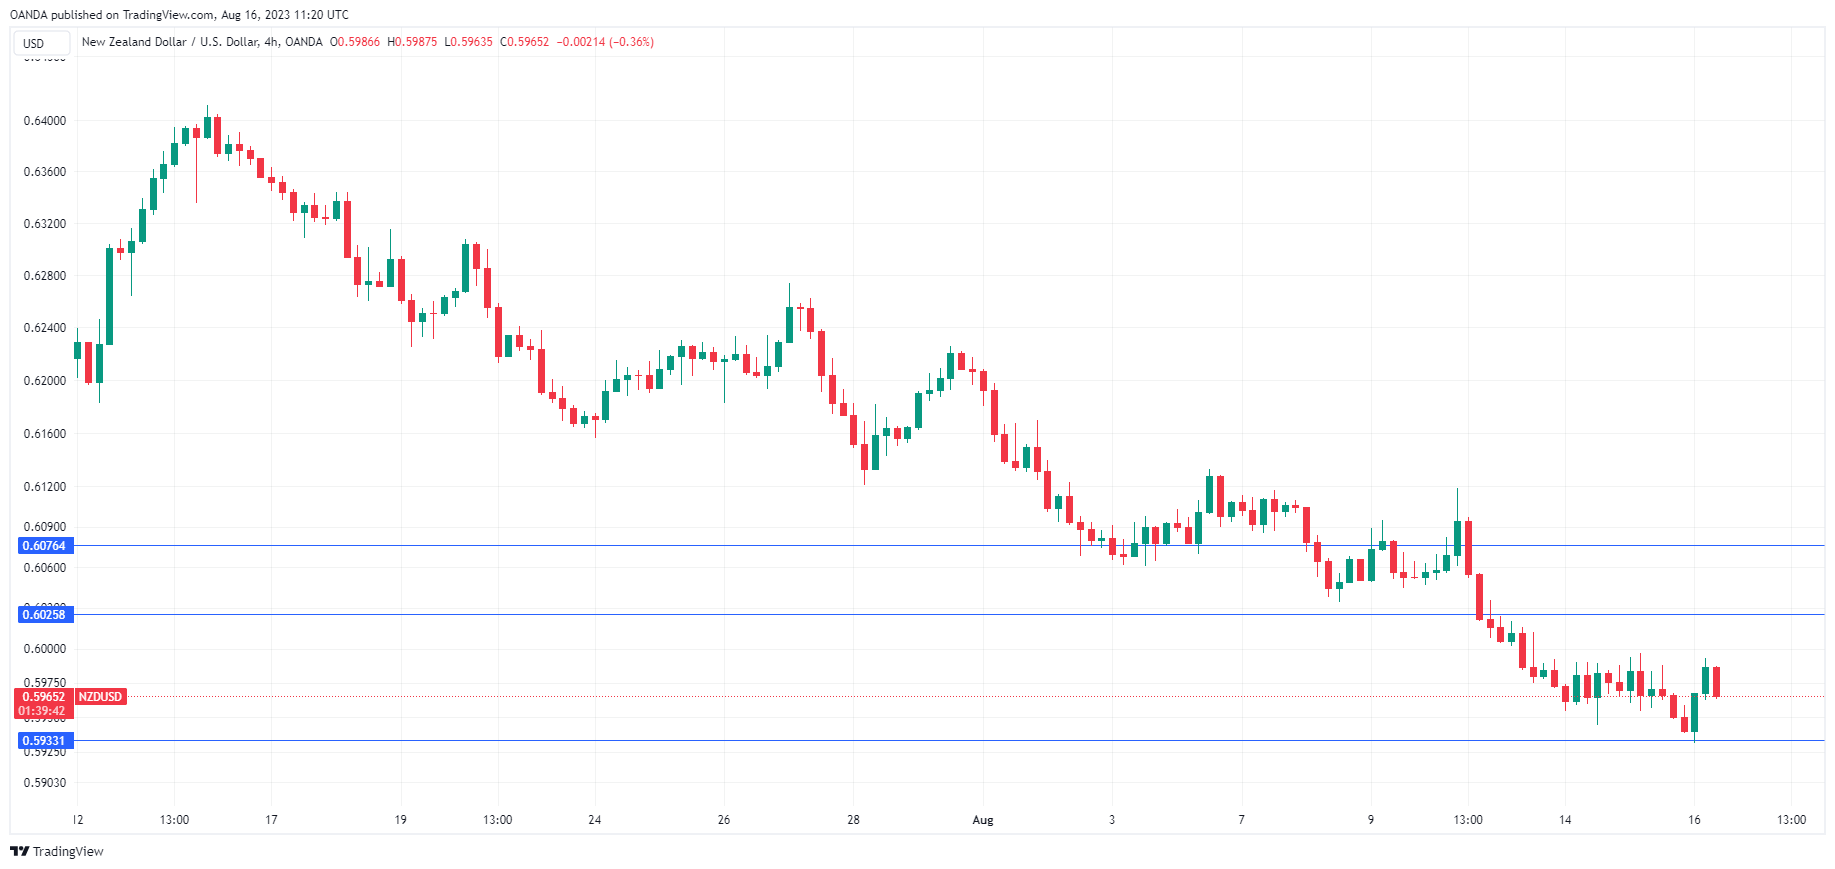
The New Zealand dollar is in positive territory on Wednesday in the aftermath of the Reserve Bank of New Zealand’s decision to maintain interest rate levels. In the European session, NZD/USD is trading at 0.5965, up 0.25%. NZD/USD rose as high as 0.5993 but has pared most of these gains.
It has been a bumpy road for the New Zealand dollar, which is coming off a six-day slide in which it declined 150 basis points. The Kiwi has the dubious honour of the worst-performing currency among the majors over the past month, sliding about 7.1%. The current downswing has been driven by weak global demand and concerns over China’s economy, which is experiencing deflation.
RBNZ holds rates but says further rate hikes remain an option
The RBNZ opted to pause for a second straight time, leaving the cash rate at 5.5%. This decision was expected, but the New Zealand dollar managed to rise about 0.66% after the decision, before surrendering much of those gains.
The RBNZ noted that inflation, currently at 6%, is expected to fall below the upper band of the 1%-3% target by the third quarter of 2025, but that will require rates to remain restrictive “for some time”. The central bank warned that “in the near term there is a risk that activity and inflation measures do not slow as much as expected.” The Bank also said that headline inflation and inflation expectations have been in decline, but core CPI remains too high.
Is the RBNZ done raising rates? A second-straight pause is a promising sign and many economists believe that rates have peaked, with rate cuts coming sometime next year. The RBNZ continues to forecast a peak at the current rate of 5.5% but said that there is an upside risk of one more hike, before cutting rates in 2025.
NZD/USD Technical
- NZD/USD tested support at 0.5933 earlier today. Below, there is support at 0.5833
- 0.6026 and 0.6076 are the next resistance lines
BoE Unlikely to Stop Hiking as UK Inflation Remains High
Inflationary pressures in the UK are easing, although they remain the highest among the G7 countries, as sellers are in no hurry to cut prices.
UK CPI fell 0.4% in July (-0.5% expected), the first decline since January. The year-over-year price growth rate fell to 6.8%, the lowest since February 2022. The Retail Price Index last month was 9.0% higher than a year before, slowing to single digits for the first time since March 2022.
Core inflation remained at 6.9% y/y, just 0.2 percentage points below the peak two months earlier.
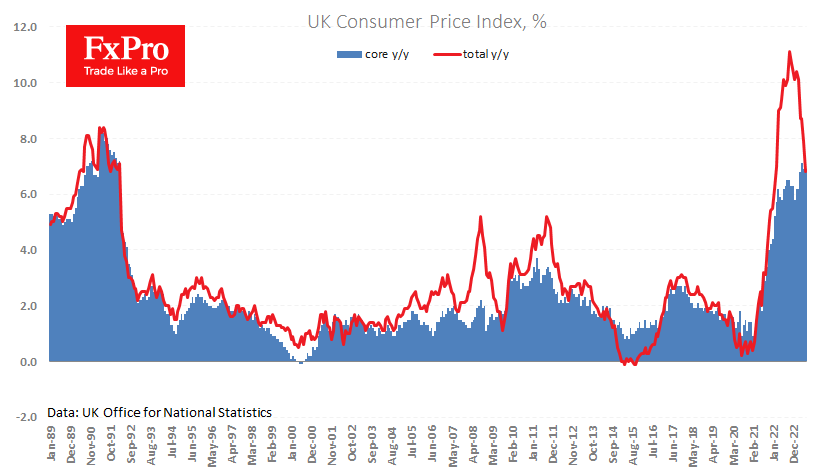
These latest price data are above market expectations and higher than those of the other G7 countries, which puts the most significant pressure on the Pound’s purchasing power. Such figures will unlikely stop the Bank of England from raising interest rates.
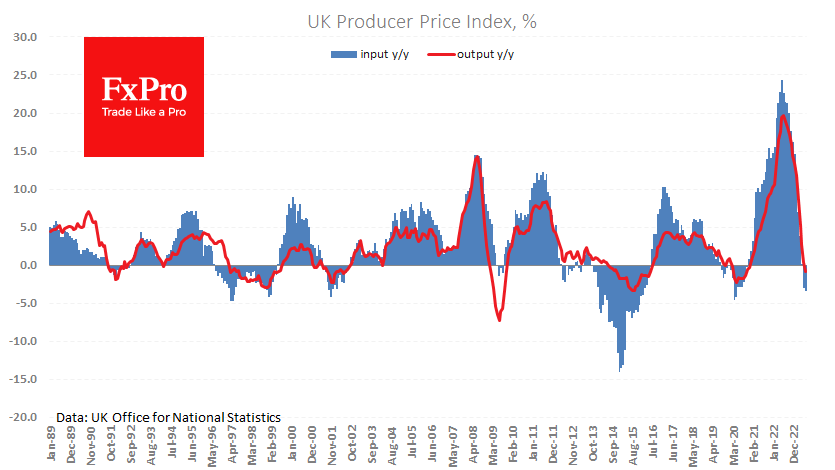
Meanwhile, producer prices are falling at an accelerating rate. Input Producer Price Index fell 0.4% in July and is now at -3.3% y/y, the lowest since May 2020. Output PPI was 0.8% lower than 12 months ago.
Producer prices are under pressure after commodities. However, a tight labour market and elevated inflationary pressures in the services sector keep inflation higher than the central bank would like.
Cooling the economy through recession and rising unemployment is a desirable quick fix in this environment. But it is politically unpalatable and can quickly have a knock-on effect on the economy.
The Bank of England has not yet reached the peak of interest rates, which we estimate to be around 6%. Given the entrenched inflationary processes, it will also have to keep rates at their peak for longer. This is good news for the Pound, which has had a chance to lick its wounds after a month of decline against the USD.
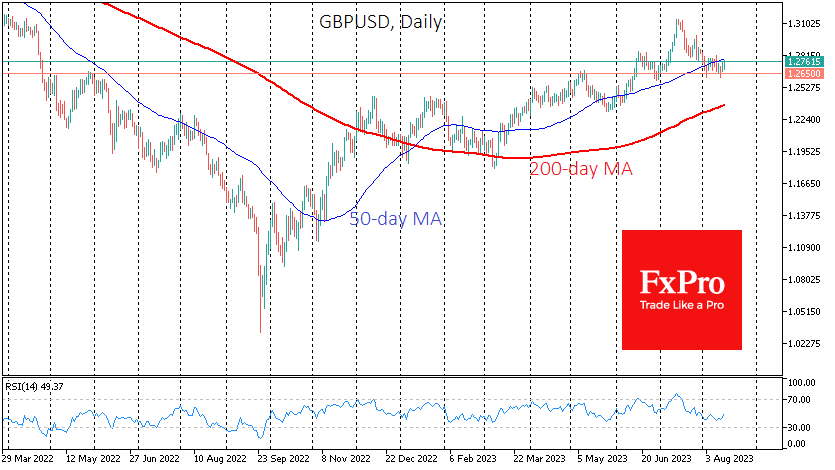
The technical picture for the GBPUSD is also interesting. The recent reversal in the pair’s growth from 1.2650 based on pro-inflationary data from the labour market and consumer prices could be both a temporary respite and a turning point. The bulls’ ability to push the pair above 1.2800 could attract more buyers to the GBP. A return below 1.2650 this week would signal a new round of weakness.
EURGBP Reconsiders Its Bullish Mission
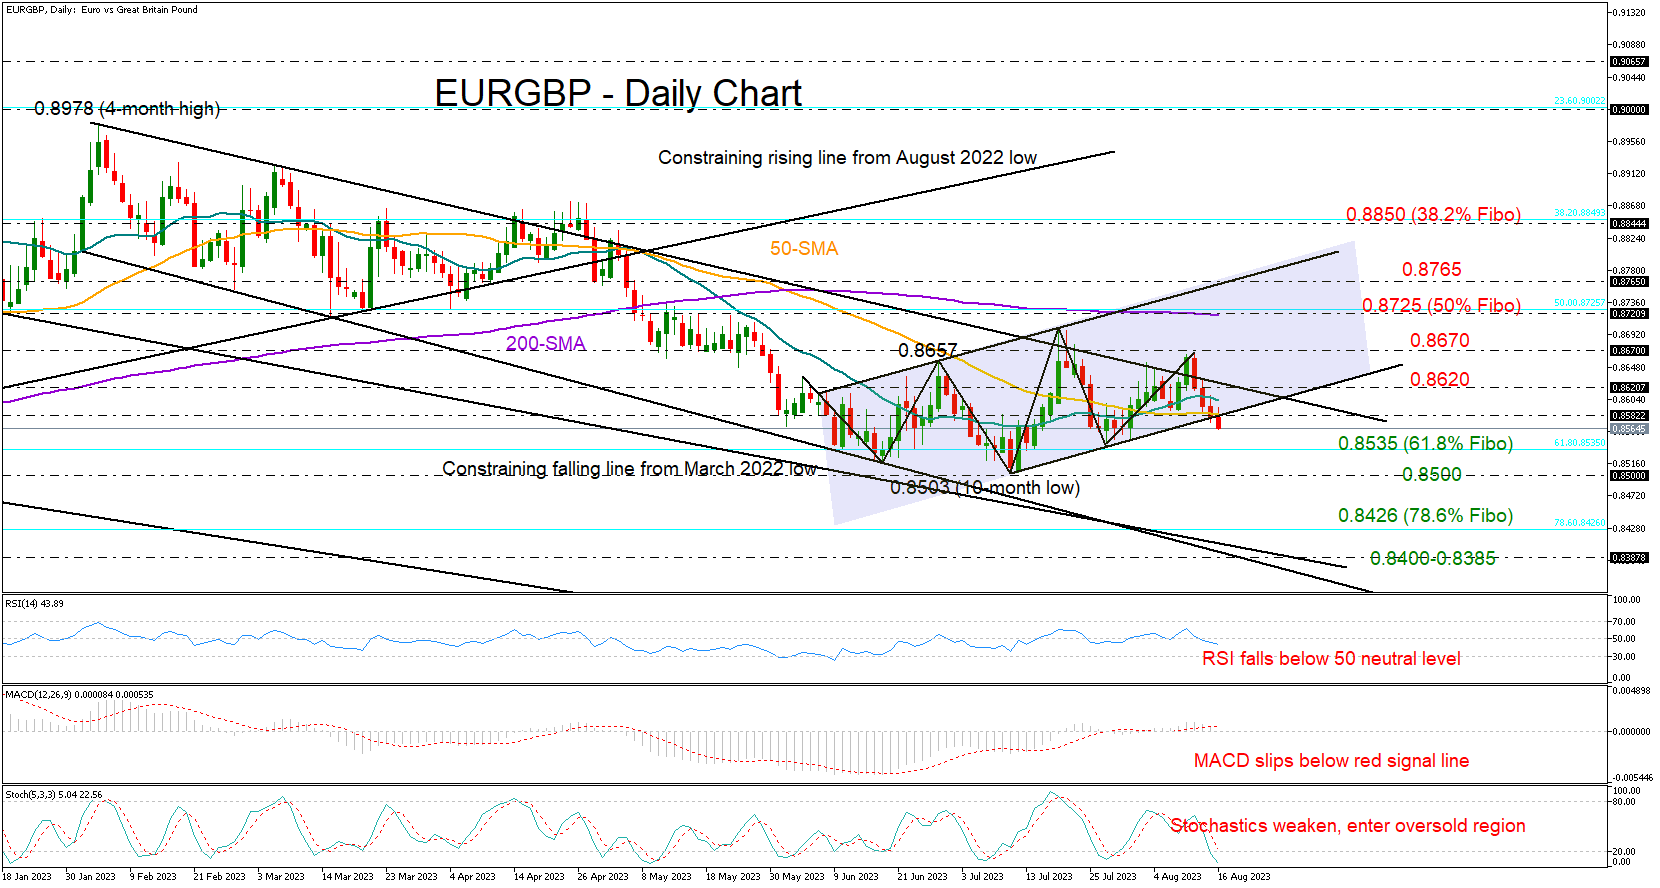
EURGBP could not find enough buyers to print a new higher high above July’s peak of 0.8700 last week, pausing its latest upleg lower at 0.8668.
Unfortunately, the bears are currently trying to push the price below the short-term bullish channel and the 50-day SMA, which previously prevented a drop below 0.8585.
The downward trajectory in the momentum indicators is endorsing the negative momentum in the price, though only a decisive close below the previous low and the 61.8% Fibonacci retracement of the 0.8200-0.9249 upleg at 0.8535 would shatter hopes for a bull market. If that proves to be the case, the door will open for the 0.8500 floor, a break of which is expected to squeeze the price towards the 0.8400-0.8425 constraining area.
Should the price return above the 50-day SMA, buyers may wait for a sustainable rally above the 0.8620-0.8670 region and out of the broad bearish channel before targeting the 200-day SMA and the 50% Fibonacci level of 0.8725. A close higher could face a new challenge at the upper boundary of the short-term bullish channel at 0.8765. If the bulls knock down that wall too, rekindling optimism for an upside reversal, the price could advance towards the 38.2% Fibonacci of 0.8850.
Summing up, EURGBP seems unable to power its mission for an upside reversal above 0.8700. A close below 0.8535 would eliminate hopes for a continuation higher.
USD/CAD Analysis: The Loonie Strengthens amid Rising Inflation
Yesterday, data from Statistics Canada was published, which testified to the stability of inflation in the country: the rise in prices for the month amounted to +0.6% (+0.3% was expected).
This increased the likelihood that the Bank of Canada will raise the rate yet again. Now it is at a maximum for 22 years and is 5.0%.
As a result, USD/CAD is declining today after a volatile Tuesday.
Bullish arguments:
→ the price may be supported by the median line and the lower limit of the current ascending channel;
→ the price may be supported by the level of 1.34, which previously served as resistance;
→ support may continue to be provided by the level of 1.344.
Bearish arguments:
→ the price made a false breakout of the top on August 8;
→ resistance is provided by the psychological level at 1.35;
→ divergence on the RSI indicator;
→ the price is in the zone of a sharp fall in the rate recorded on June 1 — sellers can maintain control.
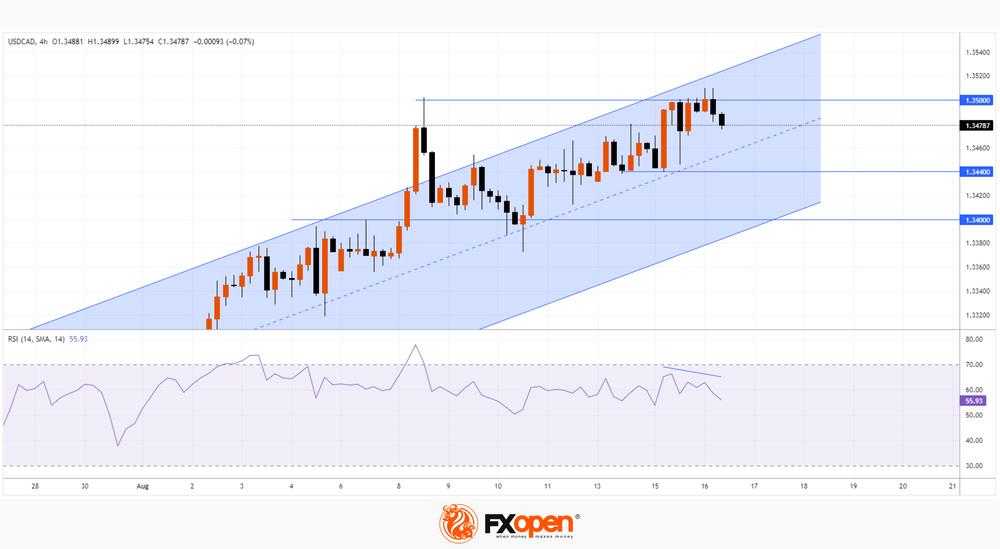
Since August 1, the USD/CAD rate has risen by more than 2.3%. In such conditions, a correction may be a fairly natural scenario.
This article represents the opinion of the Companies operating under the FXOpen brand only. It is not to be construed as an offer, solicitation, or recommendation with respect to products and services provided by the Companies operating under the FXOpen brand, nor is it to be considered financial advice.
AUD/USD Outlook: Larger Bears May Take a Breather as Daily Studies are Oversold
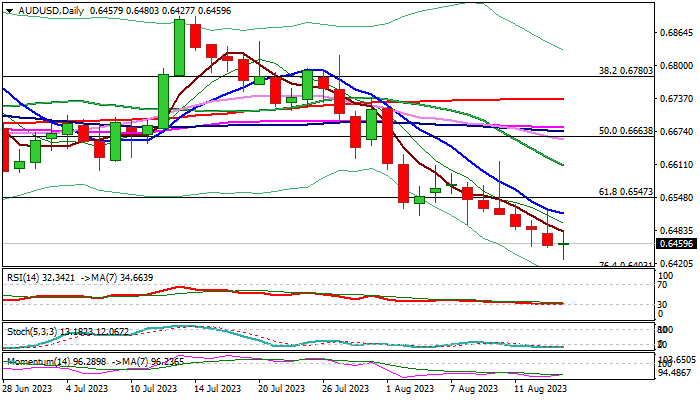
Wednesday’s Asian / European action was so far shaped in a long-legged Doji candle, signaling indecision, as oversold conditions on daily chart suggest some profit-taking after the pair was in a steep fall in past four weeks (down around 5%).
Bears faced headwinds from significant supports at 0.6463/58 (Fibo 61.8% of 0.5509/0.8007 / May 31 spike low), which offer solid ground for consolidation / limited correction.
Larger picture remains firmly bearish, with fresh pressure on Aussie dollar coming from stronger than expected US retail sales, which add to signals that the US economy is in a good shape and possible further rate hikes won’t be harmful that keeps the US dollar underpinned.
Markets also await release of FOMC July’s policy meeting, due later today, with prevailing expectations that the central bank will keep hawkish stance over monetary policy.
Daily studies are firmly bearish and along with negative fundamentals, point to mild correction before larger bears resume.
Falling 10DMA offers initial resistance at 0.6516, which should ideally cap, with extended upticks not to exceed broken Fibo level at 0.6547 (61.8% of 0.6170/0.7157) to keep bears intact.
Res: 0.6481; 0.6547; 0.6616; 0.6661.
Sup: 0.6427; 0.6403; 0.6272; 0.6170.
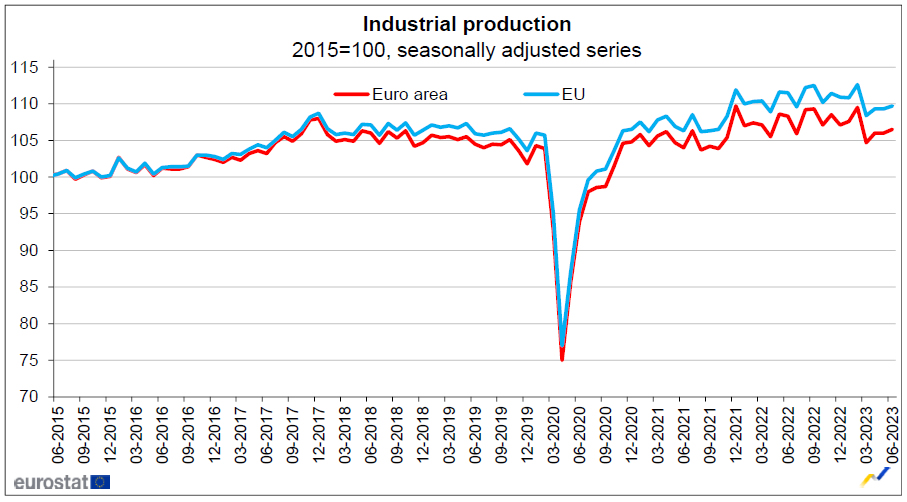
Eurozone industrial production up 0.5% mom on energy
Eurozone industrial production rose 0.5% mom in June, well above expectation of 0.1% mom. Production of energy grew by 0.5%, while production of durable consumer goods fell by -0.1%, capital goods by -0.7%, intermediate goods by -0.9% and non-durable consumer goods by -1.1%.
EU industrial production rose 0.4% mom. Among Member States for which data are available, the highest monthly increases were registered in Ireland (+13.1%), Denmark (+6.3%) and Lithuania (+3.2%). The largest decreases were observed in Sweden (-5.3%), Finland and Malta (both -3.3%) and Belgium (-3.0%).
The Crypto Market Starts Moving Down
Market picture
The crypto market lost 1.2% over the past 24 hours to $1.156 trillion. This is a downward move, albeit small, after a long consolidation. Larger currencies have seen less pressure than smaller altcoins. Rising US Treasury yields put pressure on riskier assets and attracted some capital. Thus, Bitcoin lost 0.7% on the day, Ethereum – 1%, and altcoins lost from 6.3% (Solana) to 1.1% (Tron).
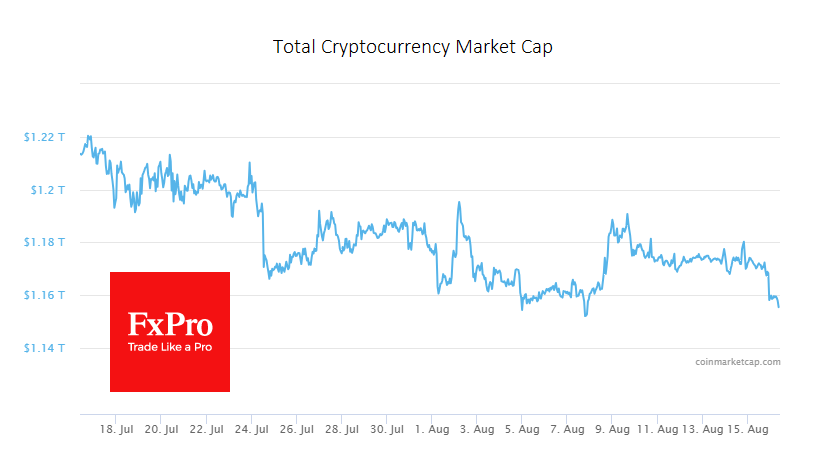
According to The Block, bitcoin volatility fell to a record low, with BTC’s 30-day volatility on an annualised basis dropping to 15.5% from 61.4% last year. Glassnode also notes the extreme level of apathy and exhaustion amid the drop in volatility.
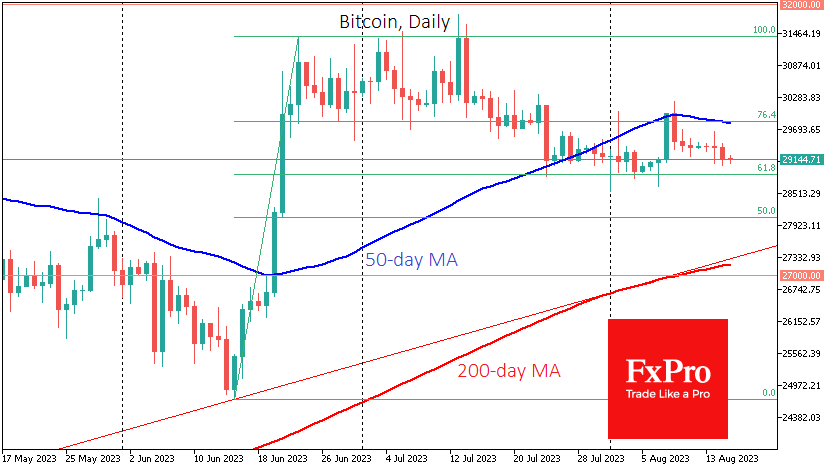
Bitcoin approached $29.0K after a prolonged consolidation of around $29.4K. Technically, the sell-off in Bitcoin could gain momentum on a break below $28.9K. In this case, the price could quickly fall to $28.0K or even $27.2K.
News background
Kevin Kelly, Delphi Digital co-founder and head of research, sees signs of an early bull rally in the crypto market. He believes BTC could reach new all-time highs around the end of 2024, following its halving.
Crypto-related activity may pose new and complex risks to the US banking system that are difficult to assess fully. This is the conclusion of the US Federal Deposit Insurance Corporation’s (FDIC) annual review.
UK-based Jacobi Asset Management has launched Europe’s first spot bitcoin ETF. The instrument is listed on Euronext Amsterdam and includes a renewable energy certification solution.
New Zealand cryptocurrency exchange Dasset has closed customer access to assets and announced it will begin liquidation after six years of operation. According to media reports, users had been trying unsuccessfully to withdraw funds from the platform for months.
NZDUSD Bulls React But Probably Still Far from a Reversal
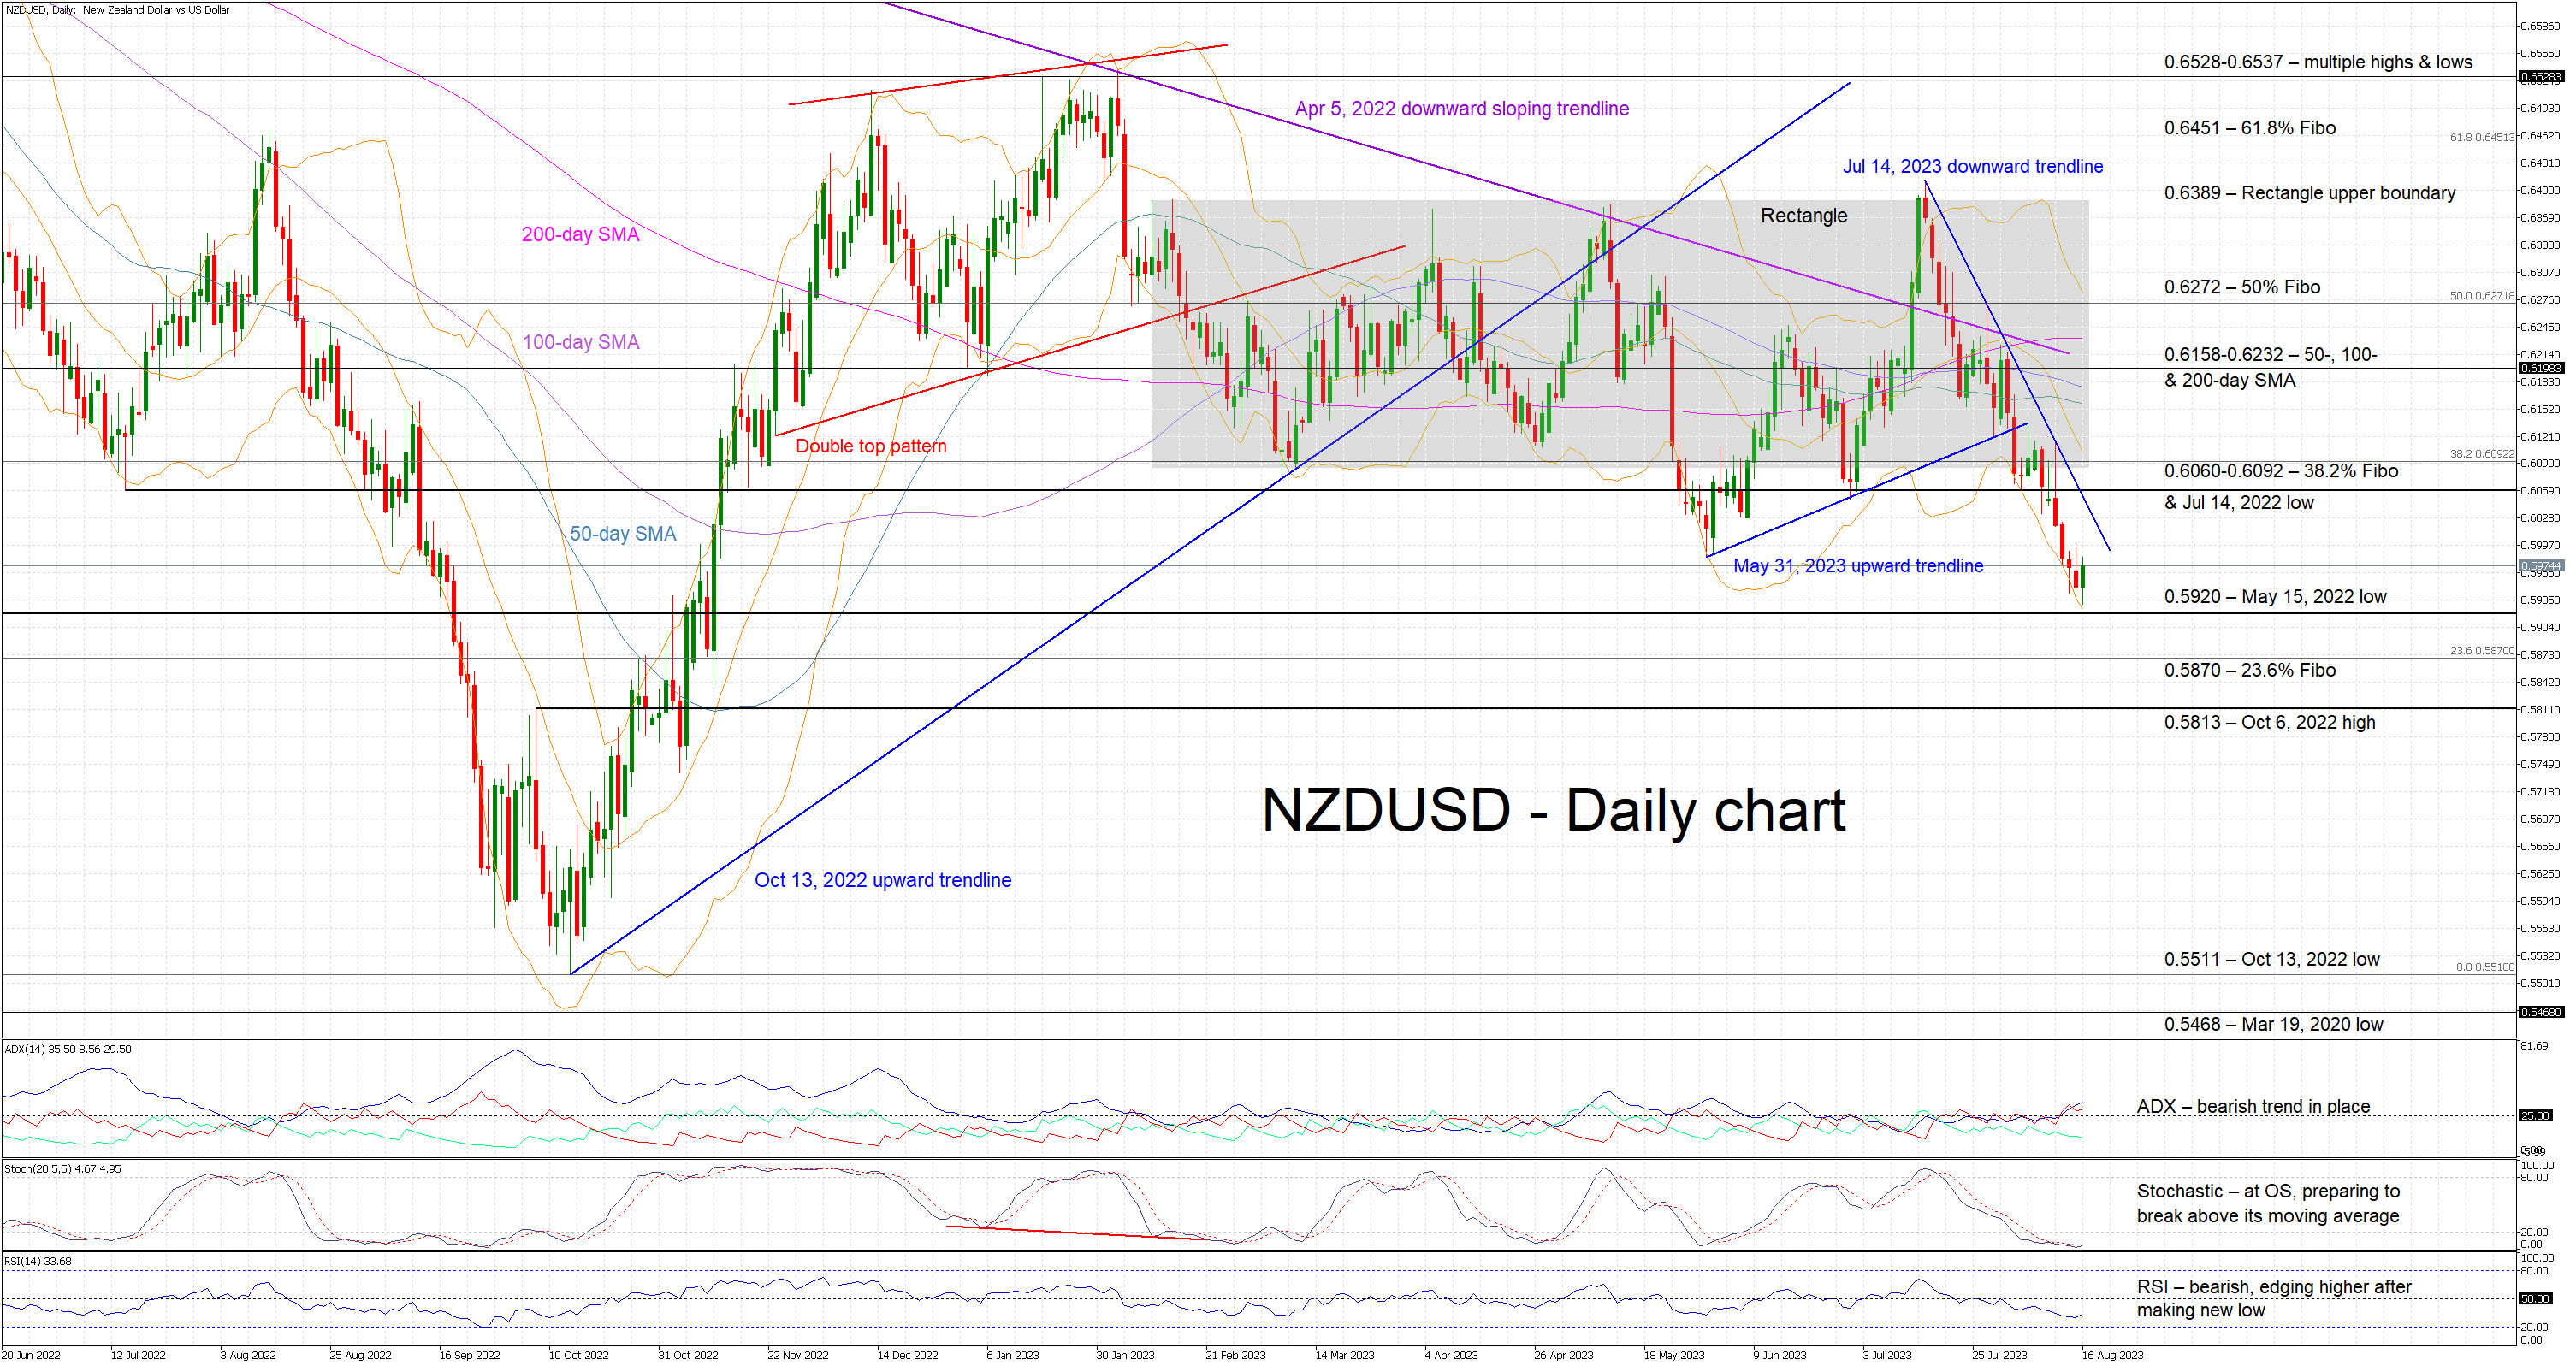
NZDUSD is finally edging higher today following four consecutive red candles and after registering a new 2023 low. It appears to be the bulls’ first serious attempt to put a stop to the bearish breakout from the rectangle that has been in place since February 2023. They could potentially threaten the aggressive July 14, 2023 downward sloping trendline that NZDUSD has actually been religiously respecting.
The momentum indicators continue to reflect the recent downleg from the mid-July NZDUSD highs. However, there are some early signs that a reversal could be on the cards. More specifically, the RSI is edging higher after recording its lower print since the September 2022 sell-off. Similarly, the stochastic oscillator is stuck at the bottom of its oversold territory and is apparently preparing for a move higher. Should the Average Directional Movement Index (ADX) move back to a range-trading signal, then the market would probably be ripe for a proper rebound.
Should the bears ignore today’s green candle, they would try to record a new 2023 low and finally break the May 15, 2022 low at 0.5920. The door would then be open for both the 23.6% Fibonacci retracement of the April 5, 2022 – October 13, 2022 downtrend at 0.5870 and the October 6, 2022 high at 0.5813.
On the flip side, the bulls are keen on building upon today’s move with first resistance coming at the July 14, 2023 trendline. Higher, the busy 0.6060-0.6092 range, defined by the 38.2% Fibonacci retracement and the July 14, 2022 low respectively, is critical from a short-term momentum perspective and it is the final step before pushing NZDUSD back inside the aforementioned rectangle.
To conclude, NZDUSD bulls are trying to react to the continued bearish pressure. However, the bears appear to be relaxed for as long as the July 14, 2023 trendline holds.
USDJPY Flat Near Intervention Zone
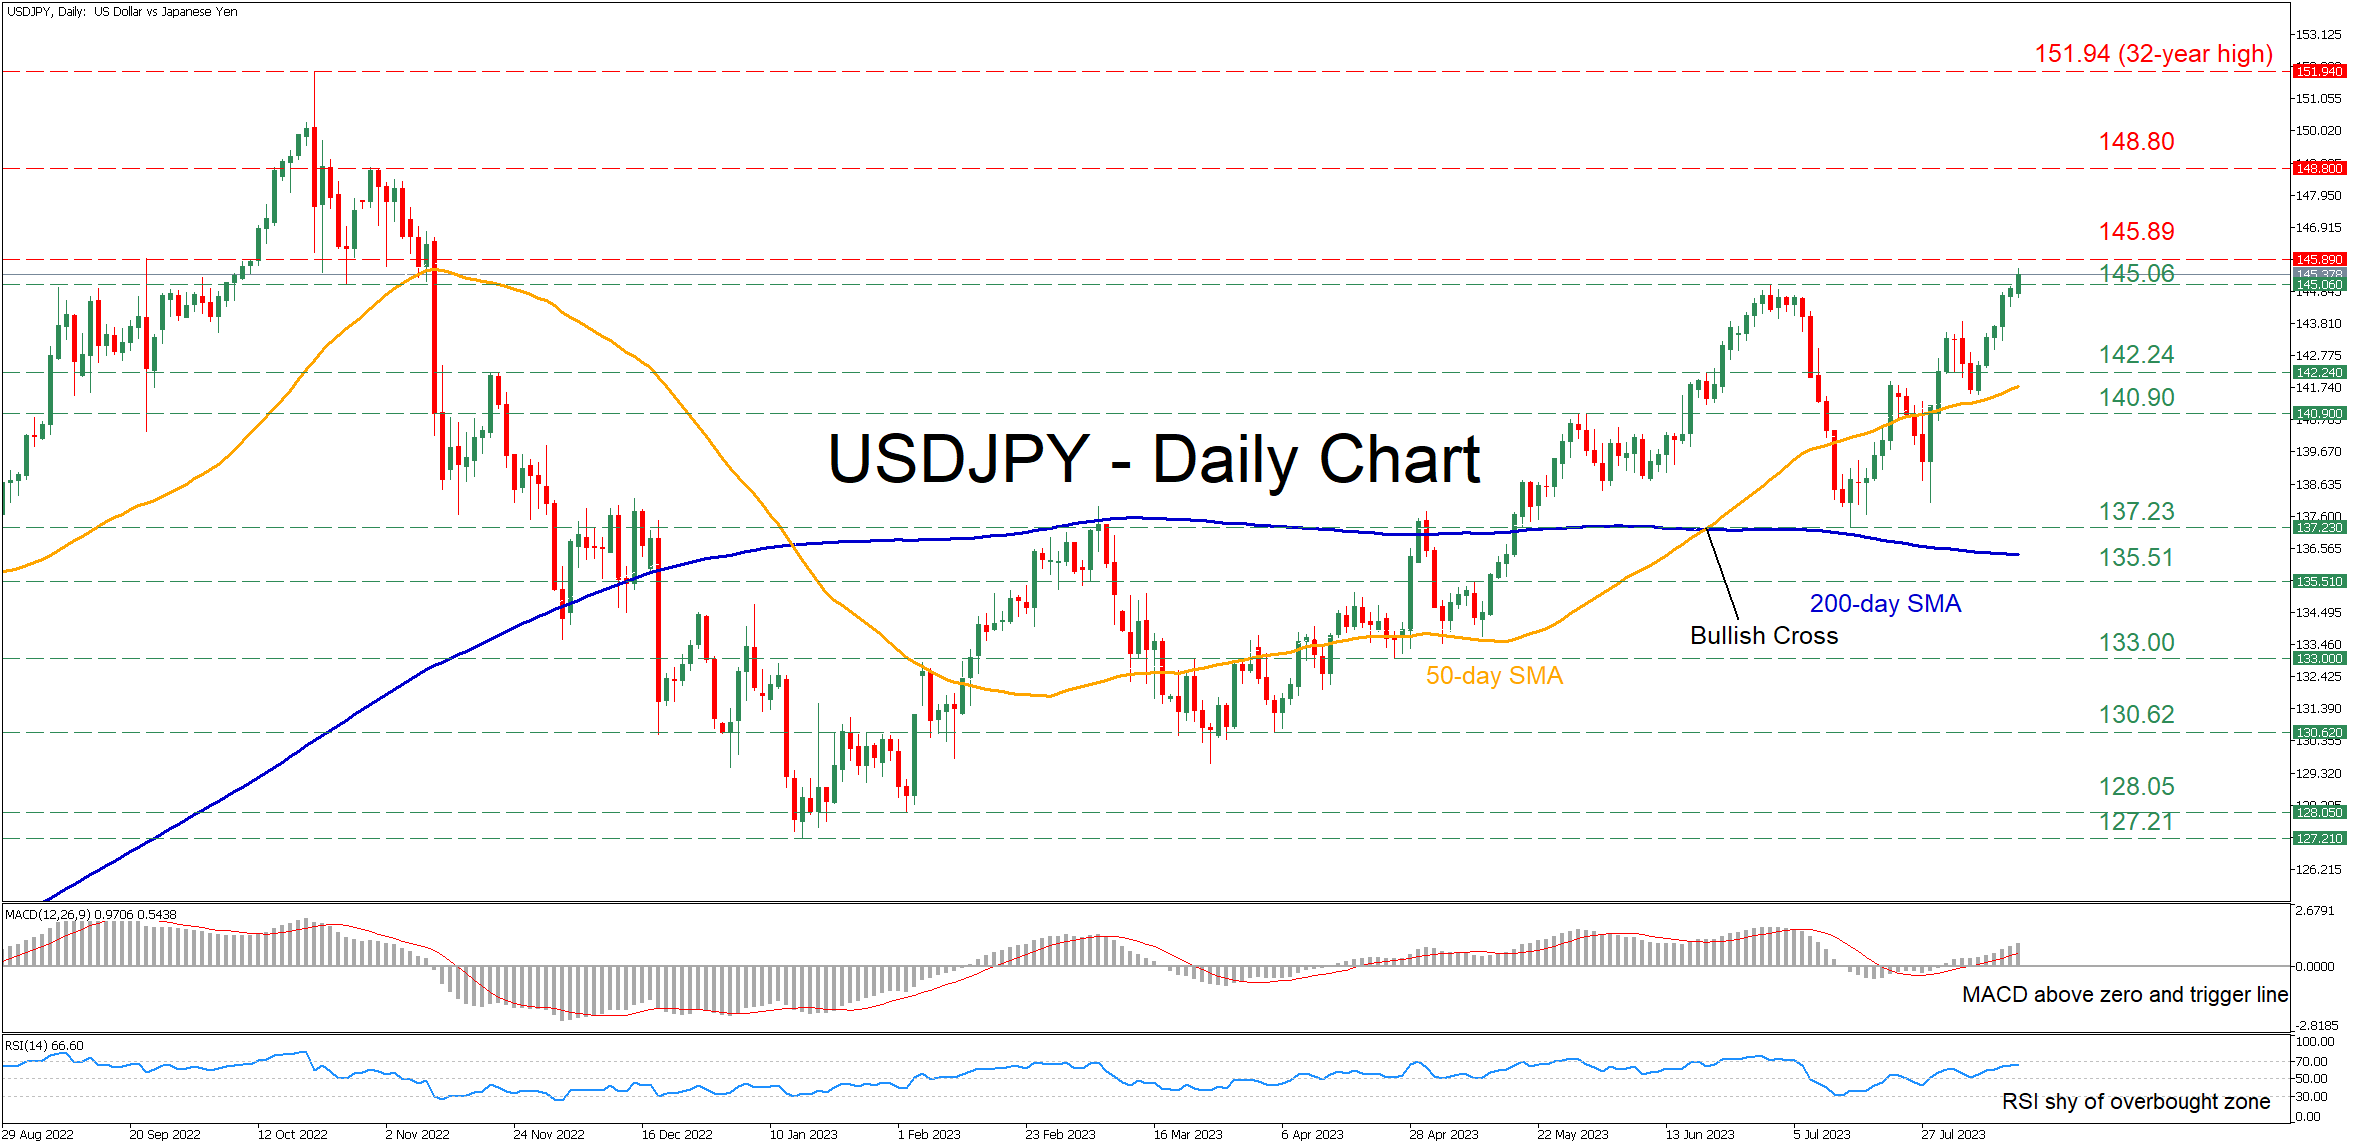
USDJPY has been storming higher in the short term, posting a fresh 9-month high of 145.85 on Tuesday before paring some gains. Undoubtedly, the pair has approached a critical technical region around where the first round of intervention by the Japanese authorities took place, thus traders should be cautious as the probability of an impending correction has increased.
The momentum indicators currently suggest that bullish forces are intensifying. Specifically, the MACD is strengthening above zero and its red signal line but has not yet reached June highs, while the RSI is hovering deep in the positive zone after failing to pierce through the 70-overbought mark.
If buying interest persists, the price could initially face the September 2022 high of 145.89. Conquering this barricade, the bulls could aim at the 148.80 resistance territory observed in November 2022. A violation of that zone could set the stage for the 32-year high of 151.94.
On the flipside, should the rally lose steam and the price reverse lower, the previous 2023 high of 145.06 could prove to be the first barrier for the bears to clear. Piercing through that region, the pair might test 142.24 ahead of the 140.90 hurdle, which has acted both as resistance and support in the past. Further retreats could then cease at the July low of 137.23.
Overall, USDJPY seems to be stuck in a steep uptrend, but the price has reached levels that in previous occasions the Japanese policymakers were willing to protect. Will this scenario play out again?