Sample Category Title
AUD/USD Daily Report
Daily Pivots: (S1) 0.6400; (P) 0.6440; (R1) 0.6464; More...
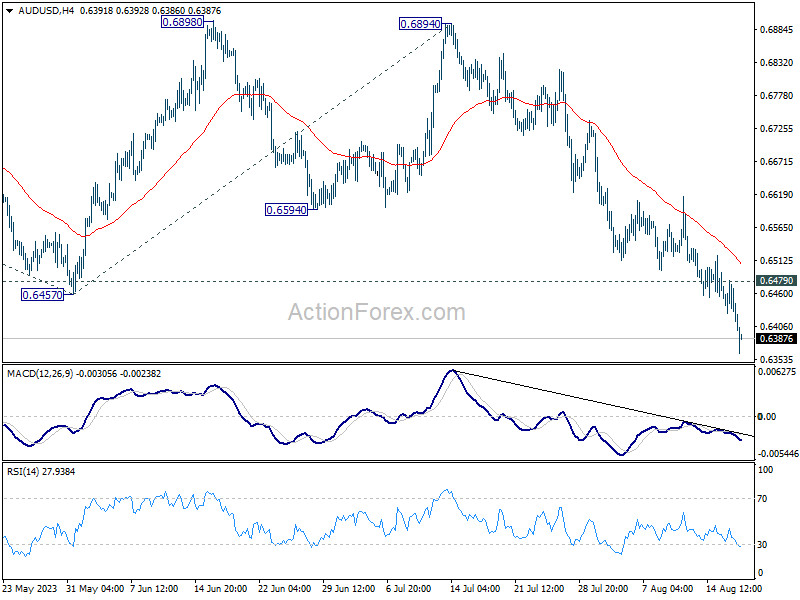
Intraday bias in AUD/USD remains on the downside at this point, as decline from 0.7156 extends. Next target is 100% projection of 0.7156 to 0.6457 from 0.6894 at 0.6195. On the upside, above 0.6479 minor resistance will turn intraday bias neutral and bring consolidations first, before staging another fall.
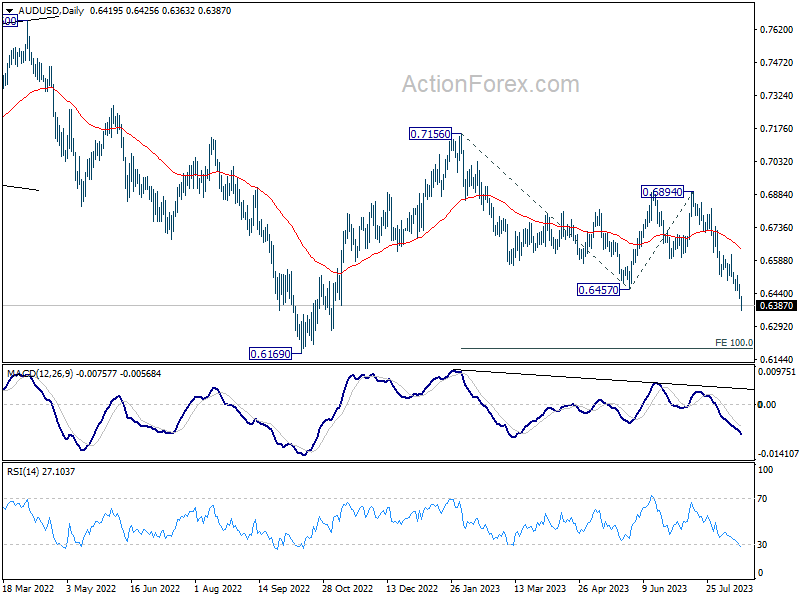
In the bigger picture, the down trend from 0.8006 (2021 high) could still be in progress. Break of 0.6457 support affirms this bearish case. Further break of 0.6169 will target 61.8% projection of 0.8006 to 0.6169 to 0.7156 at 0.6021. This will now remain the favored case as long as 0.6894, in case of strong rebound.
Australian Dollar Dives After Poor Employment Data and Risk Off Sentiment
Australian Dollar faced a discernible decline during today's Asian trading session, continuing its broad-based selloff throughout the week. The catalyst behind Aussie's downturn can be traced back to the underwhelming employment figures released from Australia. Additionally, a prevailing risk-averse sentiment, inherited from US markets overnight, further burdened the risk-sensitive currency. Following closely, New Zealand Dollar emerges as the session's second-weakest currency. Surprisingly, despite market's cautionary mood, Japanese Yen finds no solace and positions itself as the third-worst performer.
On the other hand, Dollar is showing signs of rejuvenation, bolstered by uptick in benchmark yields. Nonetheless, it's only managed to secure a spot behind the Sterling, making it the week's second-strongest currency thus far. Recent market movements hint at a changing dynamic for Euro and Swiss Franc, with both currencies facing downward pressure, especially against Dollar and Pound. Yet, it's worth noting that Euro still manages to gain a substantial lead over laggards like the Aussie and Kiwi.
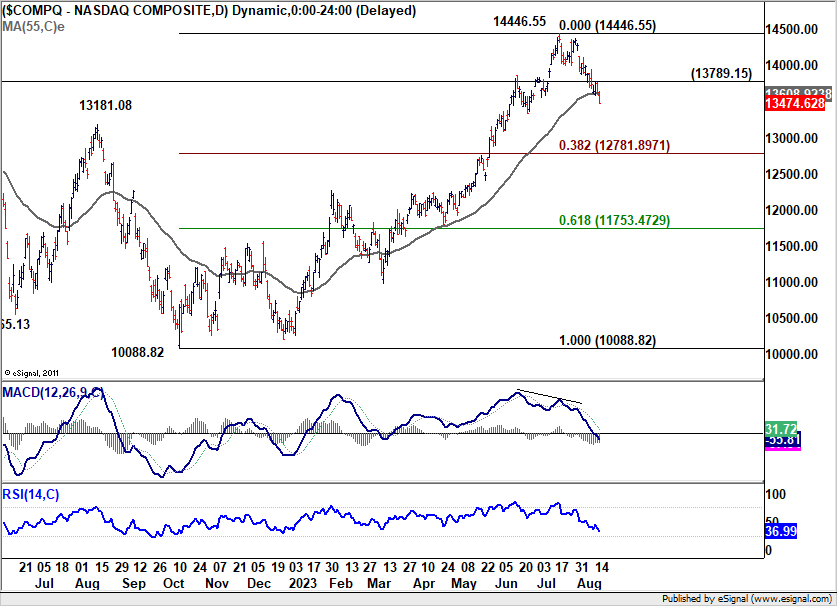
Technically, NASDAQ broke through 55 D EMA (now at 13608.92) overnight to close at 13474.62. The development now affirms that case that it's at least in correction the whole up trend from 10088.82 (2022 low). Further decline is expected as long as 13789.15 resistance holds. Next target is 38.2% retracement of 10088.82 to 14446.55 at 12781.89. The prevailing uncertainty lies in the trajectory of the sell-off and its ripple effects on currency markets amidst the risk-averse sentiment.
In Asia, at the time of writing, Nikkei is down -0.32%. Hong Kong HSI is down -0.12%. China Shanghai SSE is up 0.01%. Japan 10-year JGB yield is up 0.0177 at 0.650. Overnight, DOW dropped -0.52%. S&P 500 dropped -0.76%. NASDAQ dropped -1.15%. 10-year yield rose 0.037 to close at 4.258.
Hawkish tilt evident in FOMC minutes, yet rate hike skepticism remains
The minutes from FOMC meeting on July 25-26 signal a clear division within the committee regarding the path of future monetary tightening, with a slight inclination towards a hawkish stance.
Despite this, market anticipation for immediate rate adjustments remains tepid. Fed fund futures indicate an 86.5% chance that Fed will maintain the status quo in September, with less than 50% probability of a rate hike by year-end.
On the stock front, NASDAQ felt the heat, declining by 1.15%, possibly reacting to Fed's deliberations.
Within the minutes, one point was underscored: "With inflation still well above the Committee's longer-run goal and the labor market remaining tight, most participants continued to see significant upside risks to inflation."
Yet, counterpoints highlighted potential economic vulnerabilities and concerns about unemployment, with some members noting, "there continued to be downside risks to economic activity and upside risks to the unemployment rate."
Additionally, a number of participants judged that risks to achieve inflation target "had become more two sided", and wanred of the risk of "inadvertent overtightening of policy against the cost of an insufficient tightening."
Australian employment down -14.6k, but hours worked continue to rise
Australia witnessed a contraction in employment by -14.6k in July, starkly missing expectations of a 15.2k growth. This decline was majorly attributed to a drop in full-time jobs by -24.2k, even as part-time employment saw an increase of 9.6k.
Unemployment rate rose from 3.5% to 3.7%, surpassing market anticipations which had pinned it at 3.6%. The participation rate also registered a dip, moving from 66.8% to 66.7%.
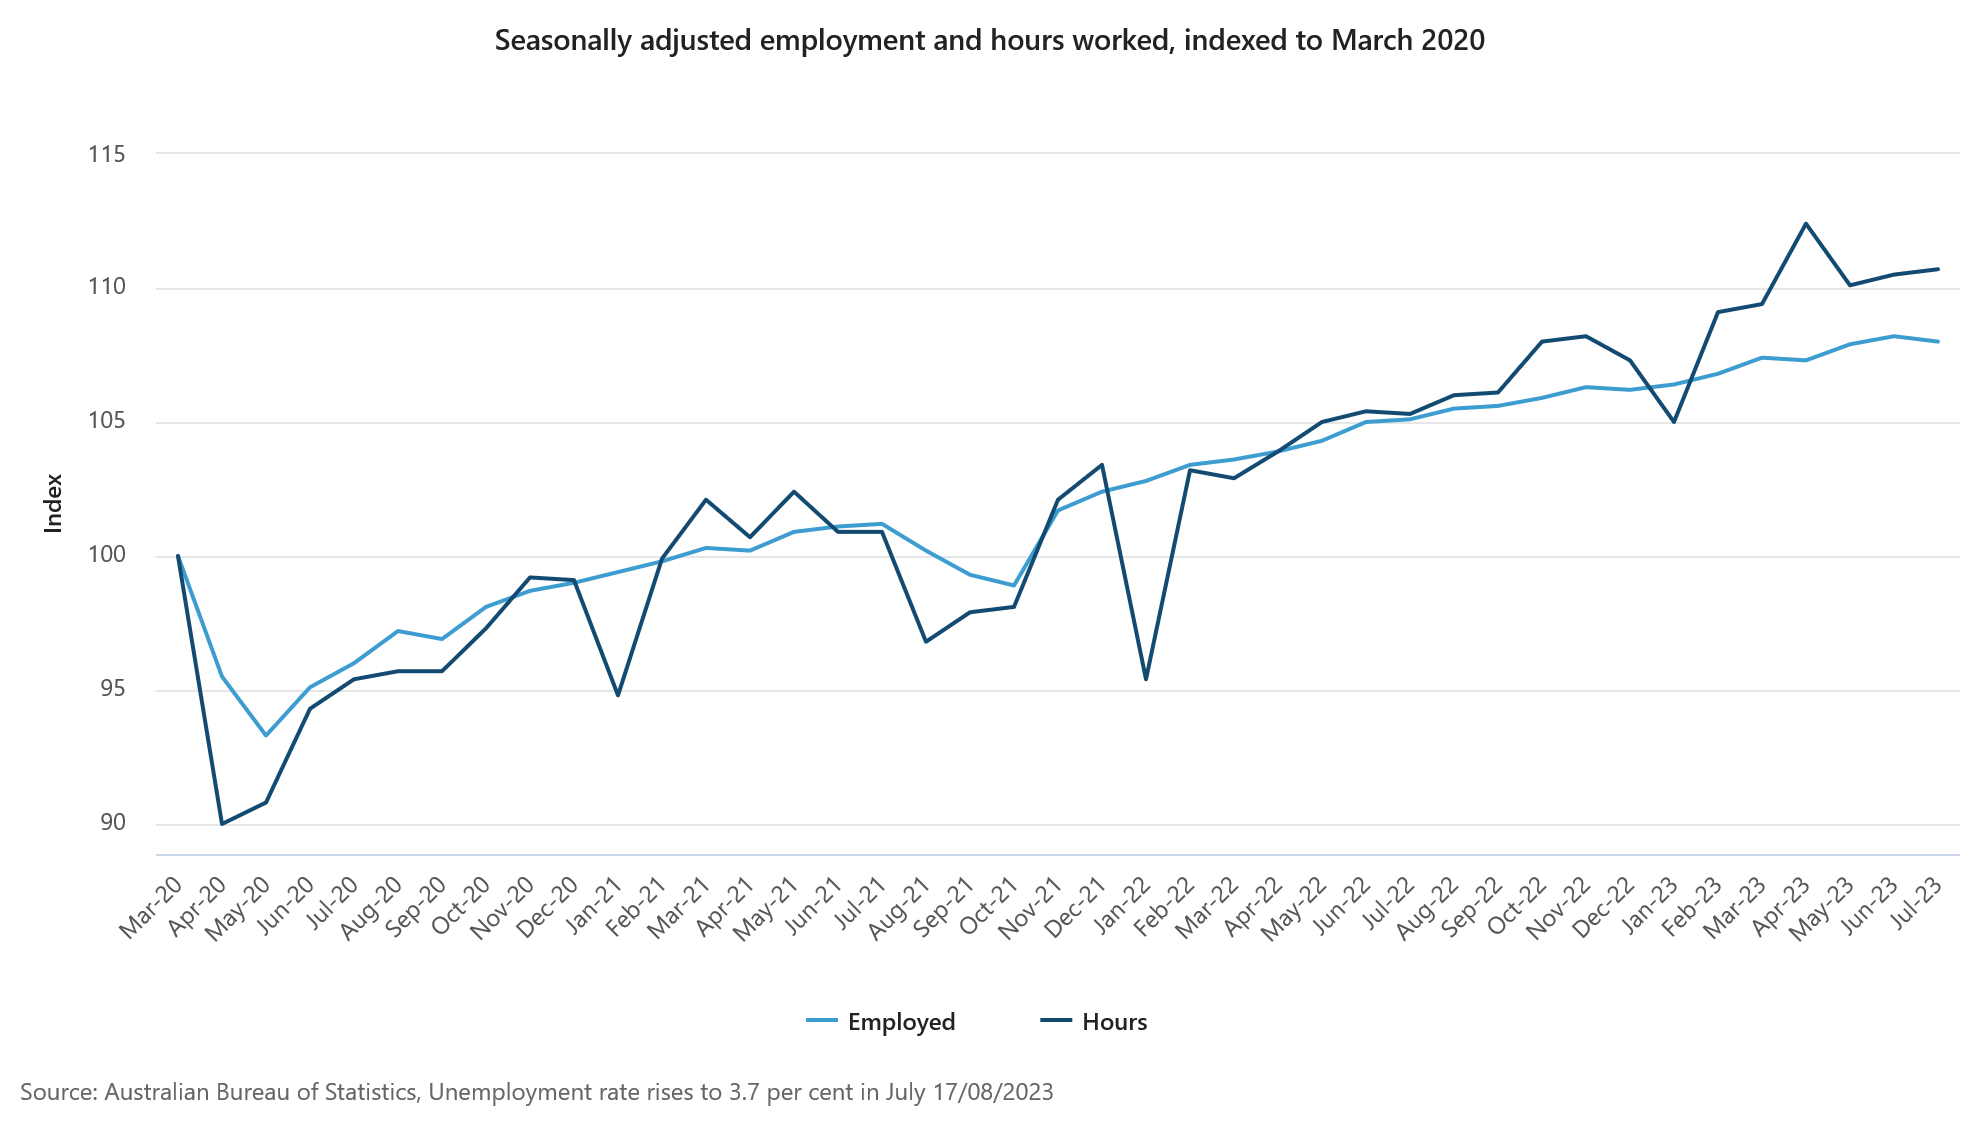
However, it wasn't all bleak. Monthly hours worked showed a marginal increase of 0.2% mom. Commenting on this aspect, Bjorn Jarvis, ABS head of labour statistics, observed, "The strength in hours worked shows that it continues to be a tight labour market."
Jarvis pointed out that hours worked have risen by an impressive 5.2% compared to July 2022, a significant outperformance relative to the 2.8% annual increase in employment.
He further noted, "The strength in hours worked over the past year, relative to employment growth, shows the demand for labour is continuing to be met, to some extent, by people working more hours."
RBNZ Orr: We don't feel a rush to be changing rates anytime soon
In a Bloomberg TV interview, RBNZ Governor Adrian Orr indicated that a forthcoming mild recession is the "bare minium" for New Zealand, as "demand has been well outstripping the pace of the supply capacity."
"We need to see subdued consumer spending, business investment and government constraints on spending, these are a critical part of the inflation process," he added.
Orr also reiterated that interest rate will need to stay high for a period of time, as "we don't feel a rush to be changing rates anytime soon."
"We believe if we stay where we are for long enough, inflation will be back inside the target band mid-next year and, and stay there," he added.
RBNZ projects OCR to peak at 5.59% in mid-2024, then retract slightly to 5.36% by early 2025. This suggests rate cuts might be off the table for about 18 months. Orr clarified that these figures are projections and "signal or constraint."
Japans' export contracts in Jul, shipments to China fell for 8th month
Japan Witnesses First Export Contraction in Over Two Years Amidst Declining Trade with China
Japan's exports experienced a dip of -0.3% yoy to JPY 8725B in July. This contraction is noteworthy as it breaks a growth streak that has lasted for over two years since February 2021.
Diving deeper into the data, while shipments to US and Europe saw a positive trajectory with respective rises of 13.5% yoy and 12.4% yoy, the trade dynamics with China narrated a different story.
Exports to China, Japan's primary trading ally, plummeted by -13.4%, marking the steepest decline since January. Notably, this reflects an ongoing trend with shipments to China diminishing for the eighth consecutive month, subsequent to a -10.9% yoy drop in June.
On the import front, Japan registered a decline of -13.5% yoy to JPY 8804B. This marks the fourth consecutive month of declining imports and is the most significant dip since September 2020. The downturn can be partly attributed to the decreasing commodities prices.
With imports exceeding exports, trade balance for the month ended in a deficit of JPY -78.7B.
When observing the figures in seasonally adjusted terms, both exports and imports displayed a 2.0% mom rise, amounting to JPY 8460B and JPY 9018B respectively. Consequently, trade deficit widened slightly, reaching JPY -557B.
Looking ahead
Eurozone trade balance will be release in European session. US will release jobless claims and Philly Fed survey.
AUD/USD Daily Report
Daily Pivots: (S1) 0.6400; (P) 0.6440; (R1) 0.6464; More...
Intraday bias in AUD/USD remains on the downside at this point, as decline from 0.7156 extends. Next target is 100% projection of 0.7156 to 0.6457 from 0.6894 at 0.6195. On the upside, above 0.6479 minor resistance will turn intraday bias neutral and bring consolidations first, before staging another fall.
In the bigger picture, the down trend from 0.8006 (2021 high) could still be in progress. Break of 0.6457 support affirms this bearish case. Further break of 0.6169 will target 61.8% projection of 0.8006 to 0.6169 to 0.7156 at 0.6021. This will now remain the favored case as long as 0.6894, in case of strong rebound.
Economic Indicators Update
| GMT | Ccy | Events | Actual | Forecast | Previous | Revised |
|---|---|---|---|---|---|---|
| 22:45 | NZD | PPI Input Q/Q Q2 | -0.20% | 0.40% | 0.20% | 0.00% |
| 22:45 | NZD | PPI Output Q/Q Q2 | 0.20% | 0.80% | 0.30% | 0.20% |
| 23:50 | JPY | Trade Balance (JPY) Jul | -0.56T | -0.44T | -0.55T | -0.54T |
| 23:50 | JPY | Machinery Orders M/M Jun | 2.70% | 3.60% | -7.60% | |
| 01:30 | AUD | Employment Change Jul | -14.6K | 15.2K | 32.6K | 31.6K |
| 01:30 | AUD | Unemployment Rate Jul | 3.70% | 3.60% | 3.50% | |
| 04:30 | JPY | Tertiary Industry Index M/M Jun | -0.40% | -0.10% | 1.20% | 1.00% |
| 09:00 | EUR | Eurozone Trade Balance (EUR) Jun | 2.3B | -0.9B | ||
| 12:30 | USD | Initial Jobless Claims (Aug 11) | 240K | 248K | ||
| 12:30 | USD | Philadelphia Fed Manufacturing Survey Aug | -9.5 | -13.5 | ||
| 14:30 | USD | Natural Gas Storage | 35B | 29B |
Technical Outlook and Review
DXY:
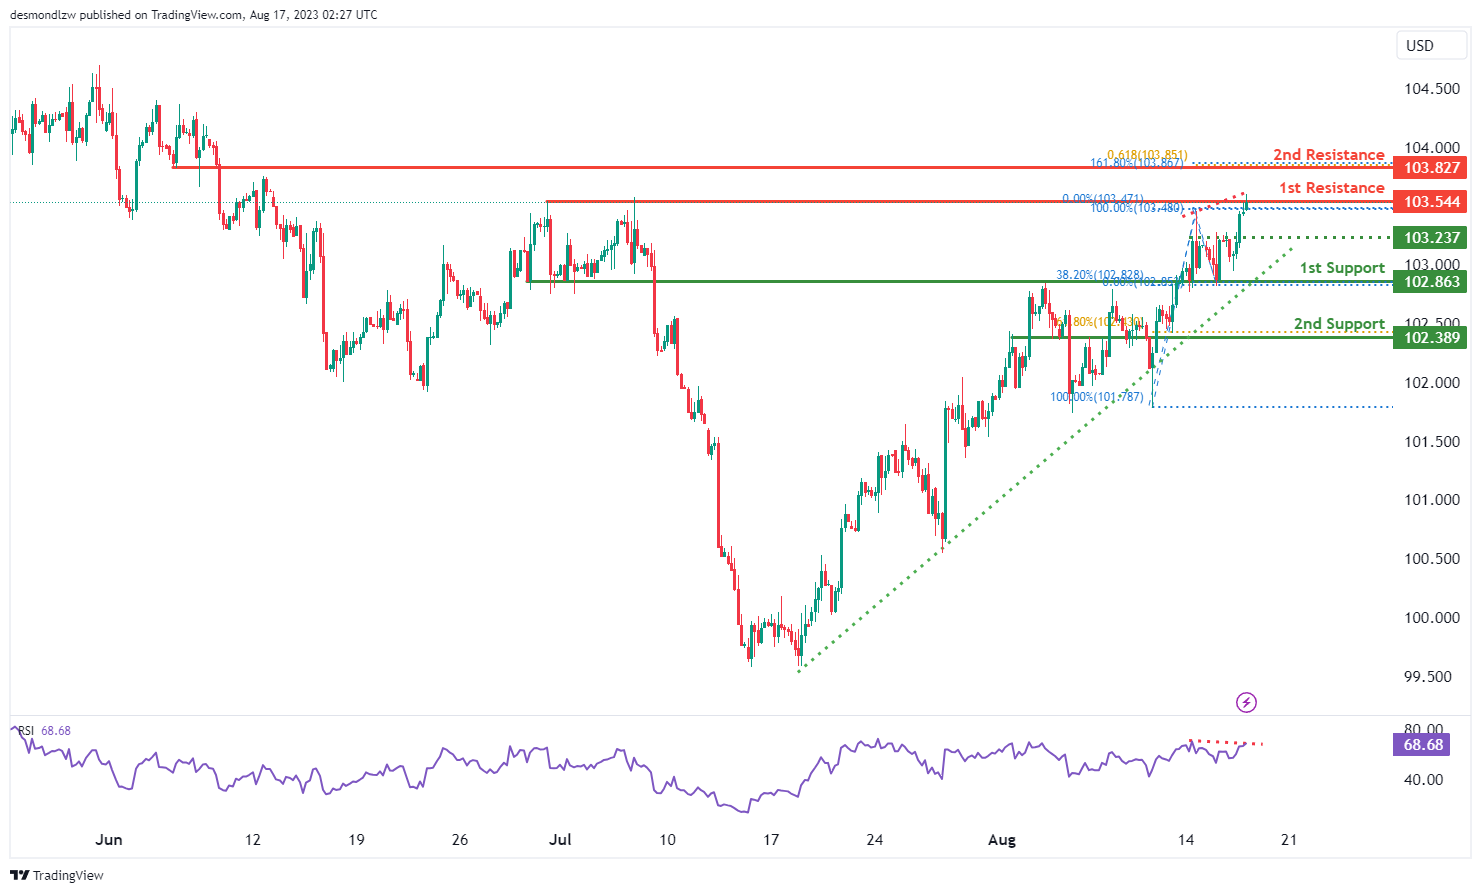
The DXY chart’s overall momentum is bullish, supported by its position above a significant ascending trend line, hinting at potential further bullish movement.
Considering this, there’s a possibility of a short-term decline towards the 1st support at 102.86 before a potential bounce, aiming for the 1st resistance at 103.54, noted for its multi-swing high resistance.
The 1st support at 102.86 gains strength as a pullback support, backed by the 38.20% Fibonacci Retracement, while the 2nd support at 102.38 acts as an overlap support, reinforced by the 61.80% Fibonacci Retracement.
On the flip side, the 2nd resistance at 103.82 represents a pullback resistance.
Additionally, the Relative Strength Index (RSI) testing a major resistance level implies a potential upcoming reversal in price movement.
EUR/USD:
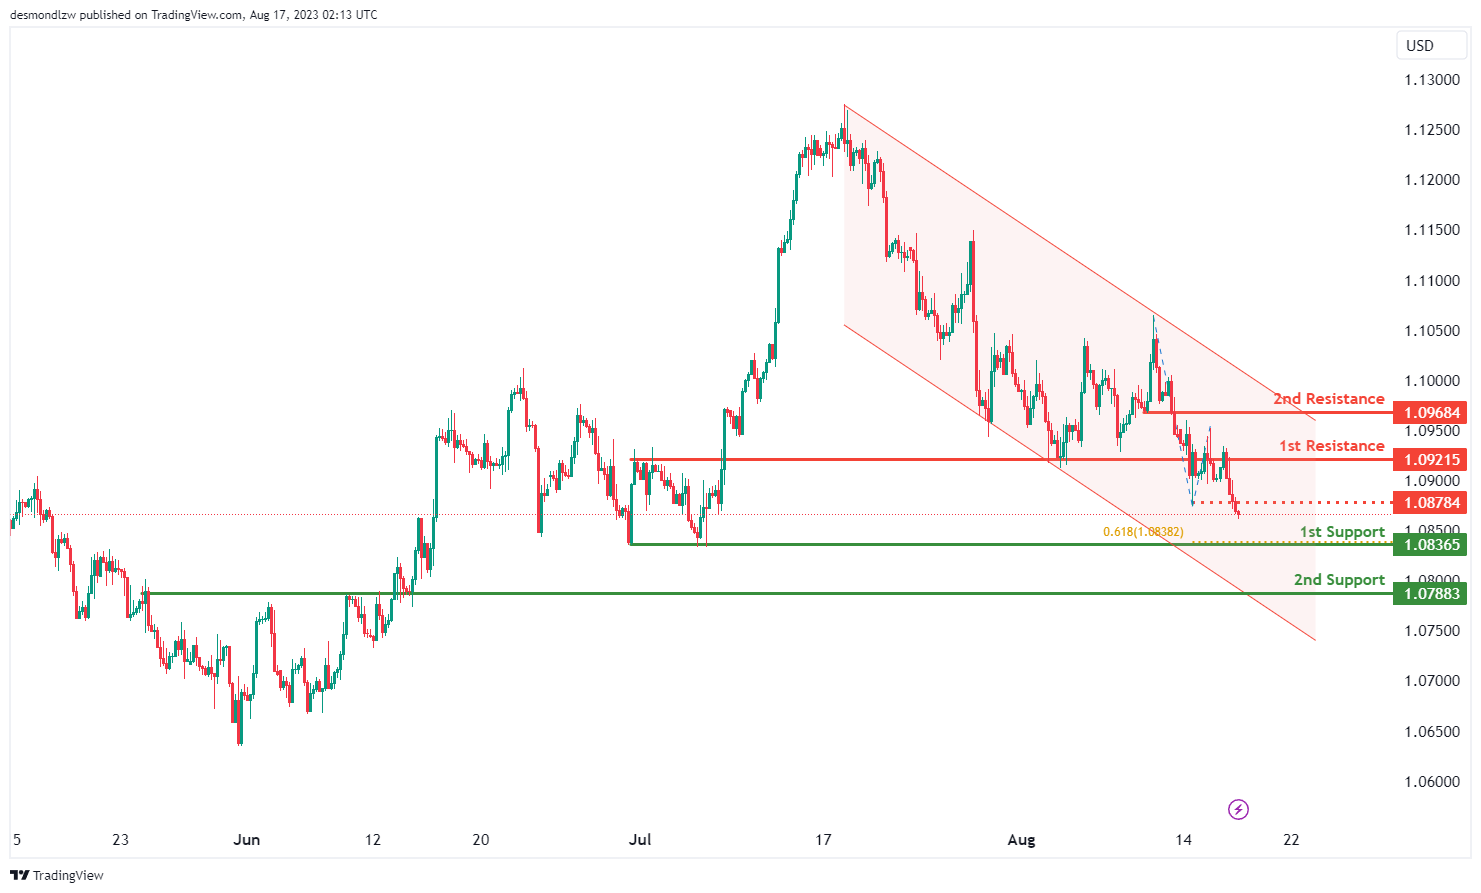
The EUR/USD chart currently maintains a bearish momentum, as indicated by its position within a descending channel. This channel pattern suggests a potential continuation of the downward trend due to the existing bearish momentum.
Given this bearish sentiment, there’s a likelihood of a bearish continuation towards the 1st support at 1.0836, which is reinforced by its role as a multi-swing low support and the presence of a 61.80% Fibonacci Projection.
Supporting the structure, the 2nd support at 1.0788 is identified as an overlap support.
On the resistance side, the 1st resistance at 1.0921 is significant due to its classification as an overlap resistance. Additionally, the 2nd resistance at 1.0968 acts as a pullback resistance.
Moreover, the intermediate resistance at 1.0878 is a pullback resistance, further contributing to the potential resistance levels.
EUR/JPY:
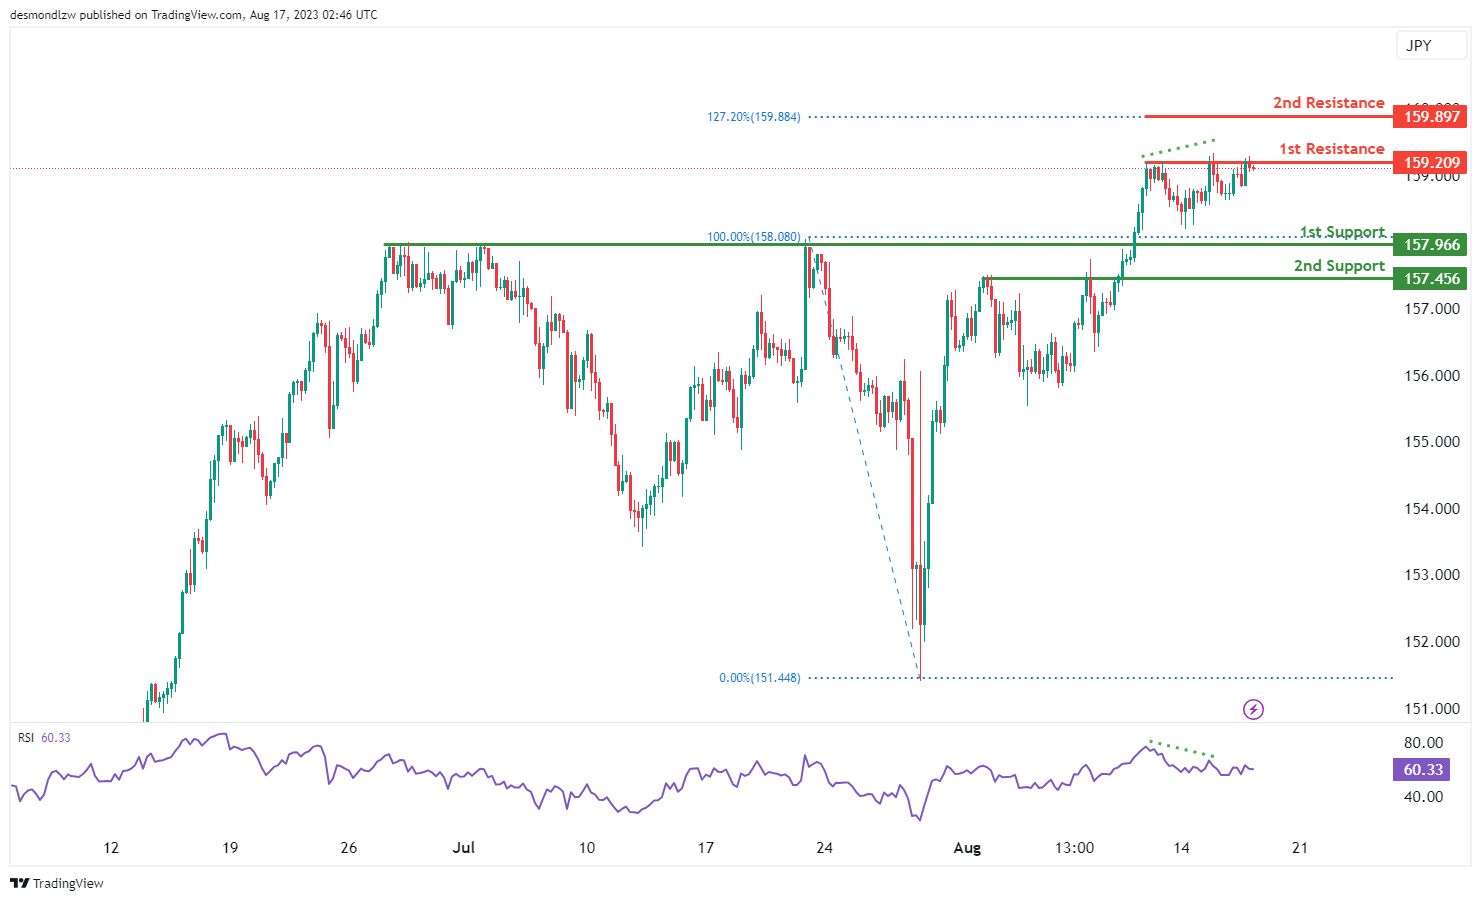
The EUR/JPY chart demonstrates a bearish overall momentum. There is a potential for a bearish reaction off the 1st resistance level, leading to a drop towards the 1st support level.
The 1st support is located at 157.96 and is considered advantageous due to its pullback support characteristics. Furthermore, the 2nd support at 157.45 is also seen as a valuable level because of its pullback support characteristics.
On the resistance side, the 1st resistance level at 159.20 is noteworthy as it represents a multi-swing high resistance. Additionally, the 2nd resistance at 159.89 is significant due to its association with the 127.20% Fibonacci Extension.
Furthermore, the Relative Strength Index (RSI) is also displaying bearish divergence versus price, suggesting that a reversal might occur soon. This could indicate a potential shift in the momentum of the chart.
EUR/GBP:
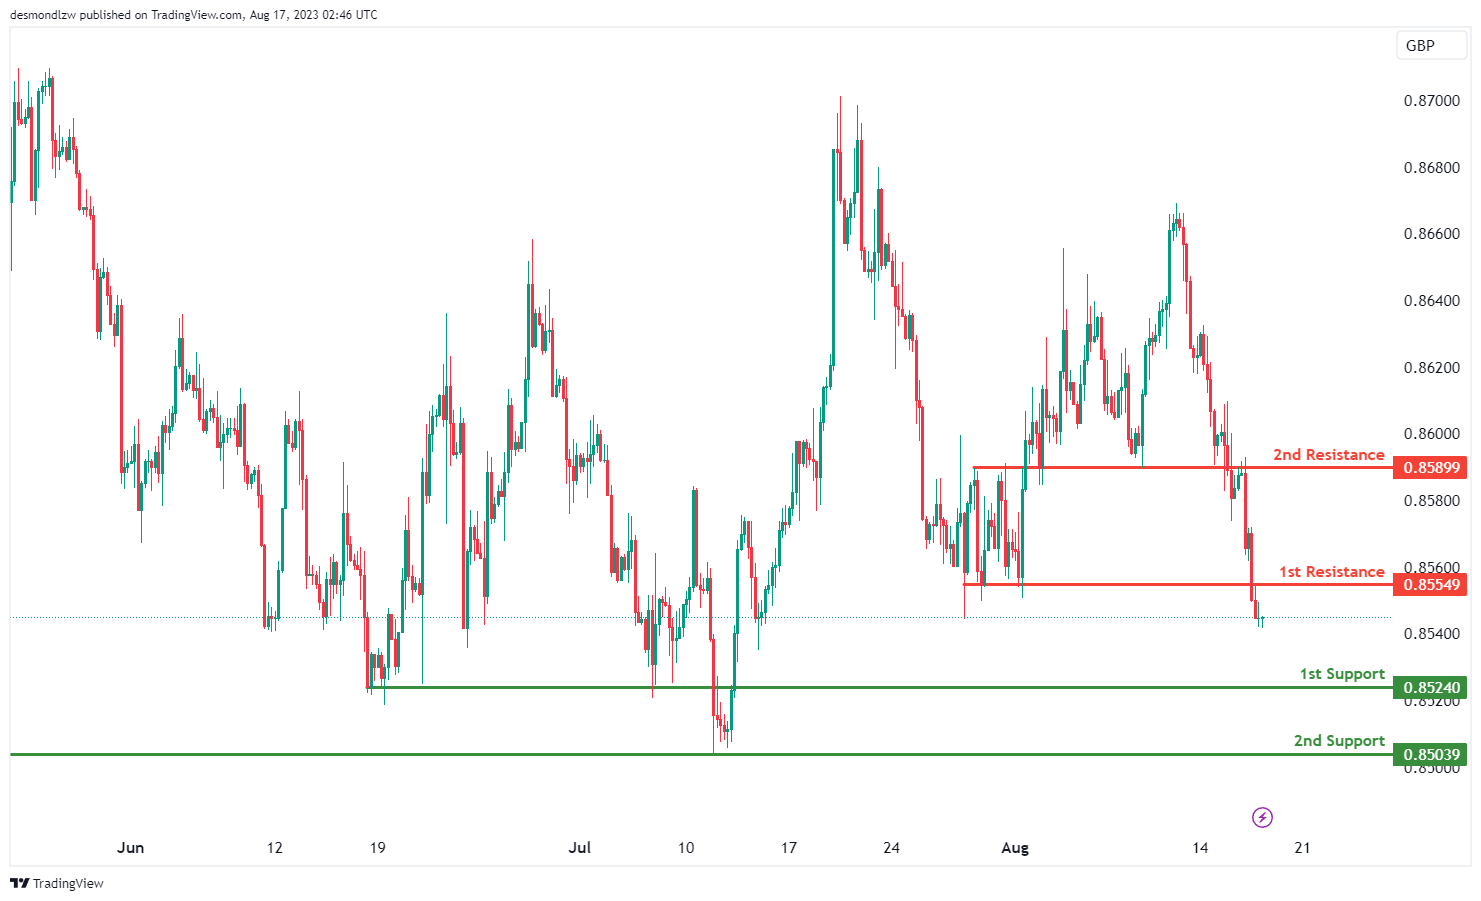
The EUR/GBP chart indicates a bearish overall momentum. There is a potential for a bearish continuation towards the 1st support level.
The 1st support is situated at 0.8524 and is considered advantageous due to its overlap support characteristics. Additionally, the 2nd support at 0.8503 is also viewed as a valuable level because of its overlap support.
On the resistance side, the 1st resistance level at 0.8554 is noteworthy as it represents a pullback resistance. Furthermore, the 2nd resistance at 0.8589 is also seen as significant due to its overlap resistance characteristics. This configuration suggests potential levels where the price might encounter obstacles in its movement.
GBP/USD:
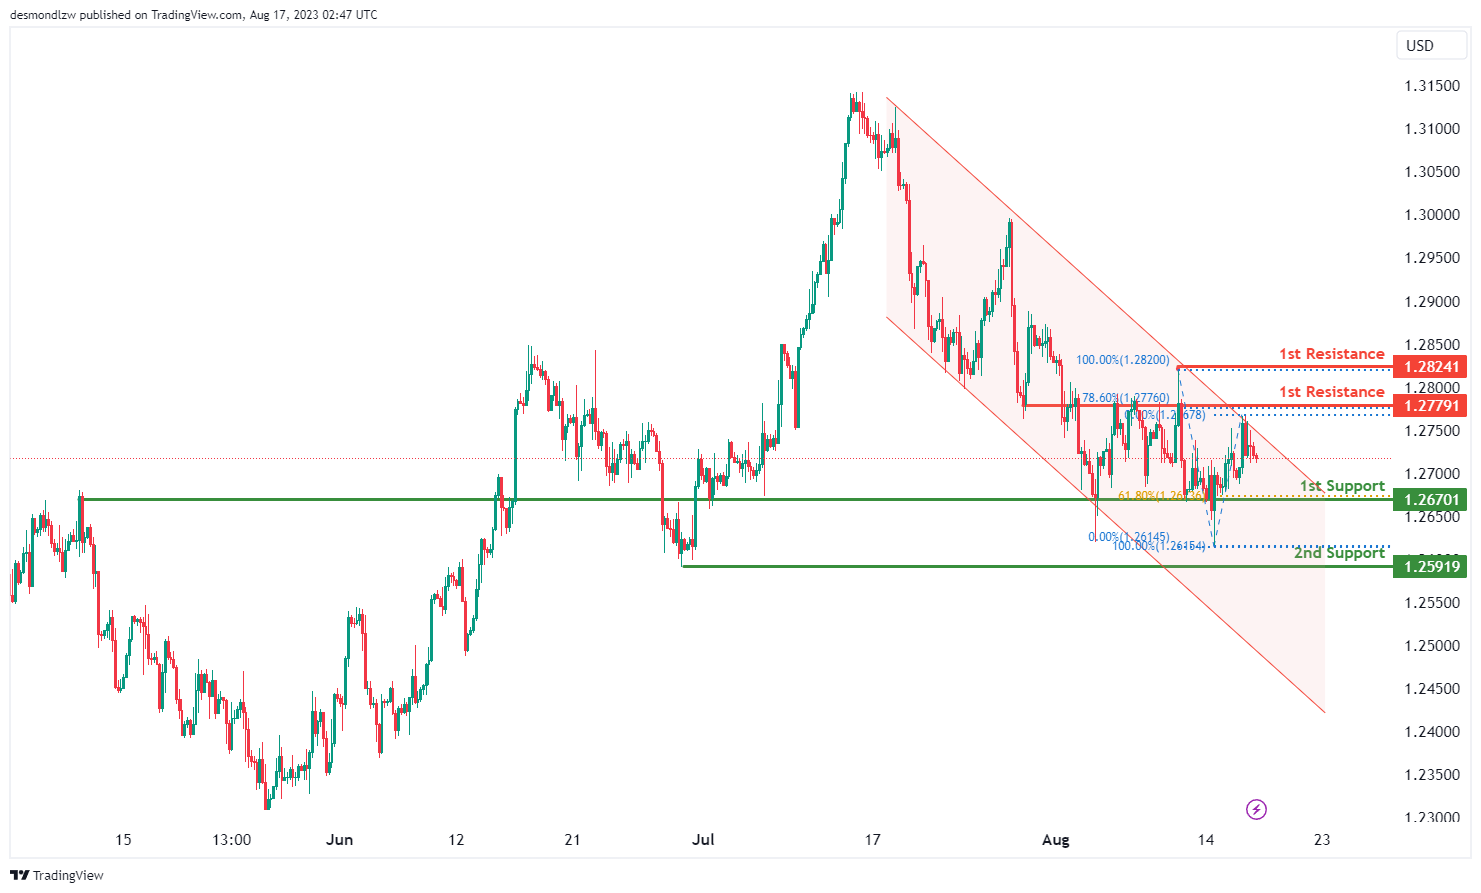
The GBP/USD chart currently maintains a bearish momentum, as indicated by its position within a descending channel. This channel pattern suggests a potential for the ongoing downward movement to persist due to the prevailing bearish trend.
Given this bearish context, there’s a likelihood of a bearish continuation towards the 1st support at 1.2670, which holds significance as an overlap support and aligns with the 61.80% Fibonacci retracement level.
Furthermore, the 2nd support at 1.2591 adds strength as a swing low support, contributing to the potential support levels.
On the resistance side, the 1st resistance at 1.2779 serves as a pullback resistance, reinforced by the presence of the 78.60% Fibonacci retracement level. The 2nd resistance at 1.2824 is identified as a swing high resistance, further contributing to the potential resistance levels.
Overall, the chart’s configuration aligns with the bearish momentum within the descending channel pattern.
GBP/JPY:
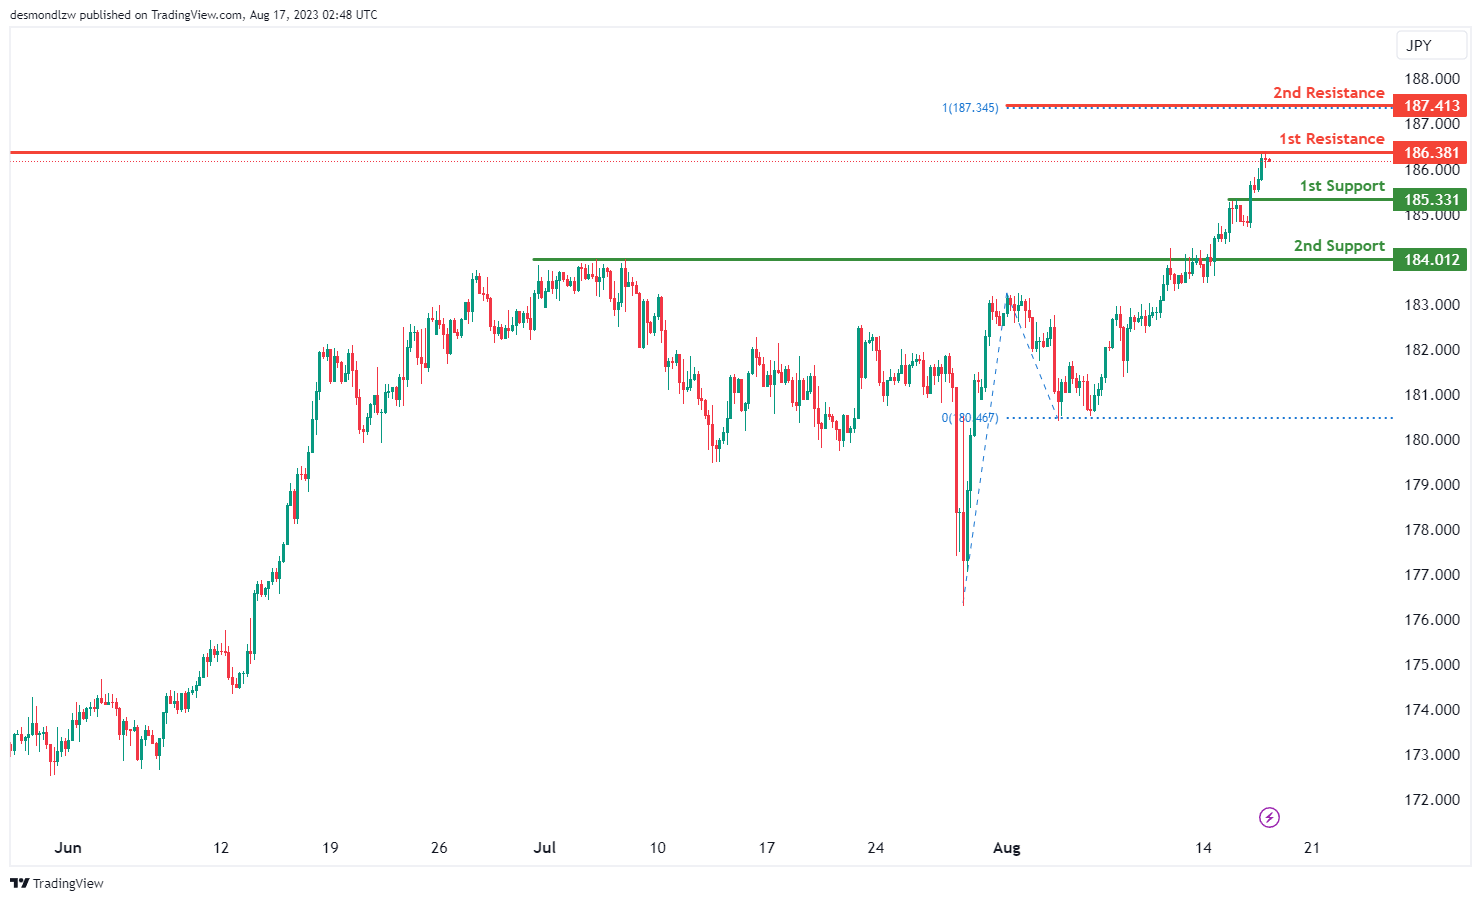
The GBP/JPY chart displays a bearish overall momentum. There is a potential for a bearish reaction off the 1st resistance level, leading to a drop towards the 1st support level.
The 1st support is positioned at 185.33 and is considered advantageous due to its pullback support characteristics. Furthermore, the 2nd support at 184.01 is also seen as valuable because it represents a pullback support.
On the resistance side, the 1st resistance level at 186.38 is noteworthy as it represents a swing high resistance. Additionally, the 2nd resistance at 187.41 is significant due to its association with the 100% Fibonacci Projection. These levels indicate potential points where the price might encounter resistance or support in its movement.
USD/CHF:
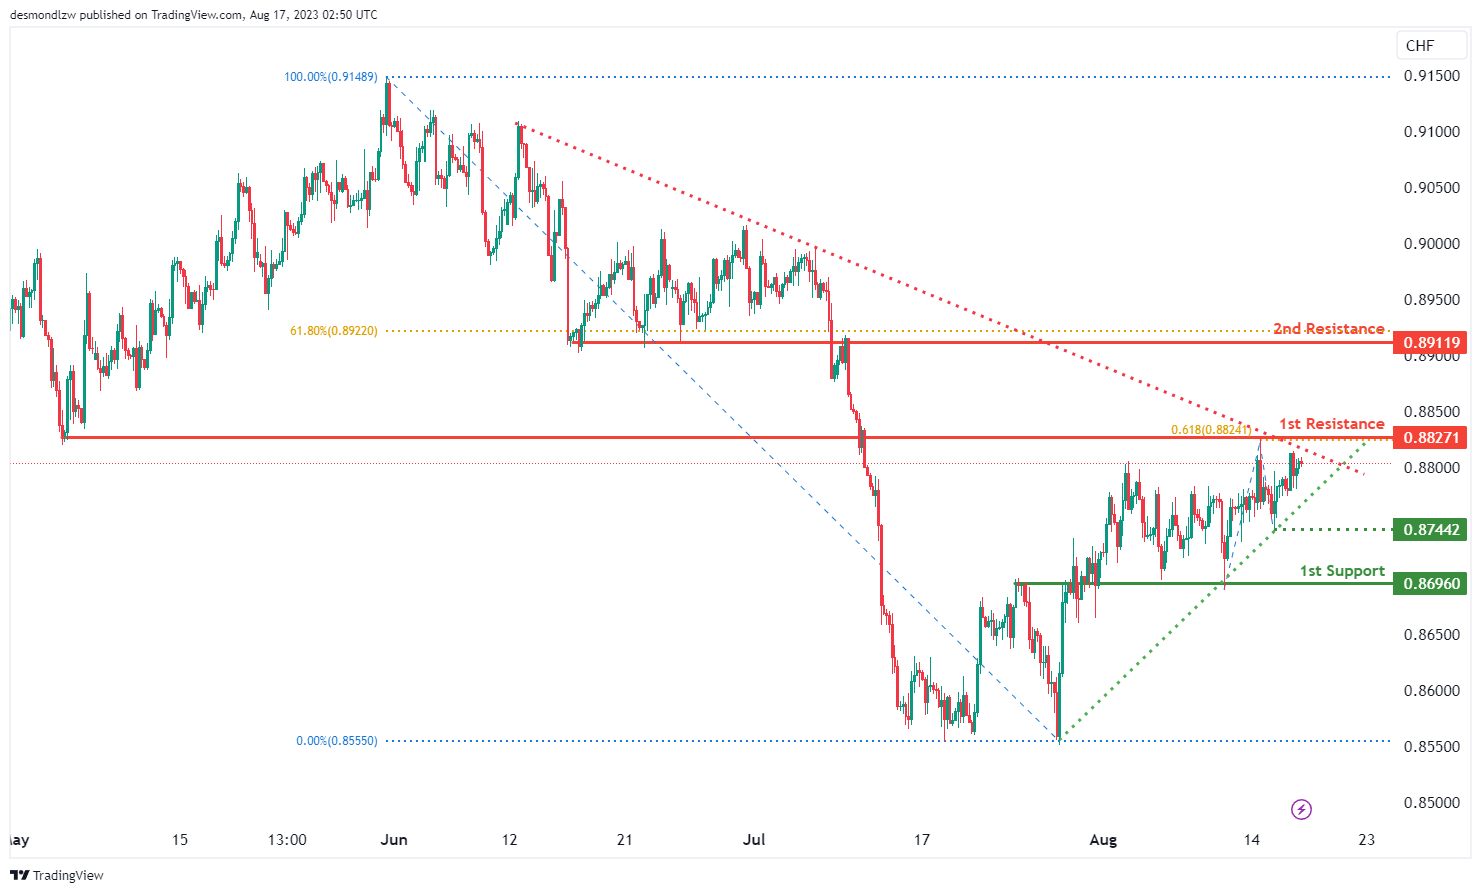
The USD/CHF chart currently maintains a neutral momentum, implying a lack of strong directional bias.
Given this neutral stance, there’s a possibility that the price might oscillate within the range defined by the 1st resistance at 0.8827 and the 1st support at 0.8696. These levels are significant, with the 1st support serving as an overlap support and the intermediate support at 0.8744 reinforcing the support structure. Similarly, the 1st resistance is an overlap resistance, while the 2nd resistance at 0.8911 is identified as a pullback resistance.
Adding to the analysis, the chart pattern indicates a symmetrical triangle formation, which typically signifies a period of consolidation before an imminent breakout or breakdown. If the price breaks above the upper trendline of the pattern, it could indicate a potential bullish breakout. Conversely, a break below the lower trendline might suggest a bearish breakdown.
Overall, the neutral momentum and the presence of the symmetrical triangle pattern indicate a potential for upcoming volatility and a decisive move in either direction.
USD/JPY:
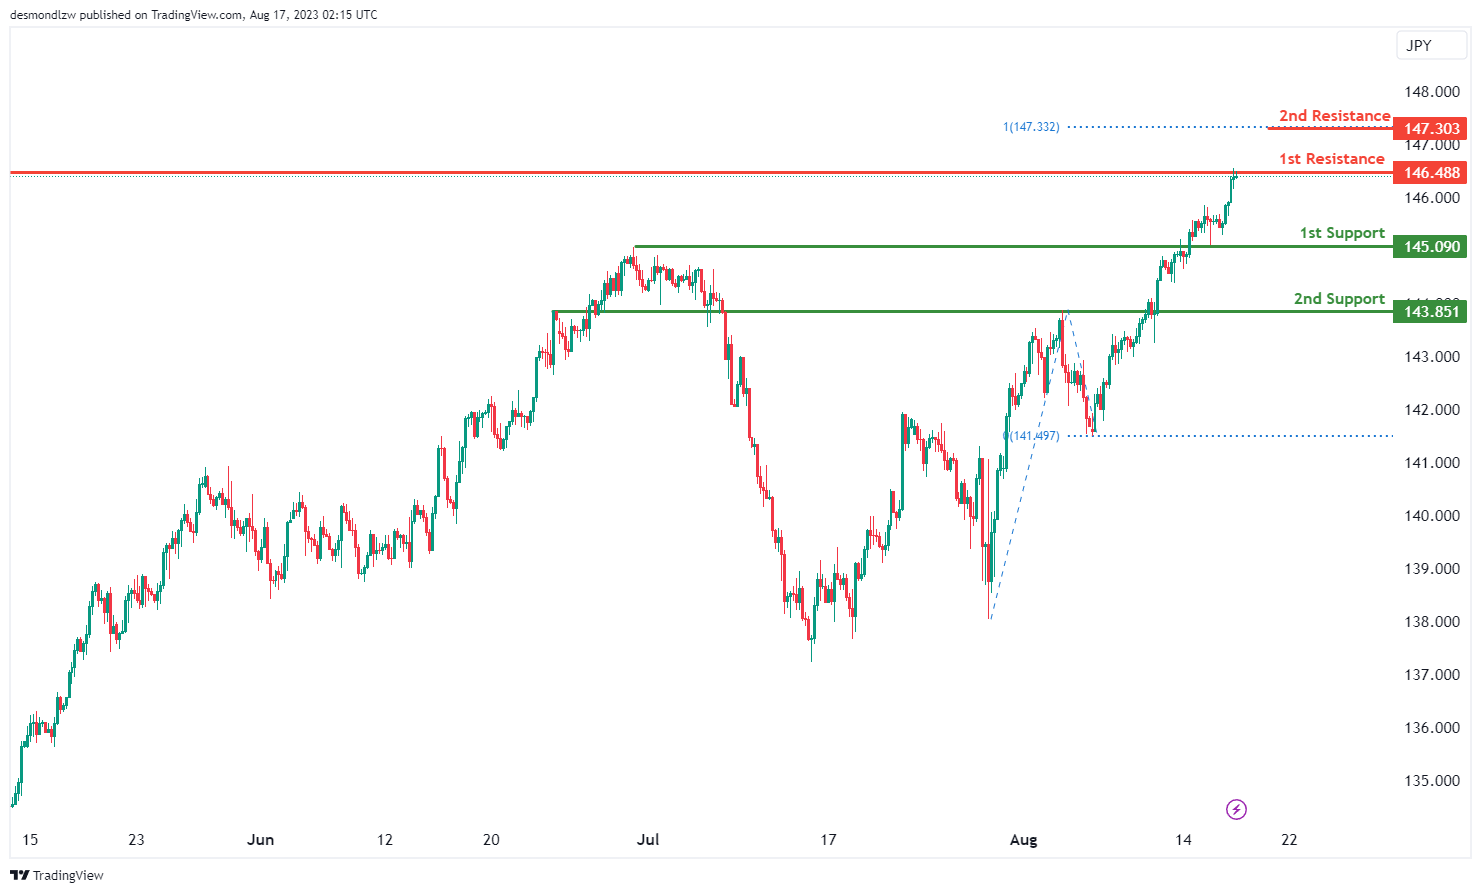
The USD/JPY chart currently exhibits a bearish momentum, suggesting a prevailing downward trend.
Given this bearish sentiment, a potential scenario could involve a bearish reaction as the price approaches the 1st resistance level at 146.48, followed by a drop towards the 1st support at 145.09. The significance of the 1st support lies in its classification as an overlap support, while the 2nd support at 143.85 gains importance as a pullback support.
On the resistance side, the 1st resistance at 146.48 is noted as a swing high resistance. Additionally, the 2nd resistance at 147.30 is categorized as an overlap resistance, reinforcing its potential impact as a barrier to further upward movement.
USD/CAD:
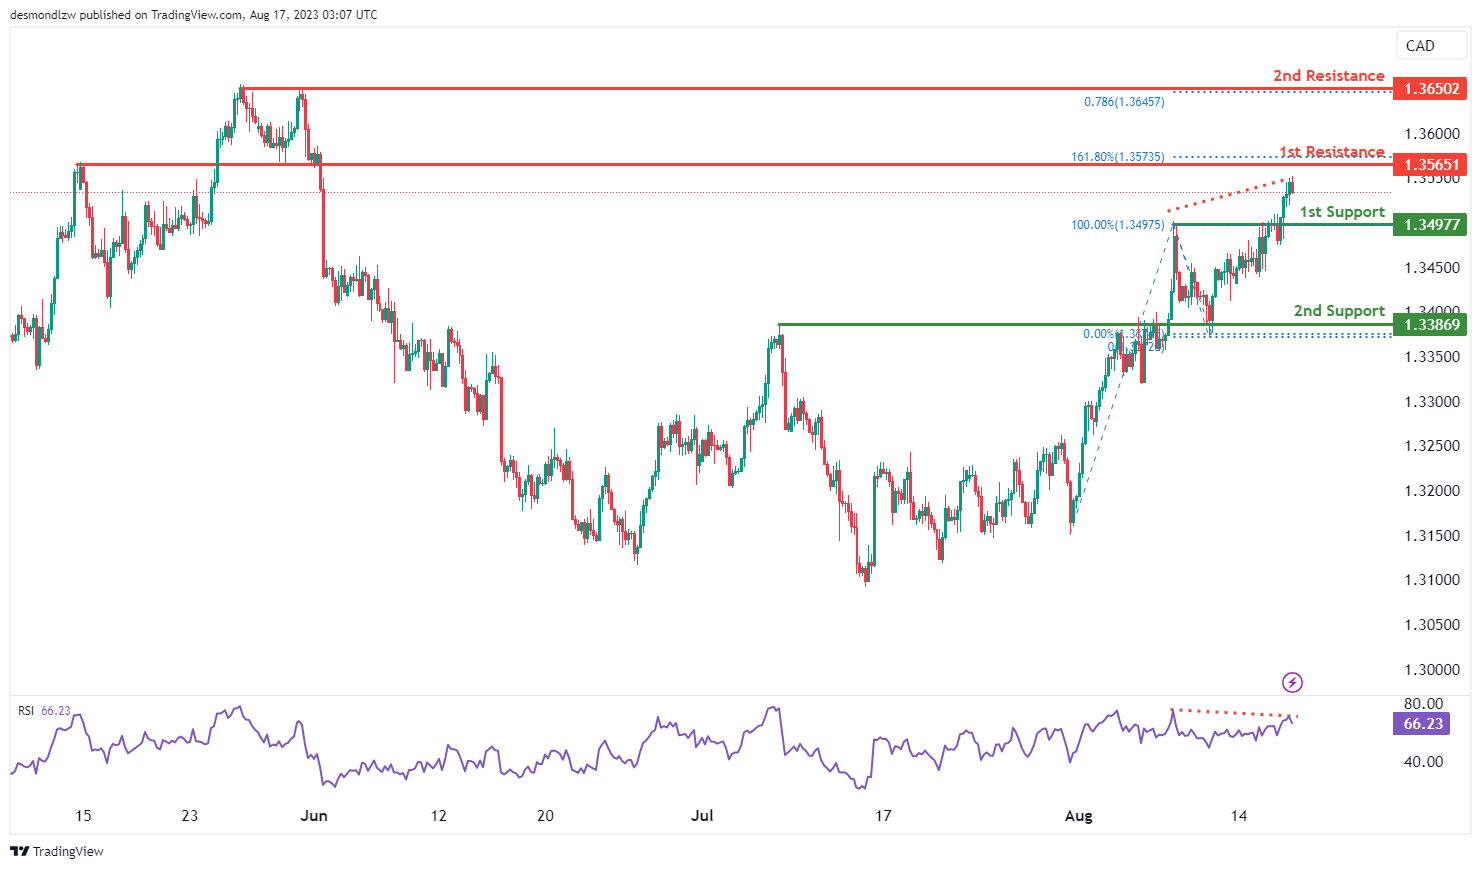
The USD/CAD chart currently shows a bearish momentum, indicating a prevailing downward trend. There’s a potential scenario where the price could continue its bearish movement towards the 1st support at 1.3498, which is identified as an overlap support. The 2nd support at 1.3387 is also identified as an overlap support level.
To the upside, the 1st resistance at 1.3565 is identified as an overlap resistance level that aligns with the 161.80% Fibonacci extension level while the 2nd resistance at 1.3650 is identified as a multi-swing-high that aligns with the 78.60% Fibonacci projection level.
AUD/USD:
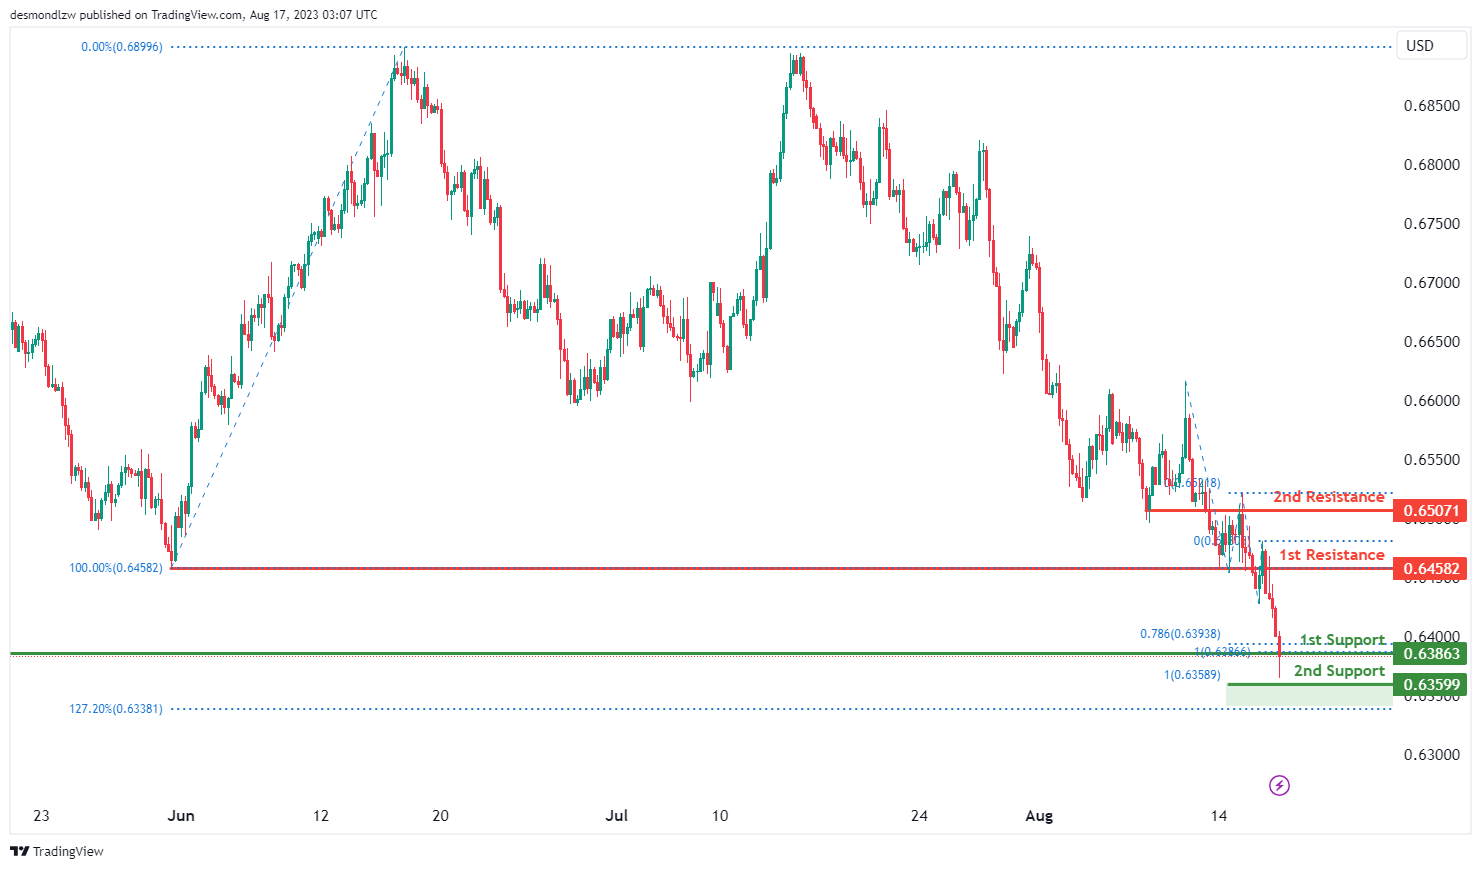
The current trend in the AUD/USD chart is bearish, with potential for a further downward movement. The price may break below the 1st support and make a potential move towards the 2nd support level.
The 1st support level at 0.6386, which is identified as a pullback support, is reinforced by a confluence of Fibonacci levels i.e. the 78.60% and the 100.00% projection levels. The 2nd support at 0.6359 adds to the support area with the presence of the 100.00% Fibonacci projection and the 127.20% Fibonacci extension levels, which is also identified as a Fibonacci confluence.
To the upside, the 1st resistance level at 0.6458 is identified as an overlap support while the 2nd resistance at 0.6507 is also identified as an overlap resistance.
NZD/USD
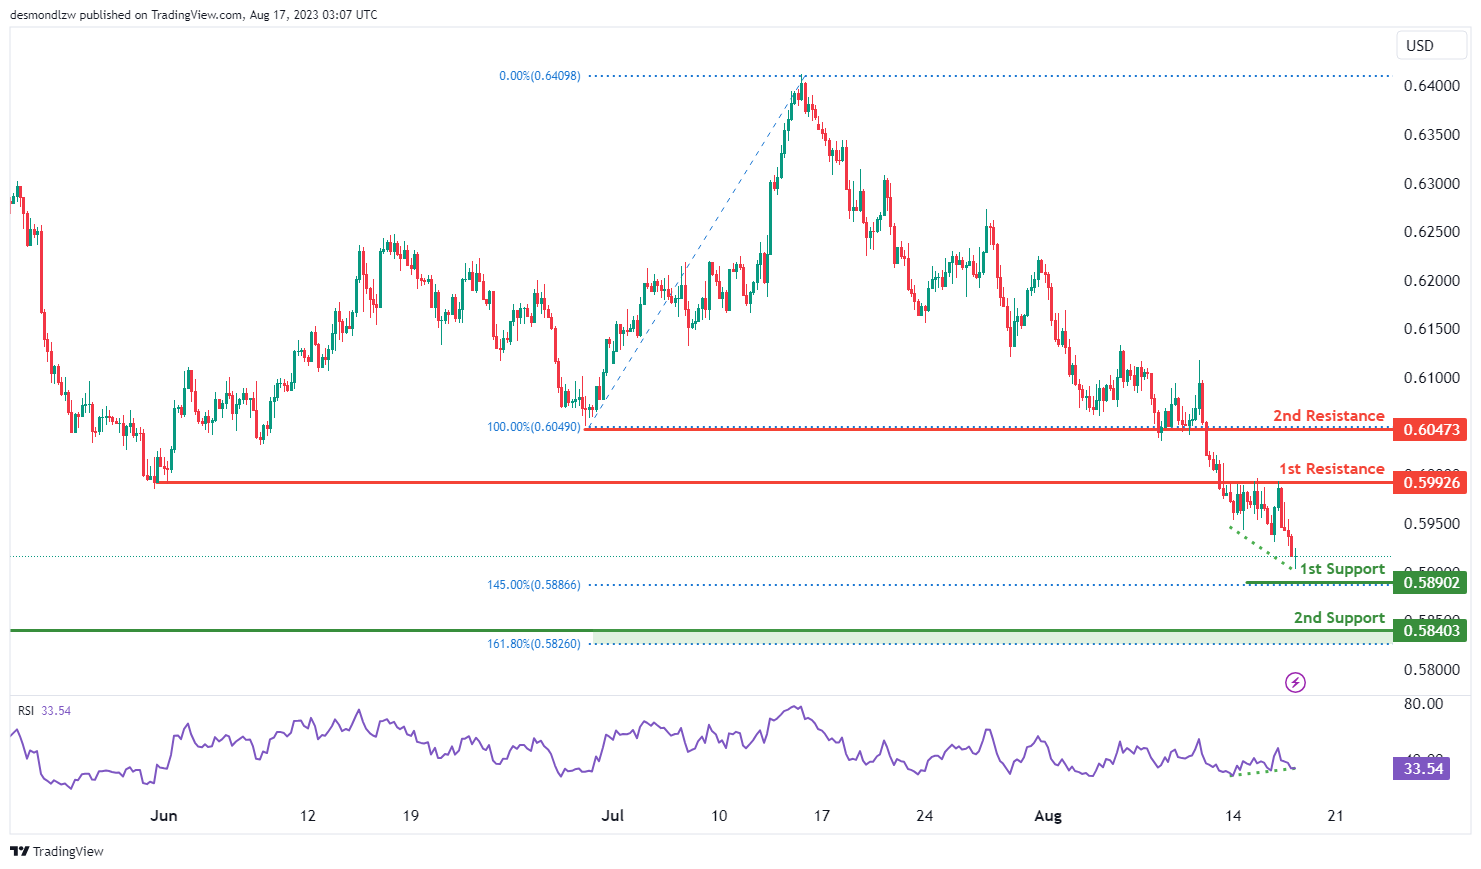
The current trend in the NZD/USD chart shows a weak bullish movement with low confidence. There is potential for the price to continue its upward movement towards the 1st resistance level at 0.5993. Additionally, the RSI indicator shows bullish divergence, suggesting a potential bounce in the near future.
The 1st support at 0.5890 is supported by the presence of the 145.00% Fibonacci extension level while the 2nd support at 0.5840 is supported by the presence of the 161.80% Fibonacci extension level.
To the upside, the 1st resistance at 0.5993 is an overlap resistance level while the 2nd resistance at 0.6047 is also identified as an overlap resistance.
DJ30:
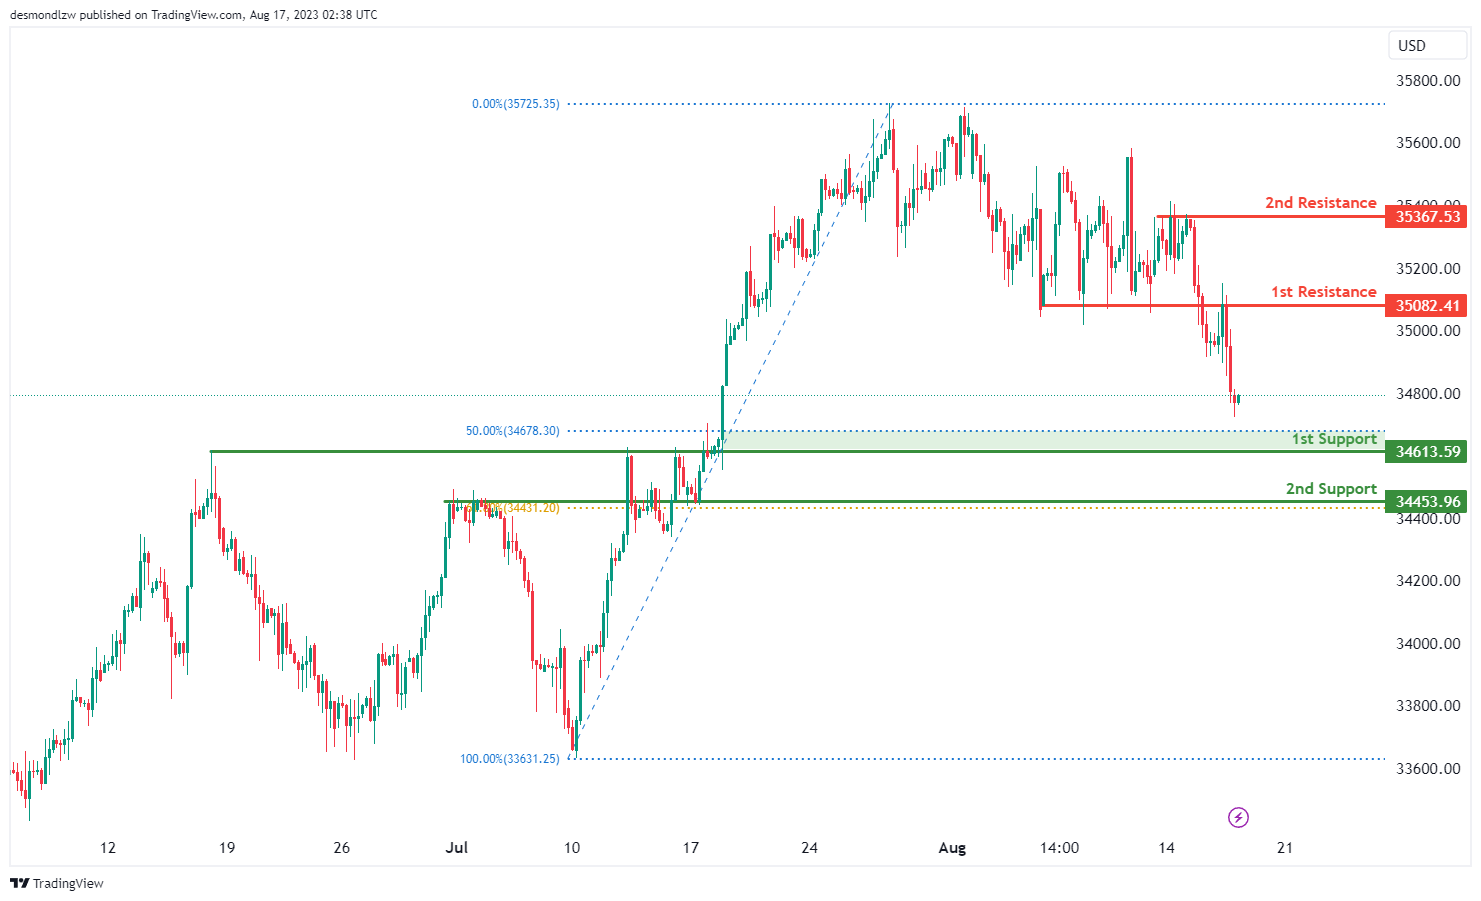
The DJ30 chart displays a bearish overall momentum. There is a potential for a bearish continuation towards the 1st support level. The 1st support is positioned at 34613.59 and is considered advantageous due to its pullback support, as well as a Fibonacci confluence of a 50% Fibonacci Retracement and a 100% Fibonacci Projection.
Additionally, the 2nd support at 34453.96 is also seen as a valuable level due to its overlap support and a 61.80% Fibonacci Retracement.
On the resistance side, the 1st resistance level at 35082.41 is notable as it represents a pullback resistance. Moreover, the 2nd resistance at 35367.53 is also significant due to its multi-swing high resistance characteristics.
GER30:
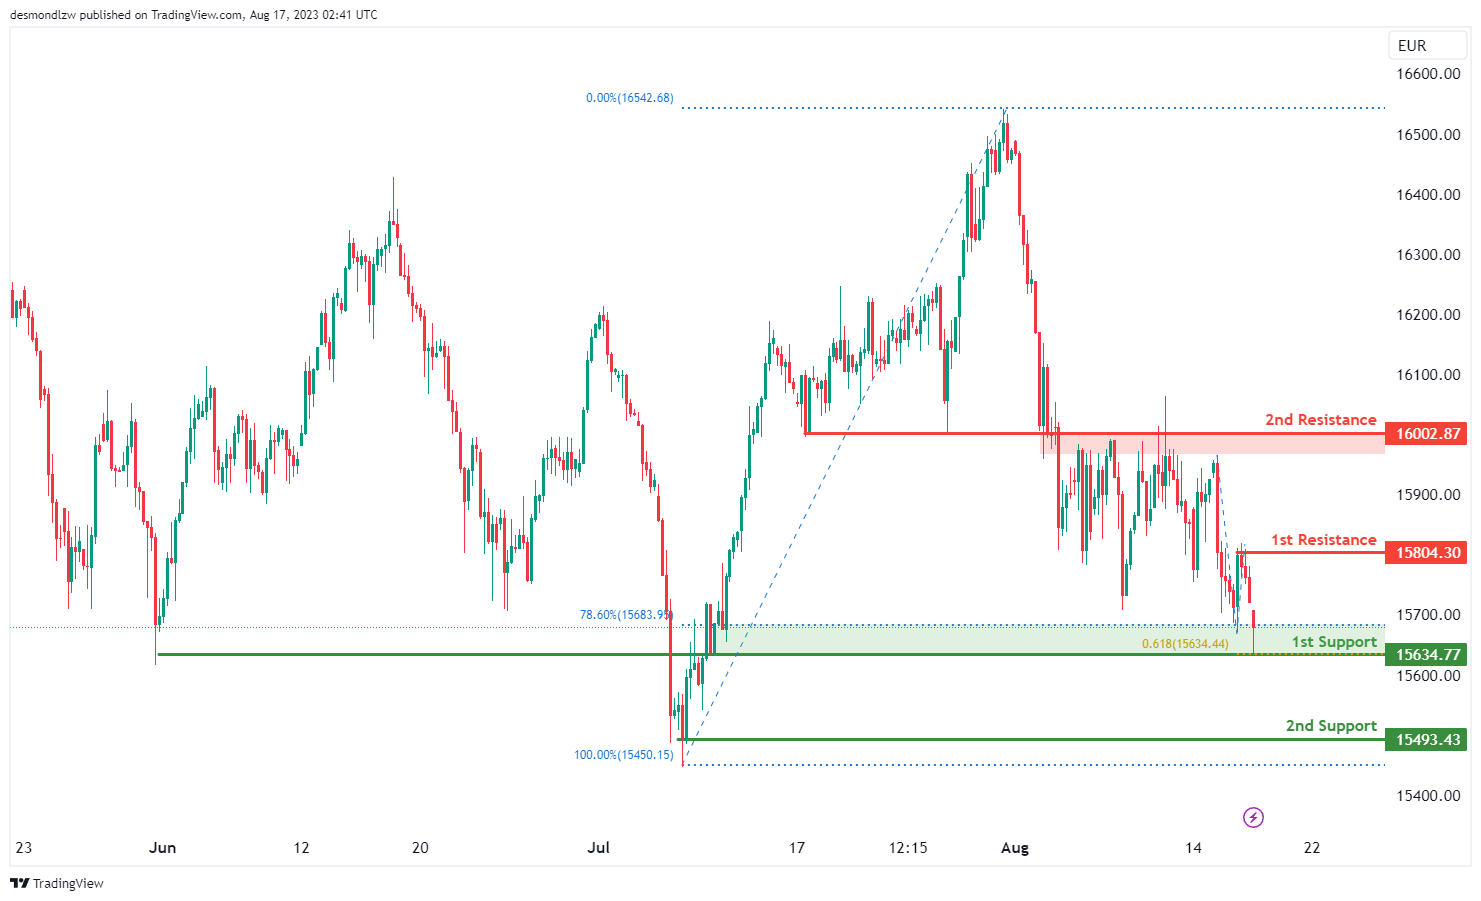
The GER30 chart indicates a bullish overall momentum. There is a potential for a bullish bounce off the 1st support level, leading towards the 1st resistance.
The 1st support is positioned at 15634.77 and is considered favorable due to its overlap support, along with a Fibonacci confluence of a 78.60% Fibonacci Retracement and a 61.80% Fibonacci Projection.
Furthermore, the 2nd support at 15493.43 is viewed as a valuable level due to its swing low support characteristics.
On the resistance side, the 1st resistance level at 15804.30 is noteworthy as it represents an overlap resistance. Additionally, the 2nd resistance at 16002.87 is significant due to its pullback resistance characteristics.
US500
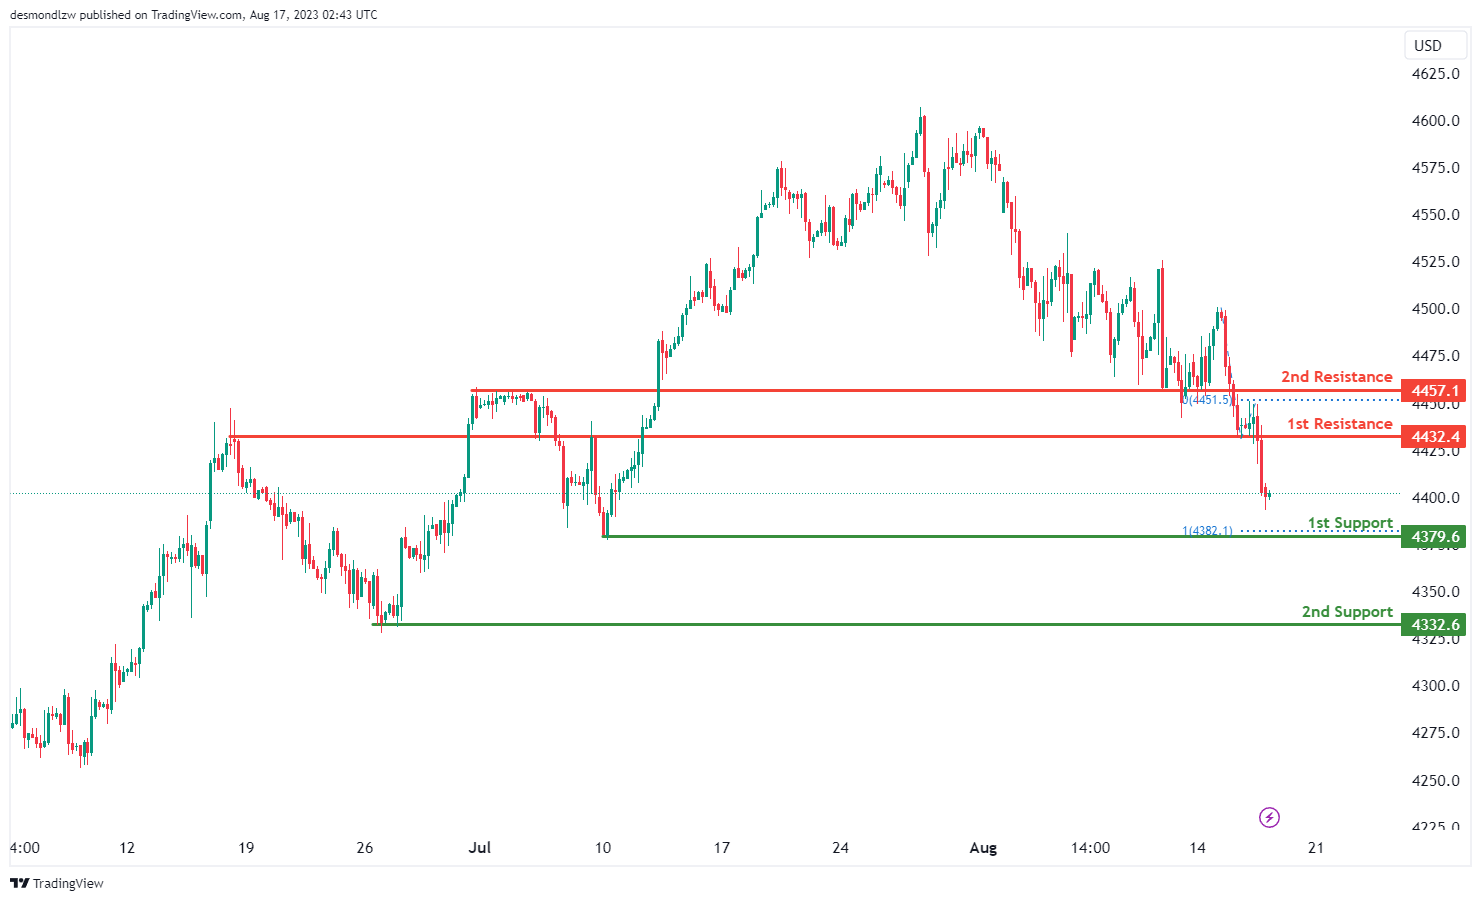
The US500 chart indicates a bearish overall momentum. There is a potential for a bearish continuation towards the 1st support level. The 1st support is situated at 4379.6 and is considered advantageous due to its swing low support characteristics, accompanied by a 100% Fibonacci Projection.
Furthermore, the 2nd support at 4332.6 is also considered a valuable level because of its swing low support characteristics.
On the resistance side, the 1st resistance level at 4432.4 is noteworthy as it represents an overlap resistance. Additionally, the 2nd resistance at 4457.1 is also significant due to its overlap resistance characteristics.
BTC/USD:
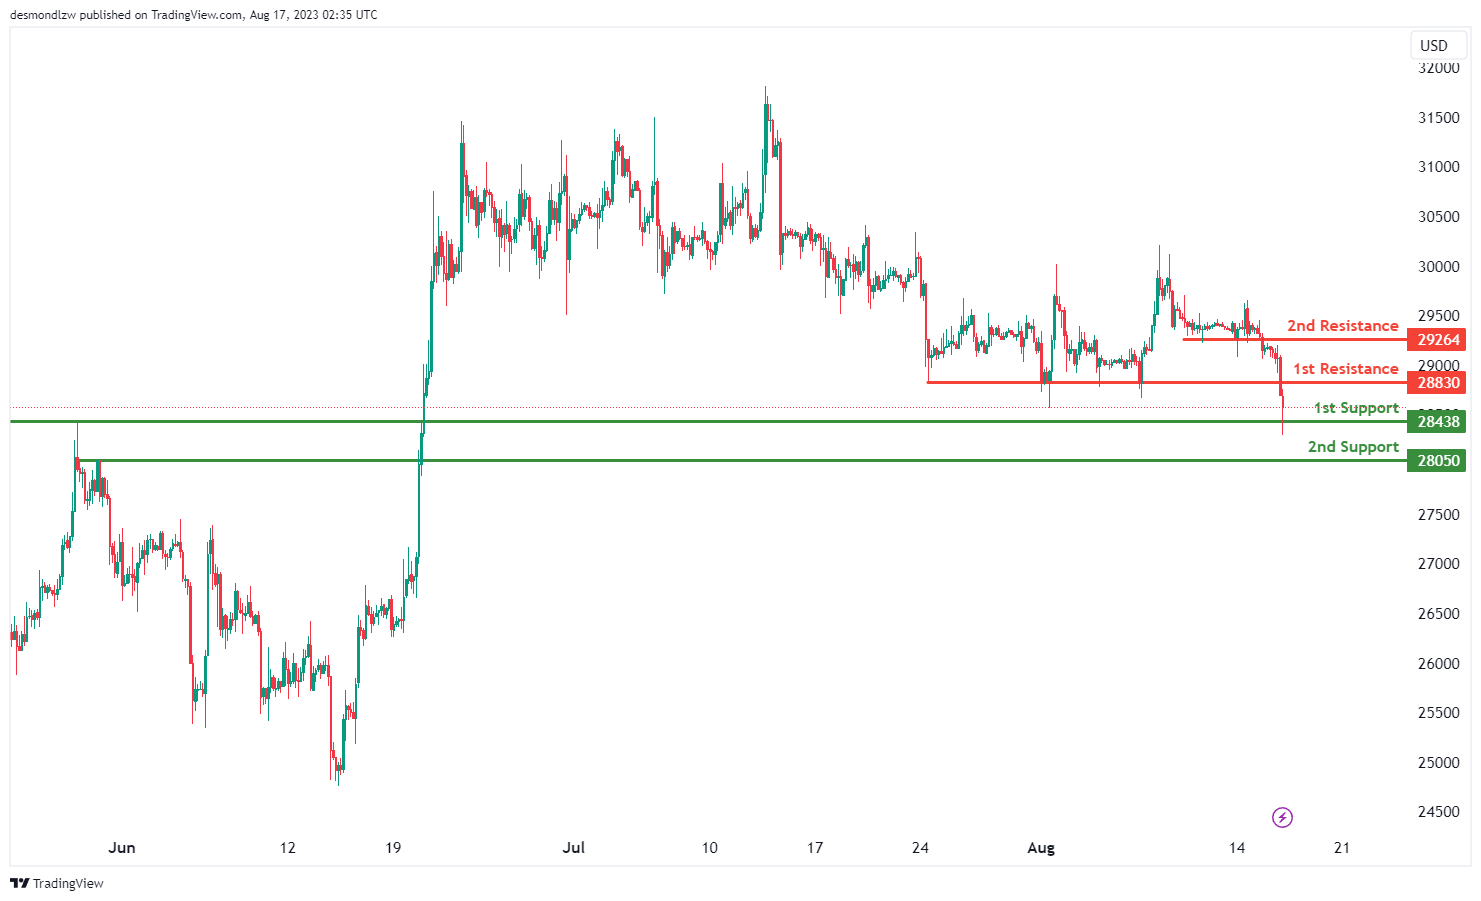
The BTC/USD chart displays a bearish overall momentum. There is a potential for a bearish continuation towards the 1st support level. The 1st support is situated at 28438 and is considered significant due to its overlap support characteristics. Furthermore, the 2nd support at 28050 is viewed as advantageous because it represents a pullback support.
On the resistance side, the 1st resistance level at 28830 is notable as it presents a pullback resistance. Additionally, the 2nd resistance at 29264 is also considered significant due to its pullback resistance characteristics.
ETH/USD:
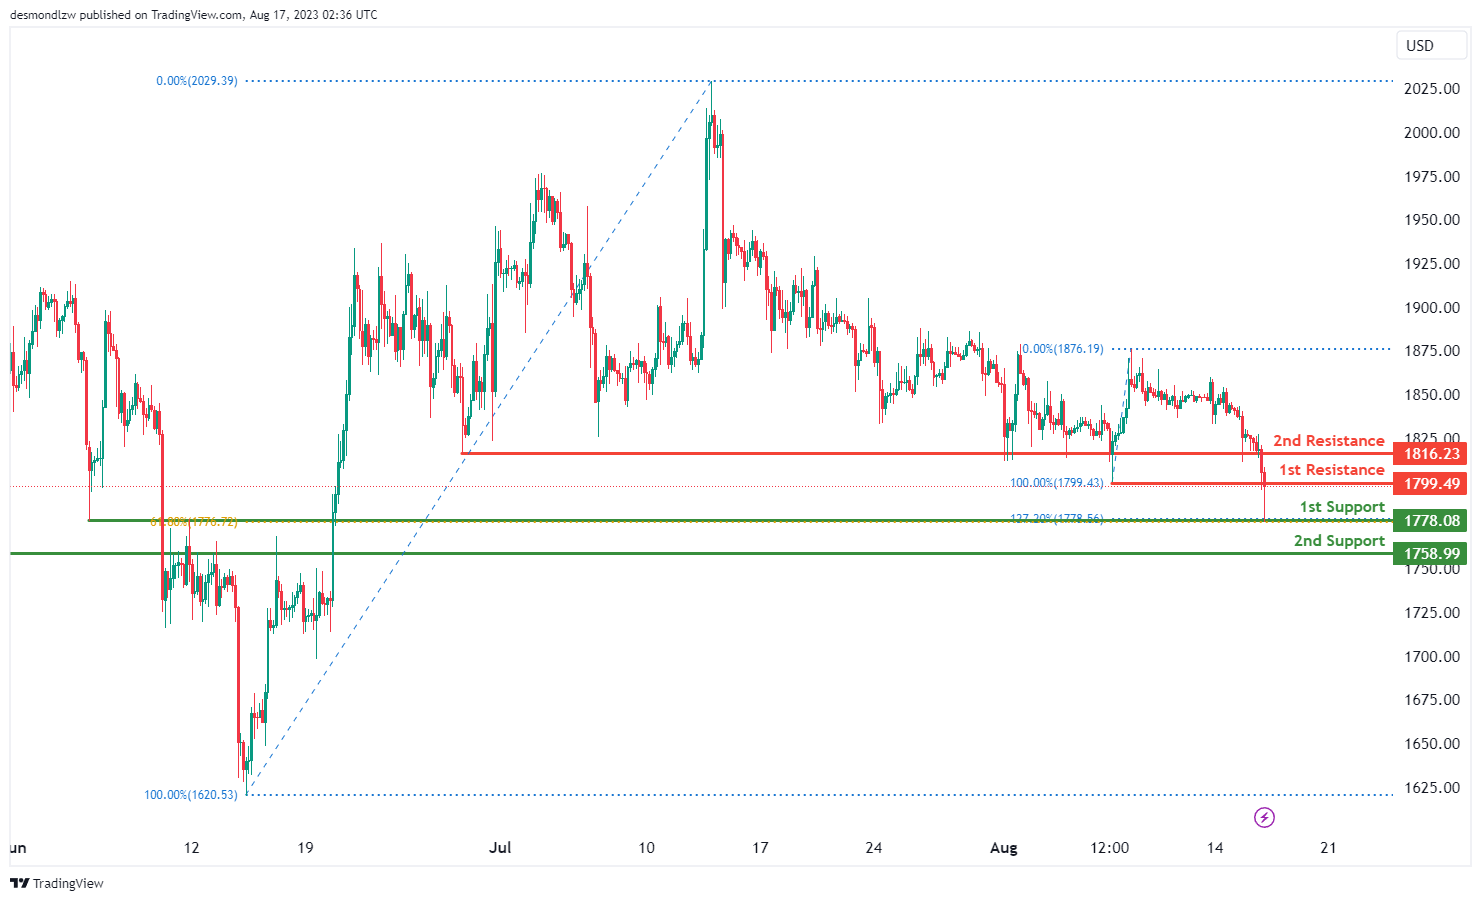
The ETH/USD chart shows a bearish overall momentum. There is a potential for a bearish continuation towards the 1st support level. The 1st support is positioned at 1778.08 and is considered favorable due to its overlap support, along with a Fibonacci confluence of a 127.20% Fibonacci Extension and a 61.80% Fibonacci Retracement.
Furthermore, the 2nd support at 1758.99 is also considered good due to its overlap support characteristics.
On the resistance side, the 1st resistance level at 1799.49 is noteworthy as it represents a pullback resistance. Additionally, the 2nd resistance at 1816.23 is also seen as significant due to its pullback resistance characteristics.
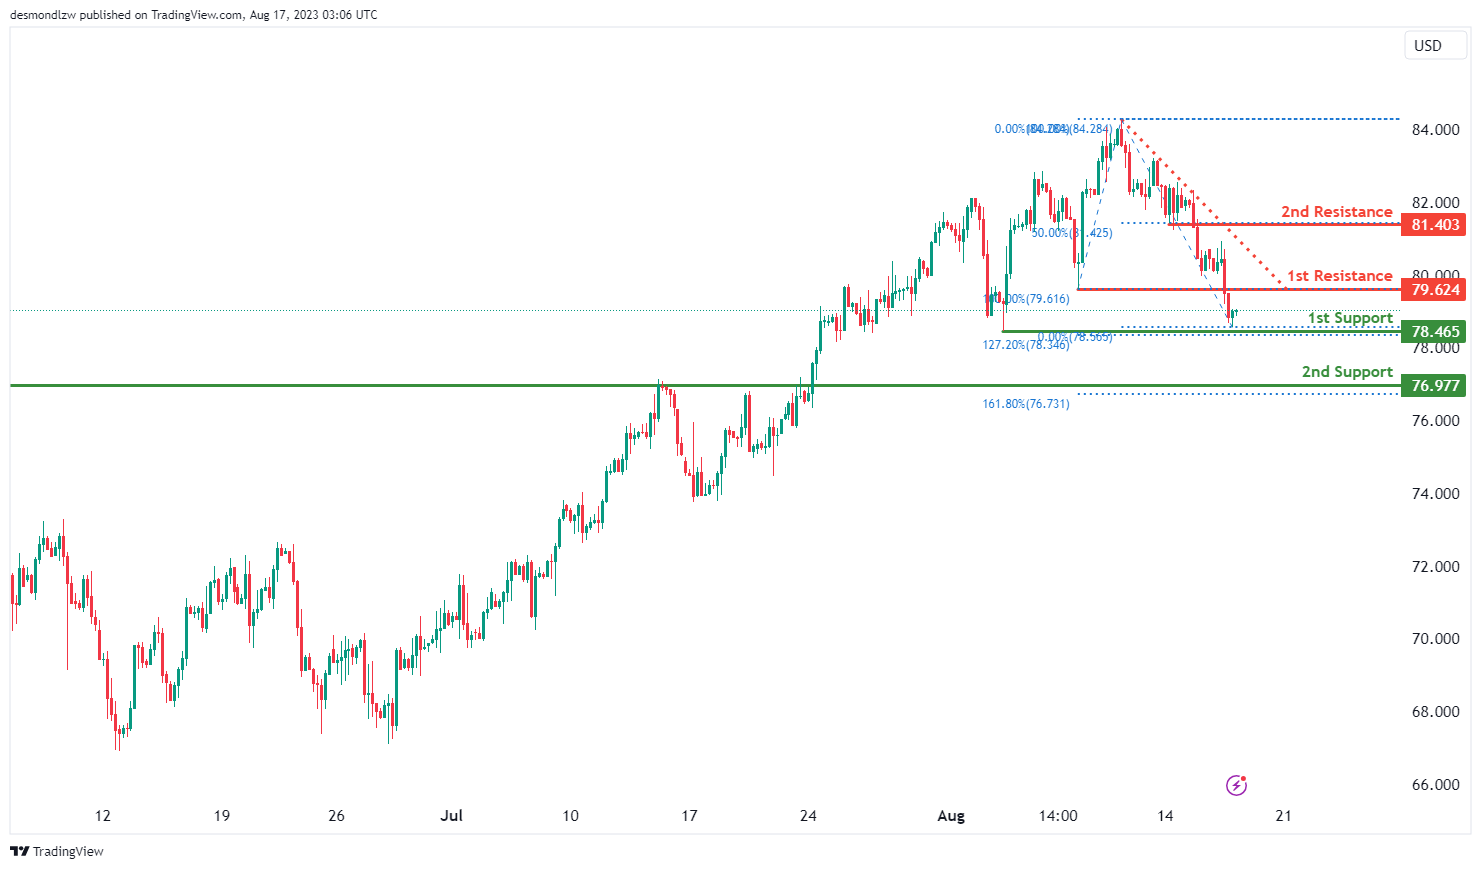
WTI/USD:
The WTI/USD chart is currently displaying a neutral momentum, indicating a lack of clear directional trend. There is a potential scenario where the price could fluctuate between the 1st resistance and the 1st support.
The 1st support level at 78.47 is identified as an overlap support that aligns with the 127.20% Fibonacci extension level. The 2nd support at 76.98 is also identified as an overlap support that aligns with the 161.80% Fibonacci extension level.
To the upside, the 1st resistance level at 79.62 is identified as an overlap resistance while the 2nd resistance at 81.40 is identified as a pullback resistance that aligns with the 50.00% Fibonacci retracement level.
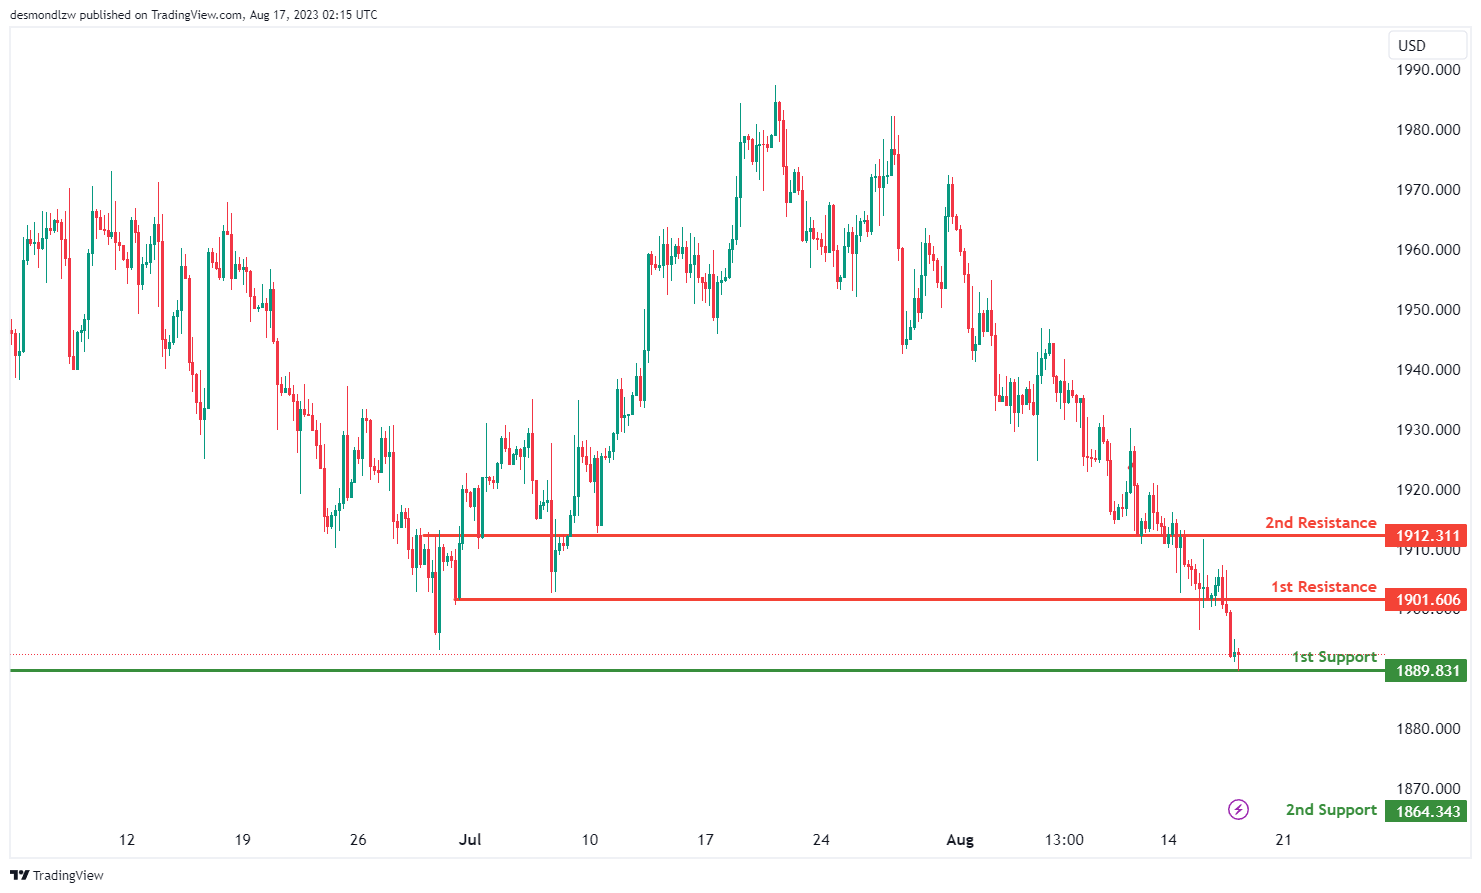
XAU/USD (GOLD):
The XAU/USD chart currently demonstrates a bullish momentum, indicating a prevailing upward trend.
Within this context, a potential scenario involves a bullish bounce off the 1st support level at 1896.25, categorized as an overlap support. This bounce could potentially lead the price towards the 1st resistance level at 1901.60, which is considered a pullback resistance.
The 2nd support at 1864.34 is noted as a pullback support, reinforcing the overall support structure. Similarly, the 2nd resistance at 1912.31 is identified as an overlap resistance, further enhancing its potential significance as a barrier to further upward movement.
Japans’ export contracts in Jul, shipments to China fell for 8th month
Japan's exports experienced a dip of -0.3% yoy to JPY 8725B in July. This contraction is noteworthy as it breaks a growth streak that has lasted for over two years since February 2021.
Diving deeper into the data, while shipments to US and Europe saw a positive trajectory with respective rises of 13.5% yoy and 12.4% yoy, the trade dynamics with China narrated a different story.
Exports to China, Japan's primary trading ally, plummeted by -13.4%, marking the steepest decline since January. Notably, this reflects an ongoing trend with shipments to China diminishing for the eighth consecutive month, subsequent to a -10.9% yoy drop in June.
On the import front, Japan registered a decline of -13.5% yoy to JPY 8804B. This marks the fourth consecutive month of declining imports and is the most significant dip since September 2020. The downturn can be partly attributed to the decreasing commodities prices.
With imports exceeding exports, trade balance for the month ended in a deficit of JPY -78.7B.
When observing the figures in seasonally adjusted terms, both exports and imports displayed a 2.0% mom rise, amounting to JPY 8460B and JPY 9018B respectively. Consequently, trade deficit widened slightly, reaching JPY -557B.
Australian employment down -14.6k, but hours worked continue to rise
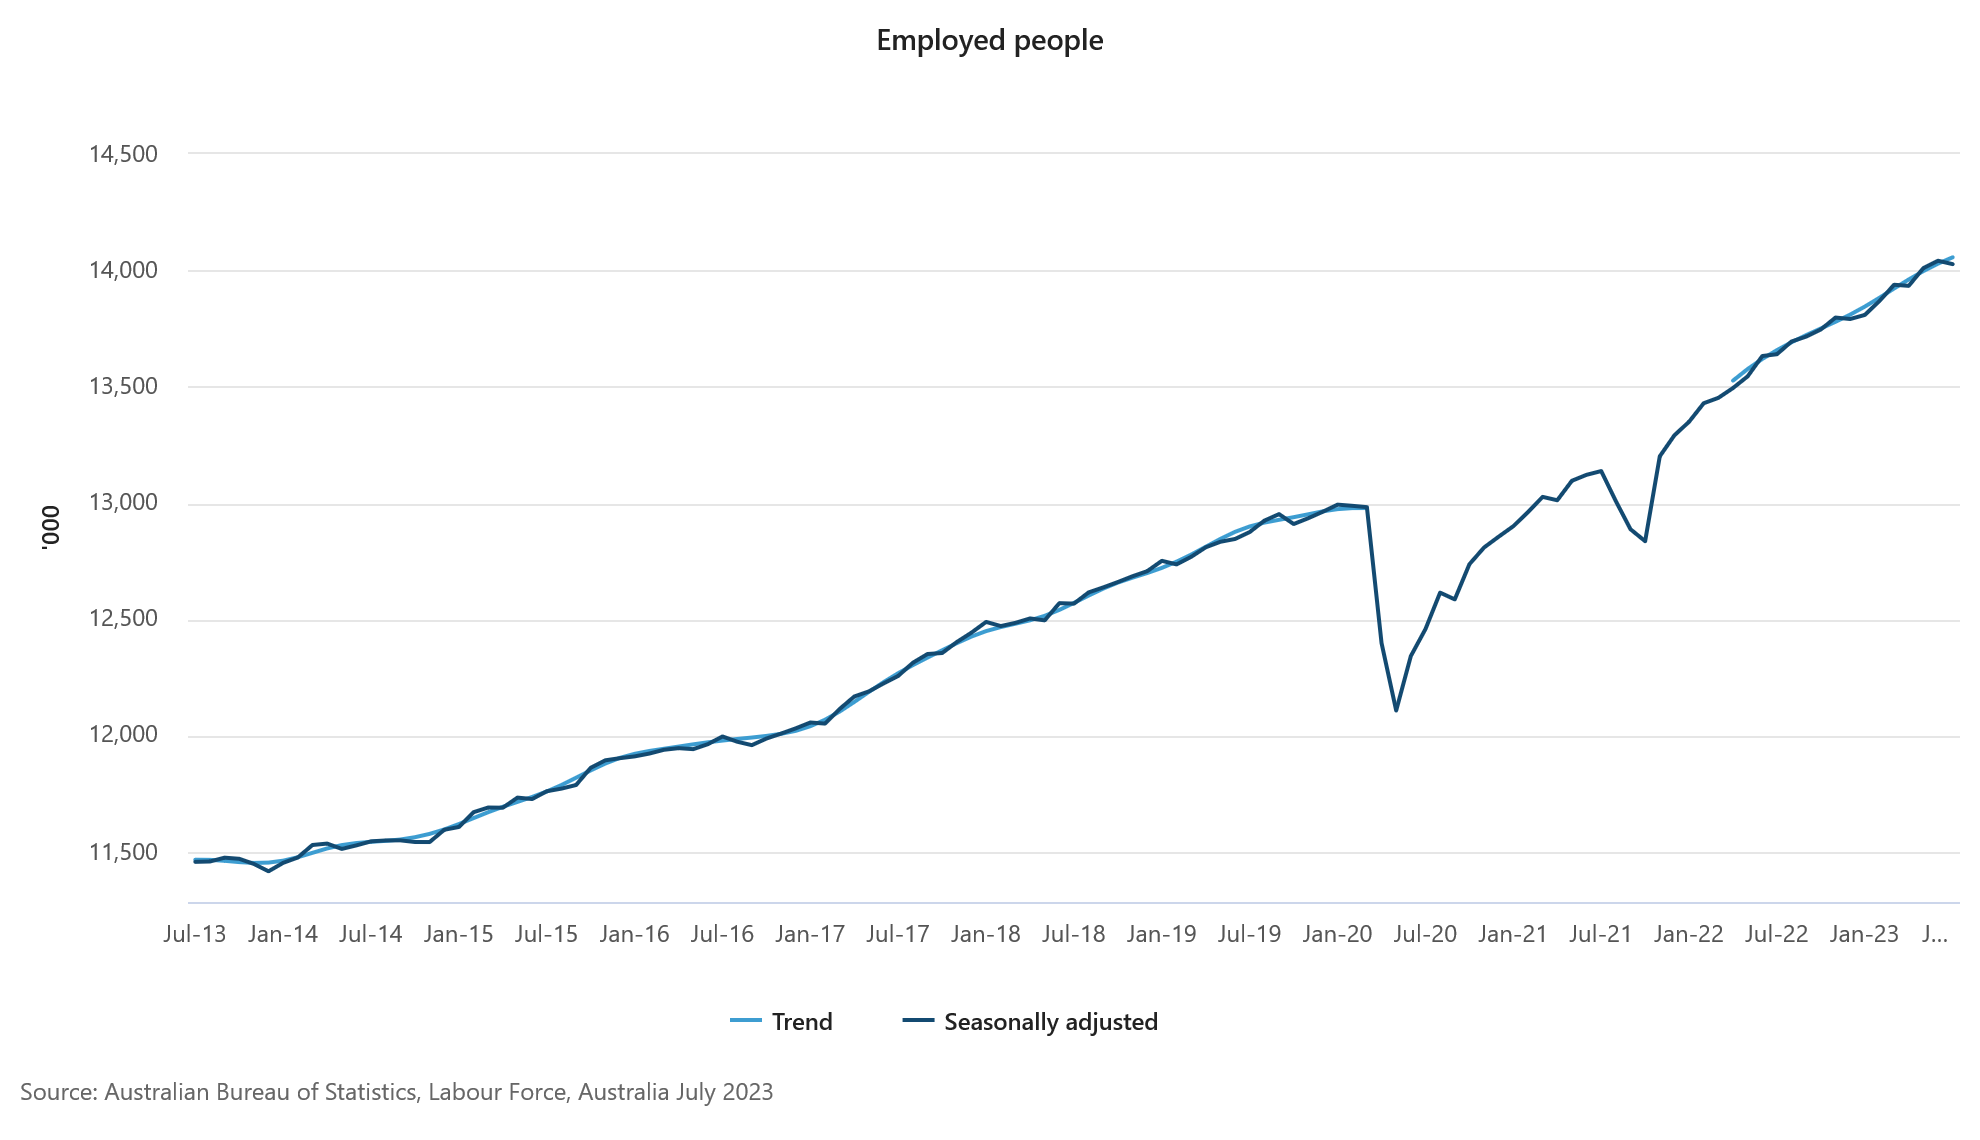
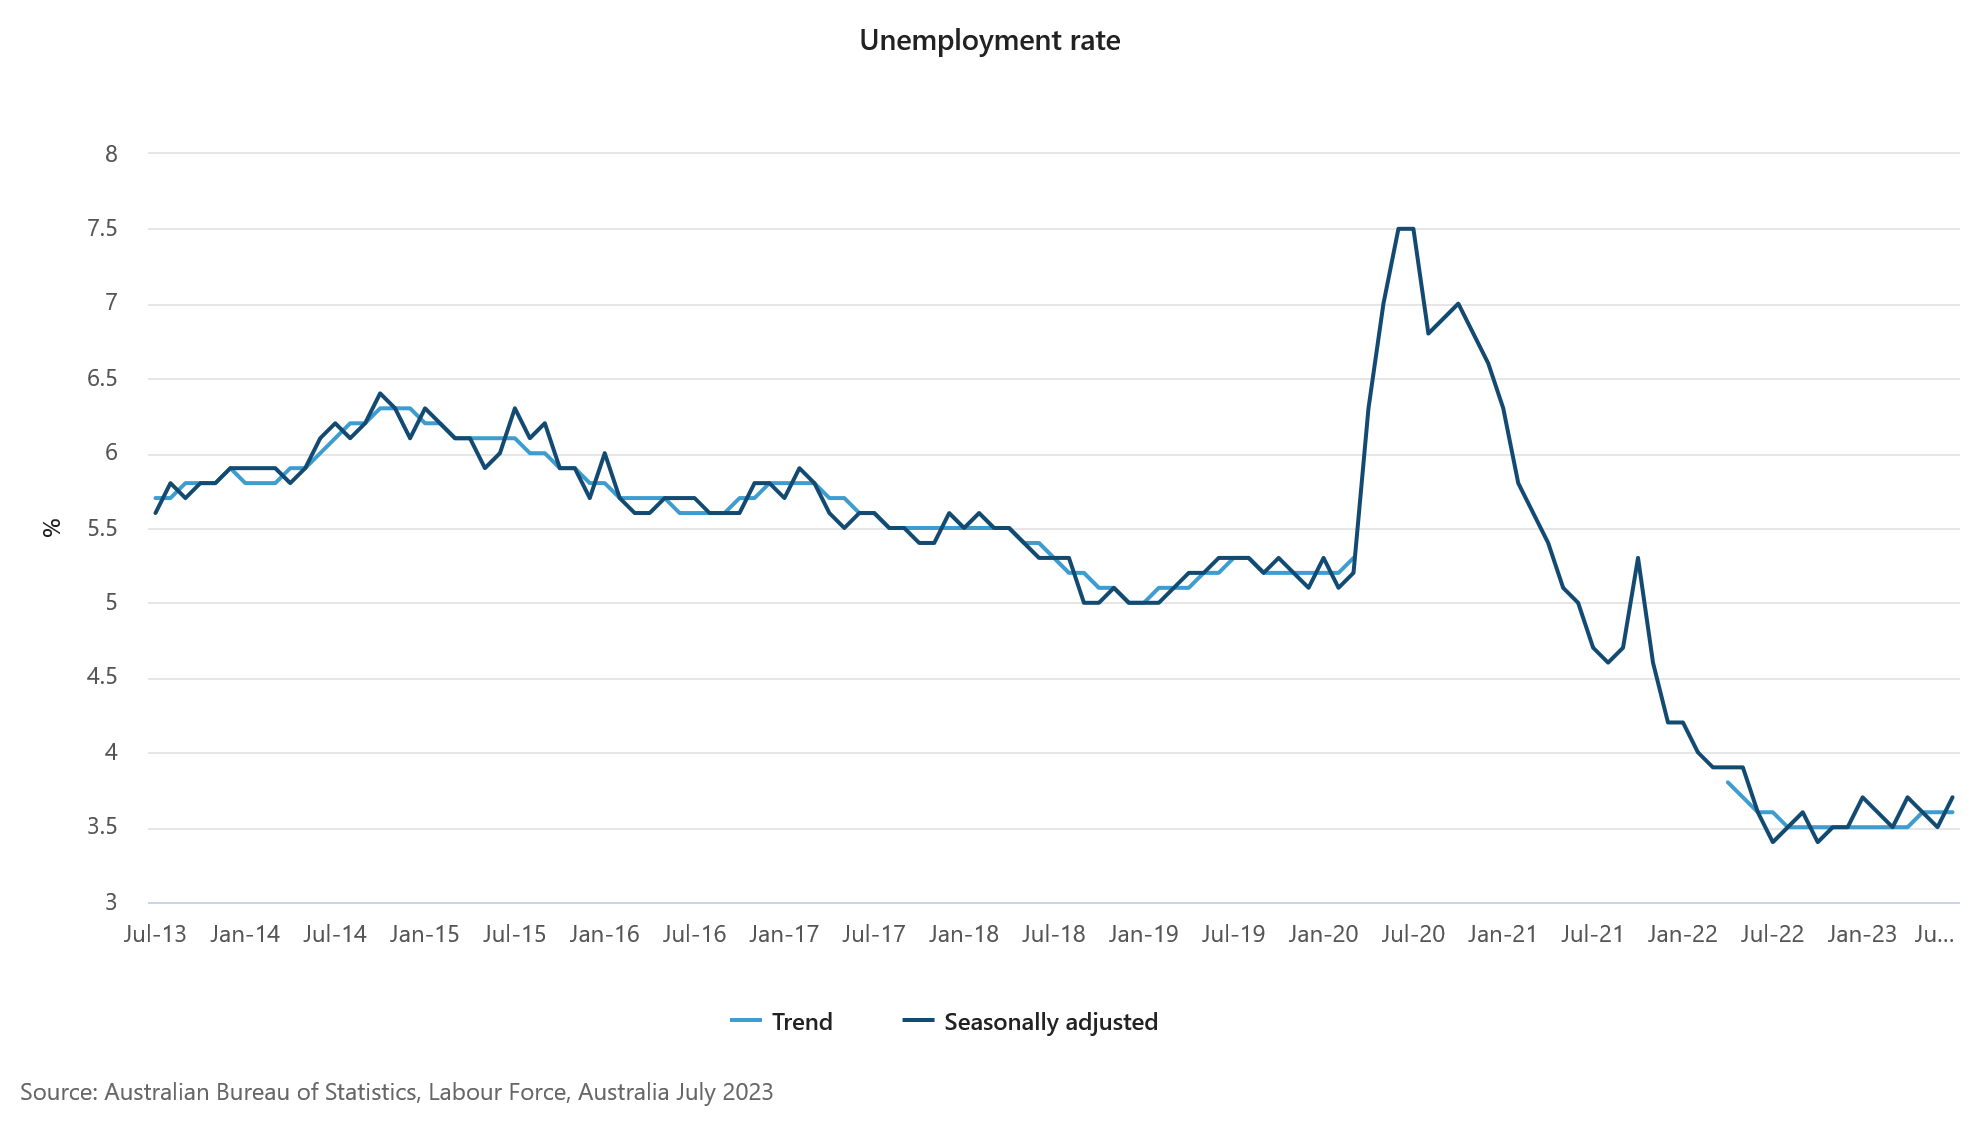
Australia witnessed a contraction in employment by -14.6k in July, starkly missing expectations of a 15.2k growth. This decline was majorly attributed to a drop in full-time jobs by -24.2k, even as part-time employment saw an increase of 9.6k.
Unemployment rate rose from 3.5% to 3.7%, surpassing market anticipations which had pinned it at 3.6%. The participation rate also registered a dip, moving from 66.8% to 66.7%.
However, it wasn't all bleak. Monthly hours worked showed a marginal increase of 0.2% mom. Commenting on this aspect, Bjorn Jarvis, ABS head of labour statistics, observed, "The strength in hours worked shows that it continues to be a tight labour market."
Jarvis pointed out that hours worked have risen by an impressive 5.2% compared to July 2022, a significant outperformance relative to the 2.8% annual increase in employment.
He further noted, "The strength in hours worked over the past year, relative to employment growth, shows the demand for labour is continuing to be met, to some extent, by people working more hours."
Bitcoin Price At Risk of Fresh Low Below $28,000
Key Highlights
- Bitcoin price is struggling to rise above the $30,000 resistance.
- A key bearish trend line is forming with resistance at $29,350 on the 4-hour chart.
- EUR/USD could face resistance near the 1.0980 zone.
- Gold prices extended losses and tested the $1,900 support.
Bitcoin Price Technical Analysis
Bitcoin price started a fresh decline from the $30,200 zone. BTC/USD traded below the $29,800 support to move again into a bearish zone.
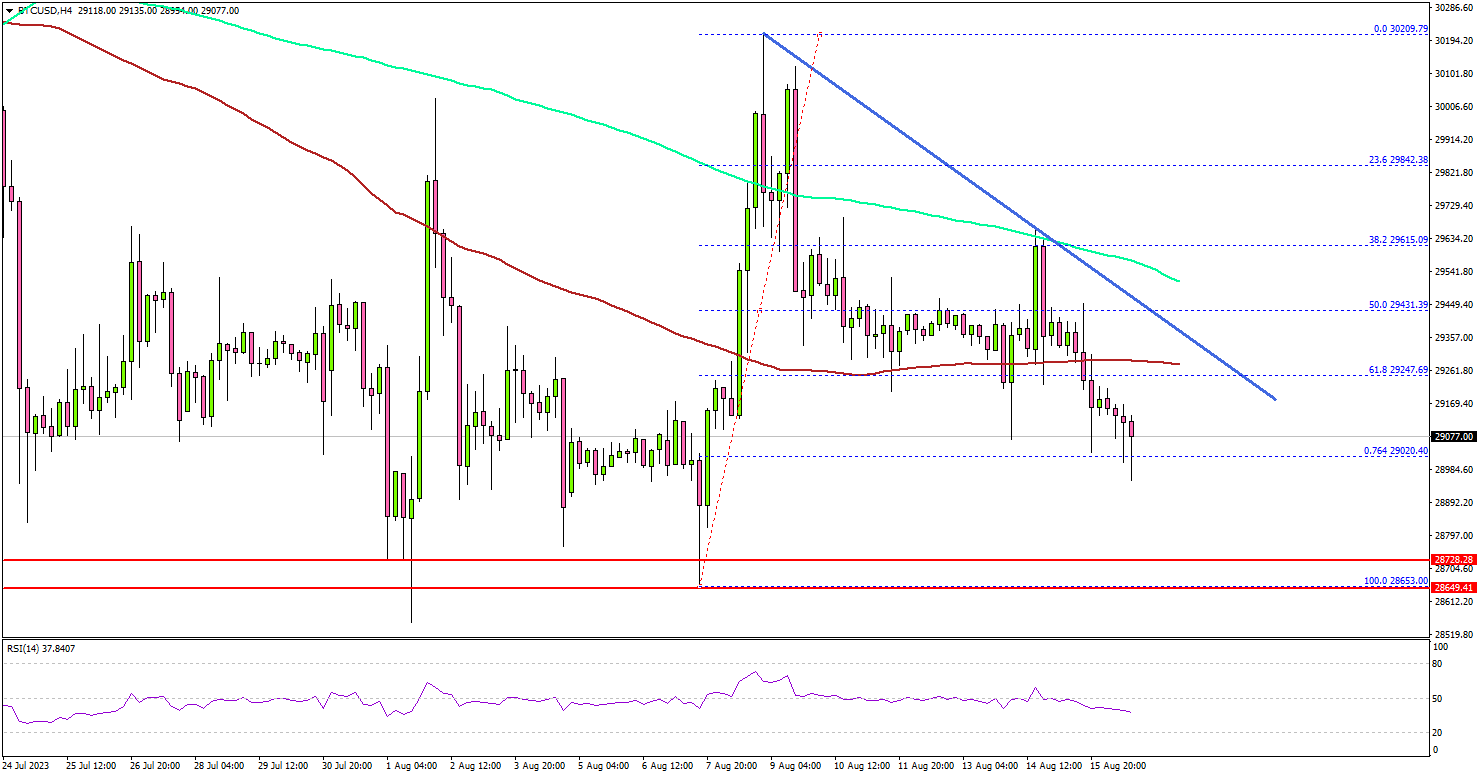
Looking at the 4-hour chart, the price settled below the $29,500 level, the 100 simple moving average (red, 4 hours), and the 200 simple moving average (green, 4 hours).
There was a move below the 61.8% Fib retracement level of the upward move from the $28,653 swing low to the $30,209 high. It is now showing bearish signs below $29,400. There is also a key bearish trend line forming with resistance at $29,350 on the same chart.
On the upside, the price is facing resistance near the $29,250 level and the 100 simple moving average (red, 4 hours). The first major resistance is near the $29,350 level.
A successful close above the $29,350 level might spark a decent increase. In the stated case, the price may perhaps rise toward the $30,000 level.
If not, Bitcoin might decline further and trade below the $29,000 support. The next major support is near the $28,500 level. If there is a downside break and a close below $28,500, Bitcoin might revisit the $27,500 zone in the coming days.
Economic Releases
- US Initial Jobless Claims - Forecast 240K, versus 248K previous.
RBNZ Orr: We don’t feel a rush to be changing rates anytime soon
In a Bloomberg TV interview, RBNZ Governor Adrian Orr indicated that a forthcoming mild recession is the "bare minium" for New Zealand, as "demand has been well outstripping the pace of the supply capacity."
"We need to see subdued consumer spending, business investment and government constraints on spending, these are a critical part of the inflation process," he added.
Orr also reiterated that interest rate will need to stay high for a period of time, as "we don't feel a rush to be changing rates anytime soon."
"We believe if we stay where we are for long enough, inflation will be back inside the target band mid-next year and, and stay there," he added.
RBNZ projects OCR to peak at 5.59% in mid-2024, then retract slightly to 5.36% by early 2025. This suggests rate cuts might be off the table for about 18 months. Orr clarified that these figures are projections and "signal or constraint."
Hawkish tilt evident in FOMC minutes, yet rate hike skepticism remains
The minutes from FOMC meeting on July 25-26 signal a clear division within the committee regarding the path of future monetary tightening, with a slight inclination towards a hawkish stance.
Despite this, market anticipation for immediate rate adjustments remains tepid. Fed fund futures indicate an 86.5% chance that Fed will maintain the status quo in September, with less than 50% probability of a rate hike by year-end.
On the stock front, NASDAQ felt the heat, declining by 1.15%, possibly reacting to Fed's deliberations.
Within the minutes, one point was underscored: "With inflation still well above the Committee's longer-run goal and the labor market remaining tight, most participants continued to see significant upside risks to inflation."
Yet, counterpoints highlighted potential economic vulnerabilities and concerns about unemployment, with some members noting, "there continued to be downside risks to economic activity and upside risks to the unemployment rate."
Additionally, a number of participants judged that risks to achieve inflation target "had become more two sided", and wanred of the risk of "inadvertent overtightening of policy against the cost of an insufficient tightening."
(FED) Minutes of the Federal Open Market Committee
July 25-26, 2023
A joint meeting of the Federal Open Market Committee and the Board of Governors of the Federal Reserve System was held in the offices of the Board of Governors on Tuesday, July 25, 2023, at 10:00 a.m. and continued on Wednesday, July 26, 2023, at 9:00 a.m.1
Attendance
Jerome H. Powell, Chair
John C. Williams, Vice Chair
Michael S. Barr
Michelle W. Bowman
Lisa D. Cook
Austan D. Goolsbee
Patrick Harker
Philip N. Jefferson
Neel Kashkari
Lorie K. Logan
Christopher J. Waller
Thomas I. Barkin, Raphael W. Bostic, Mary C. Daly, and Loretta J. Mester, Alternate Members of the Committee
Susan M. Collins, President of the Federal Reserve Bank of Boston
Kelly J. Dubbert and Kathleen O'Neill Paese, Interim Presidents of the Federal Reserve Banks of Kansas City and St. Louis, respectively
Joshua Gallin, Secretary
Brian J. Bonis, Assistant Secretary
Michelle A. Smith, Assistant Secretary
Mark E. Van Der Weide, General Counsel
Richard Ostrander, Deputy General Counsel
Trevor A. Reeve, Economist
Stacey Tevlin, Economist
Beth Anne Wilson, Economist
Shaghil Ahmed, James A. Clouse, Eric M. Engen, Anna Paulson, Andrea Raffo, and William Wascher, Associate Economists
Roberto Perli, Manager, System Open Market Account
Julie Ann Remache, Deputy Manager, System Open Market Account
David Altig, Executive Vice President, Federal Reserve Bank of Atlanta
Penelope A. Beattie,2 Section Chief, Office of the Secretary, Board
Brent Bundick, Senior Research and Policy Advisor, Federal Reserve Bank of Kansas City
Juan C. Climent, Special Adviser to the Board, Division of Board Members, Board
Stephanie E. Curcuru,3 Deputy Director, Division of International Finance, Board
Rochelle M. Edge, Deputy Director, Division of Monetary Affairs, Board
Matthew J. Eichner,4 Director, Division of Reserve Bank Operations and Payment Systems, Board
Eric C. Engstrom, Associate Director, Division of Monetary Affairs and Division of Research and Statistics, Board
Huberto M. Ennis, Group Vice President, Federal Reserve Bank of Richmond
Erin E. Ferris, Principal Economist, Division of Monetary Affairs, Board
Glenn Follette, Associate Director, Division of Research and Statistics, Board
Jennifer Gallagher, Assistant to the Board, Division of Board Members, Board
Peter M. Garavuso, Senior Information Manager, Division of Monetary Affairs, Board
Carlos Garriga, Senior Vice President, Federal Reserve Bank of St. Louis
Michael S. Gibson, Director, Division of Supervision and Regulation, Board
Christine Graham,5 Special Adviser to the Board, Division of Board Members, Board
Luca Guerrieri, Associate Director, Division of International Finance, Board
Christopher J. Gust, Associate Director, Division of Monetary Affairs, Board
Valerie S. Hinojosa, Section Chief, Division of Monetary Affairs, Board
Jane E. Ihrig, Special Adviser to the Board, Division of Board Members, Board
Callum Jones, Senior Economist, Division of Monetary Affairs, Board
Michael T. Kiley, Deputy Director, Division of Financial Stability, Board
David E. Lebow, Senior Associate Director, Division of Research and Statistics, Board
Sylvain Leduc, Director of Research, Federal Reserve Bank of San Francisco
Andreas Lehnert, Director, Division of Financial Stability, Board
Kurt F. Lewis, Special Adviser to the Board, Division of Board Members, Board
Dan Li, Assistant Director, Division of Monetary Affairs, Board
Laura Lipscomb, Special Adviser to the Board, Division of Board Members, Board
David López-Salido, Senior Associate Director, Division of Monetary Affairs, Board
Ann E. Misback, Secretary, Office of the Secretary, Board
Juan M. Morelli, Economist, Division of Monetary Affairs, Board
Norman J. Morin, Deputy Associate Director, Division of Research and Statistics, Board
Michelle M. Neal, Head of Markets, Federal Reserve Bank of New York
Edward Nelson, Senior Adviser, Division of Monetary Affairs, Board
Paolo A. Pesenti, Director of Monetary Policy Research, Federal Reserve Bank of New York
Damjan Pfajar, Group Manager, Division of Monetary Affairs, Board
Samuel Schulhofer-Wohl, Senior Vice President, Federal Reserve Bank of Dallas
Donald Keith Sill, Senior Vice President, Federal Reserve Bank of Philadelphia
Nitish Ranjan Sinha, Special Adviser to the Board, Division of Board Members, Board
Dafina Stewart, Special Adviser to the Board, Division of Board Members, Board
Gustavo A. Suarez, Assistant Director, Division of Research and Statistics, Board
Brett Takacs, Senior Communications Analyst, Division of Information Technology, Board
Jenny Tang, Vice President, Federal Reserve Bank of Boston
Willem Van Zandweghe, Assistant Vice President, Federal Reserve Bank of Cleveland
Annette Vissing-Jørgensen, Senior Adviser, Division of Monetary Affairs, Board
Jeffrey D. Walker,4 Associate Director, Division of Reserve Bank Operations and Payment Systems, Board
Paul R. Wood, Special Adviser to the Board, Division of Board Members, Board
Rebecca Zarutskie, Special Adviser to the Board, Division of Board Members, Board
Developments in Financial Markets and Open Market Operations
The manager turned first to a review of developments in financial markets over the intermeeting period. Market participants interpreted data releases as generally demonstrating economic resilience and a further easing of inflation pressures. The market-implied peak for the federal funds rate rose in response to data pointing to a robust economy but retraced part of that move after the June consumer price index (CPI) release was interpreted by market participants as softer than anticipated. Even as market prices shifted to indicate a slightly more restrictive expected policy path, broader financial conditions eased a bit, reflecting in large part gains in equity prices and tighter credit spreads. Notably, share prices for bank equity also appreciated over the intermeeting period as concerns about the banking sector continued to dissipate. Spot and forward measures of inflation compensation based on Treasury Inflation-Protected Securities were little changed over the intermeeting period at levels broadly consistent with the Committee's 2 percent longer-run goal, and longer-term survey- and market-based measures continued to point to inflation expectations being firmly anchored. Market-implied peak policy rates in most advanced foreign economies (AFEs) rose further this period, and the dollar depreciated modestly.
Respondents to the Open Market Desk's Survey of Primary Dealers and Survey of Market Participants in July continued to place significant probability of a recession occurring by the end of 2024. However, the timing of a recession expected by survey respondents was again pushed later, and the probability of avoiding a recession through 2024 grew noticeably. Survey respondents anticipated that both headline and core personal consumption expenditures (PCE) inflation will decline to 2 percent by the end of 2025.
There was a strong anticipation, evident in both market-based measures and responses to the Desk's surveys, that the Committee would raise the target range 25 basis points at the July FOMC meeting. Most survey respondents had a modal expectation that a July rate hike would be the last of this tightening cycle, although most respondents also perceived that additional monetary policy tightening after the July FOMC meeting was possible. As inferred from their responses, survey respondents expected real rates to increase through the first half of 2024 and to remain above their expectations for the long-run neutral levels for a few years.
The manager then turned to money market developments and policy implementation. The overnight reverse repurchase agreement (ON RRP) facility continued to work as intended over the intermeeting period and had been instrumental in providing an effective floor under the federal funds rate and supporting other money market rates; those rates remained stable over the period. Following the suspension of the debt ceiling in early June, the Treasury Department issued securities, notably Treasury bills, to replenish the Treasury General Account (TGA). The resulting greater availability of Treasury bills, which were priced at rates slightly above the current and expected ON RRP rates, induced a net decline in ON RRP balances for the period. A further decline in ON RRP balances was deemed probable amid sustained projected Treasury bill issuance, further reductions in the size of the Federal Reserve's balance sheet in accordance with the previously announced Plans for Reducing the Size of the Federal Reserve's Balance Sheet, and a possible further reduction in policy uncertainty that could incentivize money funds to extend the duration of their portfolios. In the July Desk Survey of Primary Dealers, respondents expected lower ON RRP balances and higher bank reserves by the end of the year, compared with the June survey.
By unanimous vote, the Committee ratified the Desk's domestic transactions over the intermeeting period. There were no intervention operations in foreign currencies for the System's account during the intermeeting period.
Staff Review of the Economic Situation
The information available at the time of the July 25–26 meeting suggested that real gross domestic product (GDP) rose at a moderate pace over the first half of the year. The labor market remained very tight, though the imbalance between demand and supply in the labor market was gradually diminishing. Consumer price inflation—as measured by the 12-month percent change in the price index for PCE—remained elevated in May, and available information suggested that inflation declined but remained elevated in June.
In the second quarter, total nonfarm payroll employment posted its slowest average monthly increase since the recovery began in mid-2020, though payroll gains remained robust compared with those seen before the pandemic. Similarly, the private-sector job openings rate, as measured by the Job Openings and Labor Turnover Survey, fell in May to its lowest level since March 2021 but remained well above pre-pandemic levels. The unemployment rate edged down to 3.6 percent in June, while the labor force participation rate and the employment-to-population ratio were both unchanged. The unemployment rates for African Americans and Hispanics, however, both rose and were well above the national average. Average hourly earnings rose 4.4 percent over the 12 months ending in June, compared with a year-earlier increase of 5.4 percent.
Consumer price inflation continued to show signs of easing but remained elevated. Total PCE price inflation was 3.8 percent over the 12 months ending in May, and core PCE price inflation, which excludes changes in energy prices and many consumer food prices, was 4.6 percent over the same period. The trimmed mean measure of 12-month PCE price inflation constructed by the Federal Reserve Bank of Dallas was 4.6 percent in May. In June, the 12‑month change in the CPI was 3.0 percent, while core CPI inflation was 4.8 percent over the same period. Measures of short-term inflation expectations had moved down alongside actual inflation but remained above pre-pandemic levels. In contrast, measures of medium- to longer-term inflation expectations were in the range seen in the decade before the pandemic.
Available indicators suggested that real GDP rose in the second quarter at a pace similar to the one posted in the first quarter. However, private domestic final purchases—which includes PCE, residential investment, and business fixed investment and which often provides a better signal of underlying economic momentum than does GDP—appeared to have decelerated in the second quarter. Manufacturing output rose in the second quarter, supported by a robust increase in motor vehicle production.
After falling sharply in April, real exports of goods picked up in May, led by higher exports of industrial supplies and automotive products. Real goods imports fell, as lower imports of consumer goods and industrial supplies more than offset higher imports of capital goods. The nominal U.S. international trade deficit narrowed, as a sharp decline in nominal imports of goods and services outpaced a decline in exports. The available data suggested that net exports subtracted from U.S. GDP growth in the second quarter.
Indicators of economic activity, such as purchasing managers indexes (PMIs), pointed to a step-down in the pace of foreign growth in the second quarter, reflecting fading of the impetus from China's reopening, continued anemic growth in Europe, some weakening of activity in Canada and Mexico, as well as weak external demand and the slump in the high-tech industry weighing on many Asian economies. Incoming data also indicated that global manufacturing activity remained weak during the intermeeting period.
Foreign headline inflation continued to fall, reflecting, in part, the pass-through of previous declines in commodity prices to retail energy and food prices. Core inflation edged down in many countries but generally remained high. In this context, and amid tight labor market conditions, many AFE central banks raised policy rates and underscored the need to raise rates further, or hold them at sufficiently restrictive levels, to bring inflation in their countries back to their targets. In contrast, central banks of emerging market economies largely remained on hold, and some indicated that a rate cut is possible at their next meeting.
Staff Review of the Financial Situation
Over the intermeeting period, market participants interpreted domestic economic data releases as indicating continued resilience of economic activity and some easing of inflationary pressures, and they viewed monetary policy communications as pointing to somewhat more restrictive policy than expected. The market-implied path for the federal funds rate rose modestly, and nominal Treasury yields increased somewhat at shorter maturities. Meanwhile, broad equity prices increased, and spreads on investment- and speculative-grade corporate bonds narrowed moderately. Financing conditions continued to be generally restrictive, and borrowing costs remained elevated.
Over the intermeeting period, the market-implied path for the federal funds rate rose modestly, while the timing of the path's slightly higher peak moved a little later, to just after the November meeting. Beyond this year, the policy rate path implied by overnight index swap (OIS) quotes ended the period modestly higher. Yields on Treasury securities increased modestly at shorter maturities but only a bit at longer maturities. Measures of inflation compensation rose only slightly for near-term and longer maturities. Measures of uncertainty about the path of the policy rate derived from interest rate options remained very elevated by historical standards.
Broad stock price indexes increased and spreads on investment- and speculative-grade corporate bonds narrowed moderately over the intermeeting period. The VIX—the one-month option-implied volatility on the S&P 500—edged down and ended the period near the 25th percentile of its historical distribution. Bank equity prices increased and outperformed the S&P 500 modestly. Stock prices for the largest banks fully recovered from their declines in the immediate wake of the failure of Silicon Valley Bank, while those for regional banks remained below the levels seen in early March.
Short-term interest rates in the AFEs increased modestly, on net, over the intermeeting period as foreign central banks continued to raise policy rates and signal the potential for further tightening. Increases in yields were tempered, however, by downside surprises to both inflation and PMIs from some economies. Risk sentiment in foreign markets improved somewhat, with most foreign equity indexes increasing and foreign corporate and emerging market sovereign bond spreads narrowing. The staff's trade-weighted broad dollar index declined moderately, with the largest moves following releases of weaker-than-expected U.S. labor market data and lower-than-expected U.S. inflation data.
Conditions in domestic short-term funding markets remained generally stable over the intermeeting period. Spreads in unsecured markets narrowed modestly amid slight increases in OIS rates. Following the suspension of the debt limit, the Treasury Department partly replenished the TGA via a large net increase in bill issuance. Auctions of Treasury bills were met with robust demand, as shorter-term bill yields increased relative to other money market rates. Money market funds increased their holdings of Treasury bills and reduced their investments with the ON RRP facility. ON RRP take-up declined notably—about $390 billion—over the intermeeting period, reflecting more attractive rates on some alternatives to investing in the ON RRP facility. Despite reduced ON RRP take-up, money funds maintained relatively high asset allocations in overnight repurchase agreement investments amid still-elevated uncertainty about the future path of policy.
In domestic credit markets, borrowing costs for businesses, households, and municipalities were little changed over the intermeeting period and remained elevated by historical standards. Yields on agency commercial mortgage-backed securities (CMBS) were little changed.
The banking sector's ability to fund loans to businesses and consumers was generally stable during the intermeeting period. Core deposit volumes at both large and other domestic banks held steady at the levels that they reached in early May, after having declined sharply in March and April amid the banking-sector turmoil. Banks continued to attract inflows of large time deposits, reflecting higher interest rates offered on new certificates of deposit. Meanwhile, wholesale borrowing—which primarily consists of advances from Federal Home Loan Banks, loans from the Bank Term Funding Program, and other credit extended by the Federal Reserve—had fallen since May by domestic banks of all sizes, partially reversing the surge at the onset of the bank turmoil in March.
Credit availability for businesses appeared to tighten somewhat in recent months. Credit from capital markets was somewhat subdued but overall remained accessible for larger corporations. Issuance of leveraged loans remained limited, reflecting low levels of leveraged buyout and merger and acquisition activity as well as weak investor demand. In the municipal bond market, gross issuance was solid in June, as both refundings and new capital issuance picked up from a somewhat subdued May. Commercial and industrial (C&I) loan balances contracted modestly in the second quarter, and commercial real estate (CRE) loan growth on banks' books continued to moderate.
In the July Senior Loan Officer Opinion Survey on Bank Lending Practices (SLOOS), banks reported having tightened standards and terms on C&I loans to firms of all sizes in the second quarter. The most cited reason for tightening C&I standards and terms continued to be concerns about the economic outlook. Banks also reported expecting to tighten C&I standards further over the remainder of the year.
The July SLOOS also indicated that standards across all CRE loan categories tightened further in the second quarter and that banks expected to tighten CRE standards further over the second half of the year. Meanwhile, CMBS issuance picked up a bit in May and then ticked down in June after recording low volumes earlier in the year.
Credit in the residential mortgage market remained broadly available for high-credit-score borrowers who met standard conforming loan criteria. Only modest net percentages of banks in the July SLOOS reported tightening standards for mortgage loans eligible to be purchased by government-sponsored enterprises, while a moderate net percentage of banks reported expecting to tighten lending standards further for these loans over the second half of the year. Meanwhile, the availability of mortgage credit remained tighter for households with lower credit scores, at levels close to those prevailing before the pandemic. Banks reported in the SLOOS that they had tightened standards for certain categories of residential real estate loans to be held on their balance sheets, such as jumbo loans and home equity lines of credit. In addition, banks reported expecting to tighten standards for jumbo loans during the remainder of 2023.
Conditions remained generally accommodative in consumer credit markets, with credit available for most borrowers. Credit card balances increased in the second quarter, though at a somewhat slower pace than in previous months. In the July SLOOS, banks reported expecting to continue tightening lending standards for credit card loans.
Overall, the credit quality of most businesses and households remained solid. While there were signs of deterioration in credit quality in some sectors, such as the office segment of CRE, delinquency rates generally remained near their pre-pandemic lows. The credit quality of C&I and CRE loans on banks' balance sheets remained sound as of the end of the first quarter of 2023. However, in the July SLOOS, banks frequently cited concerns about the credit quality of both CRE and other loans as reasons for expecting to tighten their lending standards over the remainder of the year. Aggregate delinquency rates on pools of commercial mortgages backing CMBS increased in May and June.
The staff provided an update on its assessment of the stability of the financial system and, on balance, characterized the financial vulnerabilities of the U.S. financial system as notable. The staff judged that asset valuation pressures remained notable. In particular, measures of valuations in both residential and commercial property markets remained high relative to fundamentals. House prices, while having cooled earlier this year, started to rise again, and price-to-rent ratios remained at elevated levels and near those seen in the mid-2000s. Although commercial property prices moved down, developments in the CRE sector following the pandemic may have produced a permanent shift away from traditional working patterns. If so, fundamentals in the sector could decline notably and contribute to a deterioration in credit quality.
The staff assessed that vulnerabilities associated with household and nonfinancial business leverage remained moderate overall. Aggregate household debt growth remained in line with income growth. While nonfinancial businesses remained highly leveraged and thus vulnerable to shocks, firms' debt growth has been relatively subdued recently, and their ability to service that debt has been quite high, even among lower-rated firms. Leverage in the financial sector was characterized as notable. In the banking sector, regulatory risk-based capital ratios showed the system remained well capitalized. However, while the overall banking system retained ample loss-bearing capacity, some banks experienced sizable declines in the fair value of their assets as a consequence of rising interest rates. Vulnerabilities associated with funding risks were also characterized as notable. Although a small number of banks saw notable outflows of deposits late in the first quarter and early in the second quarter, deposit flows later stabilized.
Staff Economic Outlook
The economic forecast prepared by the staff for the July FOMC meeting was stronger than the June projection. Since the emergence of stress in the banking sector in mid-March, indicators of spending and real activity had come in stronger than anticipated; as a result, the staff no longer judged that the economy would enter a mild recession toward the end of the year. However, the staff continued to expect that real GDP growth in 2024 and 2025 would run below their estimate of potential output growth, leading to a small increase in the unemployment rate relative to its current level.
The staff continued to project that total and core PCE price inflation would move lower in coming years. Much of the step-down in core inflation was expected to occur over the second half of 2023, with forward-looking indicators pointing to a slowing in the rate of increase of housing services prices and with core nonhousing services prices and core goods prices expected to decelerate over the remainder of 2023. Inflation was anticipated to ease further over 2024 as demand–supply imbalances continued to resolve; by 2025, total PCE price inflation was expected to be 2.2 percent, and core inflation was expected to be 2.3 percent.
The staff continued to judge that the risks to the baseline projection for real activity were tilted to the downside. Risks to the staff's baseline inflation forecast were seen as skewed to the upside, given the possibility that inflation dynamics would prove to be more persistent than expected or that further adverse shocks to supply conditions might occur. Moreover, the additional monetary policy tightening that would be necessitated by higher or more persistent inflation represented a downside risk to the projection for real activity.
Participants' Views on Current Conditions and the Economic Outlook
In their discussion of current economic conditions, participants noted that economic activity had been expanding at a moderate pace. Job gains had been robust in recent months, and the unemployment rate remained low. Inflation remained elevated. Participants agreed that the U.S. banking system was sound and resilient. They commented that tighter credit conditions for households and businesses were likely to weigh on economic activity, hiring, and inflation. However, participants agreed that the extent of these effects remained uncertain. Against this background, the Committee remained highly attentive to inflation risks.
In assessing the economic outlook, participants noted that real GDP growth had continued to exhibit resilience in the first half of the year and that the economy had been showing considerable momentum. A gradual slowdown in economic activity nevertheless appeared to be in progress, consistent with the restraint placed on demand by the cumulative tightening of monetary policy since early last year and the associated effects on financial conditions. Participants remarked on the uncertainty about the lags in the effects of monetary policy on the economy and discussed the extent to which the effects on the economy stemming from the tightening that the Committee had undertaken had already materialized. Participants commented that monetary policy tightening appeared to be working broadly as intended and that a continued gradual slowing in real GDP growth would help reduce demand–supply imbalances in the economy. Participants assessed that the ongoing tightening of credit conditions in the banking sector, as evidenced in the most recent surveys of banks, also would likely weigh on economic activity in coming quarters. Participants noted the recent reduction in total and core inflation rates. However, they stressed that inflation remained unacceptably high and that further evidence would be required for them to be confident that inflation was clearly on a path toward the Committee's 2 percent objective. Participants continued to view a period of below-trend growth in real GDP and some softening in labor market conditions as needed to bring aggregate supply and aggregate demand into better balance and reduce inflation pressures sufficiently to return inflation to 2 percent over time.
Participants noted that consumer spending had recently exhibited considerable resilience, underpinned by, in aggregate, strong household balance sheets, robust job and income gains, a low unemployment rate, and rising consumer confidence. Nevertheless, tight financial conditions, primarily reflecting the cumulative effect of the Committee's shift to a restrictive policy stance, were expected to contribute to slower growth in consumption in the period ahead. Participants cited other factors that were likely leading to, or appeared consistent with, a slowdown in consumption, including the declining stock of excess savings, softening labor market conditions, and increased price sensitivity on the part of customers. Some participants observed that recent increases in home prices suggested that the housing sector's response to monetary policy restraint may have peaked.
In their discussion of the business sector, participants cited various improvements in firms' cost structures. These included better-functioning supply chains, lower input costs, and an increased ability to hire and retain workers. Participants also discussed conditions that could lead to higher economic activity—such as leaner inventories and reduced expectations of a sharp economic slowdown—and factors that could lead to lower economic activity—such as continuing economic uncertainty, the vulnerabilities of the CRE market, and the ongoing weakness of manufacturing output. Participants judged that, over coming quarters, firms would reduce the pace of their investment spending and hiring in response to tight financial conditions and the slowing of economic activity.
Participants remarked that the labor market continued to be very tight but pointed to signs that demand and supply were coming into better balance. They noted evidence that labor demand was easing—including declines in job openings, lower quits rates, more part-time work, slower growth in hours worked, higher unemployment insurance claims, and more moderate rates of nominal wage growth. In addition, they remarked on indications of increasing labor supply, including a further rise in the prime-age participation rate to a post-pandemic high. Participants also observed, however, that although growth in payrolls had slowed recently, it continued to exceed values consistent over time with an unchanged unemployment rate, and that nominal wages were still rising at rates above levels assessed to be consistent with the sustained achievement of the Committee's 2 percent inflation objective. Participants judged that further progress toward a balancing of demand and supply in the labor market was needed, and they expected that additional softening in labor market conditions would take place over time.
Participants cited a number of tentative signs that inflation pressures could be abating. These signs included some softening in core goods prices, lower online prices, evidence that firms were raising prices by smaller amounts than previously, slower increases in shelter prices, and recent declines in survey estimates of shorter-term inflation expectations and of inflation uncertainty. Various participants discussed the continued stability of longer-term inflation expectations at levels consistent with 2 percent inflation over time and the role that the Committee's policy tightening had played in delivering this outcome. Nonetheless, several participants commented that significant disinflationary pressures had yet to become apparent in the prices of core services excluding housing.
Participants observed that, notwithstanding recent favorable developments, inflation remained well above the Committee's 2 percent longer-term objective and that elevated inflation was continuing to harm businesses and households—low-income families in particular. Participants stressed that the Committee would need to see more data on inflation and further signs that aggregate demand and aggregate supply were moving into better balance to be confident that inflation pressures were abating and that inflation was on course to return to 2 percent over time.
Participants generally noted a high degree of uncertainty regarding the cumulative effects on the economy of past monetary policy tightening. Participants cited upside risks to inflation, including those associated with scenarios in which recent supply chain improvements and favorable commodity price trends did not continue or in which aggregate demand failed to slow by an amount sufficient to restore price stability over time, possibly leading to more persistent elevated inflation or an unanchoring of inflation expectations. In discussing downside risks to economic activity and inflation, participants considered the possibility that the cumulative tightening of monetary policy could lead to a sharper slowdown in the economy than expected, as well as the possibility that the effects of the tightening of bank credit conditions could prove more substantial than anticipated.
In their discussion of financial stability, participants observed that the banking system was sound and resilient and that banking stress had calmed in recent months. Participants also noted that the most recent stress-test results indicated that large banks appeared to be well positioned to withstand a severe recession. Various participants commented on risks that could affect some banks, including unrealized losses on assets resulting from rising interest rates, significant reliance on uninsured deposits, and increased funding costs. Participants also commented on risks associated with a potential sharp decline in CRE valuations that could adversely affect some banks and other financial institutions, such as insurance companies, that are heavily exposed to CRE. Several participants noted the susceptibility of some nonbank financial institutions, such as money market funds or digital asset entities, to runs or instability. In addition, several participants emphasized the need for banks to establish readiness to use Federal Reserve liquidity facilities and for the Federal Reserve to ensure its own readiness to provide liquidity during periods of stress.
In their consideration of appropriate monetary policy actions at this meeting, participants concurred that economic activity had been expanding at a moderate pace. The labor market remained very tight, with robust job gains in recent months and the unemployment rate still low, but there were continuing signs that supply and demand in the labor market were coming into better balance. Participants also noted that tighter credit conditions facing households and businesses were a source of headwinds for the economy and would likely weigh on economic activity, hiring, and inflation. However, the extent of these effects remained uncertain. Although inflation had moderated since the middle of last year, it remained well above the Committee's longer-run goal of 2 percent, and participants remained resolute in their commitment to bring inflation down to the Committee's 2 percent objective. Amid these economic conditions, almost all participants judged it appropriate to raise the target range for the federal funds rate to 5-1/4 to 5-1/2 percent at this meeting. Participants noted that this action would put the stance of monetary policy further into restrictive territory, consistent with reducing demand–supply imbalances in the economy and helping to restore price stability. A couple of participants indicated that they favored leaving the target range for the federal funds rate unchanged or that they could have supported such a proposal. They judged that maintaining the current degree of restrictiveness at this time would likely result in further progress toward the Committee's goals while allowing the Committee time to further evaluate this progress. All participants agreed that it was appropriate to continue the process of reducing the Federal Reserve's securities holdings, as described in its previously announced Plans for Reducing the Size of the Federal Reserve's Balance Sheet. A number of participants noted that balance sheet runoff need not end when the Committee eventually begins to reduce the target range for the federal funds rate.
In discussing the policy outlook, participants continued to judge that it was critical that the stance of monetary policy be sufficiently restrictive to return inflation to the Committee's 2 percent objective over time. They noted that uncertainty about the economic outlook remained elevated and agreed that policy decisions at future meetings should depend on the totality of the incoming information and its implications for the economic outlook and inflation as well as for the balance of risks. Participants expected that the data arriving in coming months would help clarify the extent to which the disinflation process was continuing and product and labor markets were reaching a better balance between demand and supply. This information would be valuable in determining the extent of additional policy firming that may be appropriate to return inflation to 2 percent over time. Participants also emphasized the importance of communicating as clearly as possible about the Committee's data-dependent approach to policy and its firm commitment to bring inflation down to its 2 percent objective.
Participants discussed several risk-management considerations that could bear on future policy decisions. With inflation still well above the Committee's longer-run goal and the labor market remaining tight, most participants continued to see significant upside risks to inflation, which could require further tightening of monetary policy. Some participants commented that even though economic activity had been resilient and the labor market had remained strong, there continued to be downside risks to economic activity and upside risks to the unemployment rate; these included the possibility that the macroeconomic effects of the tightening in financial conditions since the beginning of last year could prove more substantial than anticipated. A number of participants judged that, with the stance of monetary policy in restrictive territory, risks to the achievement of the Committee's goals had become more two sided, and it was important that the Committee's decisions balance the risk of an inadvertent overtightening of policy against the cost of an insufficient tightening.
Committee Policy Actions
In their discussion of monetary policy for this meeting, members agreed that economic activity had been expanding at a moderate pace. They also concurred that job gains had been robust in recent months, and the unemployment rate had remained low. Inflation had remained elevated.
Members concurred that the U.S. banking system was sound and resilient. They also agreed that tighter credit conditions for households and businesses were likely to weigh on economic activity, hiring, and inflation but that the extent of these effects was uncertain. Members also concurred that they remained highly attentive to inflation risks.
In support of the Committee's objectives to achieve maximum employment and inflation at the rate of 2 percent over the longer run, members agreed to raise the target range for the federal funds rate to 5-1/4 to 5-1/2 percent. They also agreed that they would continue to assess additional information and its implications for monetary policy. In determining the extent of additional policy firming that may be appropriate to return inflation to 2 percent over time, members concurred that they will take into account the cumulative tightening of monetary policy, the lags with which monetary policy affects economic activity and inflation, and economic and financial developments. In addition, members agreed to continue to reduce the Federal Reserve's holdings of Treasury securities and agency debt and agency mortgage-backed securities, as described in its previously announced plans. All members affirmed that they are strongly committed to returning inflation to their 2 percent objective.
Members agreed that, in assessing the appropriate stance of monetary policy, they would continue to monitor the implications of incoming information for the economic outlook. They would be prepared to adjust the stance of monetary policy as appropriate if risks emerge that could impede the attainment of the Committee's goals. Members also agreed that their assessments will take into account a wide range of information, including readings on labor market conditions, inflation pressures and inflation expectations, and financial and international developments.
At the conclusion of the discussion, the Committee voted to direct the Federal Reserve Bank of New York, until instructed otherwise, to execute transactions in the System Open Market Account in accordance with the following domestic policy directive, for release at 2:00 p.m.:
"Effective July 27, 2023, the Federal Open Market Committee directs the Desk to:
- Undertake open market operations as necessary to maintain the federal funds rate in a target range of 5-1/4 to 5-1/2 percent.
- Conduct standing overnight repurchase agreement operations with a minimum bid rate of 5.5 percent and with an aggregate operation limit of $500 billion.
- Conduct standing overnight reverse repurchase agreement operations at an offering rate of 5.3 percent and with a per-counterparty limit of $160 billion per day.
- Roll over at auction the amount of principal payments from the Federal Reserve's holdings of Treasury securities maturing in each calendar month that exceeds a cap of $60 billion per month. Redeem Treasury coupon securities up to this monthly cap and Treasury bills to the extent that coupon principal payments are less than the monthly cap.
- Reinvest into agency mortgage-backed securities (MBS) the amount of principal payments from the Federal Reserve's holdings of agency debt and agency MBS received in each calendar month that exceeds a cap of $35 billion per month.
- Allow modest deviations from stated amounts for reinvestments, if needed for operational reasons.
- Engage in dollar roll and coupon swap transactions as necessary to facilitate settlement of the Federal Reserve's agency MBS transactions."
The vote also encompassed approval of the statement below for release at 2:00 p.m.:
"Recent indicators suggest that economic activity has been expanding at a moderate pace. Job gains have been robust in recent months, and the unemployment rate has remained low. Inflation remains elevated.
The U.S. banking system is sound and resilient. Tighter credit conditions for households and businesses are likely to weigh on economic activity, hiring, and inflation. The extent of these effects remains uncertain. The Committee remains highly attentive to inflation risks.
The Committee seeks to achieve maximum employment and inflation at the rate of 2 percent over the longer run. In support of these goals, the Committee decided to raise the target range for the federal funds rate to 5-1/4 to 5-1/2 percent. The Committee will continue to assess additional information and its implications for monetary policy. In determining the extent of additional policy firming that may be appropriate to return inflation to 2 percent over time, the Committee will take into account the cumulative tightening of monetary policy, the lags with which monetary policy affects economic activity and inflation, and economic and financial developments. In addition, the Committee will continue reducing its holdings of Treasury securities and agency debt and agency mortgage-backed securities, as described in its previously announced plans. The Committee is strongly committed to returning inflation to its 2 percent objective.
In assessing the appropriate stance of monetary policy, the Committee will continue to monitor the implications of incoming information for the economic outlook. The Committee would be prepared to adjust the stance of monetary policy as appropriate if risks emerge that could impede the attainment of the Committee's goals. The Committee's assessments will take into account a wide range of information, including readings on labor market conditions, inflation pressures and inflation expectations, and financial and international developments."
Voting for this action: Jerome H. Powell, John C. Williams, Michael S. Barr, Michelle W. Bowman, Lisa D. Cook, Austan D. Goolsbee, Patrick Harker, Philip N. Jefferson, Neel Kashkari, Lorie K. Logan, and Christopher J. Waller.
Voting against this action: None.
To support the Committee's decision to raise the target range for the federal funds rate, the Board of Governors of the Federal Reserve System voted unanimously to raise the interest rate paid on reserve balances to 5.4 percent, effective July 27, 2023. The Board of Governors of the Federal Reserve System voted unanimously to approve a 1/4 percentage point increase in the primary credit rate to 5.5 percent, effective July 27, 2023.6
It was agreed that the next meeting of the Committee would be held on Tuesday–Wednesday, September 19–20, 2023. The meeting adjourned at 10:05 a.m. on July 26, 2023.
Notation Vote
By notation vote completed on July 3, 2023, the Committee unanimously approved the minutes of the Committee meeting held on June 13–14, 2023.
_______________________
Joshua Gallin
Secretary
1. The Federal Open Market Committee is referenced as the "FOMC" and the "Committee" in these minutes; the Board of Governors of the Federal Reserve System is referenced as the "Board" in these minutes. Return to text
2. Attended through the discussion of the economic and financial situation and all of Wednesday's session. Return to text
3. Attended Tuesday's session only. Return to text
4. Attended through the discussion of developments in financial markets and open market operations. Return to text
5. Attended through the discussion of the economic and financial situation. Return to text
6. In taking this action, the Board approved requests to establish that rate submitted by the Boards of Directors of the Federal Reserve Banks of Boston, Philadelphia, Cleveland, Richmond, Chicago, St. Louis, Minneapolis, Kansas City, Dallas, and San Francisco. The vote also encompassed approval by the Board of Governors of the establishment of a 5.5 percent primary credit rate by the remaining Federal Reserve Banks, effective on the later of July 27, 2023, or the date such Reserve Banks inform the Secretary of the Board of such a request. (Secretary's note: Subsequently, the Federal Reserve Banks of New York and Atlanta were informed of the Board's approval of their establishment of a primary credit rate of 5.5 percent, effective July 27, 2023.) Return to text
AUDUSD Wave Analysis
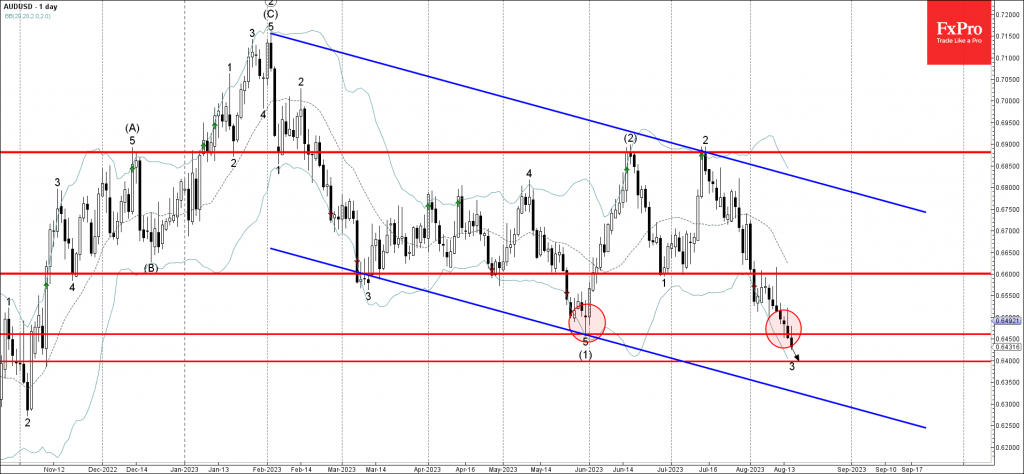
- AUDUSD broke support level 0.6460
- Likely to fall to support level 0.6400
AUDUSD currency pair under the bearish pressure after breaking below the key support level 0.6460 (which stopped the previous intermediate impulse wave (1) at the end of May).
The breakout of the support level 0.6460 accelerated the active impulse wave 3 of the higher impulse wave (3) from June.
Given the clear daily downtrend and strong USD gains, AUDUSD can be expected to fall further toward the next support level 0.6400 (target price for the completion of the active impulse wave 3).