Sample Category Title
No Summer Lull for Global Equities
- Bullish breakout seen in US Treasury 10-year yield above 3.90%, next resistance at 4.46%.
- Long-duration assets (fixed income & growth stocks) sold off and underperformed in the past two days.
- Record low level of implied correlation among S&P 500 stocks may lead to a spike in VIX.
- Asian stocks underperformed reinforced by a weak yuan despite subtle interventions by PBoC.
Déjà vu, it’s all about government bond yields again
In the past two days, we have seen several significant movements in the global financial markets. First, let’s start with the sovereign bond yields, which are considered the all-important “risk-free” interest rates to be used as a benchmark to price a wide myriad of financial instruments from plain-vanilla corporate, consumer loans to exotic structured products that involve derivatives. Hence, any big moves in these “risk-free” interest rates will have a huge ripple effect and may trigger abrupt vibration across cross-assets.
Since the start of June 2023, sovereign bond yields across the curve (different maturities) have started to revert to their respective medium-term uptrend phases with the shorter-dated yields rising a higher magnitude over their long-term dated peers reinforced by “higher interest rates for longer-periods” monetary policies guidance advocated major developed central banks with the exception in Japan and China.
Long-dated sovereign yields increased at a faster rate than shorter-dated yields
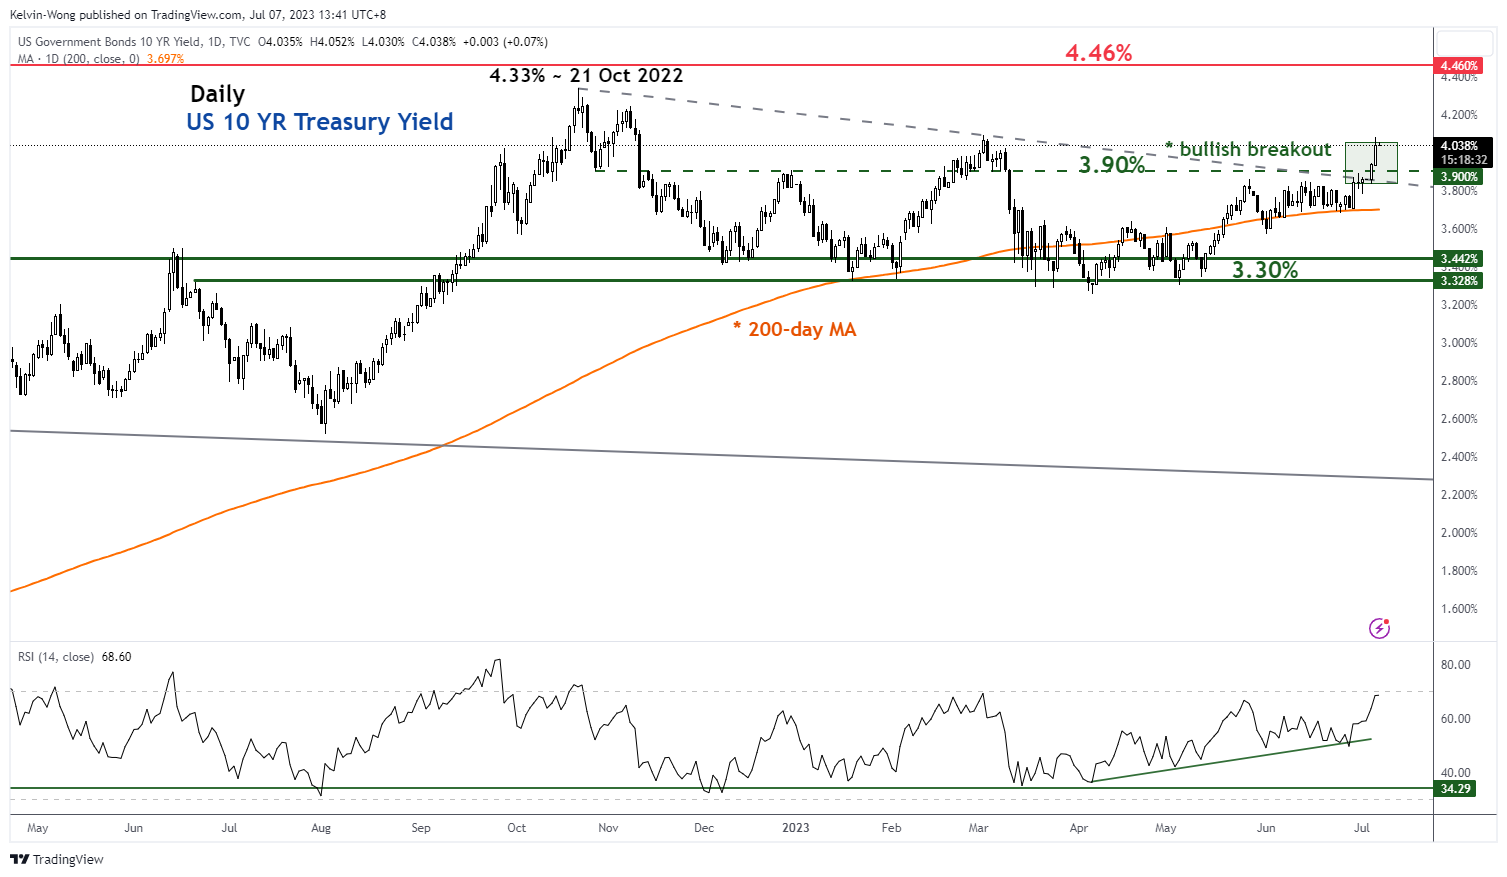
Fig 1: US Treasury 10-year yield medium-term trend as of 7 Jul 2023 (Source: TradingView, click to enlarge chart)
Interestingly in the past two days, the pendulum has shifted where the momentum of the longer-dated yields rose at a faster pace; the US Treasury 10-year yield rallied by 18 basis points (bps) versus the 2-year yield with a gain of 8 bps. It is likely to be triggered by flows and technical factors where the US Treasury 10-year yield has finally managed to clear a key intermediate resistance level of 3.90% on Wednesday, 5 July which has capped its prior price actions within a range-bound environment since 21 October 2022.
Duration risk and implied volatilities increase
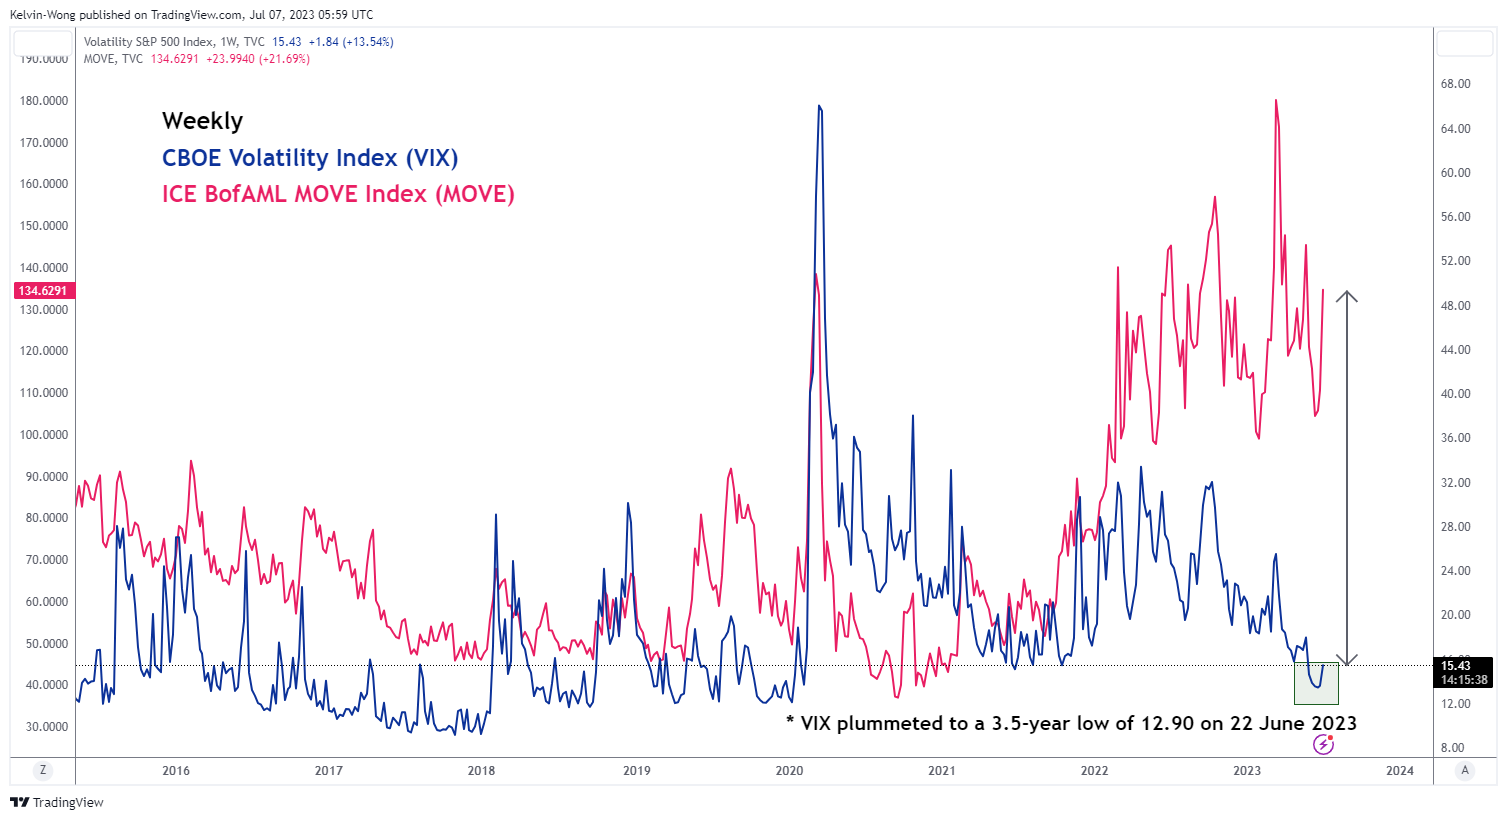
Fig 2: CBOE VIX & ICE BofAML MOVE as of 6 Jul 2023 (Source: TradingView, click to enlarge chart)
Duration risk embedded in long-duration financial assets has increased due to changes in the potential repricing behaviour of market participants. Longer-dated bonds sold off and long-duration growth equities that tend not to have stable or negligible dividend payouts underperformed.
The iShares US 20+ year Treasury Bond exchange-traded fund dropped by -2.33% in the past two days to its lowest level last seen in late December 2022. Over the same period in the equities space, the Russell 2000 consists of small-caps declined by 2.88% and semiconductors, a key emerging technology sector theme play that rallied by 45% in the first six months of this year fuelled by the optimism in artificial intelligence’s future productivity gains for the economy shed -3.44% seen in the iShares PHLX Semiconductor exchange-traded fund.
The ICE BofAML MOVE Index which tracks the aggregate US Treasuries’ yield implied volatility across different maturities via options has jumped by 35% from Monday, 3 July to a level not seen early March this year before the flared up of US regional banks turmoil. Hence, US banking stocks also took a severe beating in the last two trading sessions where the SPDR S&P Bank and Regional Banking exchange-traded funds declined by -2.89% and -2.92% respectively due to heightened fears of duration risk mismatch in their balance sheets.
In general, equities’ implied volatility inferred from the CBOE VIX index has started to tick up as well but at a lower magnitude, it has jumped up to 15.43 from a 3.5-year low of 12.90 printed on 22 June 2023.
Low correlation among S&P 500 constituents may lead to a further spike in VIX
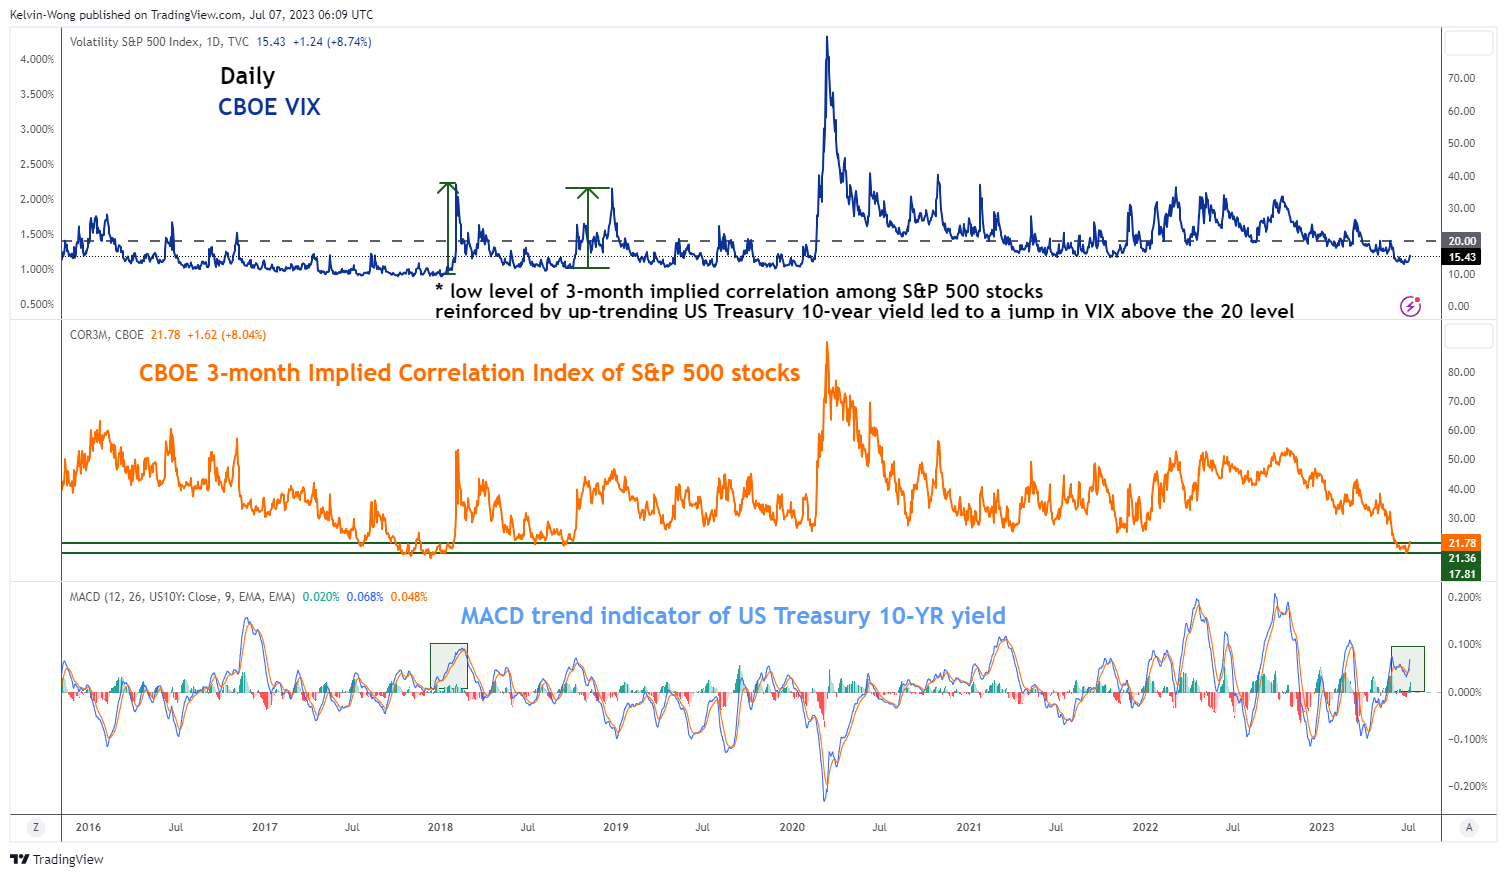
Fig 3: CBOE VIX, implied correlation index of S&P 500 stocks & MACD trend indicator of UST 10-year yield as of 6 Jul 2023
(Source: TradingView, click to enlarge chart)
An interesting point to note is that the prior low level of VIX has coincided with market participants’ perceptions of future low correlation readings of the US S&P 500 index constituents reinforced by a significant portion (more than 80%) of the gains of the S&P 500’s first 6-month return of +15.91% has been contributed by just a handful of mega-cap technology stocks and Tesla.
The CBOE 3-month Implied Correlation Index that measures the 3-month expected correlation across the top 50 value-weighted S&P 500 constituents has dipped close to a 5.5-year low of 17.81 on Wednesday, 5 July which suggests a potential high degree of calm and complacency among market participants.
Based on past data, such low compressed levels of 3-month expected correlation across the top 50 value-weighted S&P 500 constituents and the VIX can set up a significant increase in equities’ volatility triggered by a macro systemic negative shock.
For example, during the period from January to February 2018, the VIX jumped above the 20 level with the MACD trend indicator of the US Treasury 10-year yield that exhibited an uptrend condition, and such a similar condition has been depicted recently at the start of June 2023.
Double whammy for Asian stocks
Since the start of this week, Asian benchmark indices have underperformed the US. The MSCI All Country Asia ex Japan has declined by 1.49% with Japan’s Nikkei 225 loss of -2.17%, surpassing the US S&P 500 (-0.87%) dragged down by China proxies and a weak yuan. The Hang Seng indices were the worst performer so far In Asia; the Hang Seng Index (-2.40%) and Hang Seng China Enterprises Index (-2.67%) intra-week performances at this time of the writing.
Despite various subtle interventions conducted this week by China’s central bank, PBoC where it directed the major state banks to cut their US dollar deposits rates for the second time in a month to 2.8% from 4.3% previously as well as published a commentary in a state-backed media that China has ample tools to stabilize the foreign exchange market even if the yuan suffers a bout of panic selling, the USD/CNH (offshore yuan) just dipped slightly lower by -0.11% to 7.2465 from last week’s closing level of 7.2675.
The current weakness seen in the yuan is being supported by the widening of the positive yield spread of US Treasuries over China sovereign bonds, further reinforced by the past two days of rallies seen in the US Treasuries yields. All these movements trigger a negative feedback loop back into Asian stocks.
S&P 500 (SPX) Looking for Short Term Pullback
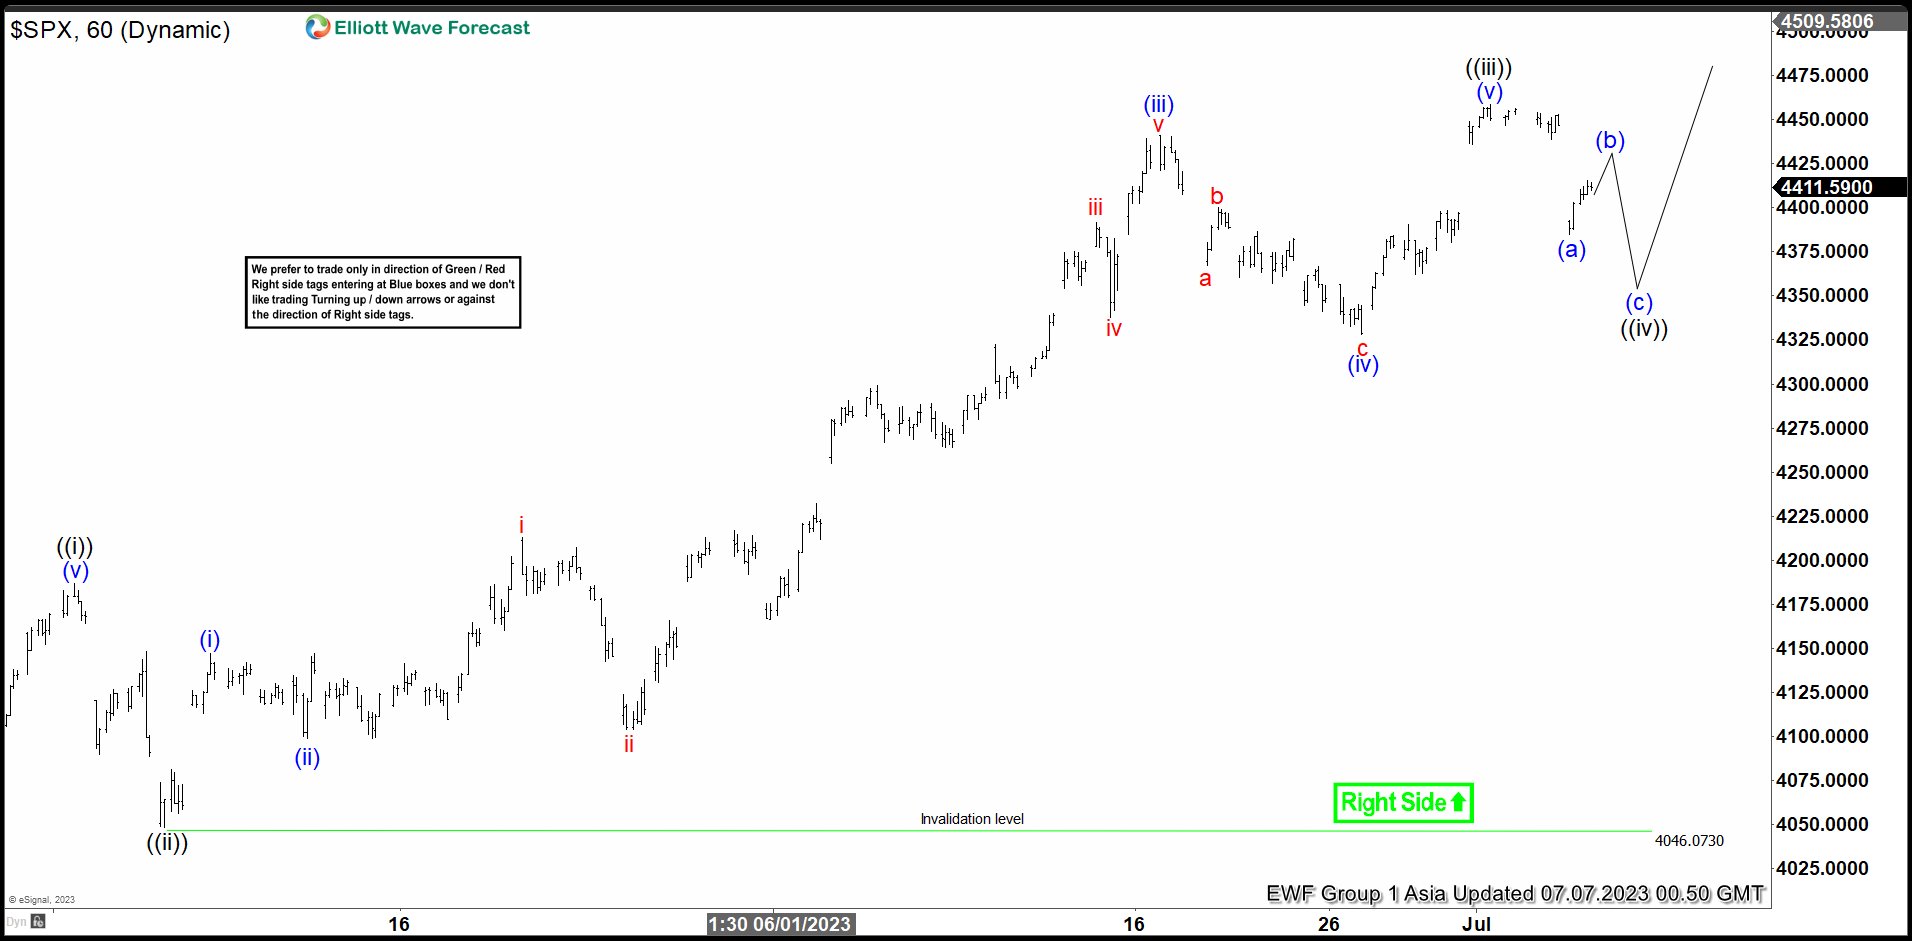
Short term Elliott Wave view in S&P 500 (SPX) suggests that the rally from 3.13.2023 low is unfolding as a 5 waves impulse structure. Up from 3.13.2023 low, wave ((i)) ended at 4186.92. Dips in wave ((ii)) ended at 4046.07 as the 60 minutes chart below shows. Up from there, wave (i) ended at 4147.02 and pullback in wave (ii) ended at 4098.92. Index extends higher in wave (iii) towards 4441.2 and dips in wave (iv) ended at 4328.08.
Final leg higher wave (v) ended at 4458.48 which completed wave ((iii)). Pullback in wave ((iv)) is in progress to correct cycle from 5.4.2023 low in 3, 7, or 11 swing. Down from wave ((iii)), wave (a) ended at 4385.05. Expect wave (b) rally to fail below 4458.48 and the Index to turn lower in wave (c) before it completes wave ((iv)) and resumes higher. Wave ((iv)) typically ends somewhere at the 23.6 – 38.2% Fibonacci retracement of wave ((iii)). That area is at 4301.2 – 4361.1. From here, the Index can find buyers for further upside. Near term, as far as pivot at 4046.07 low stays intact, expect pullback to find support in 3, 7, or 11 swing for further upside.
SPX 60 Minutes Elliott Wave Chart
SPX Elliott Wave Video
https://www.youtube.com/watch?v=YrzV8LRDrcc
Focus Evidently Turns to US Payrolls
Markets
Most major central banks recently said that they moved to ‘data dependent modus’. For some of them, this translates into a pause/skip or some other term giving them time to assess the impact of previous policy tightening on inflation and on growth. At least part of the policy makers and the market community assumed/feared that the tightening already put in place over the previous 12-18 months was at risk putting the economy on a path straight to recession. Quod non, so told yesterday’s US data. ADP June private job growth jumped an astonishing 497k (from 267k and 225k expected). Weekly Jobless claims at 248k stayed off the ‘highs’ recorded a few weeks. Last but not least, the US services ISM unexpectedly jumped from 50.3 to 53.9, with strong details too. (prices paid 54.1; employment again in outspoken growth territory at 53.1, orders reaccelerating to a strong 55.5). This kind of monthly data swings evidently needs confirmation. Even so, combined with mostly decent other data of late, one should be open to the idea that the (US) economy was only going through a temporary dip, with a solid labour market still putting a strong flow for demand. In this scenario, the CB’s wait-and-see pause only caused a loss of precious time in their attempt to bring inflation back under control. A reacceleration/catching up move in the pace of policy action then pops up as a logical conclusion. US yields jumped between 3.6 bps (2-y) and 9.75 bps (5 &10-y) with even higher peak levels intraday. The US 2-y yield touched a new cycle top at 5.12%, the highest level since mid-2007! The US 10-y yield almost touched the March top near 4.09%. The move was again mainly driven by a jump in the real yield (10-y hitting a new cycle top at 1.82). German yields added between 6.3 bps (2-y) and 14.8 bps (10-y). The rise in real yields this time triggered a setback on equity markets (S&P -0.79%, EuroStoxx 50 -2.93%). As was mostly the case of late, the impact on major currency cross rates again was modest. Smaller currency were hit by a jump in volatility. Despite the sharp rise in US real yields, the dollar even lost marginal ground (DXY close 103.17, EUR/USD 1.0089). The yen slightly outperformed on risk-aversion (USD/JPY 144.07).
Asian markets this morning open in risk-off modus, but given volatility on bond markets, the damage could have been bigger (Nikkei -0.93%). After yesterday’s barrage of ‘hawkish’ US data, the focus evidently turns to the US payrolls. A report slightly above expectations or even in line might already be enough to extend yesterday’s price pattern and push US yields on track of a break beyond key resistance levels (2-y 5/5.12%, US10-y 4.10% area). In theory a growing risk-off also should put the dollar (and the yen) in pole position.
News and views
Japanese wages rose more than expected in May. Labour cash earnings increased by 2.5% Y/Y vs 1.2% expected. It’s only the fourth time since the early 90’s that they rose at such pace (or more). It reflects the pay boost agreed in spring wage talks. Key unions and their employers reached an agreement to raise overall wages by the most since 1993 (3.8%) earlier this year. Adjusted for the cost of living though, real cash earnings fell 1.2% Y/Y (vs -2.7% Y/Y expected). Pressure on the Bank of Japan will nevertheless increase to pivot away from its ultra-accommodative monetary policy stance. The wage data clear an important hurdle on putting inflation on a sustained path to the 2% inflation target with BoJ governor Ueda at the ECB’s Sintra forum saying that wage growth should be slightly or well above 2% to achieve this. Japanese markets aren’t frontrunning any policy change. The Japanese yen has a small advantage over other majors (USD/JPY 143.70) with risk-off sentiment beating rising core (real) rates as main market driver. Japanese yields follow the global momentum with the 10y benchmark currently at 0.44% vs 0.40% yesterday morning. The BoJ has a 50 bps tolerance band around its 0% target for the 10y yield..
The National Bank of Poland kept its policy rate unchanged at 6.75% for a 10th straight meeting. Updated inflation forecasts show a faster CPI drop next year compared to March: 11.9% in 2023 (vs 11.85%), 5.25% in 2024 (vs 5.7%) and 3.6% in 2025 (vs 3.5%). Updated growth prognoses stand at 0.55% for this year (vs 0.85%), 2.35% next year (vs 2.1%) and 3.25% in 2025 (vs3.15%). The overall tone and forward guidance in the statement are again broadly unaltered (steady as they go). NBP governor Glapinski will hold a press conference this afternoon. The Polish zloty got hammered in yesterday’s market climate just like CZK and HUF. EUR/PLN bounced off recent lows the past two days to test 4.50 from 4.41.
Jobs Surprise
497’000 is the number of private jobs that the US economy added last month. 497’000. The number of quits rose to 250’000. But happily, the job openings fell by almost half a million, and more importantly for the Federal Reserve (Fed) – who is fighting to abate inflation and not necessarily jobs, the sector that saw the biggest jobs gains – which is leisure and hospitality which accounted for more than 230’000 of the jobs added – also saw the sharpest decline in annual pay growth. The pay for this sector’s workers grew 7.9% last year, down from 8.4% printed a month earlier. But that detail went a bit unheard, and under the shadow of the stunning 497’000 new jobs added. And the too-strong ADP report that, again, hinted at a too-resilient US jobs market to the Fed’s very aggressive rate hikes, ended up further fueling the Fed rate hike expectations. The US 2-year yield spiked above 5%, and above the peak that we saw before the mini banking crisis hit the US in March, while the 10-year yield took a lift as well, and hit 4%, on indication that, recession doesn’t look around the corner… at least if you follow the US jobs numbers.
So today, the official US jobs data could or could not confirm the strength in the ADP figures, but we are all prepared for another month of strong NFP data, and lower unemployment. If anything, we could see the wages growth slow. If that’s the case, investors could still have a reason to see the glass half full and bet that the US economy could achieve the soft landing that it’s hoping for.
Equities pressured
The S&P500 and Nasdaq fell yesterday as the US yields spiked on expectation that the Fed won’t stop hiking rates with such a strong jobs data, as such a strong jobs market means resilient consumer spending, which in return means sticky inflation.
Other data confirmed the US’ economy’s good health as well. ISM services PMI showed faster-than-expected growth and faster-than-expected employment, and slower but higher-than-expected price growth in June. If we connect the dots, the US manufacturing is slowing but services continue to grow, and services account for around 80% of the US economic activity, so no wonder the US jobs data remains solid and consumer spending remains resilient, and the US GDP growth comes in better than expected, and we haven’t seen that recession showing up its nose yet.
But the darker side of the story is, this much economic strength means sticky inflation, and tighter monetary conditions, and the dirty job of pricing it is done by the sovereign markets. And many investors think that when there is such a divergence of opinion between stock and bond traders, bond traders tend to be right.
But at the end of the day, the stock market’s performance will depend on how much pain the Fed will put on the Wall Street from the balance sheet reduction. If the Fed just continues hiking the rates and do little on the balance sheet front, it will only hit Main Street, and there will be no reason for the equity rally to stall. Voila.
USD/CAD Daily Outlook
Daily Pivots: (S1) 1.3304; (P) 1.3339; (R1) 1.3402; More....
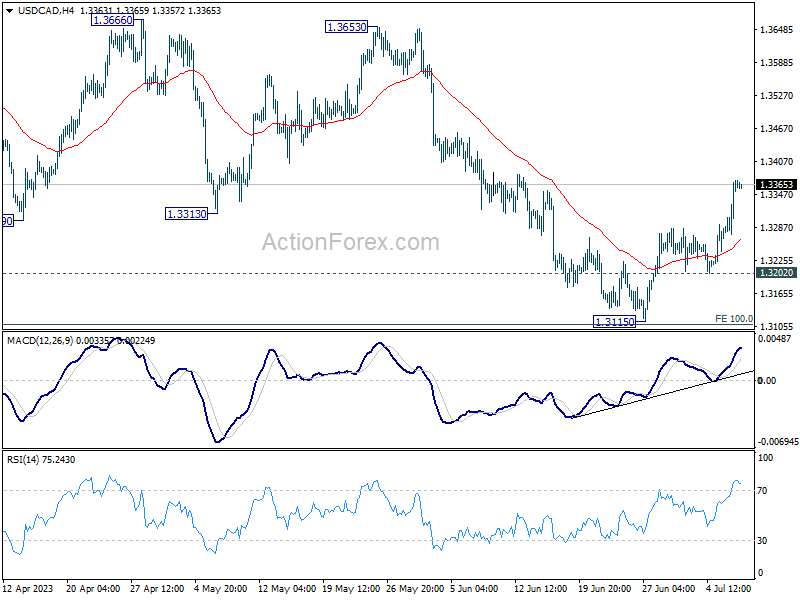
USD/CAD's rebound from 1.3115 short term bottom extended higher and it's now pressing 55 D EMA (now at 1.3369). Intraday bias stays on the upside for the moment. Sustained trading above 55 D EMA will argue that whole corrective pattern from 1.3976 has completed with three waves down to 1.3115. Further rally should then be seen to 1.3653 resistance next. Nevertheless, break of 1.3202 support will bring retest of 1.3115 low instead.
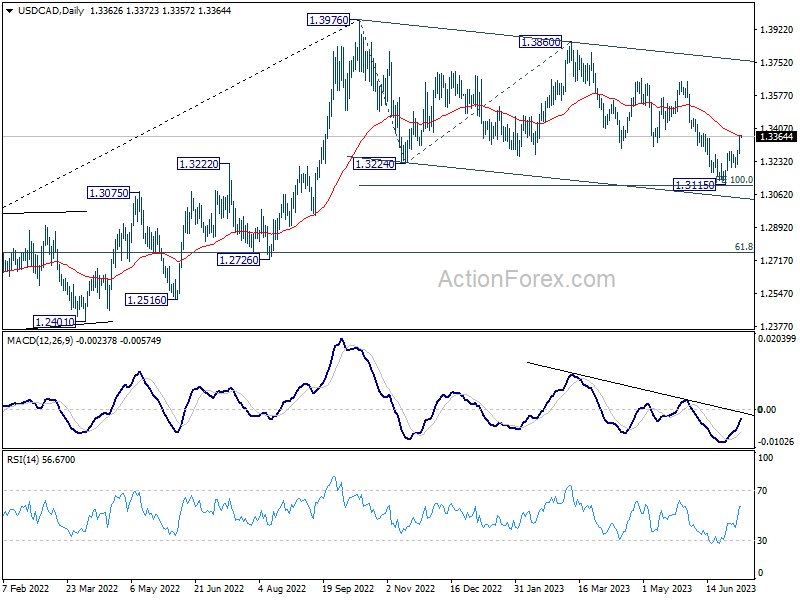
In the bigger picture, price actions from 1.3976 are viewed as a correction to up trend from 1.2005 (2021 low) only. Hence, the up trend is in favor to resume through 1.3976 at a later stage. Nevertheless, another fall below 1.3115 will extending the decline from 1.3976 to 61.8% retracement of 1.2005 to 1.3976 at 1.2758, and raise the chance of bearish trend reversal.
AUD/USD Daily Report
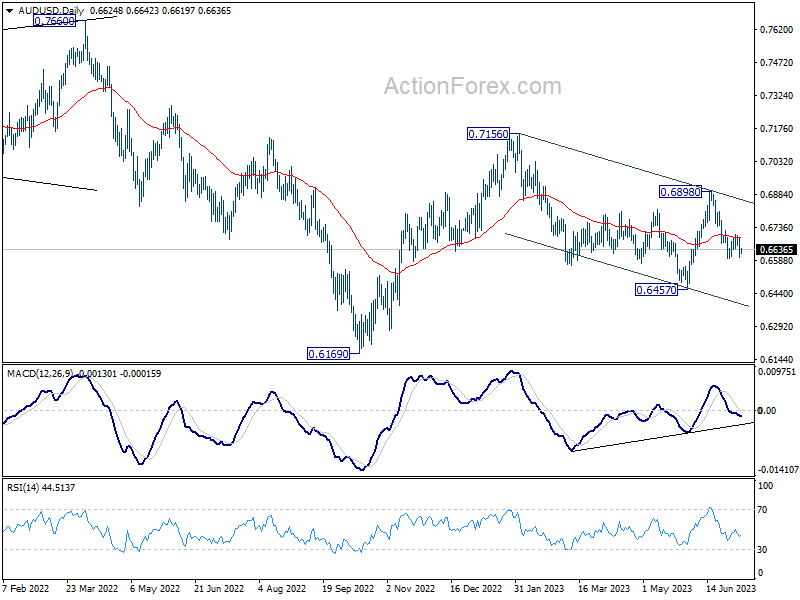
Daily Pivots: (S1) 0.6587; (P) 0.6638; (R1) 0.6676; More...
AUD/USD recovered ahead of 0.6594 support and intraday bias remains neutral first. More consolidations could still be seen. With 0.6710 resistance intact, further decline is in favor. On the downside, break of 0.6594 will resume the decline from 0.6898 to 0.6457 support next. Nevertheless, firm break of 0.6719 will turn bias back to the upside for stronger rebound.
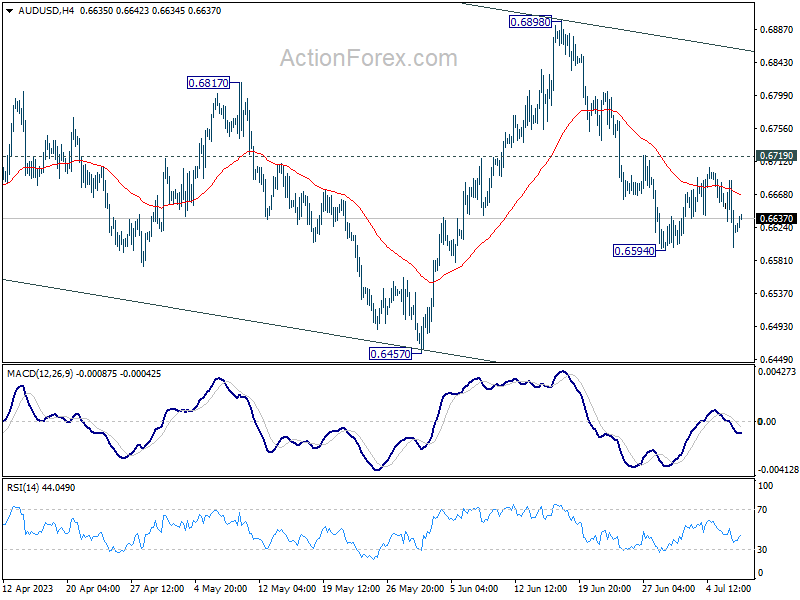
In the bigger picture, price actions from 0.7156 are seen as a correction to the rebound from 0.6169 only, rather than part of larger down trend from 0.8006 (2021 high). Break of 0.6457 could be seen but downside should be contained above 0.6169. This will now remain the favored case as high as 0.6898 resistance holds. Nevertheless, break of 0.6898 resistance will argue that rise form 0.6169 is ready to resume through 0.7156.
EUR/USD Daily Outlook
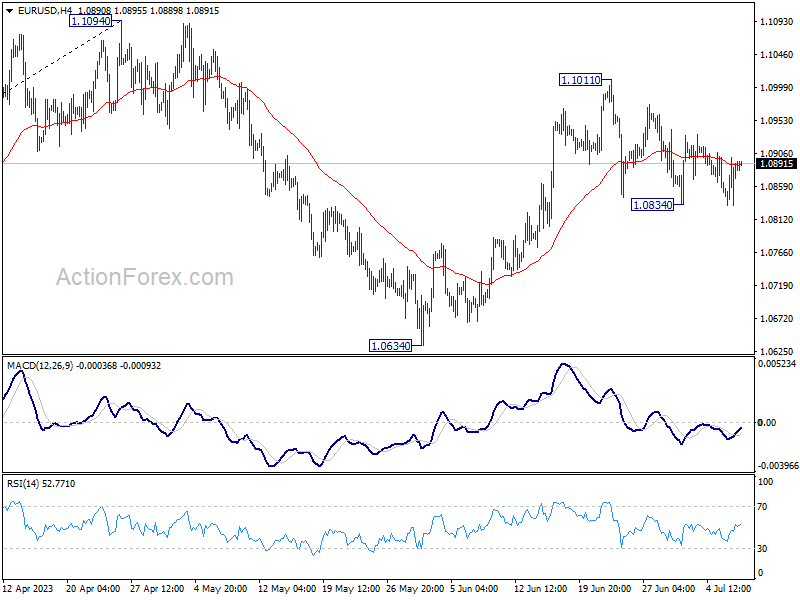
Daily Pivots: (S1) 1.0851; (P) 1.0875; (R1) 1.0917; More...
Range trading continues in EUR/USD and intraday bias remains neutral at this point. Further rise is still mildly in favor. On the upside, break of 1.1011 will resume the rise from 1.0634 and target 1.1094 resistance. Decisive break there will resume larger up trend from 0.9534 to 1.1273 fibonacci level. However, firm break of 1.0834 will turn bias to the downside for 1.0634 support instead.
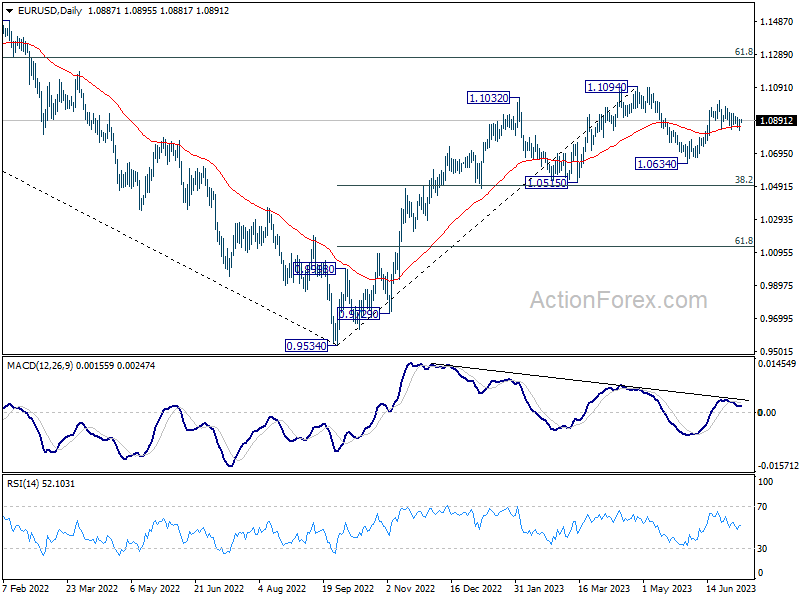
In the bigger picture, as long as 1.0515 support holds, rise from 0.9534 (2022 low) would still extend higher. Sustained break of 61.8% retracement of 1.2348 (2021 high) to 0.9534 at 1.1273 will solidify the case of bullish trend reversal and target 1.2348 resistance next (2021 high).
GBP/USD Daily Outlook
Daily Pivots: (S1) 1.2682; (P) 1.2731; (R1) 1.2789; More...
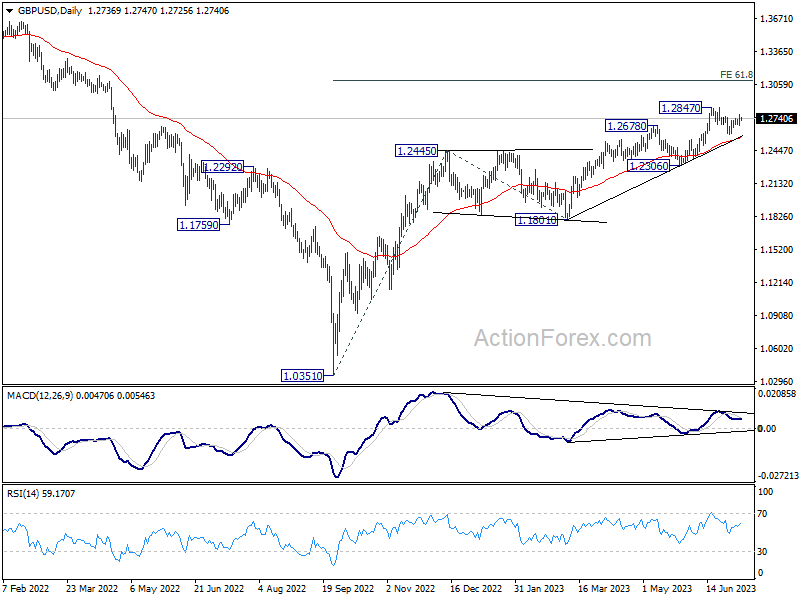
Intraday bias in GBP/USD stays neutral at this point as consolidation from 1.2847 is extending. On the upside, firm break of 1.2847 will resume larger up trend from 1.0351 to 61.8% projection of 1.0351 to 1.2445 from 1.1801 at 1.3095. On the downside, though, break of 1.2589 will extend the fall from 1.2847 to 55 D EMA (now at 1.2558).
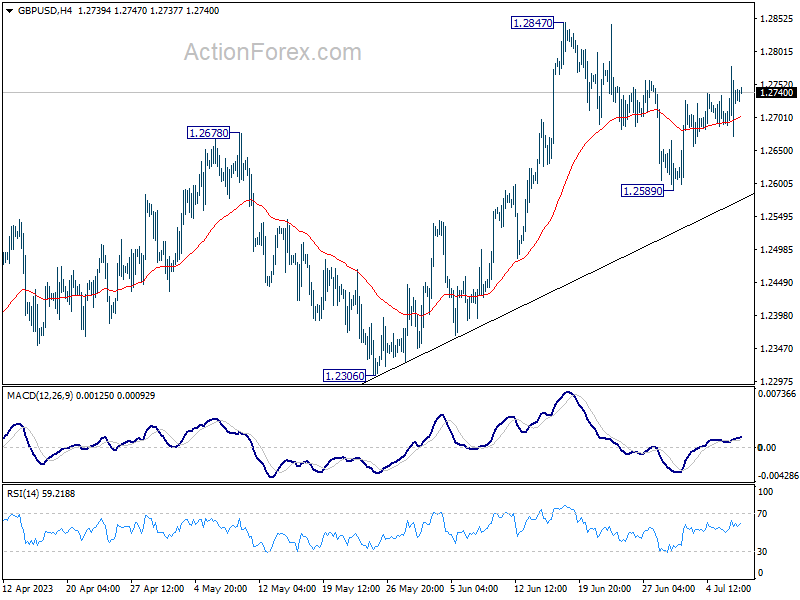
In the bigger picture, the strong support from 55 W EMA (now at 1.2341) is a medium term bullish sign. Outlook will stay bullish as long as 1.2306 support holds. Rise from 1.0351 medium term bottom (2022 low) is expected to extend further to retest 1.4248 key resistance (2021 high).
USD/CHF Daily Outlook
Daily Pivots: (S1) 0.8936; (P) 0.8968; (R1) 0.8984; More...
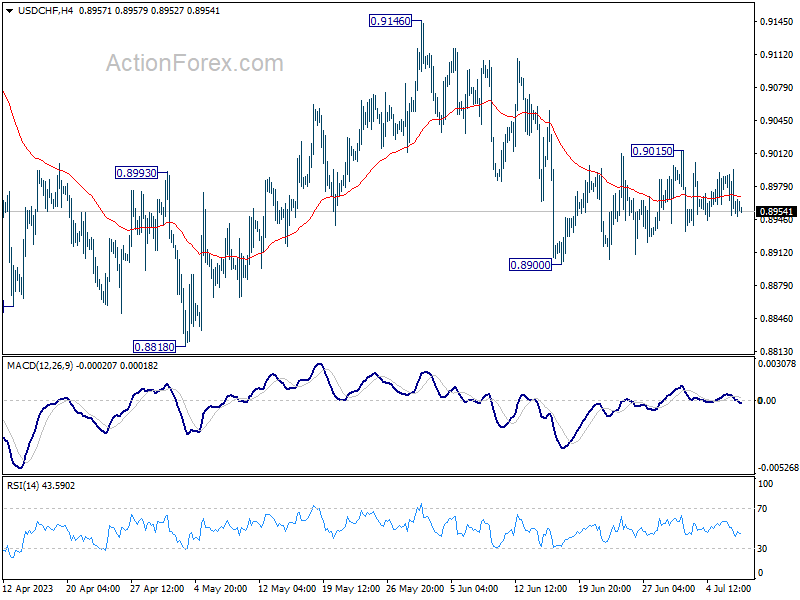
No change in USD/CHF's outlook as consolidation from 0.8900 is extending. Intraday bias stays neutral and further decline is expected. On the downside, break of 0.8900 will resume the fall from 0.9146 to 0.8818 low or below. On the upside, above 0.9015 will bring stronger rise towards 0.9146 resistance instead.
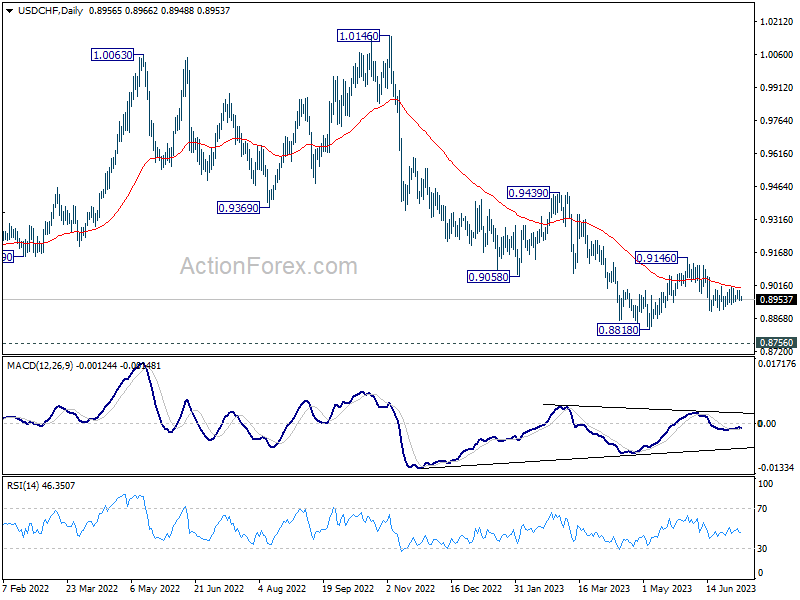
In the bigger picture, fall from 1.1046 (2022 high) is seen as a leg in the long term range pattern from 1.0342 (2016 high). While further decline cannot be ruled out, strong support is expected from 0.8756 long term support to bring reversal. Firm break of 0.9146 resistance should confirm medium term bottoming.
Technical Outlook and Review
DXY:
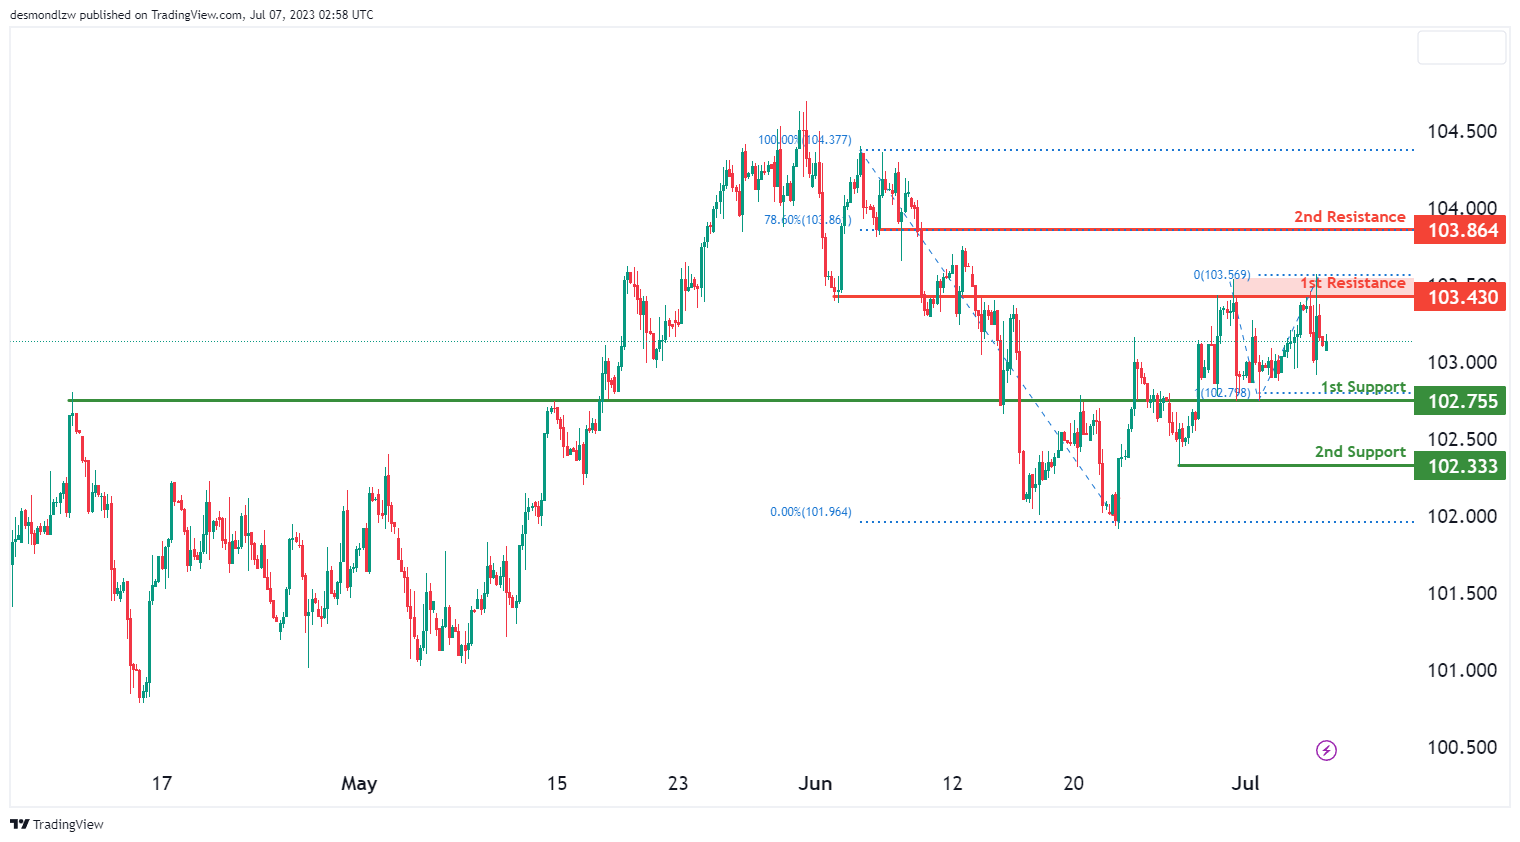
The DXY chart indicates a prevailing bearish momentum, implying a likelihood of further downward movement in the market. The price has the potential for a bearish continuation, targeting the 1st support level located at 102.75. This support level is significant as it aligns with an overlap support and corresponds to a 100% Fibonacci Retracement level. Furthermore, the 2nd support at 102.33 serves as a swing low support, adding to its significance.
In terms of resistance levels, the 1st resistance at 1103.43 represents a prominent area of price resistance, characterized by overlap resistance. Conversely, the 2nd resistance at 103.86 acts as a pullback resistance, substantiated by its association with a 78.60% Fibonacci Retracement level.
EUR/USD:
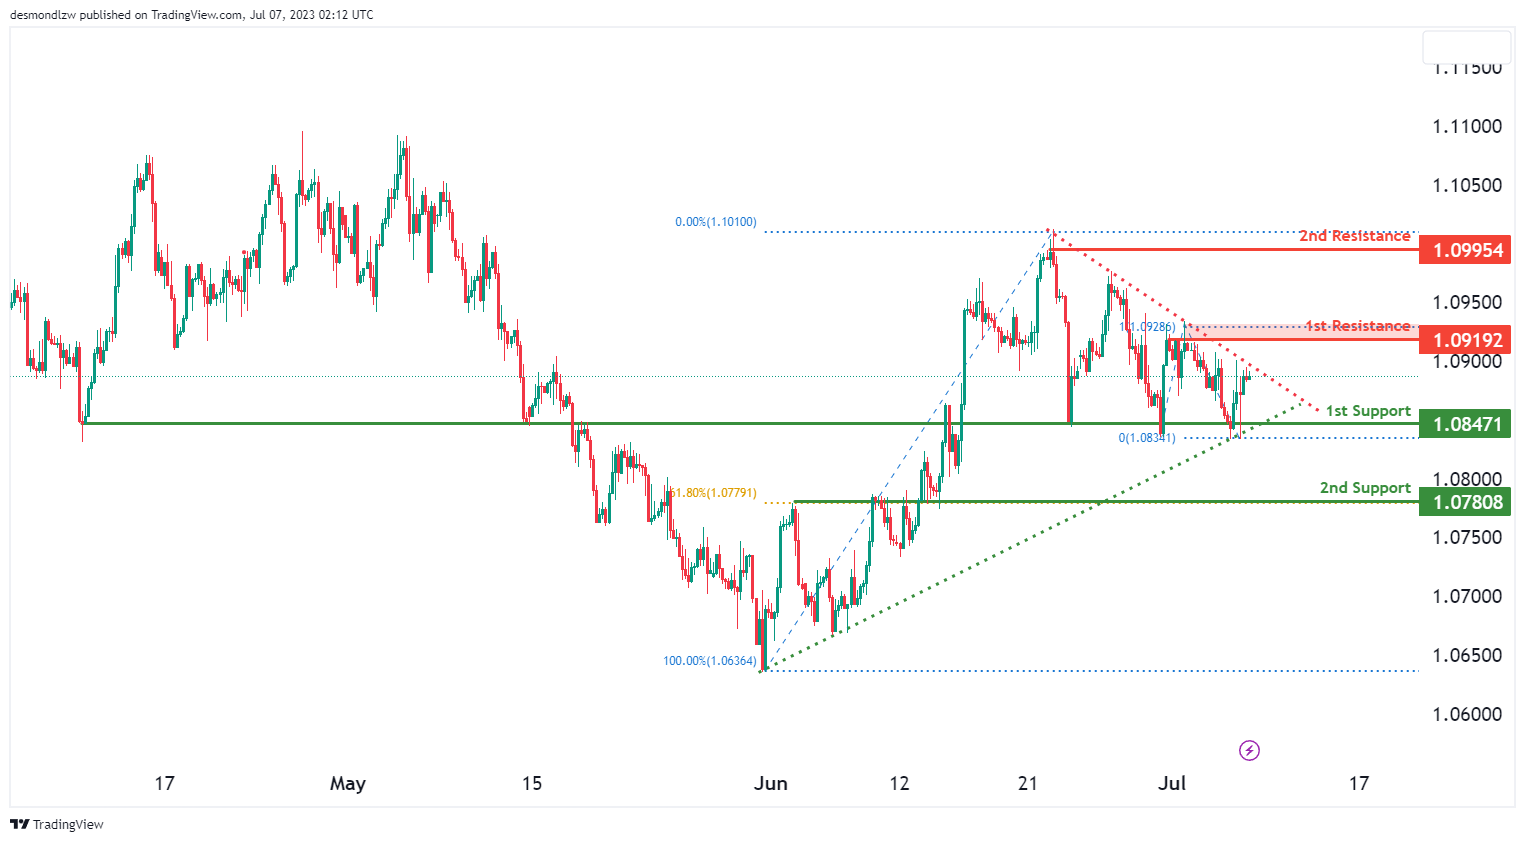
The EUR/USD chart currently exhibits a neutral momentum, indicating a lack of clear direction in the market. There is a possibility of price fluctuating between the 1st support level at 1.0847, which is an ov
erlap support, and the 1st resistance level at 1.0919, representing a multi-swing high resistance with a 100% Fibonacci Retracement. The 2nd support level at 1.0780 serves as an additional overlap support, while the 2nd resistance level at 1.0995 is a swing high resistance.
Furthermore, the presence of a symmetrical triangle chart pattern suggests a period of consolidation, potentially preceding a breakout or breakdown. A bullish breakout may occur if the upper trendline is breached, while a bearish breakdown may happen if the lower trendline is breached.
EUR/JPY:
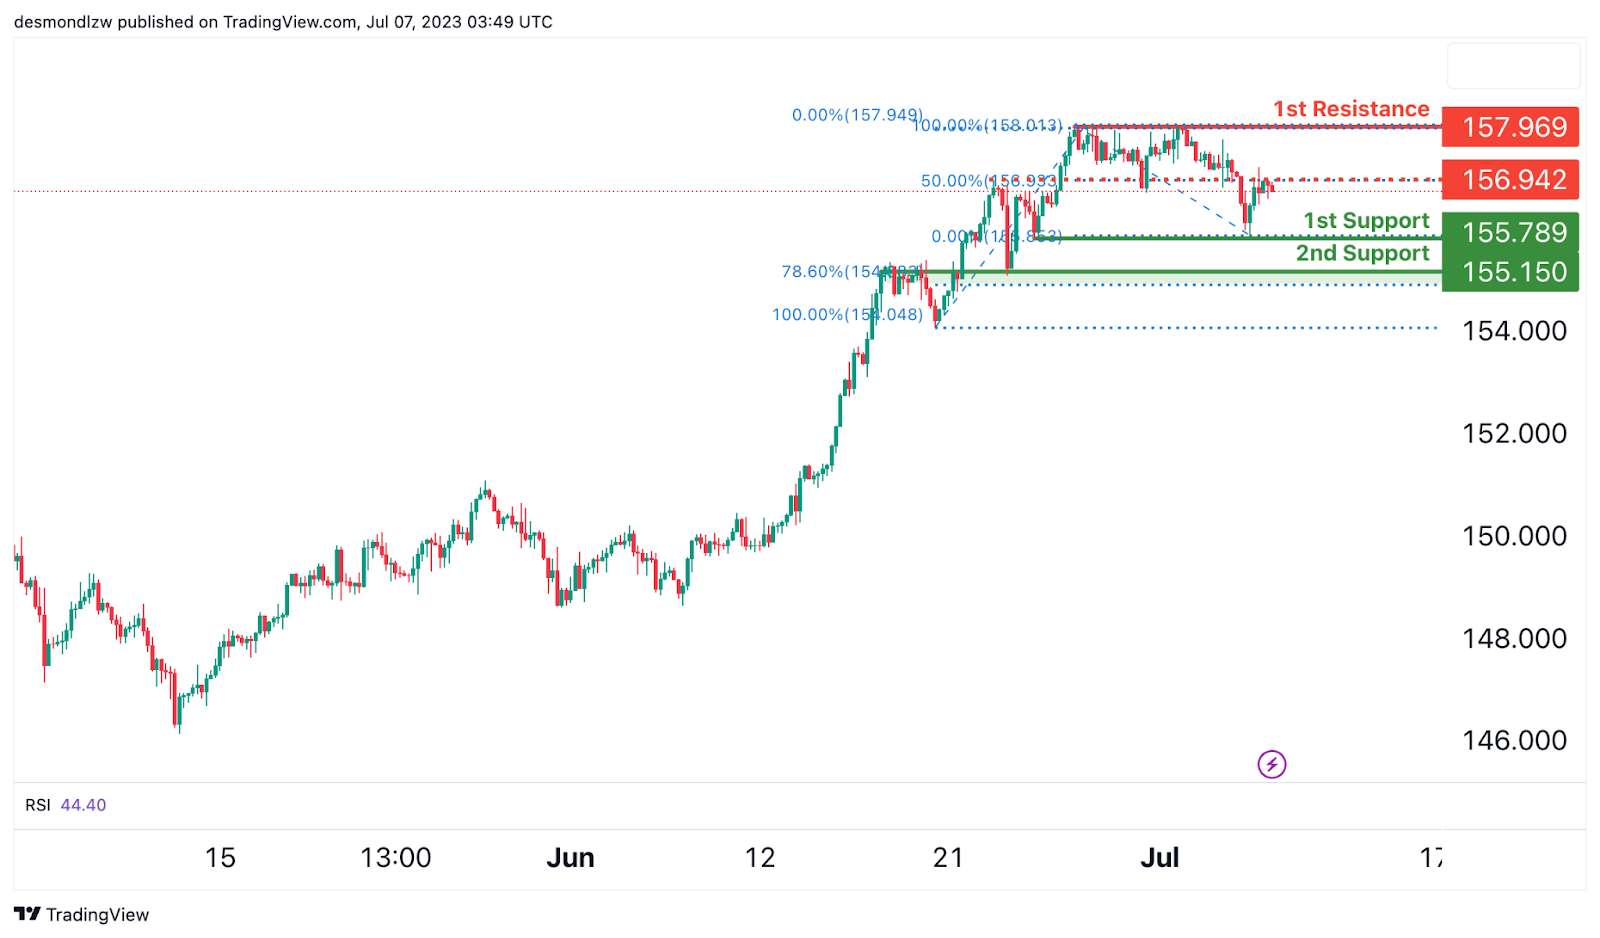
The EUR/JPY chart currently demonstrates a bearish momentum, indicating the potential for further downward movement.
There is a possibility of a bearish continuation towards the 1st support level at 155.78, which is identified as a significant multi-swing low support. Additionally, the 2nd support level at 155.15 acts as an overlap support and exhibits Fibonacci confluence with a 78.60% Fibonacci Retracement, further reinforcing its importance.
On the upside, the 1st resistance level at 1916.21 represents a notable overlap resistance. Similarly, the 2nd resistance level at 1975.62 serves as a swing high resistance, indicating a potential barrier for price advancement.
In addition, there is an intermediate resistance at 155.94, which is an overlap resistance and aligns with a 50% Fibonacci Retracement, further emphasizing its significance.
EUR/GBP:
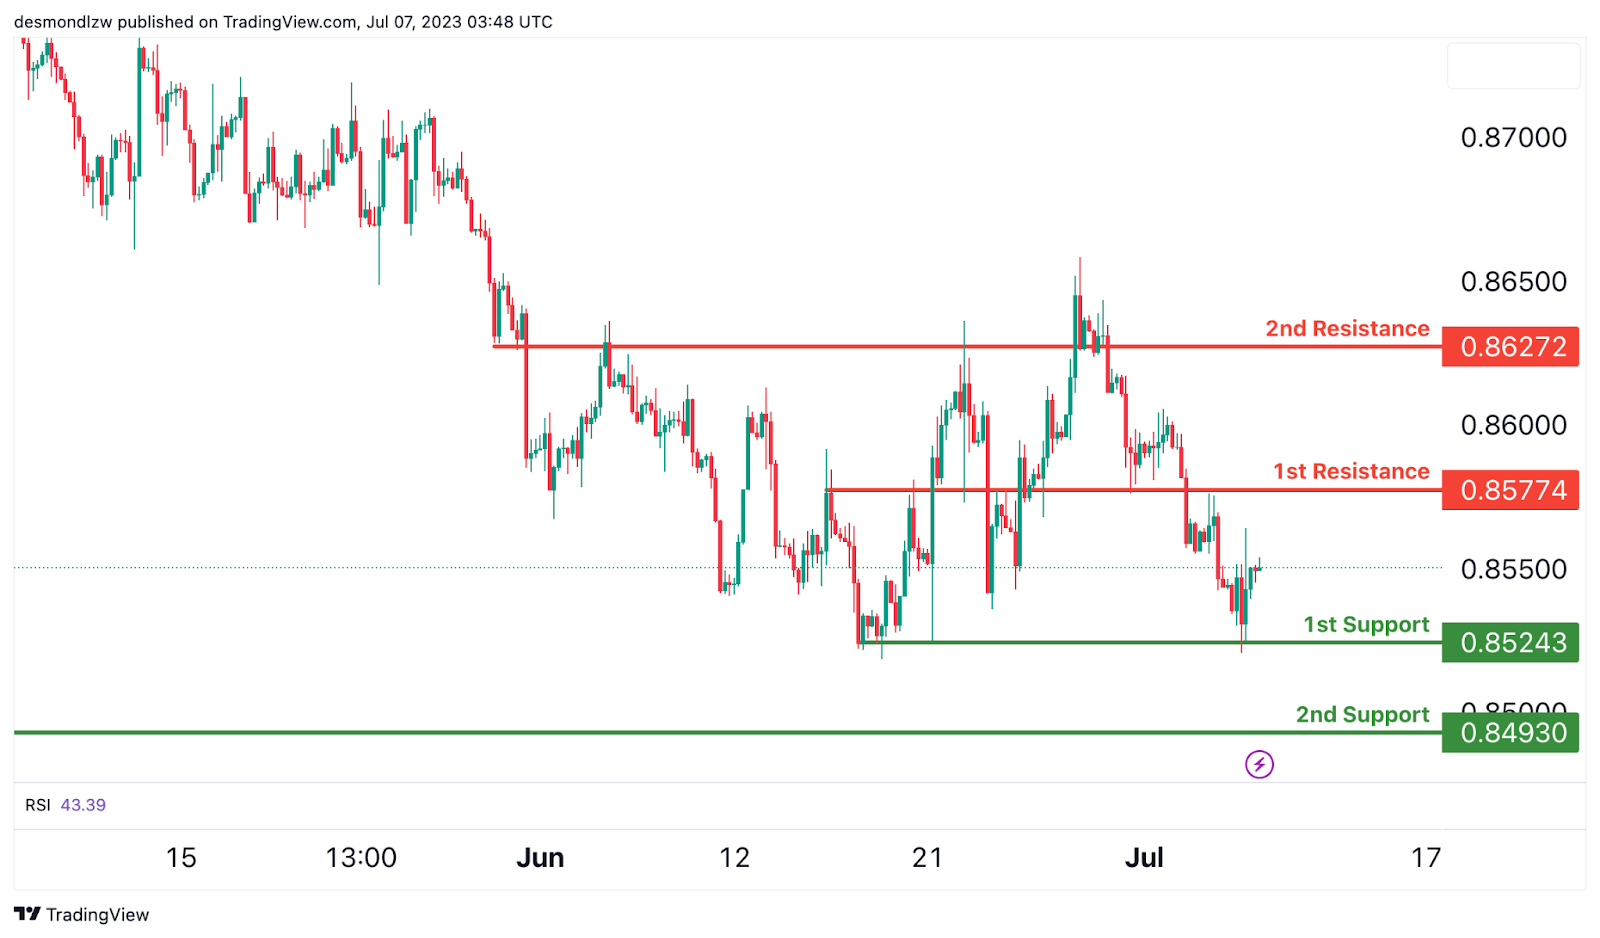
The EUR/GBP chart currently demonstrates a bullish overall momentum, suggesting the potential for further upward movement.
The 1st support level at 0.8524 serves as a significant multi-swing low support, indicating a potential area for price to bounce from. Additionally, the 2nd support level at 0.8493 acts as an overlap support, further reinforcing its significance.
On the upside, the 1st resistance level at 0.8577 represents an important overlap resistance, indicating a potential barrier for price advancement. Similarly, the 2nd resistance level at 0.8627 also functions as an overlap resistance, further solidifying its role as a potential price ceiling.
GBP/USD:
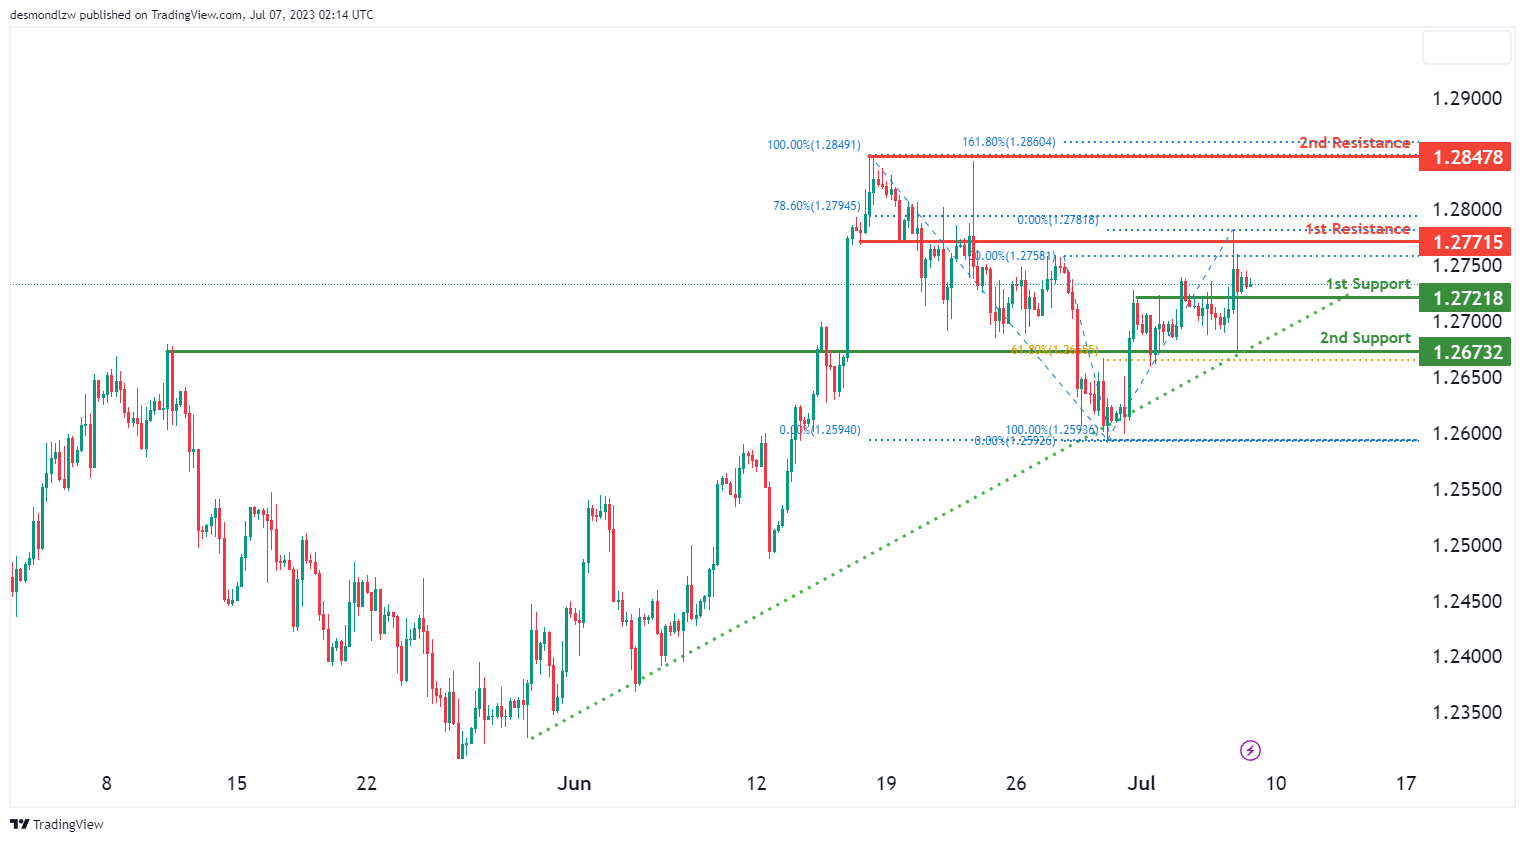
The GBP/USD chart currently demonstrates a bullish momentum, supported by the price being above a major ascending trend line and an ascending trend line acting as support.
There is a potential for a bullish bounce off the 1st support level at 1.2721, which is considered as pullback support. The 2nd support level at 1.2673 also acts as an overlap support and aligns with a 61.80% Fibonacci Retracement.
On the upside, the 1st resistance level at 1.2771 represents an overlap resistance with a 78.60% Fibonacci Retracement. Additionally, the 2nd resistance level at 1.2847 is a multi-swing high resistance.
GBP/JPY:
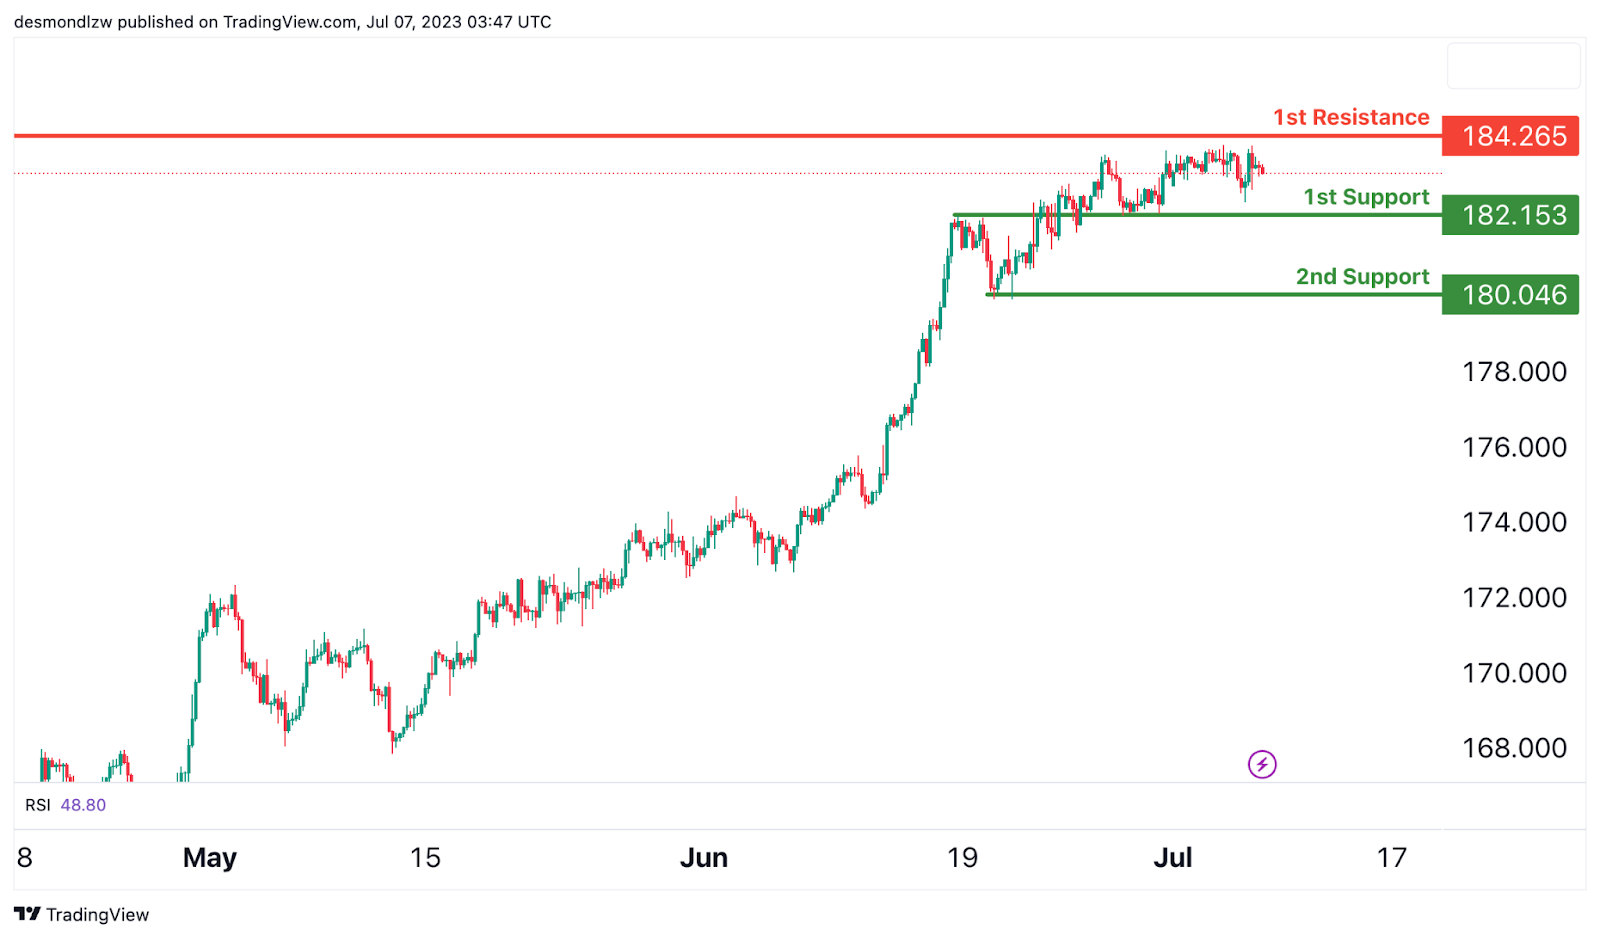
The GBP/JPY chart currently shows a neutral momentum, suggesting a lack of clear direction in the market. There is a potential for price to fluctuate between the 1st resistance and 1st support level.
The 1st support level is located at 182.153 and is considered significant due to its overlap support. Additionally, the 2nd support level at 180.046 aligns with an overlap support, further reinforcing its significance. On the upside, the 1st resistance level at 184.265 represents a significant overlap resistance.
USD/CHF:
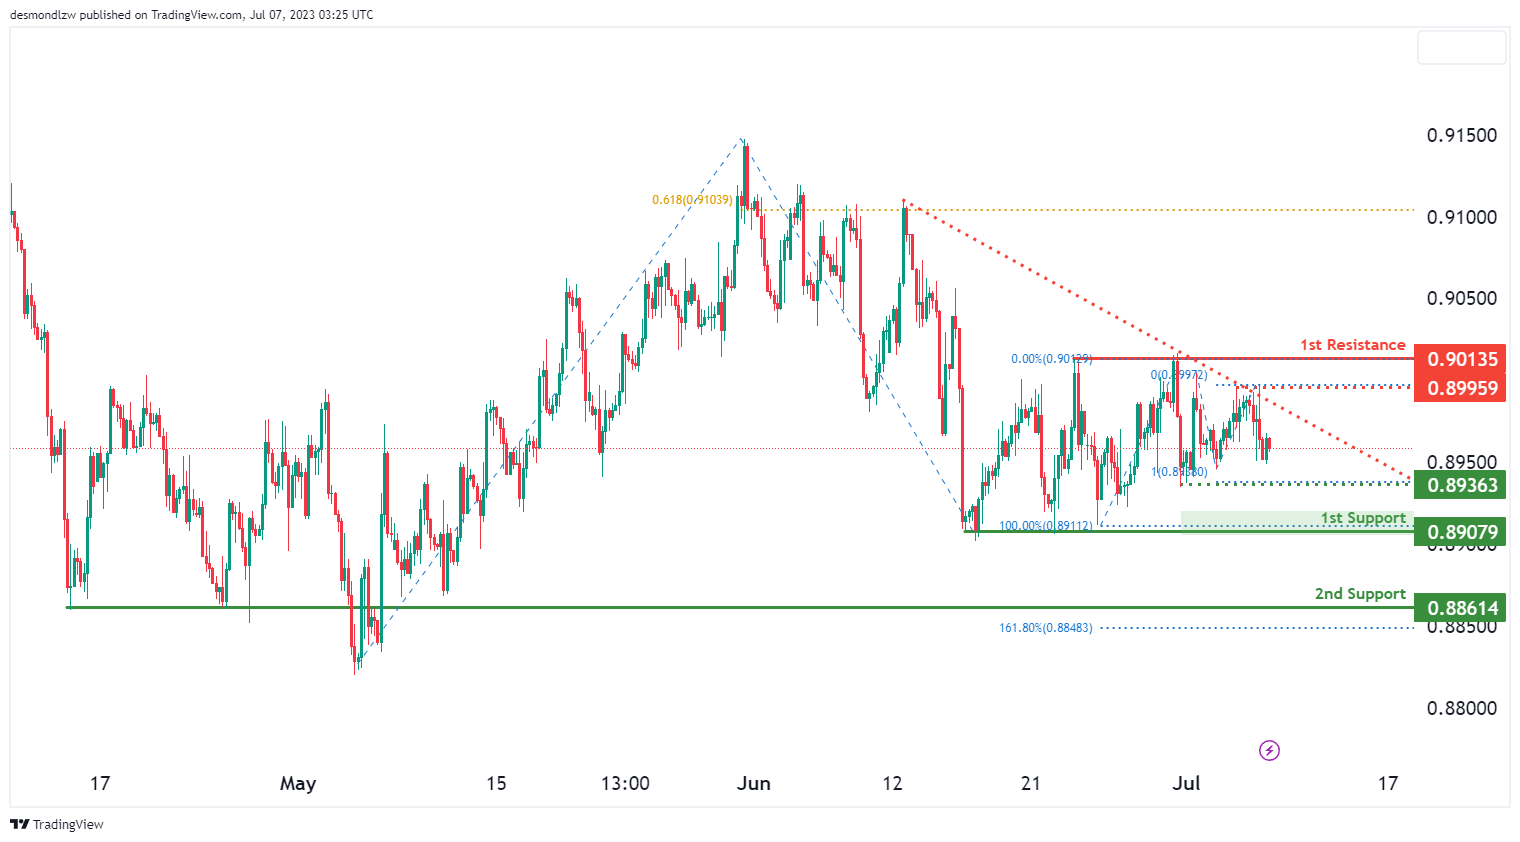
The USD/CHF chart currently exhibits a bearish momentum, indicated by the price being below a major descending trend line and a descending trend line acting as resistance.
There is a potential for a bearish continuation towards the 1st support level at 0.8907, which is identified as a multi-swing low support. The 2nd support level at 0.8861 acts as a pullback support and aligns with a 161.80% Fibonacci Extension.
On the upside, the 1st resistance level at 0.9013 represents a multi-swing high resistance. Additionally, there are intermediate resistance and support levels at 0.8936, with the former indicating multi-swing high resistance and the latter representing swing low support with a 100% Fibonacci Projection.
USD/JPY:
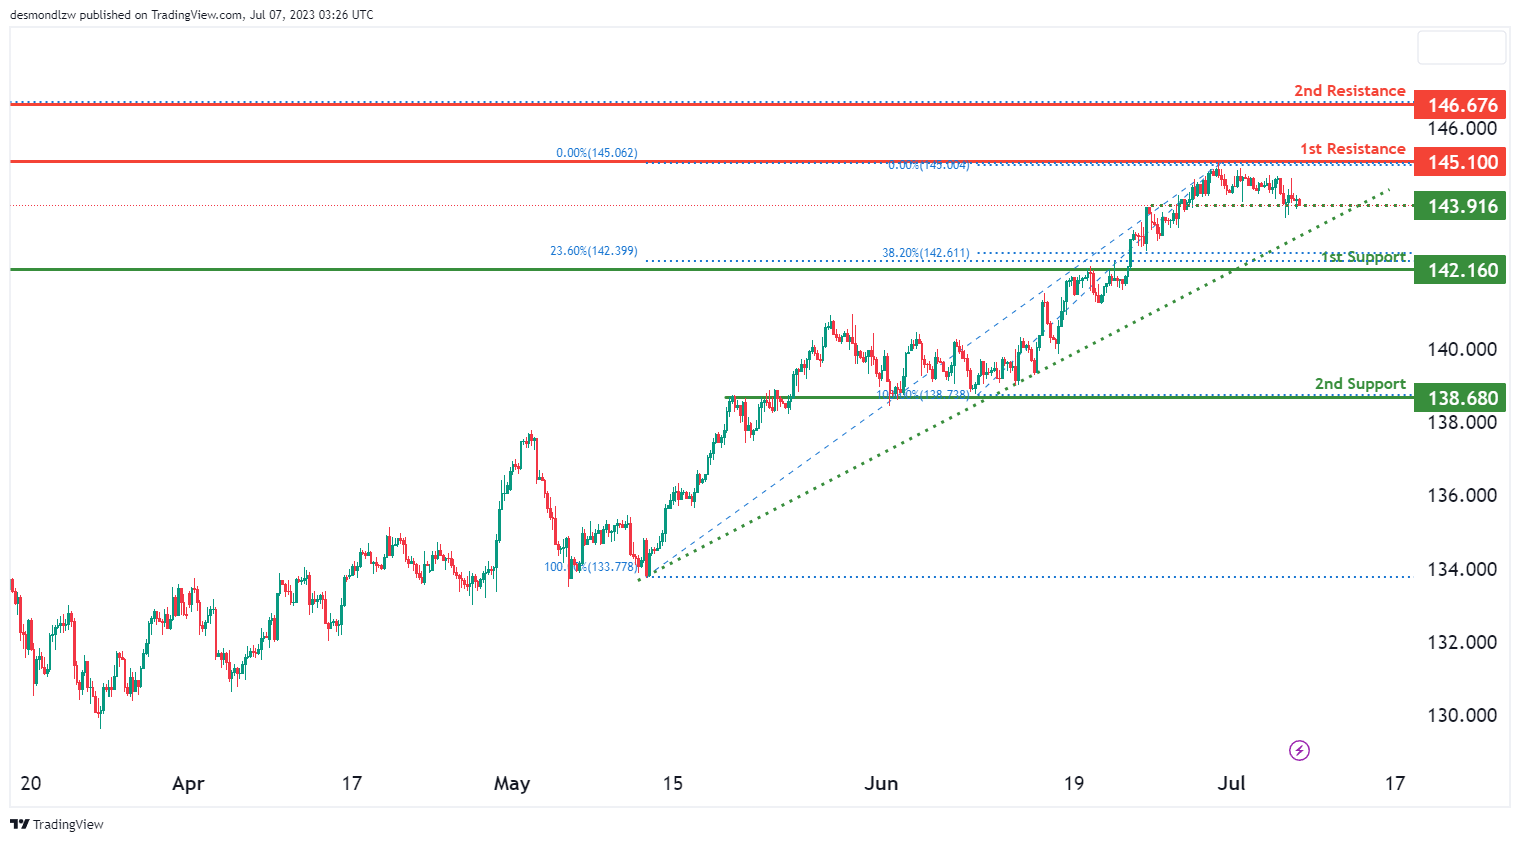
The USD/JPY chart currently demonstrates a bullish momentum, supported by the price being above a major ascending trend line and testing an ascending trend line acting as support.
There is a possibility of a bearish continuation towards the 1st support level at 142.16, which is identified as an overlap support and shows Fibonacci confluence with a 23.60% and 38.20% Fibonacci Retracement. The 2nd support level at 138.68 is also an overlap support.
On the upside, the 1st resistance level at 145.10 represents a pullback resistance. Additionally, there is a 2nd resistance level at 146.67, coinciding with a 78.60% Fibonacci Retracement. An intermediate support level at 143.91 is also present as an overlap support.
USD/CAD:
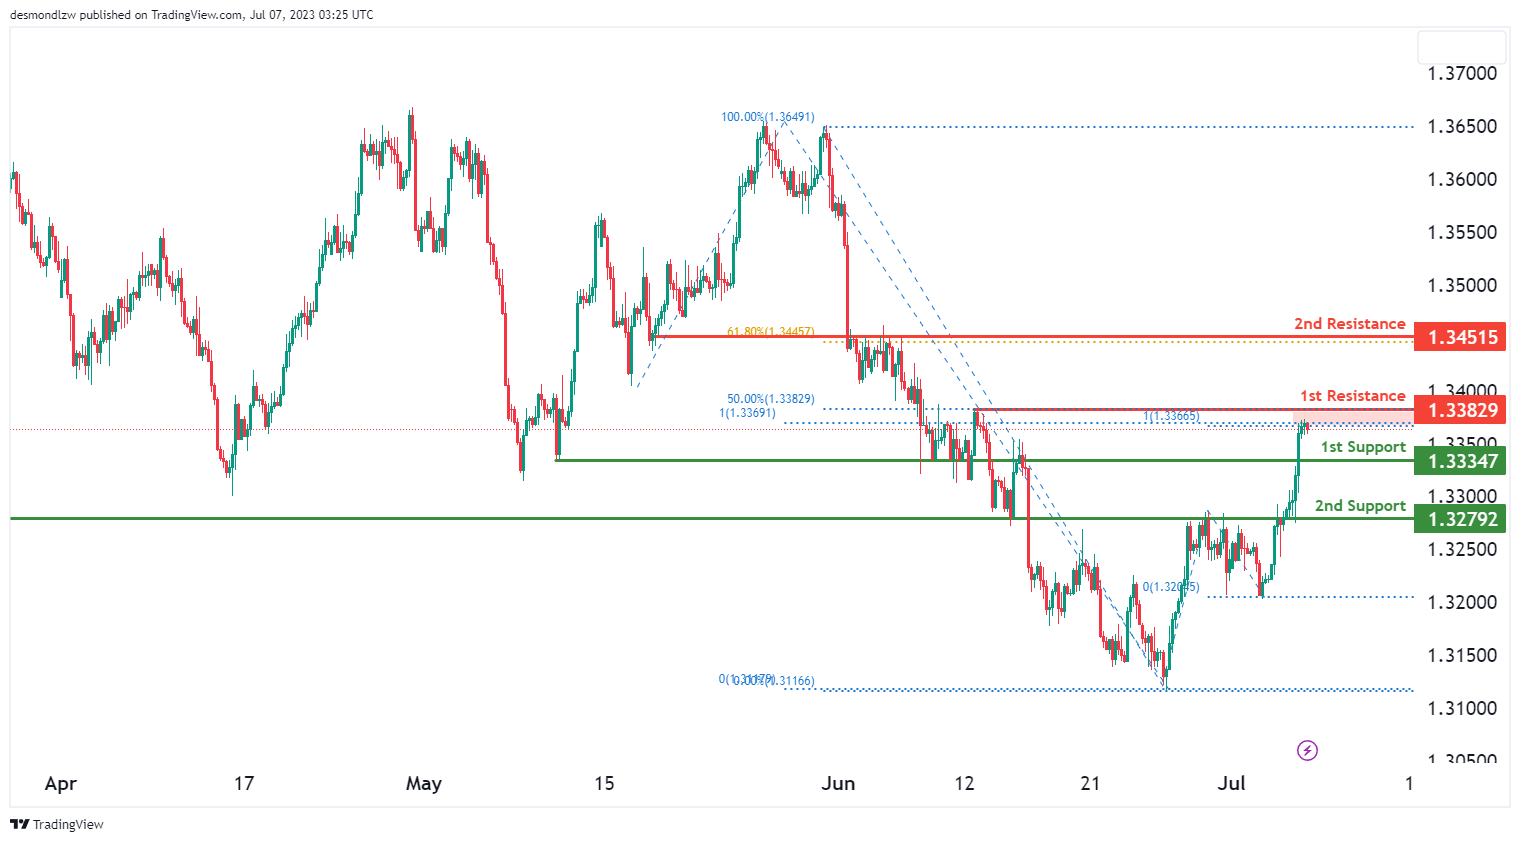
The USD/CAD chart exhibits a weak bullish momentum with low confidence. There is a potential for a bullish continuation towards the 1st resistance level at 1.3383, which is an overlap resistance and aligns with the 50% Fibonacci Retracement level and 100% Fibonacci Projection level.
The 1st support level at 1.3335 and the 2nd support level at 1.3279 act as reliable support levels, providing potential downside support.
On the upside, the 2nd resistance level at 1.3452 represents an overlap resistance and coincides with the 61.80% Fibonacci Retracement level.
AUD/USD:
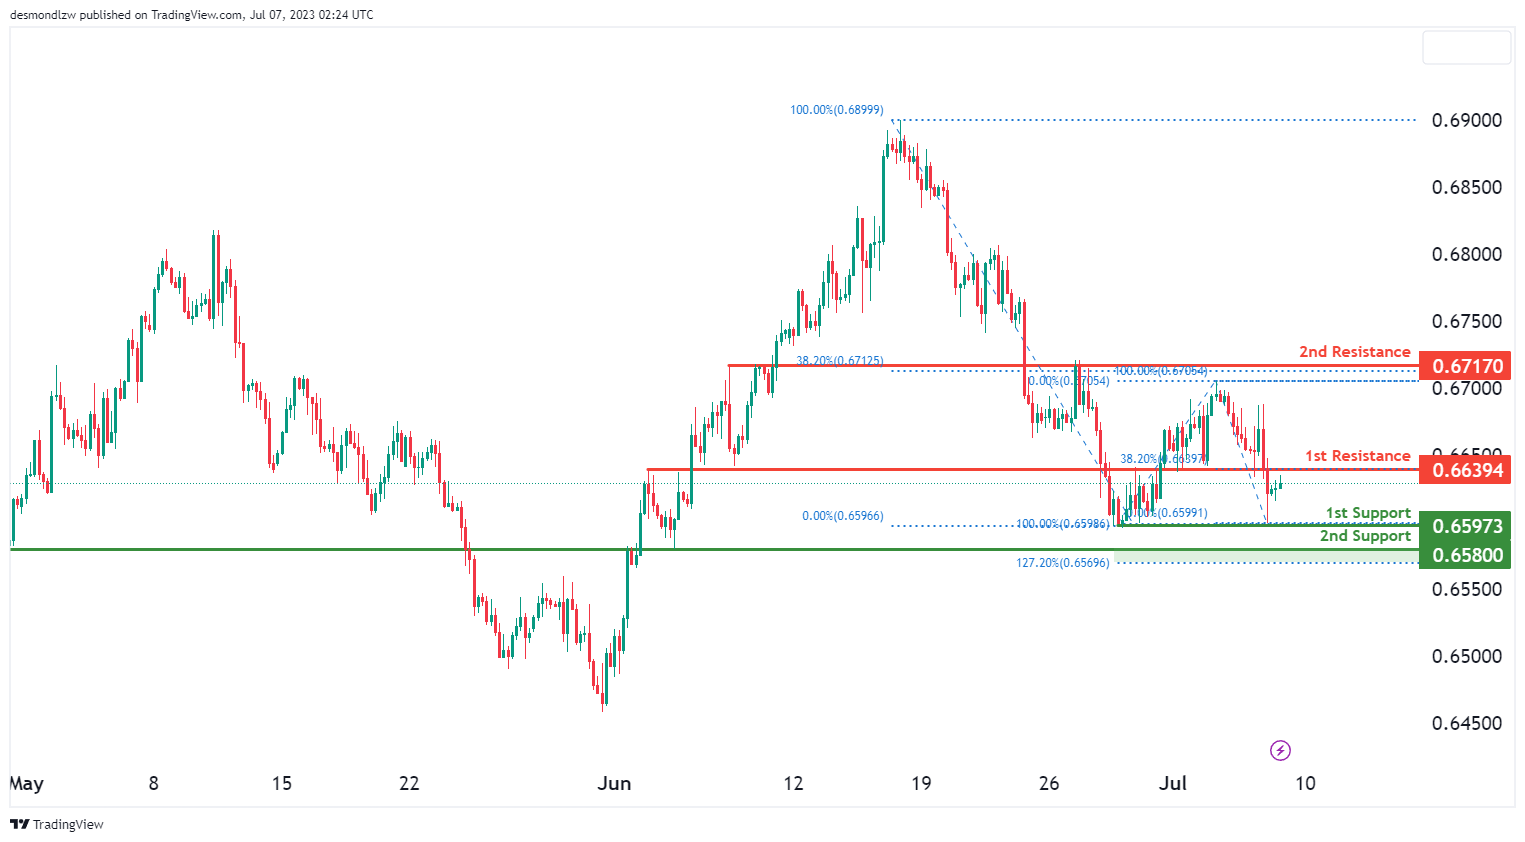
The AUD/USD chart indicates a weak bullish momentum with low confidence. There is a potential for a bullish continuation towards the 1st resistance level at 0.6639, which is an overlap resistance and coincides with a 38.20% Fibonacci Retracement level.
The 1st support level at 0.6597 and the 2nd support level at 0.6580 both act as overlap supports. The 2nd support level also aligns with a 127.20% Fibonacci Extension level.
On the upside, the 2nd resistance level at 0.6717 is an overlap resistance and coincides with a 38.20% Fibonacci Retracement level.
NZD/USD
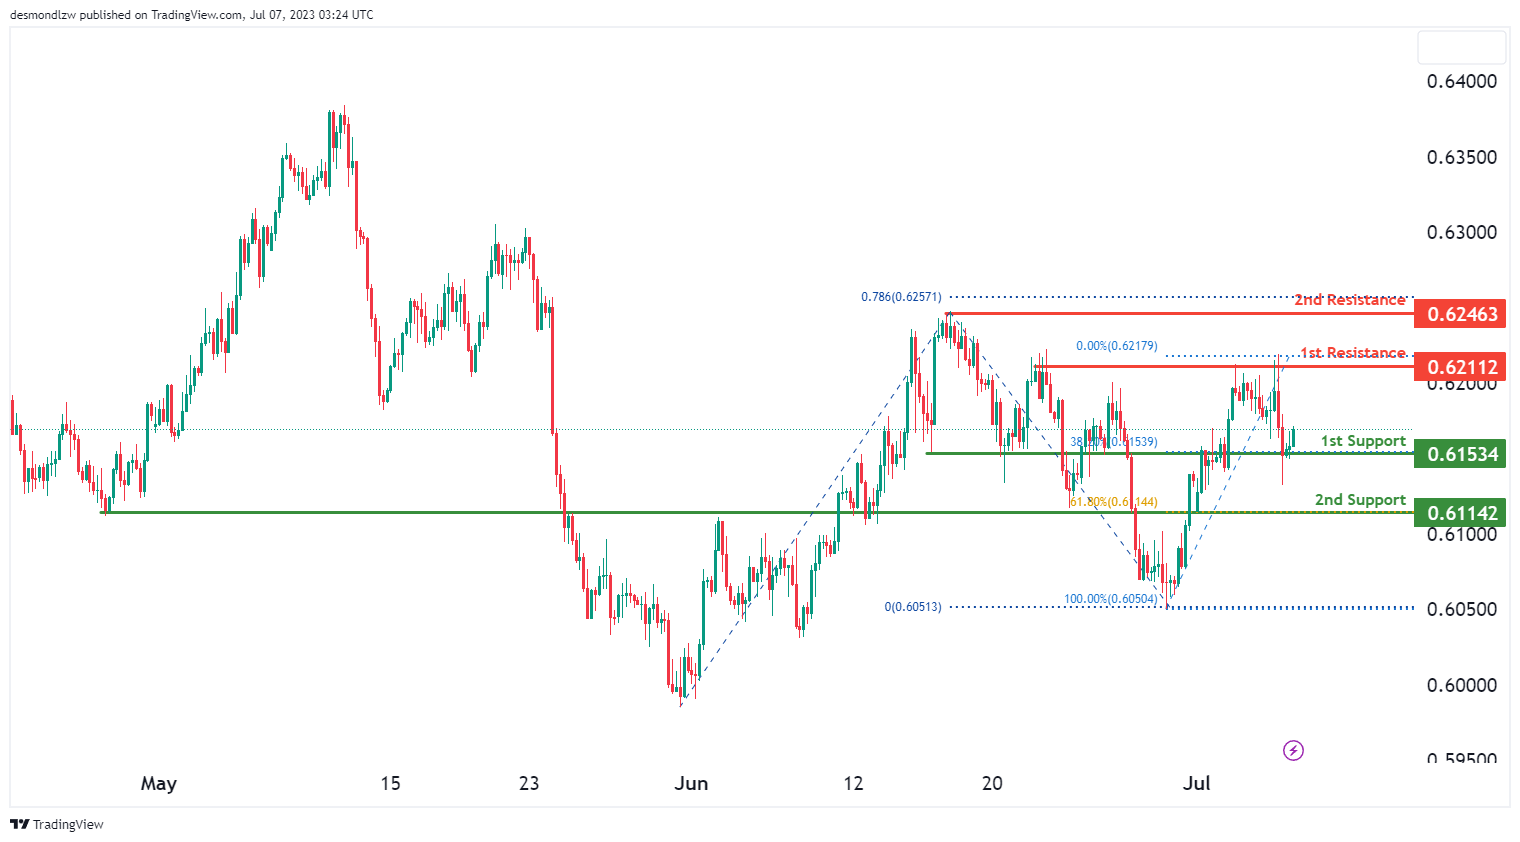
The NZD/USD chart shows a bullish momentum, indicating the potential for further upward movement. There is a possibility of a bullish continuation towards the 1st resistance level at 0.6211, which is an overlap resistance.
The 1st support level at 0.6153, along with the 38.20% Fibonacci Retracement level, provides good support. Additionally, the 2nd support level at 0.6114, aligned with the 61.80% Fibonacci Retracement level, further strengthens the support.
On the upside, the 2nd resistance level at 0.6246, accompanied by the 78.60% Fibonacci Projection level, acts as a significant resistance.
DJ30:
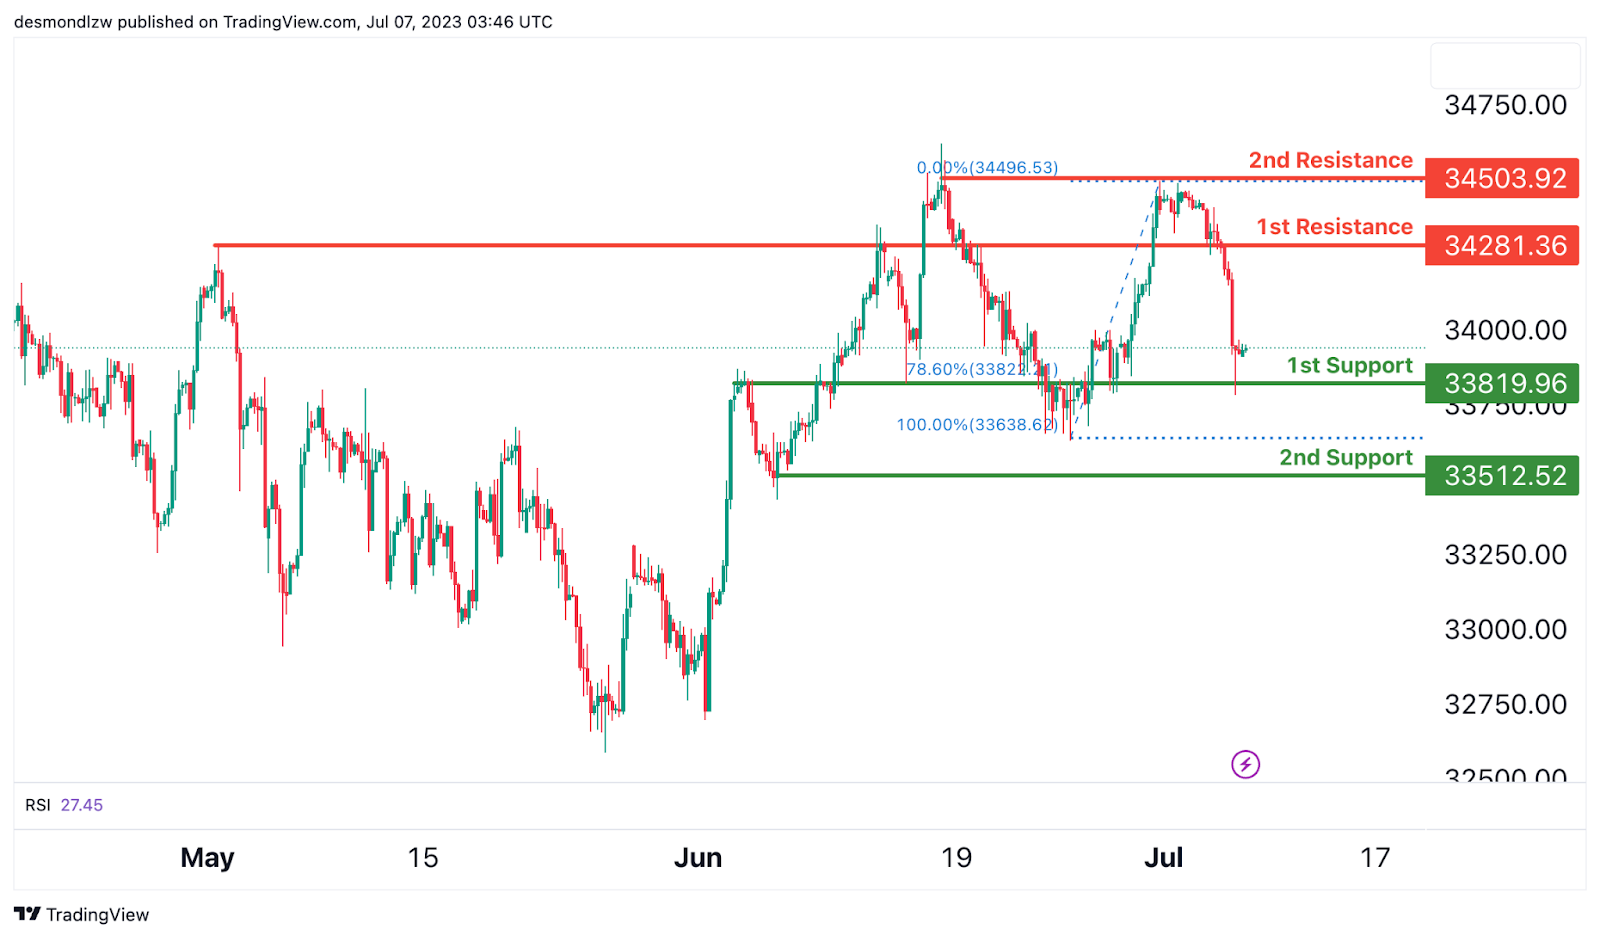
The DJ30 (Dow Jones Industrial Average) chart currently displays a strong bullish momentum, indicating a favorable market sentiment for upward movement.
There is a possibility for a bullish rebound from the reliable 1st support level located at 33819.96, which serves as a significant overlap support. This support level also aligns with a 78.60% Fibonacci Retracement, further reinforcing its importance. Additionally, the 2nd support level at 33512.52 acts as a swing low support, providing further potential downside support.
On the upside, it is worth noting that the 1st resistance level positioned at 34281.36 represents a significant overlap resistance, suggesting a potential area of price resistance. Furthermore, the 2nd resistance level at 34503.92 represents a multi-swing high resistance, indicating a noteworthy level that may act as a barrier to further price advancement.
GER30:
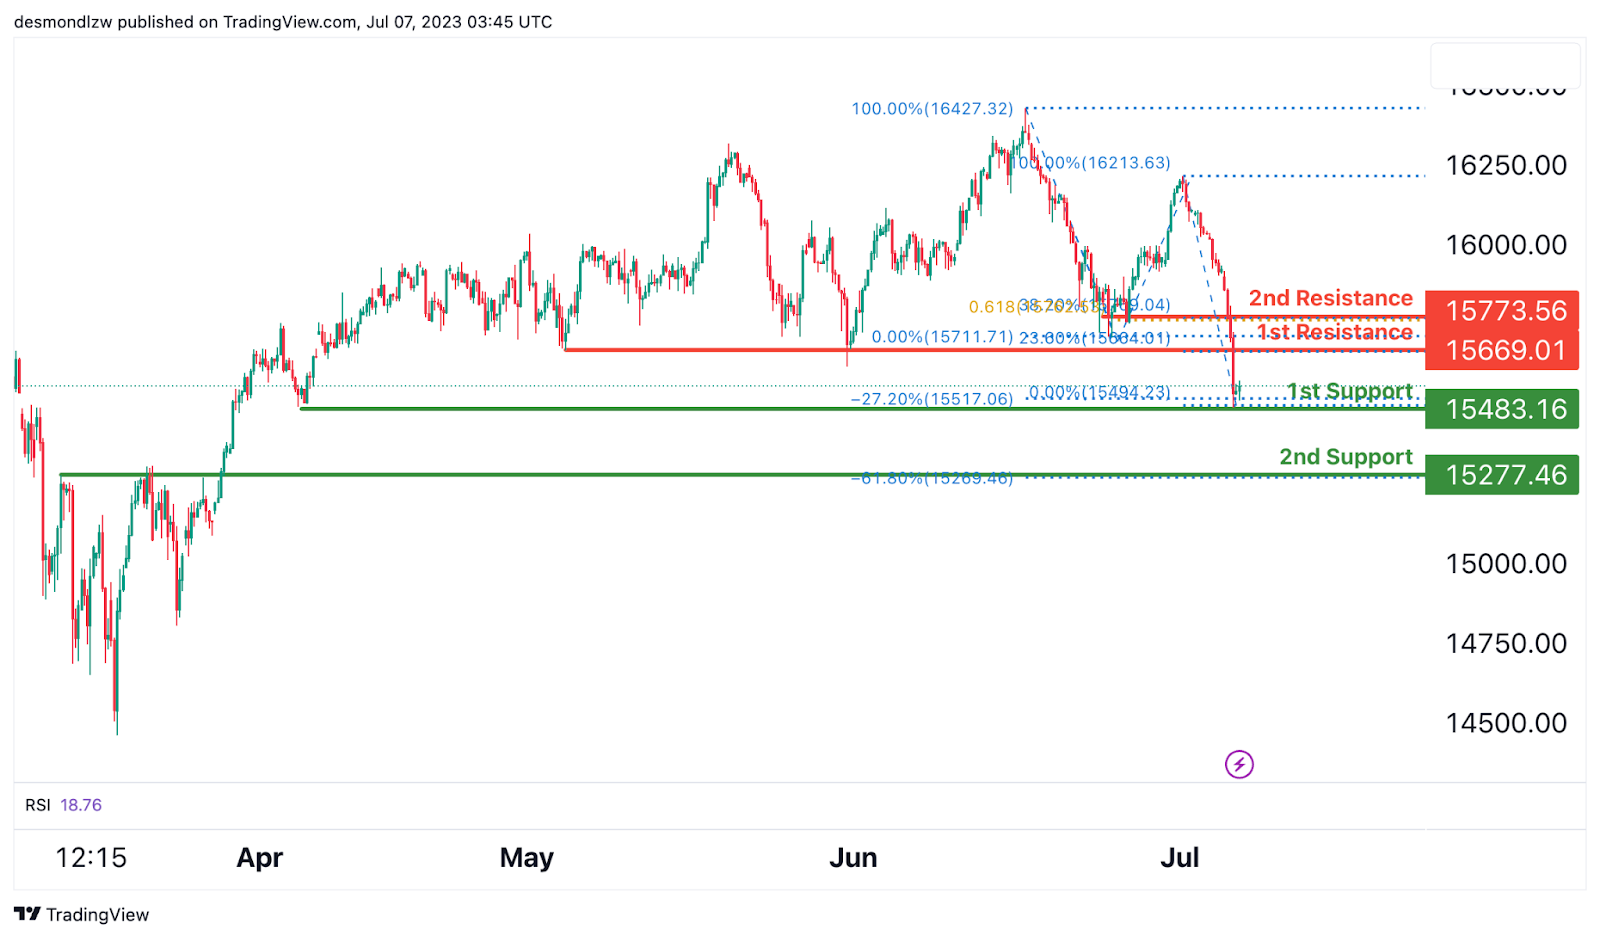
The GER30 (DAX) chart currently exhibits a strong bullish momentum, indicating a favorable market sentiment for upward movement.
There is a potential for a bullish rebound from the reliable 1st support level located at 15483.16, which is characterized as a significant multi-swing low support. This level also aligns with a -27% Fibonacci Expansion, further enhancing its significance.
On the upside, it is worth noting that the 1st resistance level positioned at 15669.01 represents a notable overlap resistance, indicating a potential area of price congestion. Moreover, the 2nd resistance level at 15773.56 coincides with a 61.80% Fibonacci Projection and acts as an additional overlap resistance, adding to its importance.
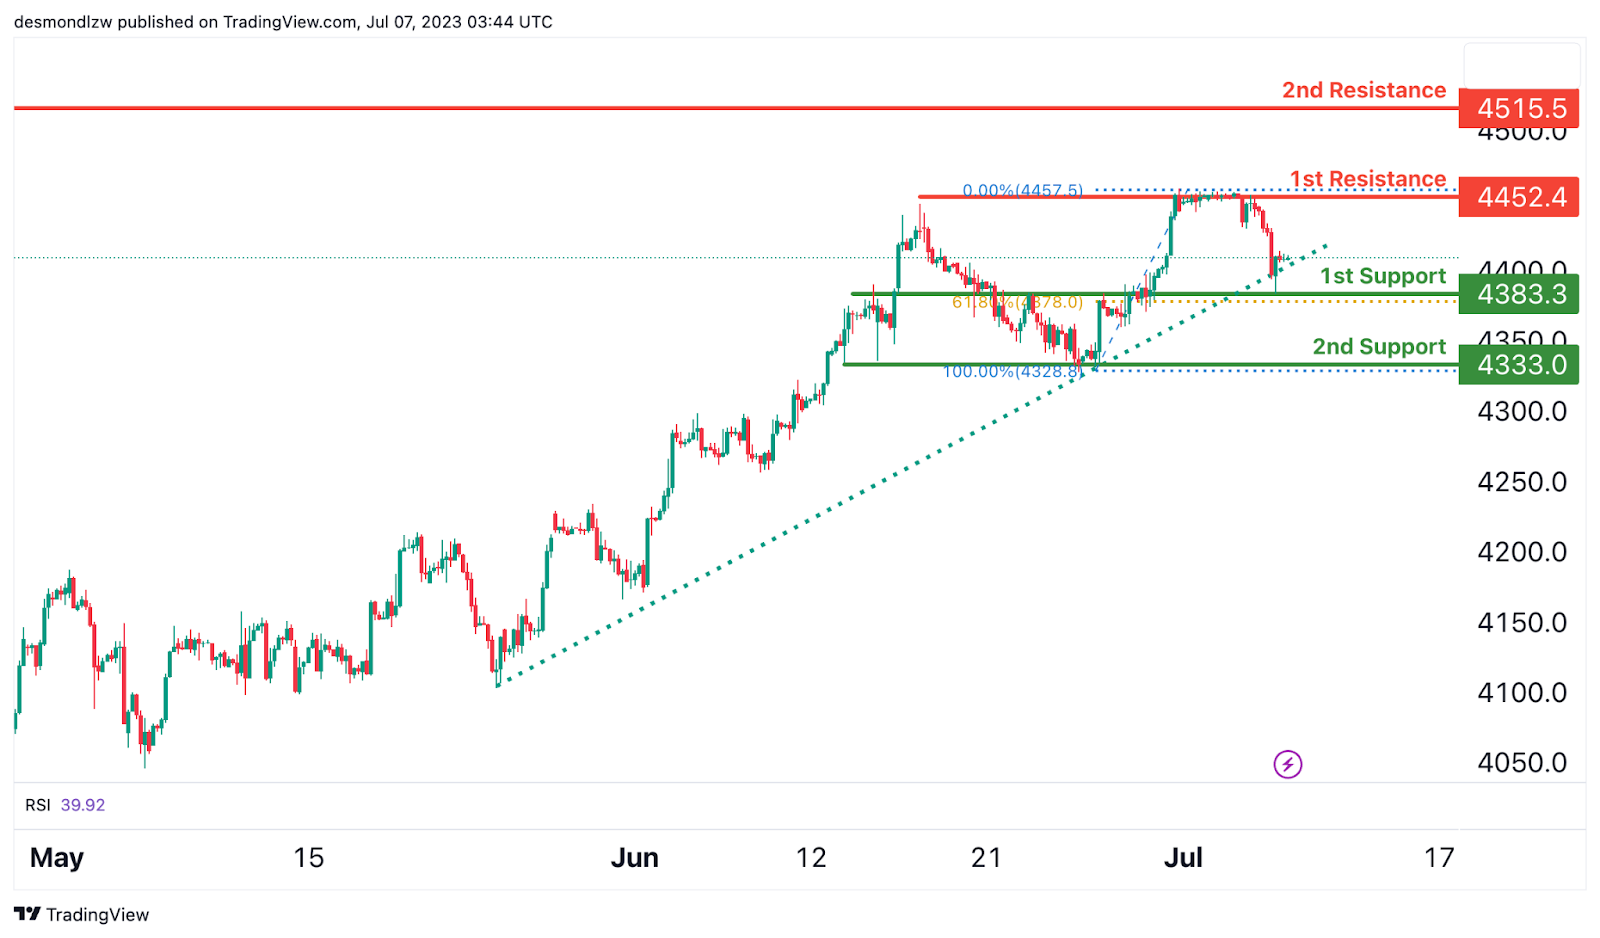
US500
The US500 (S&P 500) chart currently demonstrates a robust bullish momentum, suggesting a strong inclination for upward movement in the market.
There is a distinct possibility of witnessing a bullish rebound from the well-established 1st support level located at 4383.3, which is recognized as a significant multi-swing low support area.
On the upside, it is noteworthy that the 1st resistance level positioned at 4452.4 represents a notable overlap resistance, indicating a potential level of price congestion. Moreover, the 2nd resistance level situated at 4515.5 is considered a prominent swing high resistance, underscoring its significance in terms of potential price barrier.
BTC/USD:
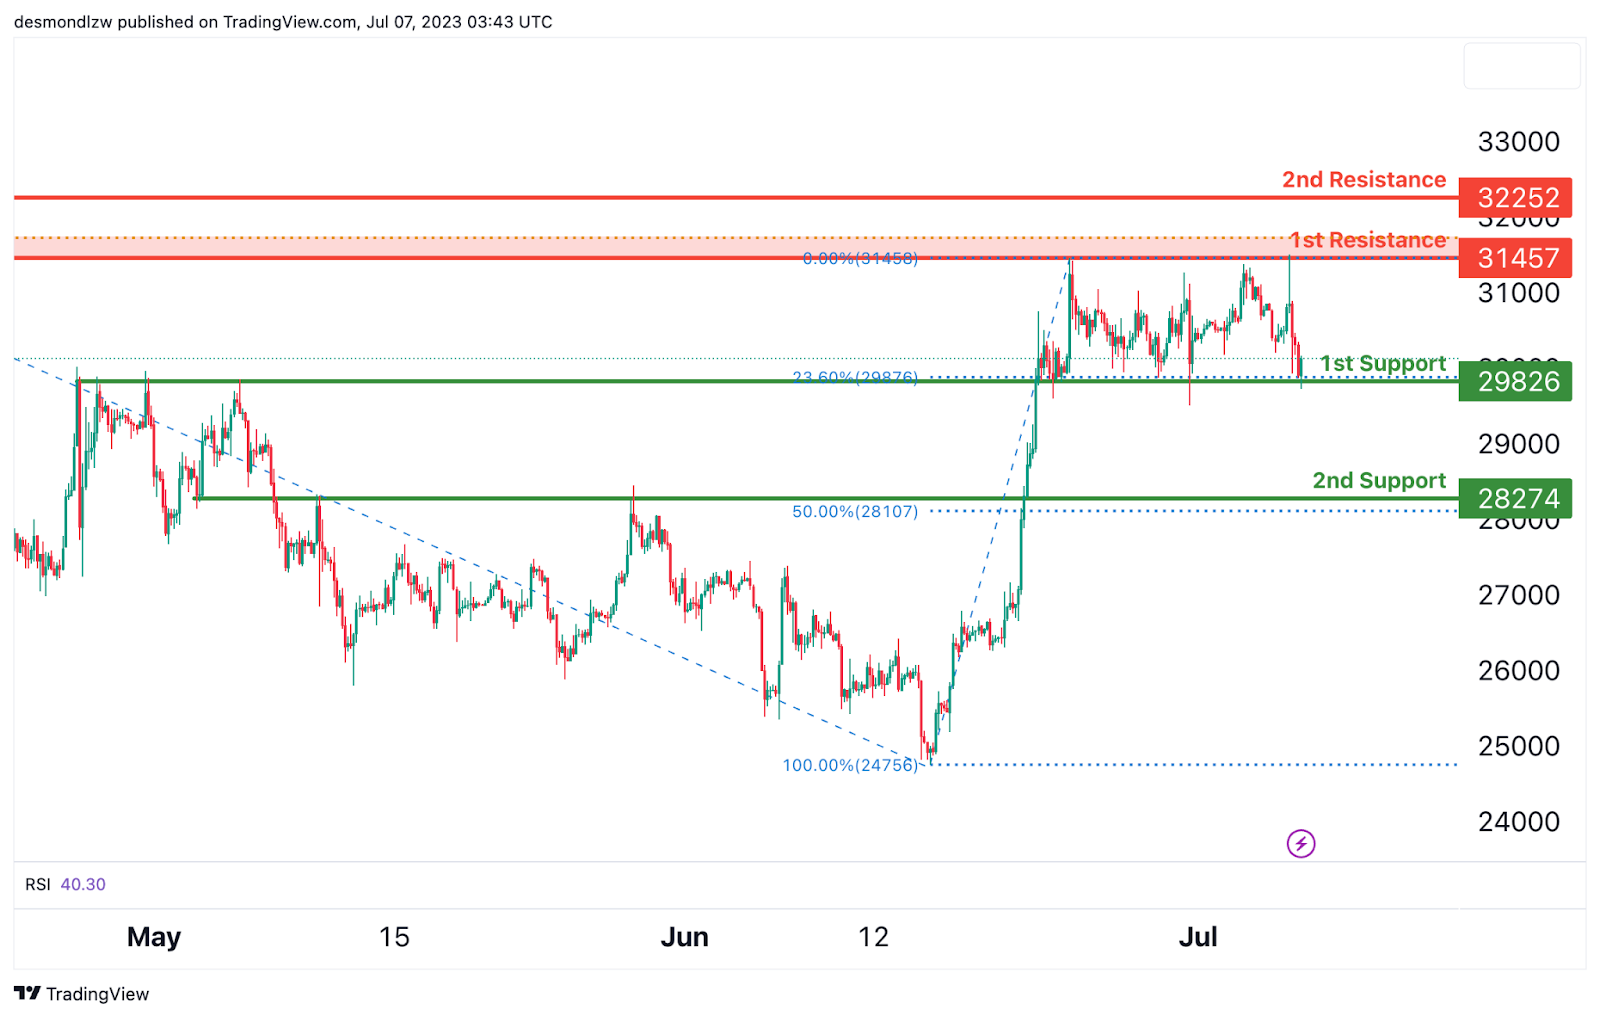
The BTC/USD (Bitcoin) chart currently demonstrates bullish momentum, indicating the potential for upward movement in the market.
There is a possibility of a bullish bounce off the 1st support level at 29826, which is identified as an overlap support and coincides with a 23.60% Fibonacci Retracement. Additionally, the 2nd support level at 28274 acts as an overlap support and aligns with a 50% Fibonacci Retracement.
On the upside, the 1st resistance level at 31457 represents a multi-swing high resistance with a 61.80% Fibonacci Projection. Furthermore, the 2nd resistance level at 32252 is identified as a swing high resistance.
ETH/USD:
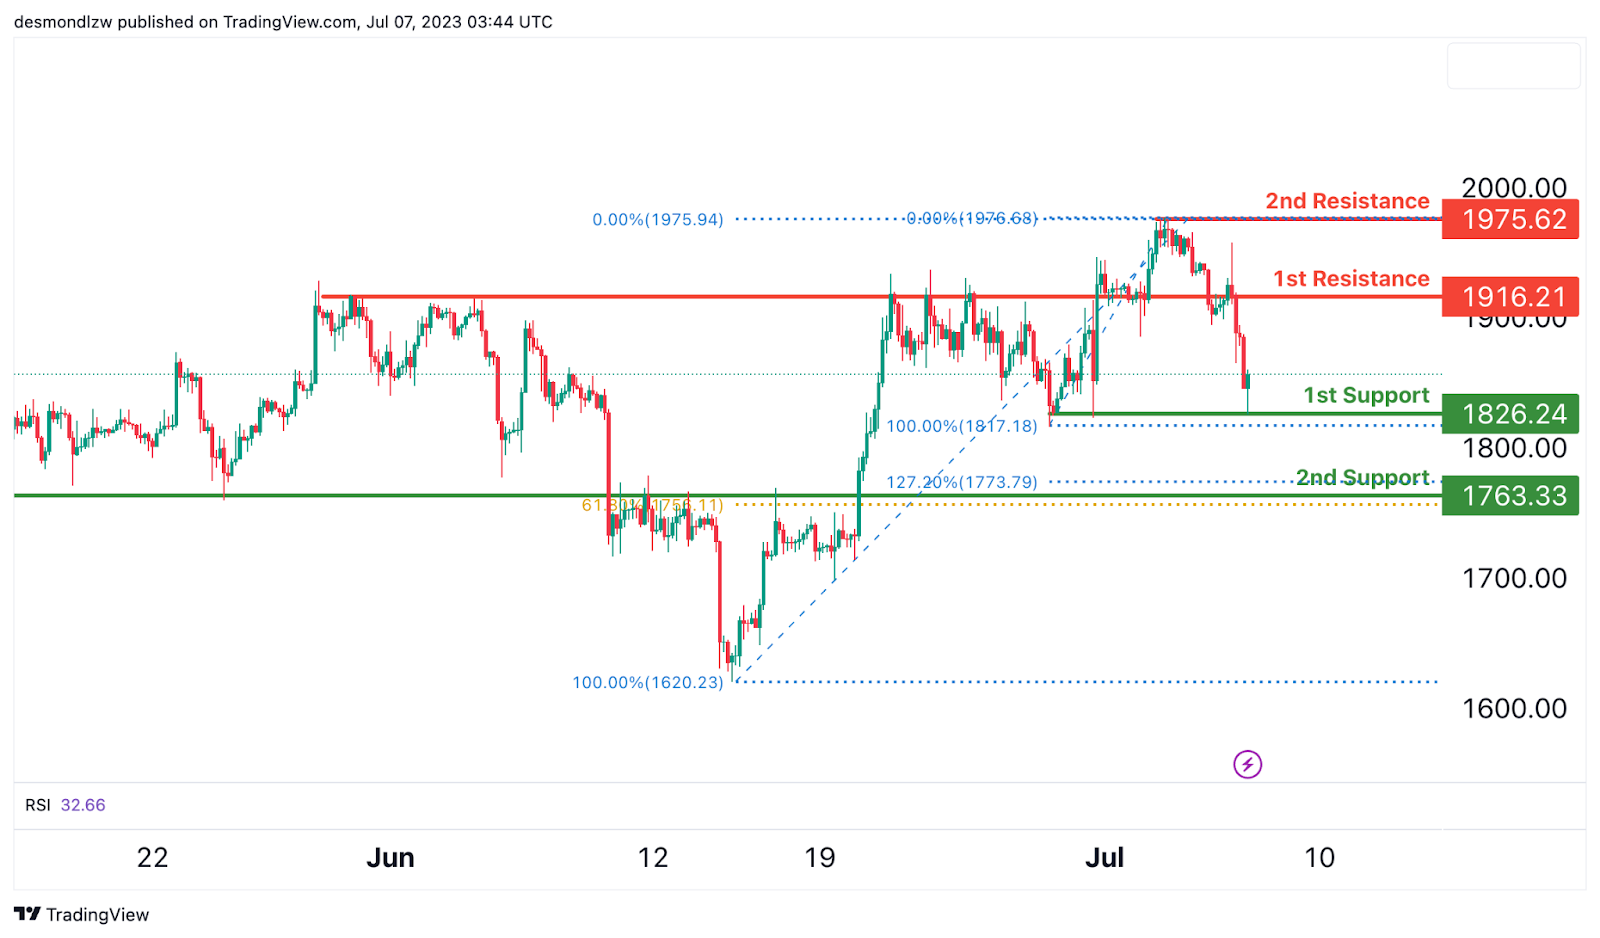
The ETH/USD (Ethereum) chart currently displays bullish momentum, suggesting the potential for upward movement in the market.
There is a possibility of a bullish bounce off the 1st support level at 1826.24, which is considered an overlap support and coincides with a 23.60% Fibonacci Retracement. Additionally, the 2nd support level at 1763.33 acts as an overlap support and shows Fibonacci confluence with a 127.20% Fibonacci Extension and a 61.80% Fibonacci Retracement.
On the upside, the 1st resistance level at 1916.21 represents an overlap resistance and aligns with a 61.80% Fibonacci Projection. Furthermore, the 2nd resistance level at 1975.62 is identified as a swing high resistance.
WTI/USD:
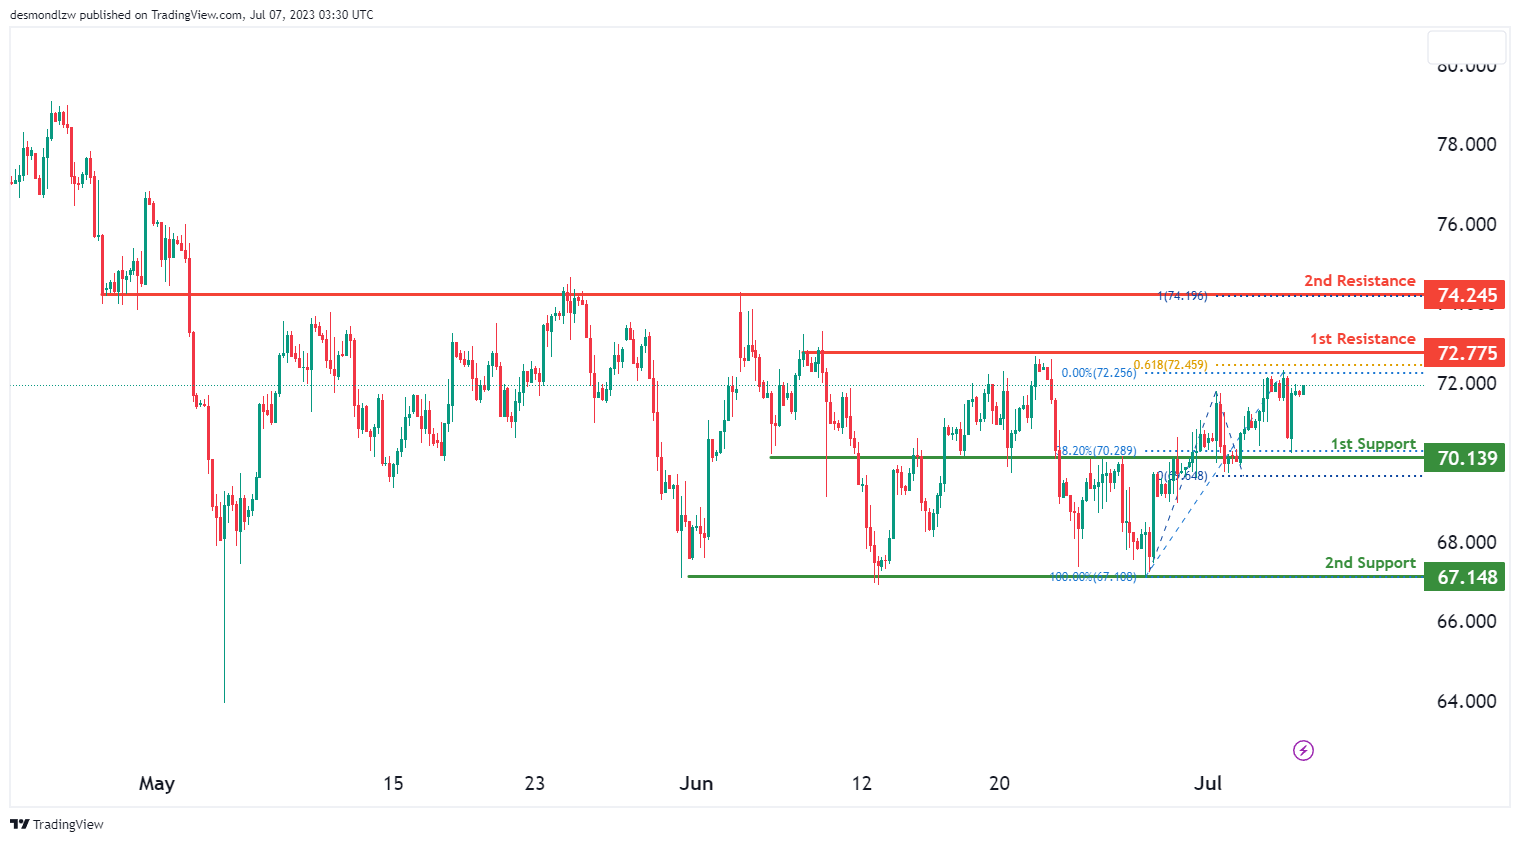
The WTI/USD (Crude Oil) chart currently demonstrates bullish momentum, indicating a potential upward movement in the market.
There is a possibility of a bullish continuation towards the 1st resistance level at 72.78, which is identified as an overlap resistance and aligns with a 61.80% Fibonacci Projection.
The 1st support level at 70.14 is considered strong as it represents an overlap support and coincides with a 38.20% Fibonacci Retracement. Additionally, the 2nd support level at 67.15 acts as another overlap support.
On the upside, the 2nd resistance level at 74.25 is an important level as it represents an overlap resistance and aligns with a 100% Fibonacci Projection.
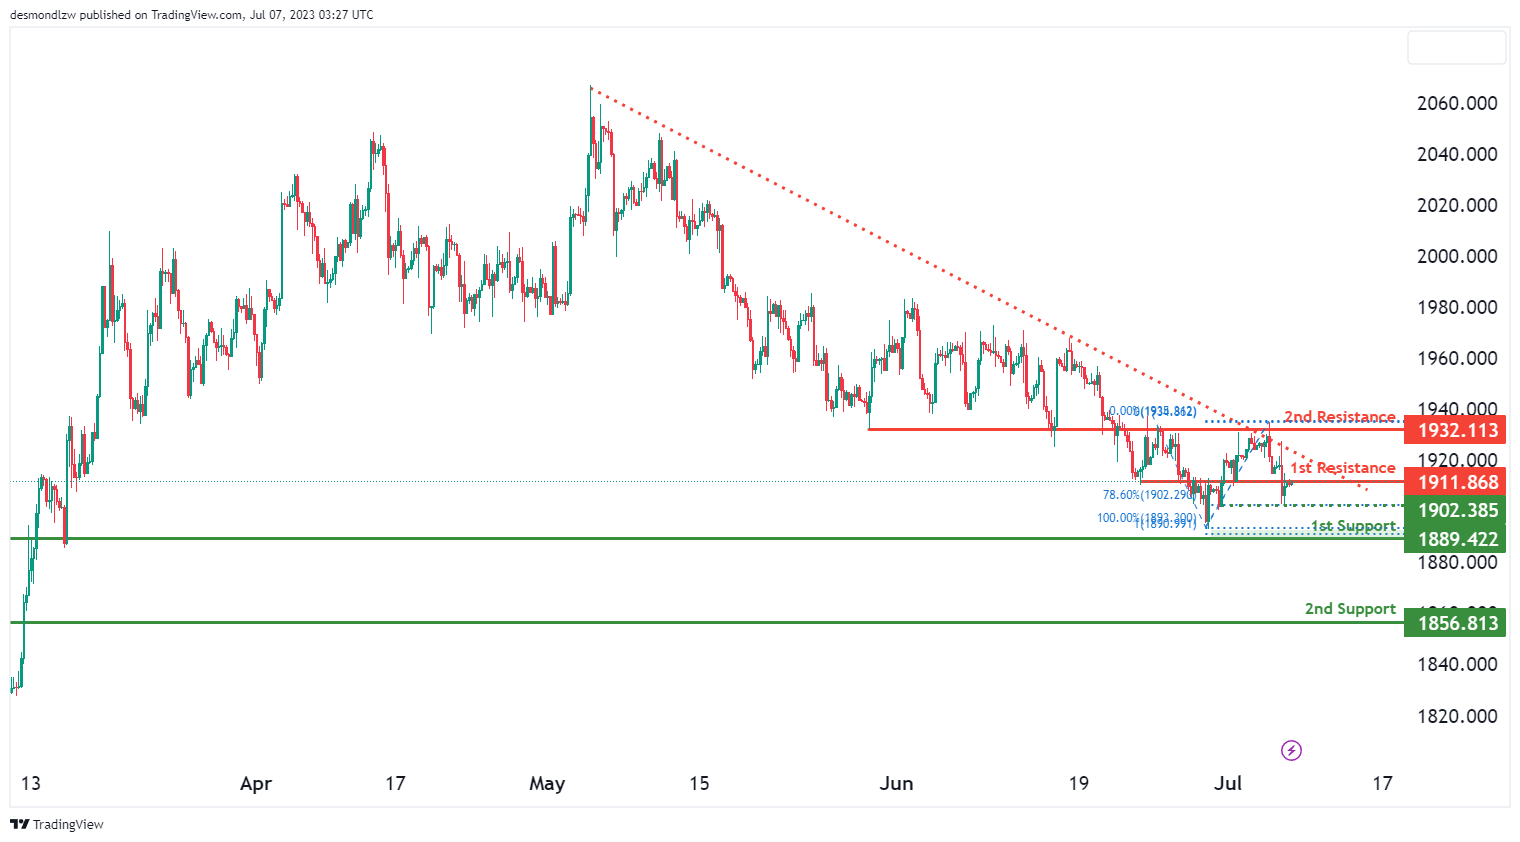
XAU/USD (GOLD):
The XAU/USD (Gold) chart currently exhibits a bearish momentum, supported by the price being below a major descending trend line and a descending trend line acting as resistance.
There is a potential for a bearish reaction off the 1st resistance level at 1911.86, identified as an overlap resistance. This could lead to a drop towards the 1st support level at 1889.42, characterized as an overlap support with a 100% Fibonacci Projection. The 2nd support level at 1856.81 also acts as a pullback support.
Additionally, there is an intermediate support level at 1902.38, which serves as a multi-swing low support with a 78.60% Fibonacci Retracement. The 2nd resistance level at 1932.11 is significant as it represents an overlap resistance and aligns with a 78.60% Fibonacci Retracement.