

Sample Category Title
US: Job Growth Slows in June, Remains Elevated on a Trend Basis
The U.S. economy added 209k jobs in June, slightly below the consensus forecast of 225k. Revisions to the two prior months were negative, subtracting 110k jobs from the previously reported figures.
- Hiring over the last three-months averaged 244k jobs per-month, a step down from the 312k measured over the three-months prior (March-January).
Hiring across the service sector (+120k) in June was the weakest it has been since December 2020 when it shed 339k jobs. Gains were narrowly concentrated in education & healthcare (+73k), leisure & hospitality (+21k), professional & business services (+21k) and 'other' services (+17k). Goods-producing industries (29k) notched a decent gain, with job growth concentrated in construction (+23k) and manufacturing (+7k). Government added 60k jobs last month.
- The breath of hiring – as captured by the diffusion index – narrowed to 58.0, its lowest level in three-months and second lowest of this expansionary cycle.
In the household survey, civilian employment rose by 273k, while the labor force grew by a smaller 133k. As a result, the unemployment rate ticked down 0.1 percentage points to 3.6%. Meanwhile, the participation rate held steady at its cyclical high of 62.6% for the fourth consecutive month.
Average hourly earnings rose 0.4% month-on-month (m/m) – matching May's upwardly revised gain – and are up 4.4% over the past year and an even stronger 4.7% on a three-month annualized basis.
Key Implications
There was plenty of evidence in this morning's report that the labor market is starting to cool. Not only did hiring come in below expectations – a first in fifteen months (!) – but revisions to prior months were also meaningfully lower. The breadth of hiring also narrowed considerably. It's important to note, however, that we are still very early stages. Hiring over the past three-months is still running at a pace that's nearly three times what's required to meet trend growth in the labor force.
Beyond the hiring numbers, signals on the inflation front remain somewhat mixed. While the optimist may point to average hourly earnings having slowed on a trend basis over the past year, the pessimist could counter with progress having stalled more recently. Moreover, other more comprehensive measures of wage growth including the Atlanta Fed's wage tracker and the Employment Cost Index (ECI) both continue to run well above average hourly earnings. We'll get the Q2 ECI reading on July 28th, and it will be interesting to see if it shows any recent signs of wage pressures easing.
Despite the early signs of cooling, the labor market remains far too tight. Taken alongside the recent strength across other key economic indicators (i.e., housing starts, home sales, new orders of capital goods) all point to an economy that's still running far too hot to cool inflation. With nearly all Fed officials supporting a more restrictive policy rate, another 25-basis point rate hike later this month seems inevitable.
Canada’s Labour Market Roars Back into Action in June
The Canadian labour market bounced back an impressive 60k positions in June, more than recouping May's losses. Full-time employment was up 110K while part-time employment fell 50k.
The unemployment rate rose another 0.2 percentage points to 5.4%, as strength in labour force growth (+114k) outstripped job gains. The participation rate increased two tenths of a percentage point to 65.7%.
Employment gains by industry were not particularly widespread. Industries with the biggest gains in percentage terms were manufacturing (+27.3k), wholesale and retail trade (+32.6k), transportation and warehousing (+10.4k), health care and social assistance (+20.7k), natural resources (3k), and finance insurance and real estate (9.8k). Losses were seen in construction (-13.5k), education (-14k), business, building and other support services (-2.4k) and in professional, scientific and technical services (-6.5k).
Lastly, total hours worked were virtually unchanged in June, and wages were up 4.2% year-on-year (vs 5.1% in May).
Key Implications
A June rebound in hiring keeps Canada's job market resilience intact. The rise in the unemployment rate over the past two months is coming against a backdrop of job gains, and full-time positions no less, but the labour force growth has been even stronger. Month-to-month swings in job gains are volatile in Canada, but looking at three and six-month trends in hiring, job gains have slowed, in line with our forecast for the unemployment rate to rise towards 6% by the end of this year.
This is the last key piece of data before the Bank of Canada's interest rate decision next Wednesday. We expect the only modest cooling in inflation in wages will tip the Bank in favour of another 25 basis point hike. However, if they opt to skip a meeting, their tone is likely to remain hawkish, and a September hike would remain on the table.
USD/JPY Mid-Day Outlook
Daily Pivots: (S1) 143.53; (P) 144.10; (R1) 144.63; More...
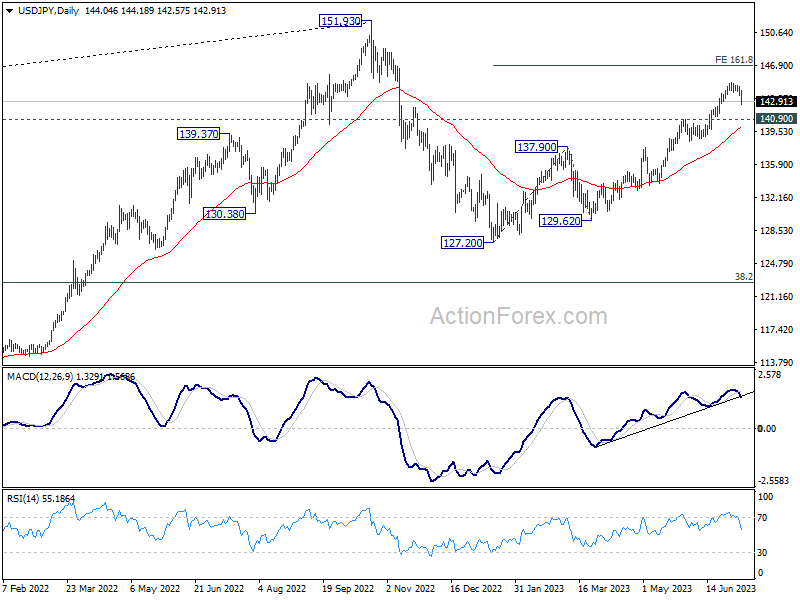
Intraday bias in USD/JPY is back on the downside with break of 143.54 temporary low. Deeper decline would be seen as corrective fall from 145.06 extends. But still, overall outlook remains bullish with 140.90 resistance turned support intact. Break of 145.06 will resume larger rise to 161.8% projection of 127.20 to 137.90 from 129.62 at 146.93.
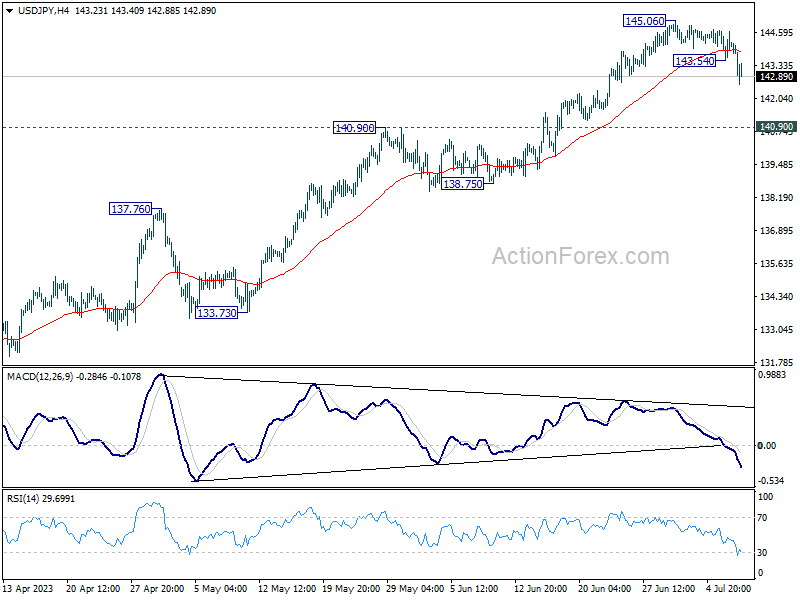
In the bigger picture, rise from 127.20 is currently seen as the second leg of the corrective pattern from 151.93 high. Further rally is expected as long as 138.75 support holds, to retest 151.93. But strong resistance could be seen there to limit upside. Break of 138.75 will indicate the the third leg has started back towards 127.20.
Dollar Down after as NFP Provides No Shock
Dollar falls broadly after US non-farm payroll report didn't provide any shock to the markets. Nevertheless, the headline job growth was still solid, with unemployment rate steady, and wages growth staying at a relatively high level. US 10-year yield dipped initially following the release by quickly recovered. Stocks futures attempted to pare earlier against but failed so far. It remains to be seen if selling in the greenback would pick up any momentum, and whether risk-off sentiment will come back.
Elsewhere in the markets, Canadian Dollar is also relatively unmoved, except versus the greenback, despite strong Canadian employment data. Yen is currently the strongest one thanks to earlier rebound today. Sterling is the second strongest, but it doesn't really excel much again Euro and Swiss Franc. Aussie appears to lack any momentum to get out of one of the week's worst position.
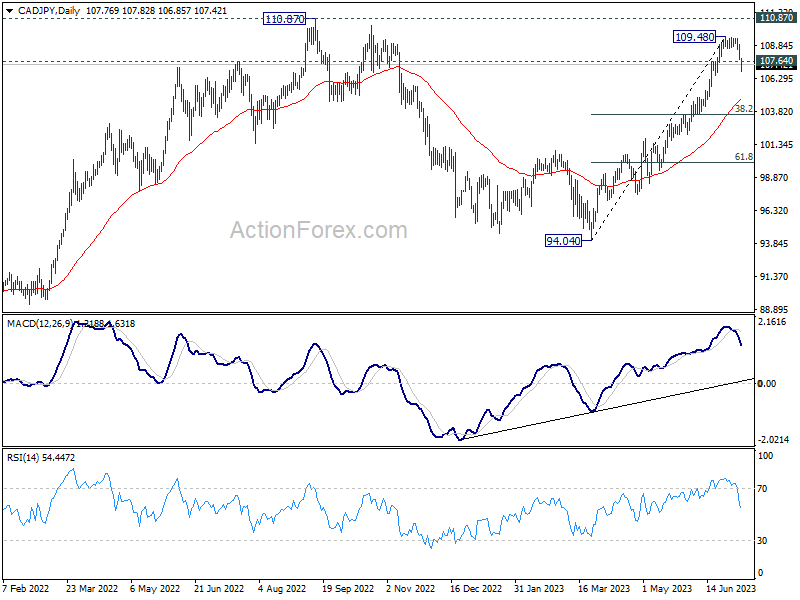
Technically, CAD/JPY's earlier dive today and break of 107.64 support should confirm short term topping at 109.48, ahead of 110.87 higher. Deeper decline is now in favor in the near term to 55 D EMA (now at 104.74). Reactions from there would reveal whether fall current fall is a correction to rise from 94.04 only, or the third leg of the pattern from 110.87.
In Europe, at the time of writing, FTSE is down -0.24%. DAX is up 0.48%. CAC is up 0.57%. Germany 10-year yield is up 0.024 at 2.651. Earlier in Asia, Nikkei dropped -1.17%. Hong Kong HSI dropped -0.90%. China Shanghai SSE dropped -0.28%. Singapore Strait Times dropped -0.35%. Japan 10-year JGB yield rose 0.0248 to 0.436.
US NFP grew 209k in Jun, lowest since 2020
US non-farm payroll employment grew 209k in June, slightly below expectation of 220k. That's the lowest level since December 2020. That compares to average of 278k per month over the first 6 months of the year.
Unemployment rate dropped from 3.7% to 3.6%, below expectation of being unchanged at 3.7%. Number of unemployed person was little changed at 6m. Labor force participation rate was unchanged at 2.6% for the fourth consecutive month.
Average hourly earnings rose 0.4% mom, above expectation of 0.3% mom. Average workweek edged up by 0.1 hour to 34.4 hours.
Canada employment up 59.9k in Jun, unemployment rate rose to 5.4%
Canada employment rose 59.9k in June, well above expectation of 19.8k. Employment gains in June were all in full-time work (110k), part-time jobs fell (-50k).
Employment rose in wholesale and retail trade (33k), manufacturing (27k), health care and social assistance (21k) and transportation and warehousing (10k). Meanwhile, declines were recorded in construction (-14k), educational services (-14k) and agriculture (-6k).
Unemployment rate rose from 5.2% to 5.4%, above expectation of 5.3%. There were 1.1m people unemployed in June, an increase of 54k in the month.
Average hourly wages rose 4.2% yoy, down from may's 5.1% yoy.
ECB Lagarde warns of simultaneous rise in company profits and wages
ECB President Christine Lagarde voiced concerns over lingering inflation risks in a recent interview with Geneviève Van Lède, conducted on July 5.
Lagarde noted that while inflation "has started to decline," it remains "still higher than our medium-term target of 2%," according to the ECB's staff projections. The expectation is for it to remain above target in 2024 and 2025, indicating a continued need to work towards reigning in inflation to meet the target.
On the economic growth front, Lagarde highlighted that growth "has been flat in the last two quarters." However, she added, "We estimate euro area growth to be around 0.9% in 2023." She further asserted that "we should see a return to potential growth over the period 2024-25."
Lagarde also pointed out an interesting development in the context of high inflation. She noted that current period of high inflation did not correspond with a decrease in firms' profit margins; in fact, margins saw an increase in certain instances, especially where demand for goods and services surpassed supply. Simultaneously, wages have experienced an unexpected rise.
In this complex backdrop, Lagarde stressed, "it is important to know whether firms are going to reduce their margins a little to meet their employees' expectations of higher wages and to restore some of their purchasing power," a trend typically seen during past inflation episodes.
Alternatively, there could be a twofold increase in margins and wages. She warned that a simultaneous increase in both would exacerbate inflation risks, cautioning that "we would not stand idly by in the face of such risks."
BoJ's Uchida cautions against premature policy shift
BoJ Deputy Governor Shinichi Uchida voiced caution over a hasty shift in monetary policy amid current economic climate. In an interview with Nikkei, Uchida emphasized that Japan was far from needing to hastily raise interest rates.
"The risk of missing the opportunity to achieve our 2% target with a premature policy shift is bigger than that of being too late in tightening policy and allowing inflation to continue running above 2%," Uchida explained.
Uchida noted the budding changes in Japanese companies' behavior, which have been rooted in the country's deflationary period. He stressed the importance of nurturing these developments with care. However, he cautioned that uncertainty remains high over inflation outlook, including impact of pricing behaviors and wage hikes by companies.
"We have not reached a point where we can foresee the 2 percent price stability target can be attained stably and sustainably," Uchida said. He also recognized the burden placed on households due to more than 2% rise in core CPI, reinforcing the importance of supporting the economy with current monetary easing to stabilize inflation at 2%, in tandem with wage growth.
Uchida also touched on foreign exchange rates, noting the unwanted uncertainty caused by Yen's rapid and one-sided depreciation. He highlighted the importance of stable foreign exchange rates, which should reflect economic and financial fundamentals. "The BOJ will coordinate with the government, and closely monitor developments in the foreign exchange market and their impact on the economy and prices," he added.
Japan's nominal wages surge, yet real wages and household spending stumble
Japanese workers saw their nominal wages surge 2.5% yoy in May, significantly surpassing expected increase of 1.2% yoy. Regular pay, which includes basic salaries, rose by an impressive 1.8% yoy, marking the highest gain since February 1995. Meanwhile, overtime and other non-regular pay saw a modest increase of 0.4% yoy, while special pay including bonuses skyrocketed by 22.2% yoy.
However, inflation-adjusted real wage index tells a different story. It dropped by -1.2% yoy in May, marking a 14-month declining streak. The reduction, nonetheless, was less severe than -3.2% yoy drop experienced a month earlier. This appears to mirror the effects of pay raise agreements established during this year's "shunto" spring labor-management negotiations.
Despite these wage increases, separate data revealed that Japanese household spending fell -4.0% yoy in May , outpacing median market forecast for a -2.4% yoy drop. This decline extended for the third month and affected a range of expenses from food to clothing to transportation. On a seasonally adjusted monthly basis, household spending dipped by -1.1% mom, This represents the fourth consecutive month of decline.
USD/JPY Mid-Day Outlook
Daily Pivots: (S1) 143.53; (P) 144.10; (R1) 144.63; More...
Intraday bias in USD/JPY is back on the downside with break of 143.54 temporary low. Deeper decline would be seen as corrective fall from 145.06 extends. But still, overall outlook remains bullish with 140.90 resistance turned support intact. Break of 145.06 will resume larger rise to 161.8% projection of 127.20 to 137.90 from 129.62 at 146.93.
In the bigger picture, rise from 127.20 is currently seen as the second leg of the corrective pattern from 151.93 high. Further rally is expected as long as 138.75 support holds, to retest 151.93. But strong resistance could be seen there to limit upside. Break of 138.75 will indicate the the third leg has started back towards 127.20.
Economic Indicators Update
| GMT | Ccy | Events | Actual | Forecast | Previous | Revised |
|---|---|---|---|---|---|---|
| 23:30 | JPY | Labor Cash Earnings Y/Y May | 2.50% | 1.20% | 1.00% | 0.80% |
| 23:30 | JPY | Overall Household Spending Y/Y May | -4.00% | -2.40% | -4.40% | |
| 05:00 | JPY | Leading Economic Index May P | 109.50% | 97.50% | 96.80% | |
| 05:45 | CHF | Unemployment Rate Jun | 2.00% | 2.00% | 2.00% | |
| 06:00 | EUR | Germany Industrial Production M/M May | -0.20% | 0.10% | 0.30% | |
| 06:45 | EUR | France Trade Balance (EUR) May | -8.4B | -9.5B | -9.7B | -10.6B |
| 07:00 | CHF | Foreign Currency Reserves (CHF) Jun | 725B | 734B | ||
| 08:00 | EUR | Italy Retail Sales M/M May | 0.70% | 0.10% | 0.20% | |
| 12:30 | USD | Nonfarm Payrolls Jun | 209K | 220K | 339K | 306K |
| 12:30 | USD | Unemployment Rate Jun | 3.60% | 3.70% | 3.70% | |
| 12:30 | USD | Average Hourly Earnings M/M Jun | 0.40% | 0.30% | 0.30% | 0.40% |
| 12:30 | CAD | Net Change in Employment Jun | 59.9K | 19.8K | -17.3K | |
| 12:30 | CAD | Unemployment Rate Jun | 5.40% | 5.30% | 5.20% | |
| 14:00 | CAD | Ivey PMI Jun | 50.9 | 53.5 |
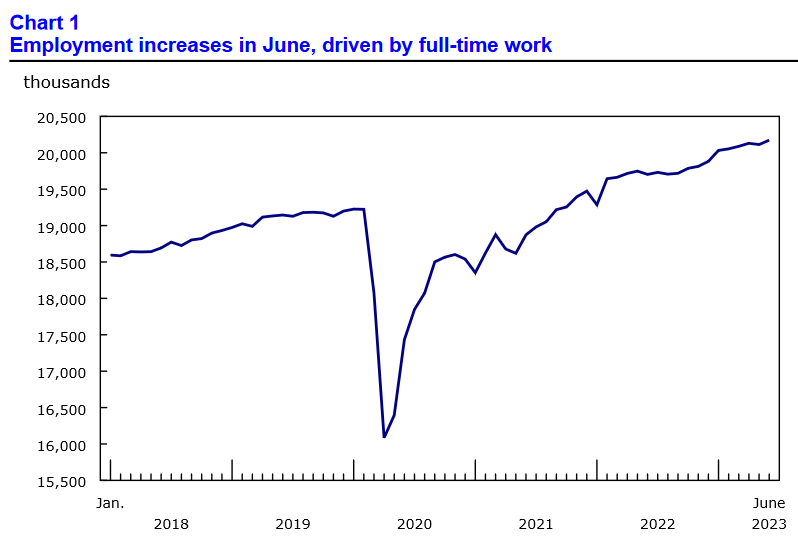
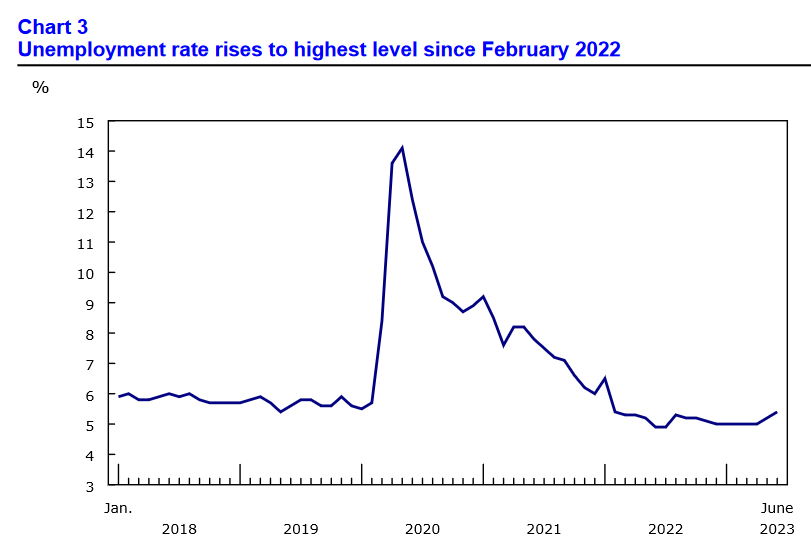
Canada employment up 59.9k in Jun, unemployment rate rose to 5.4%
Canada employment rose 59.9k in June, well above expectation of 19.8k. Employment gains in June were all in full-time work (110k), part-time jobs fell (-50k).
Employment rose in wholesale and retail trade (33k), manufacturing (27k), health care and social assistance (21k) and transportation and warehousing (10k). Meanwhile, declines were recorded in construction (-14k), educational services (-14k) and agriculture (-6k).
Unemployment rate rose from 5.2% to 5.4%, above expectation of 5.3%. There were 1.1m people unemployed in June, an increase of 54k in the month.
Average hourly wages rose 4.2% yoy, down from may's 5.1% yoy.
US NFP grew 209k in Jun, lowest since 2020
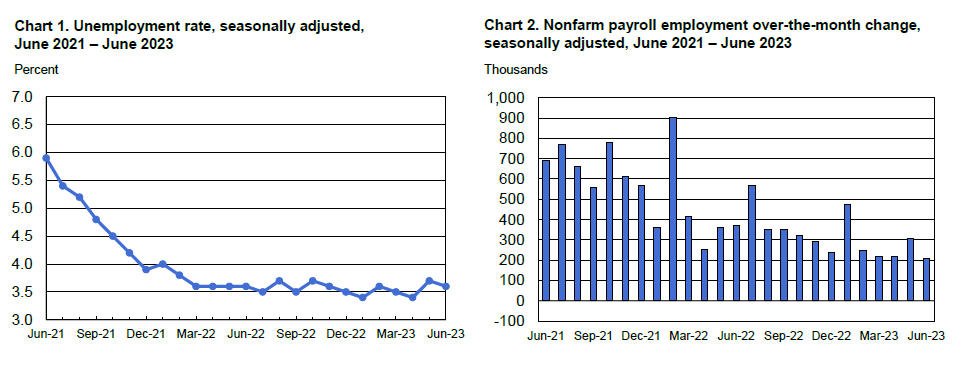
US non-farm payroll employment grew 209k in June, slightly below expectation of 220k. That's the lowest level since December 2020. That compares to average of 278k per month over the first 6 months of the year.
Unemployment rate dropped from 3.7% to 3.6%, below expectation of being unchanged at 3.7%. Number of unemployed person was little changed at 6m. Labor force participation rate was unchanged at 2.6% for the fourth consecutive month.
Average hourly earnings rose 0.4% mom, above expectation of 0.3% mom. Average workweek edged up by 0.1 hour to 34.4 hours.
Canadian Dollar on a Roll ahead of US, Canada Job Reports
- US nonfarm payrolls expected to drop, but massive ADP jobs report is making investors nervous.
- Canada’s labour market is expected to rebound with a 20,000 gain.
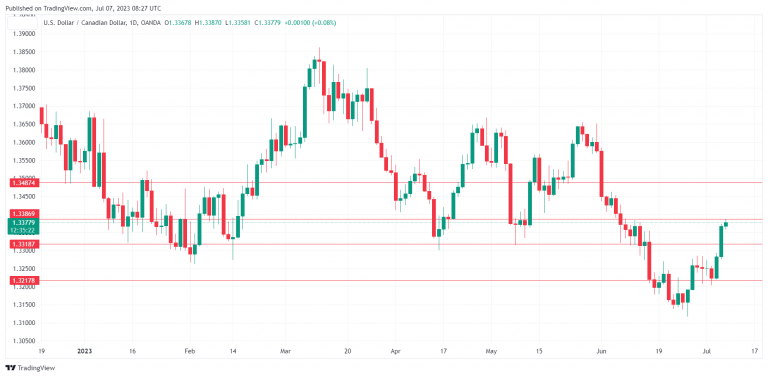
The Canadian dollar is drifting in the European session, trading at 1.3378.
It has been a good week for the Canadian currency, which is up about 1% against its US cousin. We can expect some significant movement from USD/CAD in the North American session, as both Canada and the US release the June employment reports.
Will Nonfarm Payrolls follow the ADP and soar?
The US labour market has been surprisingly resilient in the wake of relentless tightening by the Fed. After 500 basis points of hikes, the labour market remains strong and has been a driver of inflation, interfering with the Fed’s efforts to curb inflation.
The ADP employment report usually doesn’t get much attention, as it is not considered a reliable precursor to nonfarm payrolls, which follows a day or two after the ADP release. The June ADP reading was an exception, as the massive upturn couldn’t be ignored. ADP showed a gain of some 497,000 new jobs, crushing the consensus estimate of 267,000 and the May reading of 228,000. The nonfarm payrolls report is expected to ease to 225,000 in June, down from 339,000 in May, but investors are nervous that nonfarm payrolls could follow the ADP release and head higher.
If nonfarm payrolls defies the consensus estimate and climbs higher, the US dollar should respond with gains. The Fed, which is very much hoping that the labour market weakens, would be forced to consider more tightening than it had anticipated. The money markets are widely expecting a rate hike on July 27th but have priced in a September pause at 67%, according to the CME FedWatch tool. If nonfarm payrolls jump higher, all bets are off and I would expect the probability of a September pause to fall.
Canada releases the June report later on Friday, which is usually overshadowed by US nonfarm payrolls. As in the US, the Canadian labour market has been strong – the economy added jobs for nine consecutive months until the May report. Canada is expected to add 20,000 new jobs in June, while the unemployment rate is projected to inch higher to 5.3% in June, up from 5.2% in May.
USD/CAD technical
- USD/CAD is testing resistance at 1.3318. Next, there is resistance at 1.3386.
- 1.3217 and 1.3149 are providing support.
How Will NFP Affect the Markets?
Here’s the scoop: Businesses employ various strategies to soften economic conditions before resorting to mass layoffs. These measures include reducing job postings, hiring less, cutting temporary help, and reducing hours worked. Average weekly hours have decreased, potentially indicating a return to normal or a slackening labor market depending on future trends. Sectors such as retail trade, transportation and warehousing, and construction have experienced a decline in hours worked, making them more susceptible to job losses. Conversely, industries like education and health, where hours remain elevated, may show more resilience. While declining hours worked could suggest a weakening economy, it is important to consider the overall hiring landscape and employer enthusiasm for qualified workers. At the moment, financial analysts are predicting a weakening in the Dollar, but let’s see how the price action looks.
US DOLLAR - D1 Timeframe
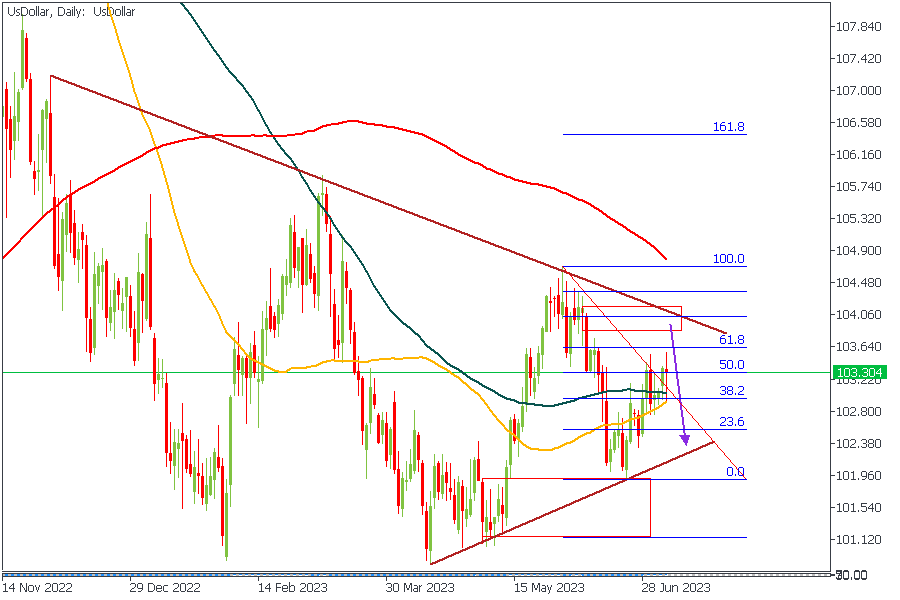
Without much effort, it is pretty clear that the US Dollar is trading within a consolidation wedge pattern, with the most recent rejection having happened from the trendline support. This means we can expect the price reach for the resistance trendline to bounce off and resume its bearish momentum. Confluences for this include:
- The drop-base-drop supply zone.
- Bearish moving averages array.
- Resistance trendline.
- The Fibonacci retracement level.
Analyst’s Expectations:
- Direction: Bearish
- Target: 102.647
- Invalidation: 104.489
USDCAD - D1 Timeframe
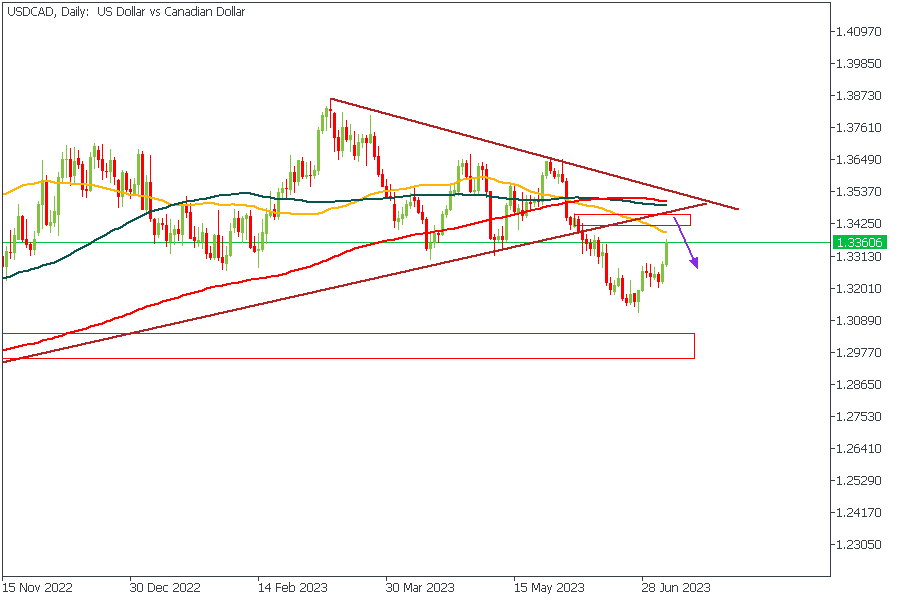
With a weakening Dollar, I expect a bearish movement from commodities like USDCAD and USDJPY. This could be easily confirmed by reviewing the price action critically from a technical point of view to search out entry points. In the attached USDCAD chart, the area of confluence of the 50-day moving average, the resistance trendline, and the supply zone could be that sweet spot for an entry.
Analyst’s Expectations:
- Direction: Bearish
- Target: 1.32597
- Invalidation: 1.34645
XAUUSD - D1 Timeframe
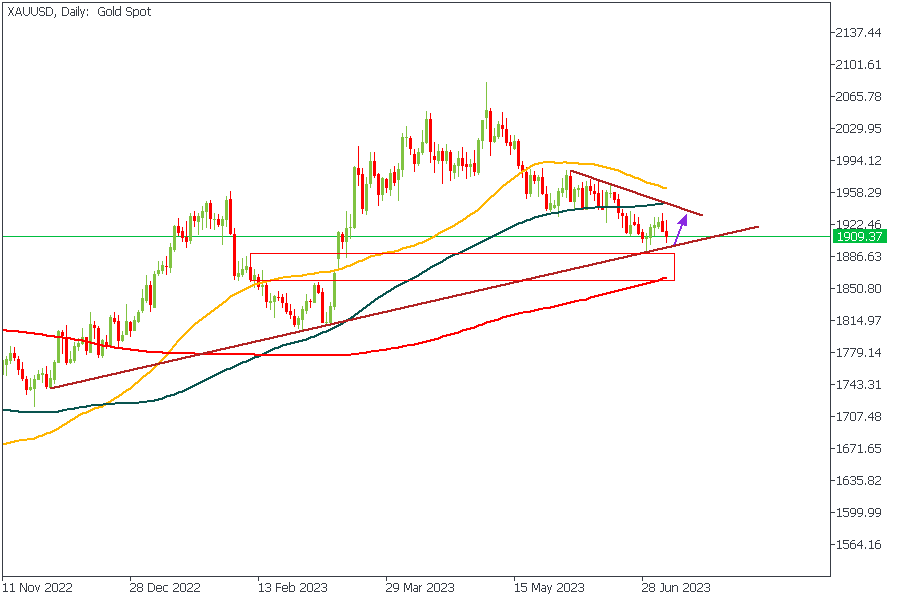
XAUUSD (Gold) is often the go-to commodity for many traders due to its volatility, and we know that the NFP (Non-farm Payrolls) would only make the volatility even much more vibrant - so, exercise a bit of caution, eh? Nonetheless, the price action shows the price bouncing off the support trendline of a wedge consolidation pattern. Considering also that the moving averages are arranged in an ascending manner, plus the 200-day moving average support and the demand zone within the same region, I would be cashing in on a bullish continuation from that region.
Analyst’s Expectations:
- Direction: Bullish
- Target: 1933.16
- Invalidation: 1888.56
CONCLUSION
The trading of CFDs comes at a risk. Thus, to succeed, you have to manage risks properly. To avoid costly mistakes while you look to trade these opportunities, be sure to do your due diligence and manage your risk appropriately.
GBPJPY Ready to Switch to Corrective Mode
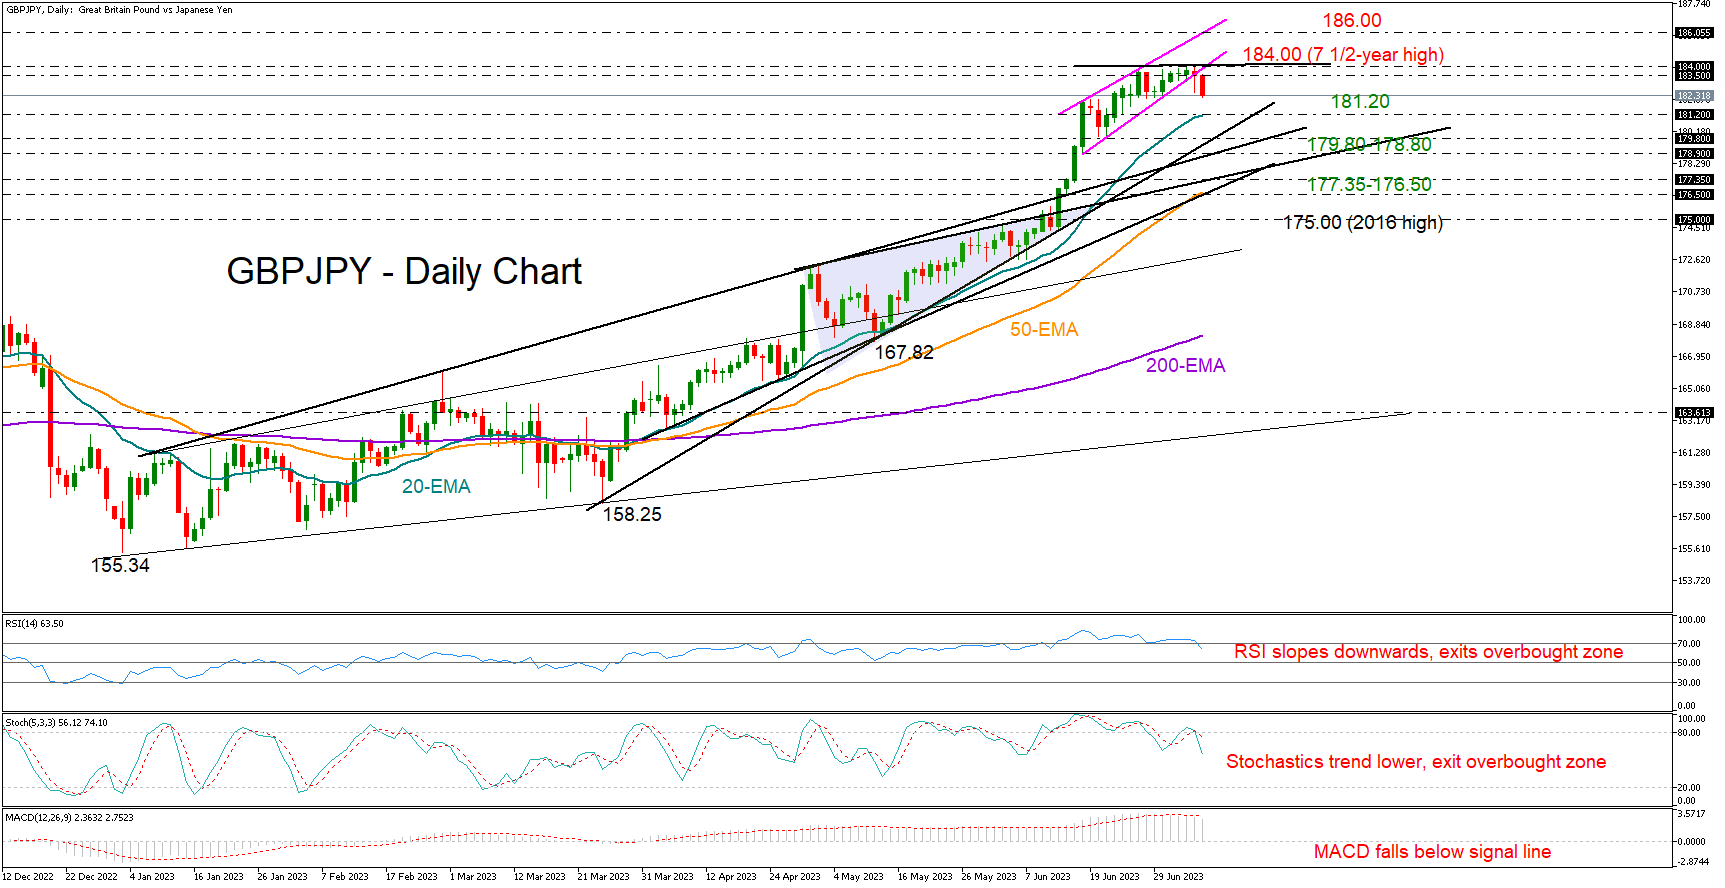
GBPJPY formed a steeper bullish tube in mid-June, which is now at risk of a breakdown as the bulls seem to have run out of fuel around a seven-and-a-half year high of almost 184.00.
The tiny candlesticks at the top of the uptrend are witnessing fizzling buying interest and should the pair close clearly below the bullish formation and the 183.50 area today, the decline could eventually extend towards the 20-day exponential moving average (EMA) at 181.20. The support trendline, which connects all the lows from March 24th, and the broken resistance line from January might establish a stronger safety net within the 179.80-178.80 zone. If the sell-off intensifies from there, the door will open for the 50-day EMA and the ascending trendlines coming from April and May, all within the 177.35-176.50 area.
According to the technical signals, the ascent in the market is overdone as the RSI and the stochastics seem to have peaked in the overbought zone. The MACD has also slipped below its red signal line, suggesting a weakening bias.
For the bulls to come back into play, the price will need to pierce through the 184.00 ceiling and re-enter the broken short-term bullish pattern. In that scenario materializes, the uptrend might stretch up to the nearby resistance line at 186.00. An acceleration higher could next stall near the 2014-2015 constraining zone of 189.00-189.50.
In brief, GBPJPY’s uptrend could take a breather in the short-term, especially if the price stays below 183.50. Still, with the pair trading comfortably above its previous high of 175.00, a downside correction could be considered as a “buying the dip” phase.
BTCUSD Analysis: Price Has Updated High of the Year, What’s Wrong With That?
In an interview with Fox Business, the CEO of Black Rock fund (over $8 trillion under management), Larry Fink, made some positive comments about bitcoin. Briefly:
→ bitcoin can become a catalyst for the tokenization of various assets and securities, which, in turn, can lead to a revolution in the financial sector;
→ bitcoin has unique properties that distinguish it from traditional stores of value such as gold. For example, its international recognition.
Fink also expressed the hope that the positive experience of cooperation between Black Rock and the SEC will allow the regulator to approve the launch of an ETF based on bitcoin (the application has already been submitted, but Larry did not give forecasts on the timing of its consideration).
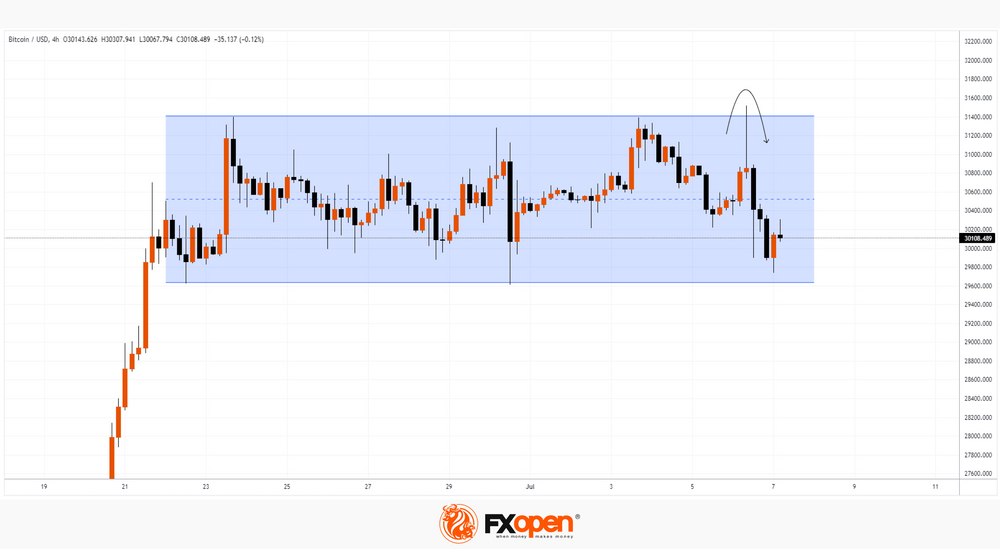
Fink's words were received with enthusiasm by the crypto community, which gave the market a bullish mood. The price of BTC/USD yesterday updated the maximum of the year.
But in this story there is a negative, which lies in the nature of the behavior of the price of BTC/USD when updating the maximum. The BTC/USD chart shows that there was only a slight excess of the previous peak, after which the price went down sharply, reaching almost the lower limit of the range in which it has been since the 22nd.
Strong markets don't behave like this. This false break provides an argument that the bears are active and may attempt to break out of the current range.