Sample Category Title
Platinum’s Correction in the Form of Expanded Flat
Platinum (PL) is still correcting cycle from 9.1.2022 low and the correction is likely in the form of expanded flat. In this article, we will update the longer term Elliott Wave outlook for Platinum. We also present an alternate view if the pivot at September 2022 low (803) fails, which suggests a bigger correction against March 2020 low remains in play. In the bigger picture, the metal is in a bullish grand super cycle move higher against March 2020 low.
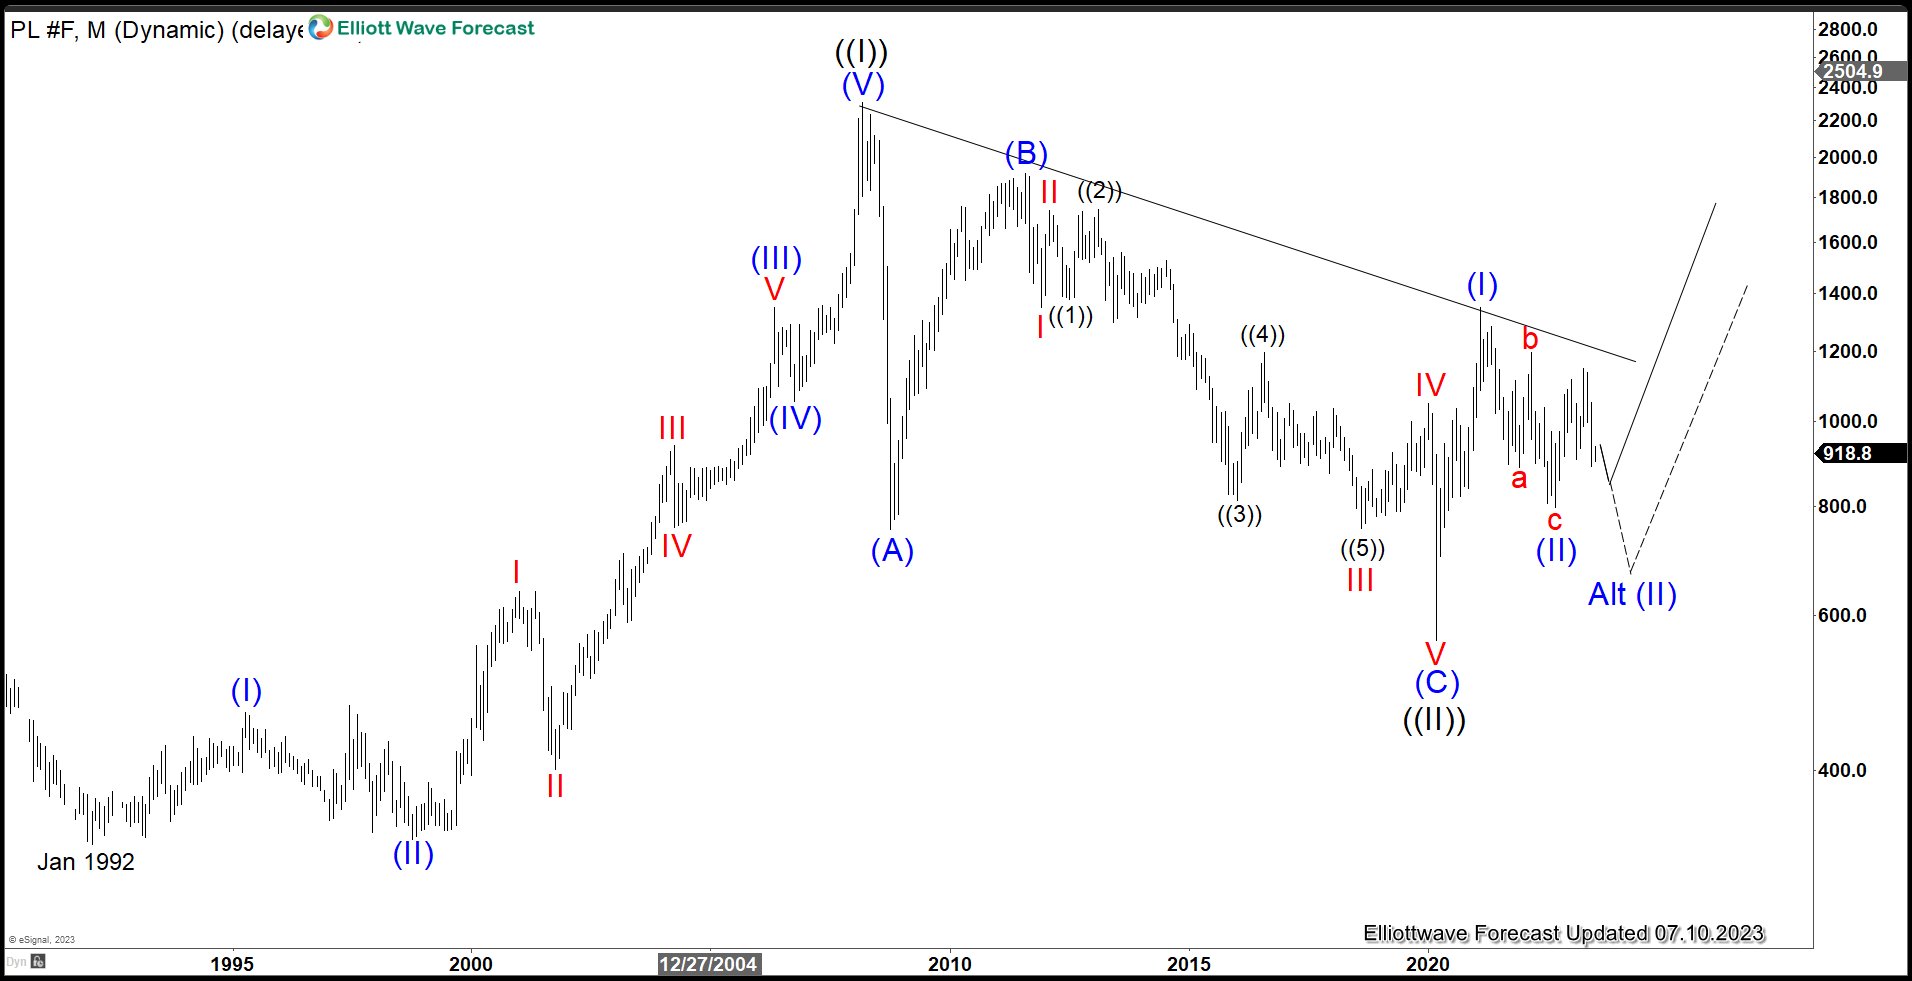
Platinum (PL) Monthly Elliott Wave Chart
Monthly Elliott Wave Chart of Platinum above shows that it has ended important grand super cycle wave ((II)) low on March 2020. From there, it has started to turn higher in wave ((III)) with internal subdivision in 5 waves. Up from wave ((II)), wave (I) ended at 1348.2. Wave (II) pullback is proposed complete at 796.8 on September 2022. Alternatively, the metal can also do a double correction in wave (II. The dotted line on the above chart shows the alternate path. Either way, as far as it stays above wave ((II)) low at 562, it should resume higher again.
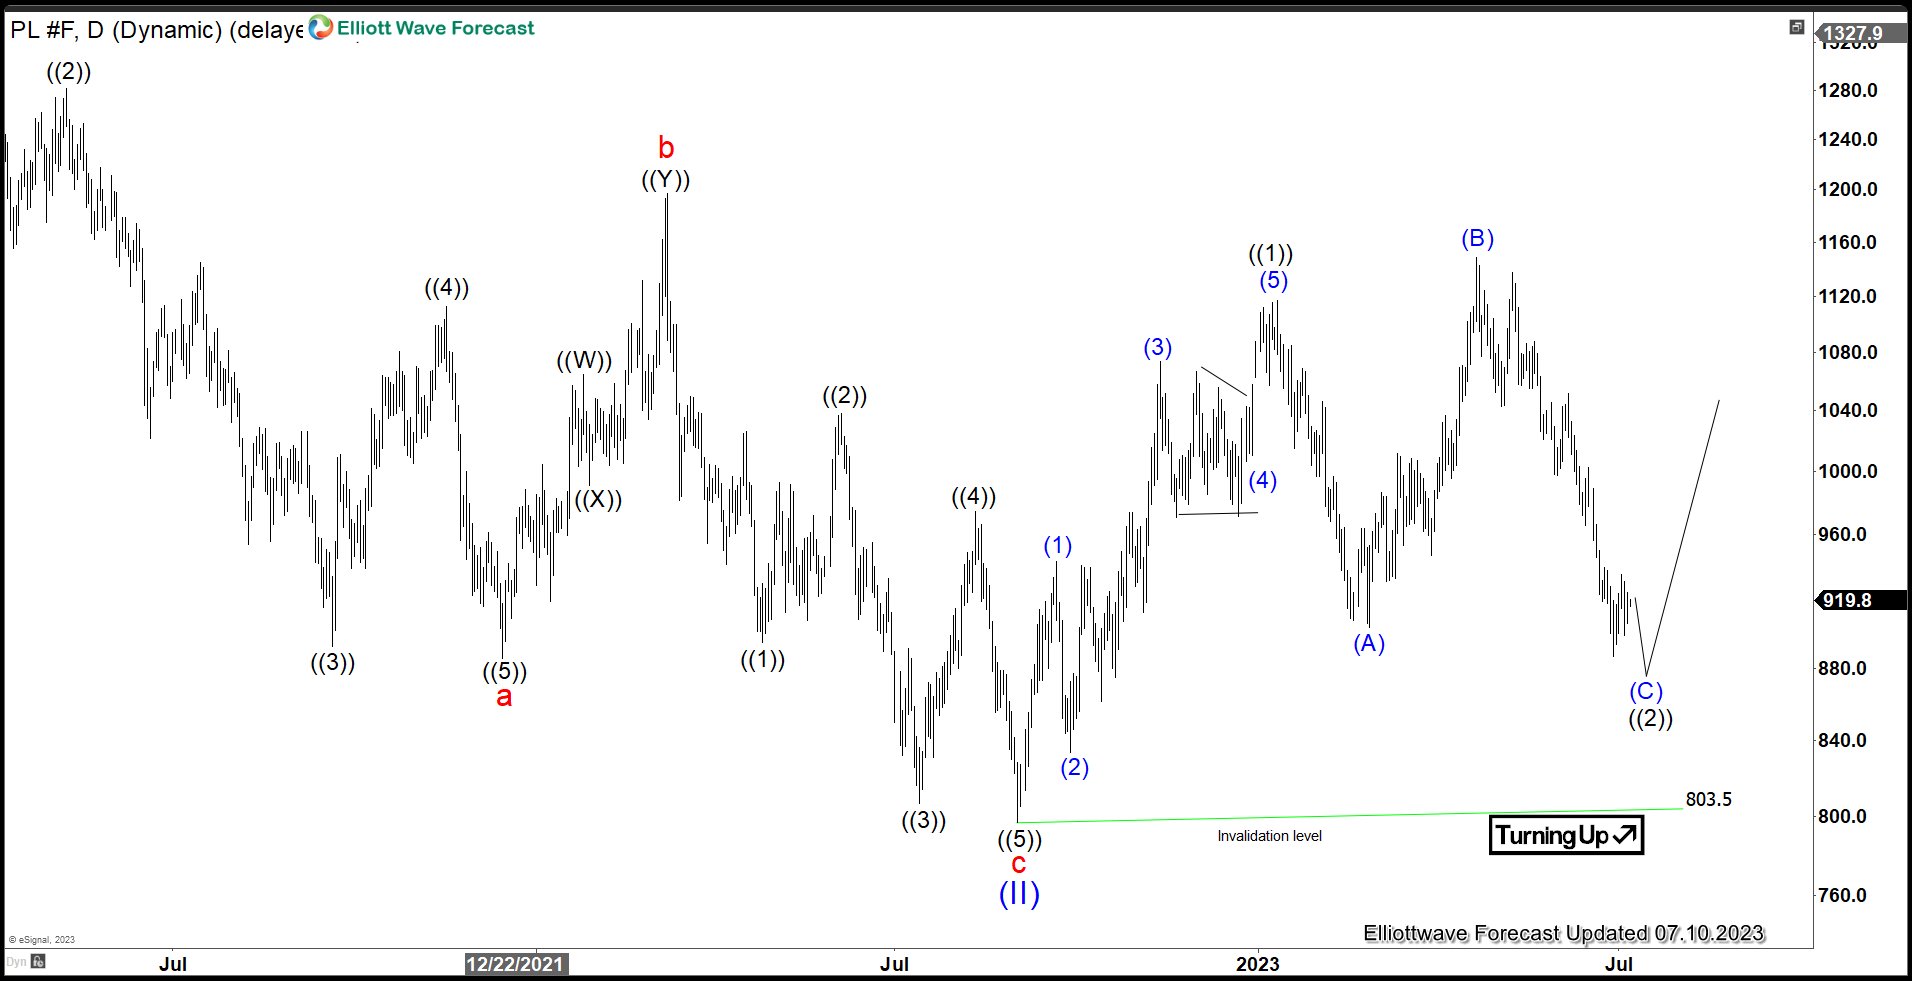
Platinum (PL) Daily Elliott Wave Chart
Daily Elliott Wave Chart on Platinum above shows that wave ((2)) pullback is currently in progress to correct cycle from 9.1.2022 low as expanded Flat structure. Up from wave (II), wave ((1)) completed at 1117. Pullback remains ongoing now with wave (A) ended at 903.9 and wave (B) ended at 1148.9. Wave (C) of ((2)) lower is expected to complete above 803.5 and the metal should then resume higher again. As an alternate, wave (II) can be doing a double as the first chart (monthly chart) above shows. In the alternate scenario, Platinum will do a larger correction in wave (II) but the pullback should remain above March 2020 low at 562 before it turns higher.
Forex and Cryptocurrencies Forecast
EUR/USD: Much Depends on the CPI
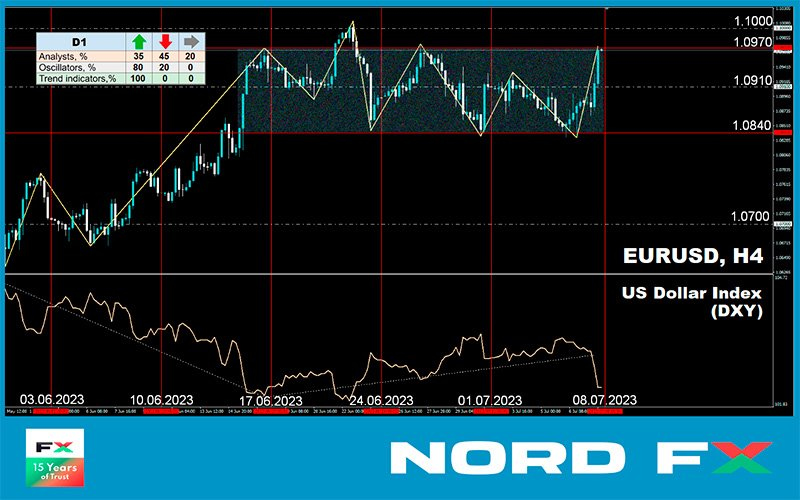
The Dollar Index (DXY) steadily increased during the past week, leading up to Thursday, July 6. As a result, EUR/USD was more inclined towards the American currency, causing the pair to find a local bottom at the 1.0833 level. The dollar's strength was driven by the publication of the minutes from the Federal Open Market Committee's (FOMC) last meeting on June 14. In it, the Committee members highlighted the risks of inflationary pressure and expressed a commitment to swiftly achieve their target inflation levels of 2.0%. They also noted the appropriateness of at least one more interest rate hike, in addition to the one in July, which boosted confidence for DXY bulls. Recall that the head of the regulator, Jerome Powell, also stated at the end of June that the "vast majority of Federal Reserve leaders expect two or more rate hikes by the end of the year".
Everything seemed to be going well for the dollar. However, the statistics released throughout the week were quite mixed, stirring doubts regarding the unwavering hawkish policy of the regulator. On one hand, according to the ADP report, employment in the US private sector, with a forecast of 228K, actually grew by 497K in June, significantly higher than the 267K in May. On the other hand, the JOLTS job openings index stood at 9.82 million in May, down from 10.3 million the previous month and falling short of the expected 9.935 million. The US manufacturing PMI index, which has been falling for eight consecutive months, disappointed as well, reaching 46.0 in June – the lowest level since May 2020. Commenting on these figures, Chris Williamson, Chief Business Economist at S&P Global Market Intelligence, stated that "the health of the US manufacturing sector deteriorated sharply in June, and this is fuelling fears that the economy may slide into recession in the second half of the year".
These fears were further exacerbated by renewed trade tensions between the US and China. Against this backdrop, market participants are questioning whether the Fed will dare to make another interest rate hike after the July one? (The market has long taken into account the rate increase on July 27 from 5.25% to 5.50% in its quotations.) Or will the regulator announce the end of the current monetary tightening cycle? The latest batch of labour market data released on Friday, July 7, could help answer this question.
The figures turned out to be disappointing for DXY bulls. Non-Farm Payrolls (NFP), a key barometer of potential economic cooling in the United States, showed that the number of new jobs created outside the agricultural sector decreased to 209K in June. This figure is lower than both the May value of 306K and the forecast of 225K. As for the growth of average hourly wages, according to the report from the US Bureau of Labor Statistics, this indicator remained at the previous level: 4.4% YoY and 0.4% MoM. The only market expectation that was met was the unemployment rate, which decreased from 3.7% to 3.6% over the month.
Following the release of such data, dollar sellers returned to the market, and EUR/USD ended the work week at the 1.0968 level. As for the near-term prospects, at the time of writing this review on the evening of July 7, 35% of analysts forecast further growth for the pair, 45% anticipate a decline, and the remaining 20% took a neutral stance. Among the oscillators on D1, 80% favour the bulls, 20% the bears, and all trend indicators are leaning towards bullish. The nearest support for the pair is located around 1.0895-1.0925, followed by 1.0835-1.0865, 1.0790-1.0800, 1.0740, 1.0670, and finally, the May 31st low of 1.0635. The bulls will meet resistance in the 1.0975-1.0985 area, followed by 1.1010, 1.1045, 1.1090-1.1110.
The upcoming week brings a whole package of US consumer inflation data that could have the most significant impact on the Federal Reserve's future monetary policy. The Consumer Price Index (CPI) values, including the core, will be published on Wednesday, July 12. The next day, on Thursday, July 13, we'll get information on key indicators such as the number of initial jobless claims and the US Producer Price Index (PPI). On Friday, as a 'cherry on top', we'll be presented with the University of Michigan's Consumer Confidence Index. As for important European statistics, the German Consumer Price Index (CPI) will be published on Tuesday.
GBP/USD: Prospects for a Bullish Trend
In the past week, the pound clearly became the beneficiary in GBP/USD. As of June 29, the British currency was trading at the 1.2600 level, and by July 7, it had already reached a high of 1.2848.
The pound was buoyed by weak manufacturing activity and labor market data in the US, and doubts about the continuation of the Fed's hawkish stance. It was also helped by the fact that the UK Manufacturing Purchasing Managers' Index (PMI) came in at 46.5 in June, which, although lower than the previous figure of 47.1, was above the market expectation of 46.2. Against this backdrop, the likelihood of further active tightening of monetary policy by the Bank of England (BoE) is practically beyond doubt. Following its meetings in May and June, the BoE raised interest rates by 25 basis points and 50 basis points to 5.00%. Many analysts believe that the regulator could push it up to 5.50% in the next two meetings, and then even up to 6.25%, despite the threat of an economic recession. In such a situation, the British currency has a significant advantage. For example, at Credit Suisse, they believe that GBP/USD still has potential to grow to 1.3000.
The pair ended the past week at the 1.2838 level. "The trend momentum remains confidently bullish across short-term, medium-term, and long-term oscillators, suggesting that the push to 1.2850 (and beyond) is still in play," Scotiabank economists write. In theory, with the current volatility, GBP/USD could cover the remaining distance to 1.3000 in just a few weeks or even days. However, at this point, only 25% of experts support this scenario. The opposite position was taken by 45%, and neutrality was maintained by 30%.
As for technical analysis, 90% of the oscillators on D1 point to the north (a quarter are in the overbought zone), and 10% are looking to the east. 100% of the trend indicators recommend buying. In case of the pair's movement to the south, it will find support levels and zones at 1.2755, 1.2680-1.2700, 1.2590-1.2625, 1.2480-1.2510, 1.2330-1.2350, 1.2275, 1.2200-1.2210. In case of the pair's growth, it will meet resistance at the levels of 1.2850, 1.2940, 1.3000, 1.3050 and 1.3185-1.321.
Notable events for the upcoming week include a speech by Bank of England Governor Andrew Bailey on Monday, July 10, and the release of the UK's labour market data on Tuesday, July 11.
USD/JPY: The Pair's Interrupted Flight and Triumph of the Bears
What experts had long been waiting for has finally happened: USD/JPY interrupted its "moon flight" and switched to an emergency decline. More precisely, it was not just a decline, but a real crash. The reason for it, of course, was weak macroeconomic data from the U.S. since nothing has changed on the side of Japan. The policy of the Bank of Japan (BoJ) remains unchanged. The Deputy Governor of the Central Bank, Shinichi Uchida, has recently once again ruled out the possibility of an early end to ultra-soft monetary policy and exit from negative interest rates.
The monetary policy carried out by the Government and the Central Bank of Japan over the past few years clearly indicates that the yen rate, and even inflation, are not their top priority, even though the CPI has accelerated to 3.1% YoY. The main thing is the economic indicators, and it seems that everything is fine here. The Tankan Index of Large Manufacturers published on Monday, July 3, showed an impressive increase from 1 to 5 (with a forecast of 3), indicating an improvement in the business climate in the country.
USD/JPY traded at 145.06 on June 30, and the minimum on July 7 was recorded at 142.06. Thus, in just a week, the yen managed to win back a full 300 points from the dollar. The reason for such a triumph of the bears is the oversold Japanese currency. As strategists of the French financial conglomerate Societe Generale point out, the yen hasn't been this cheap since the 1970s. "Large pricing errors can last longer than we are used to thinking," they write, "but this one is extraordinary, and as soon as rates start to convert again, the yen will undoubtedly start a rally." Analysing the pair's prospects, Societe Generale expects that the yield on 5-year U.S. bonds will drop to 2.66% in a year, allowing USD/JPY to break below 130. If the yield on Japanese government bonds (JGB) remains at the current level, the pair has a chance to even drop to 125.00.
We noted in the last review that Danske Bank economists predict a USD/JPY rate below 130.00 on the horizon of 6-12 months. Strategists at BNP Paribas make a similar forecast - they target the level of 130.00 by the end of this year and 123.00 by the end of 2024. The Wells Fargo prediction looks modest - its experts believe that by the end of 2024, the pair will only drop to 133.00.
The past week saw USD/JPY end at 142.10. At the time of writing this review, 60% of analysts believe that the southward movement is just a short-term correction, and that the pair will return to growth in the coming days. The remaining 40% voted for its further fall. The indications of indicators on D1 are quite diverse. Among oscillators, 25% are coloured green, 15% are neutral grey, and 60% are red (with a quarter signalling the pair's oversold). Among trend indicators, the balance of power between green and red is 50% to 50%. The nearest support level is in the zone of 1.4140-141.60, followed by 140.45-140.60, 1.3875-1.3905, 137.50, 135.90-137.05. The nearest resistance is 145.00-145.30, then the bulls will need to overcome obstacles at the levels, 146.85-147.15, 148.85, and from there it is not far to the October 2022 peak of 151.95.
No significant economic information related to the Japanese economy is expected to be released in the upcoming week.
CRYPTOCURRENCIES: Three Growth Triggers - The Federal Reserve, Halving, and Women
The beginning of the summer turned out to be quite hot for the crypto industry. On the one hand, regulators continued to tighten their grip on the sector. On the other, we are witnessing a surge in institutional interest. First and foremost, it is applications for the launch of spot bitcoin ETFs from such giants as BlackRock, Invesco, Fidelity, and others.
Regarding regulatory pressure, debates have been going on for over a year. Some warmly welcome this process, while others protest. The former argue that this will cleanse the industry of unscrupulous participants and attract billions, if not trillions, of institutional dollars to the crypto market. The latter claim that the intervention of the same US Securities and Exchange Commission (SEC) completely breaks the main principle of cryptocurrencies - independence from states and governments. "Law enforcement regulation is killing our economy," wrote Tim Draper, co-founder of venture capital firm Draper Fisher Jurvetson, on June 20. "I think we have a real problem because the SEC is sowing fear... This compulsory regulation doesn't make sense.".
Note that the SEC has previously rejected all applications to create spot ETFs on bitcoin. This time around, the Commission stated that the fresh applications are not clear and comprehensive enough. However, companies are not retreating and have already submitted edited versions. "Approval of applications for a spot ETF on bitcoin will let investors know that the first cryptocurrency is a legitimate asset," explains MicroStrategy co-founder Michael Saylor. "If the SEC approves applications for this asset, a user can press a button and buy bitcoin for $10 million in 30 seconds." "This is an important milestone on the path to institutional acceptance. I think it's important, although I don't think bitcoin will grow to $5 million overnight," the billionaire concluded. However, in the medium term, according to Hugh Hendry, manager of hedge fund Eclectica Asset Management, bitcoin could triple its capitalization.
By the way, the aforementioned Tim Draper previously predicted that the price of bitcoin would reach $250,000 by the end of 2022. When his forecast did not come true, he extended the timing of its realization by another six months until mid-2023. Now Draper has adjusted his forecast again - according to him, the main cryptocurrency will reach the stated goal with a 100% probability by the end of June 2025. Moreover, one of the drivers of growth will be the acceptance of bitcoin by women.
Housewives paying for purchases with bitcoin can undoubtedly become a serious factor. However, more "conservative" analysts prefer to point to two others: 1) the easing of the Federal Reserve's monetary policy and 2) the upcoming bitcoin halving in April 2024. In anticipation of these two events, crypto exchanges are noting a decrease in supply, and long-term holders have accumulated a record number of coins in their wallets: 13.4 million bitcoins.
Regarding point 1. At its June meeting, the Federal Reserve decided to take a pause and left the key interest rate unchanged. However, the possibility of one or two more hikes of 25 b.p. each is not ruled out. After this, the cycle of monetary tightening may be completed, and at the end of 2023 - the beginning of 2024 markets expect a reversal and the start of a decrease in the rate. This should positively affect investors' risk appetite and facilitate the inflow of capital, including into digital assets.
Point 2. Halving. This event also usually has a positive effect on bitcoin quotes. A correlation between the halvings that occur every four years and the dynamics of the coin's value has long been noted. Analyst Root presented an interesting radial diagram on this topic. Making a circle in four years, the price forms the cycle's peaks and troughs in the same sectors. And, according to this diagram, after finding the bottom in 2023, bitcoin should move towards a price of $1 million per coin, which it will reach in 2026.
As for the near future, CoinDesk researchers believe that market participants should now be doubly cautious when trading cryptocurrency. The fact is that since the IV quarter of 2022, fiat liquidity indicators worldwide are rapidly declining, and the growth of BTC quotes in such conditions is an anomaly. The BTC rate reached a local price bottom at the $15,500 mark last November and since then has doubled to $31,000. Moreover, since June 15 alone, the price has jumped by more than 20%.
According to Decentral Park Capital's portfolio manager Lewis Harland, the situation remains complicated. He confirmed that recently tracked fiat indicators, such as the net liquidity of the Fed and the global level of net liquidity, have fallen sharply. "This is the main reason why we are cautious about BTC, despite the optimistic market consensus. We think investors are overlooking this," added Harland. (The global net liquidity indicator, which accounts for fiat supply in several major countries, has dropped to $26.5 trillion - the lowest level since November 2022. These data were provided by TradingView and Decentral Park Capital).
Anomalous, in the opinion of several specialists, is also the drop in correlation between physical and digital gold. While the price of bitcoin shows explosive growth, the value of gold is gradually decreasing. Fred Thiel, CEO of Marathon Digital, a mining company, suggested that this not only indicates a change in priorities in favour of digital assets but also demonstrates that bitcoin is becoming more accessible to a wider range of investors.
Euro Pacific Capital President Peter Schiff disagrees with these theses. According to this ardent gold supporter, most investors don't actually believe in bitcoin, but are only hoping that someone will buy it from them at a higher price. "The rapid fall in the price of the first cryptocurrency is just a matter of time. The peak we saw in 2021, around $70,000, is it. And ultimately bitcoin will explode," said Schiff, adding that stories about people losing money on cryptocurrency will eclipse stories about people getting rich on it.
According to renowned analyst Benjamin Cowen, the decline in fiat liquidity will primarily negatively impact not bitcoin, but altcoins. "Liquidity is drying up, so people see relative safety in bitcoin compared to the altcoin market," the specialist believes. "But that doesn't mean bitcoin can't fall; it just means it's a little safer."
According to Cowen's forecast, bitcoin could rise about 14% compared to current levels and reach a maximum of $35,000 in 2023. "In the short term, it's really hard to say if bitcoin can rise a little again. For myself, I set a target of $35,000," the analyst said.
The crypto trader known as Altcoin Sherpa is confident that the main cryptocurrency can first rise to $32,000 and then to a new 2023 high of $40,000. However, he's not so sure about the $40,000 mark. After that, there should be a significant correction downwards.
According to technical analysis, the BTC/USD cryptocurrency pair may be forming a new "bullish flag" pattern on the chart. This opinion was expressed by experts from Fairlead Strategies. They stated, "Bitcoin is digesting its gains during the consolidation phase. A potential new bullish flag is forming, which would occur with a breakthrough above the weekly Ichimoku cloud around $31,900."
The experts explained that this pattern consists of a pole and a flag. The pole represents the initial price rally, while the flag represents subsequent consolidation caused by "temporary exhaustion of bullish sentiment" and a lack of strong selling pressure. According to the theory of technical analysis, once the asset breaks above the flag's boundary price, it tends to rise by a distance approximately equal to the length of the pole.
In the case of bitcoin, the upward movement from the low on June 15, 2023, at $24,790 to the high on June 23 at $31,388 represents the pole, and the subsequent consolidation formed the flag. According to analysts, a potential breakthrough for BTC would allow the cryptocurrency's price to reach the next key resistance level at $35,900.
According to crypto strategist and trader Bluntz, who accurately identified the bottom of the bear market for bitcoin in 2018, he has now provided a forecast regarding ethereum. He believes that the leading altcoin is showing all the signs of a powerful rally that could take place in the coming months. According to the crypto strategist, the remaining part of 2023 could set ethereum up for parabolic growth, surpassing bitcoin significantly.
Bluntz is considered an experienced practitioner of technical analysis, particularly Elliott Wave Theory, which allows for price behaviour forecasting based on crowd psychology, often manifesting in waves. According to this theory, a bullish asset exhibits a five-wave rally, with the third wave signalling the steepest ascent. Bluntz suggests that ethereum is already in the early stages of the third wave surge, which could lead to ETH approaching $4,000 before the end of 2023.
In contrast, Altcoin Sherpa made an opposing forecast. Looking at ETH/BTC, he noted that ethereum is likely to decline in relation to the flagship cryptocurrency and aim for the lower end of the range around 0.053 BTC, or $1,614.
As of the time of writing the review, Friday evening, July 7, BTC/USD is trading around $30,200, and ETH/USD is in the range of $1,860. The overall cryptocurrency market capitalization has decreased and stands at $1.176 trillion ($1.191 trillion a week ago). The Crypto Fear & Greed Index remains on the border between the Greed and Neutral zones, currently at 55 points (56 points a week ago).
Yen Setting Up Bullish Reversal, Dollar Index Ready for 100 and Below
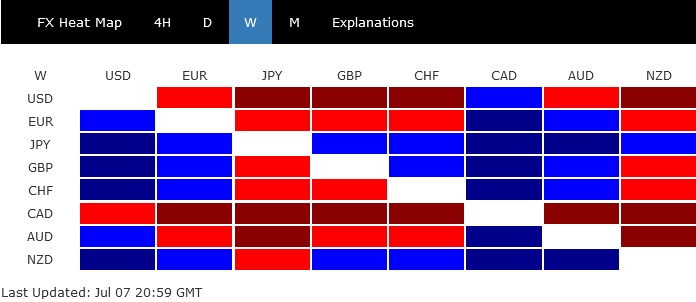
Japanese Yen exhibited an impressive rally last week and ended as the strongest performer. The move was spurred by Japan's substantial wage growth, which shot JGB yield higher and countered the impact of rising benchmark yields in the US and Eurozone. In light of these developments, signs are pointing towards a potential bullish reversal for Yen that could transpire without government intervention.
Contrastingly, Dollar failed to impress, ending as the second worst performer after Canadian Dollar, despite the release of solid job data. Strong rally in 10-year yield seemingly did little to support the greenback. The resurgence of Yen and robustness of Euro have potentially laid the groundwork for Dollar Index to plunge below the 100 mark. Concurrently, Gold appears to be gearing up for another attempt at bullish reversal as pressure mounts on the greenback again.
Elsewhere in the currency markets, New Zealand Dollar ended as second strongest performer of the week, closely followed by British The Australian Dollar, however, found itself on the backfoot, ending as the third weakest. Swiss Franc and Euro presented mixed results, overshadowed by the solid performance from Sterling.
Yen ready for bullish reversal without need of intervention?
Yen's impressive surge last week, despite a backdrop of rising global benchmark yields, might initially seem perplexing. However, a deeper examination of the details reveals a logical progression. Interestingly, it suggests that a bullish shift in Yen could be on the horizon, even without the need for governmental intervention.
Boosting performance of Yen were the latest wage growth statistics from Japan. Regular pay in May recorded a substantial 1.8% yoy increase, a feat not seen since 1995. Nominal wages also doubled expectations, rising by 2.5% yoy.
These figures suggest that effective wage negotiations are starting to make a significant impact on Japan's economic data. This change aligns with the objectives of BoJ, which has long contended that a shift in the country's deflationary mindset is critical, and persistent wage growth is a prerequisite to achieving 2% inflation target sustainably. Given the current trajectory, there are growing chance that inflation could rebound after a slump in the second half of this year, paving the way for BoJ to wind down its ultra-loose monetary policy.
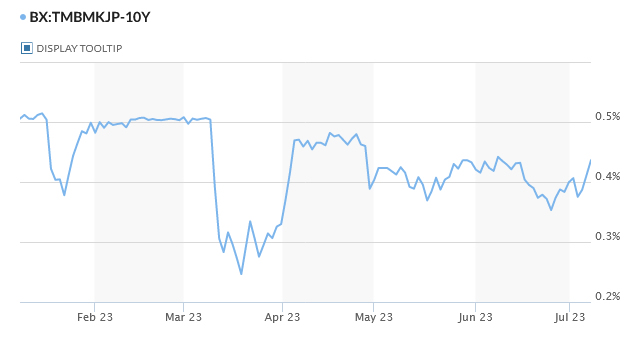
Reflecting this sentiment, 10-year JGB yield witnessed a sharp rally , closing at 0.436. Whether it is poised to prolong its current rise towards 0.5% mark—BoJ's cap on 10-year JGB yield—will be closely monitored, as traders may start speculating on another tweak in Yield Curve Control parameters.
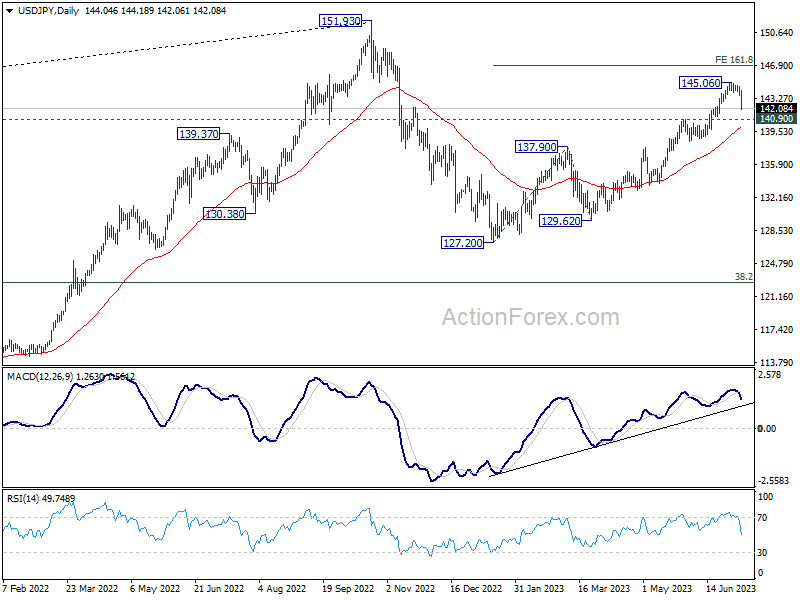
Looking at USD/JPY, after Friday's steep decline, a short-term top at 145.06 is confirmed. The pressing question is whether this signals the completion of the entire rise from 127.20, identified as the second leg of the pattern from 151.93 high.
Near-term focus is now set on 140.90 resistance-turned-support. Sustained break of this level will elevate the possibility of the pattern from 151.93 commencing its third leg, and bring deeper fall to test 137.90 resistance-turned-support next.
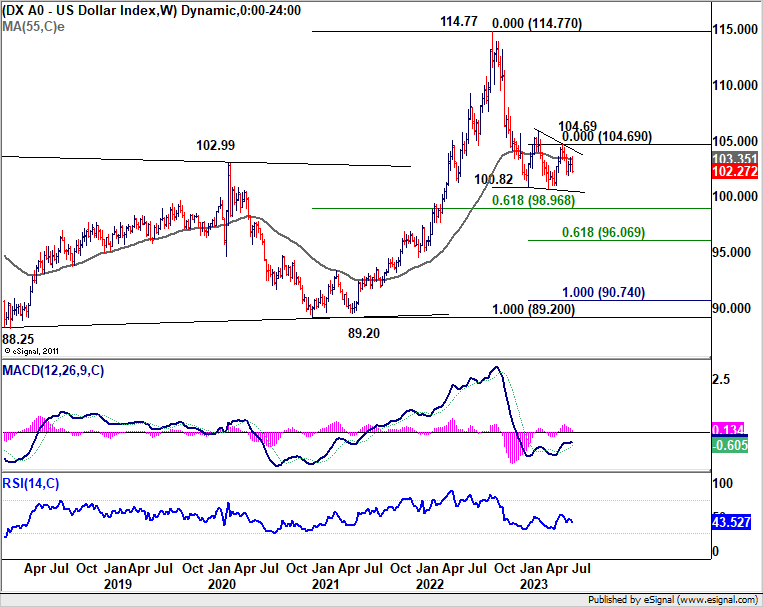
Dollar index ready to break through 100 after failing to jump on job data
Despite the release of robust job data, the dollar underperformed this week, ending as one of the weaker performers alongside Canadian. The rally following ADP report proved short-lived, as the greenback experienced a sell-off shortly after non-farm payroll release. NFP was indeed solid, with strong showing in both headline jobs and wage growth. However, the markets seemed to focus more on this being the lowest job growth figure since 2020.
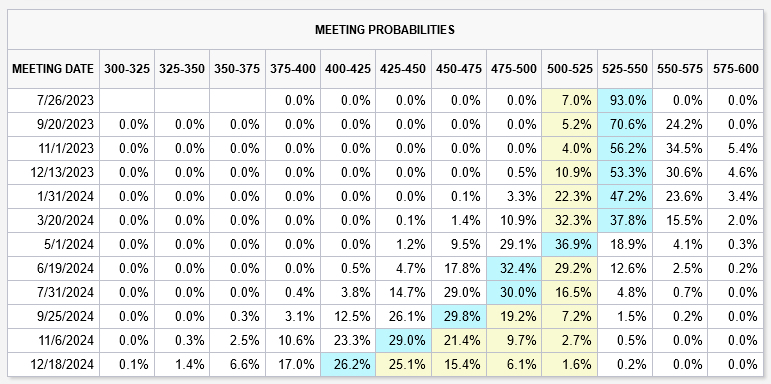
Critically, the NFP data did little to bolster the case for two or more rate hikes by Fed this year, a scenario which the "strong majority" of FOMC participants were anticipating. As it stands, fed funds futures market is pricing in less than 50% chance of another rate hike after July. Simultaneously, predictions do not foresee a greater than 50% chance of the first rate cut until May next year.
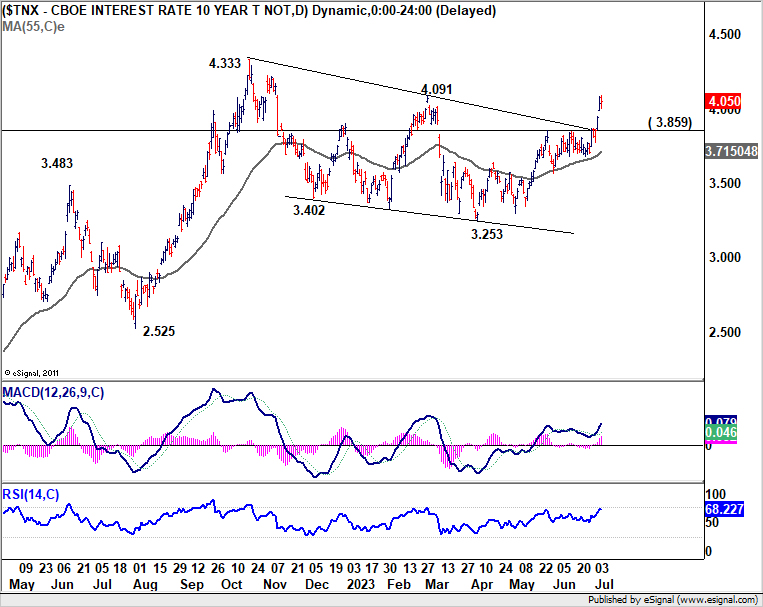
10-year yield made significant progress last week by powering through 3.859 resistance, and hit as high as 4.094. The development adds much credence to the case that correction from 4.333 has completed at 3.253 already. And larger up trend is ready to resume. Immediate focus for TNX is now on 4.091 resistance. Sustained break there will bring retest of 4.333 high. Meanwhile, below break of 3.859 resistance turned support will delay the bullish case and risk extending sideway trading.
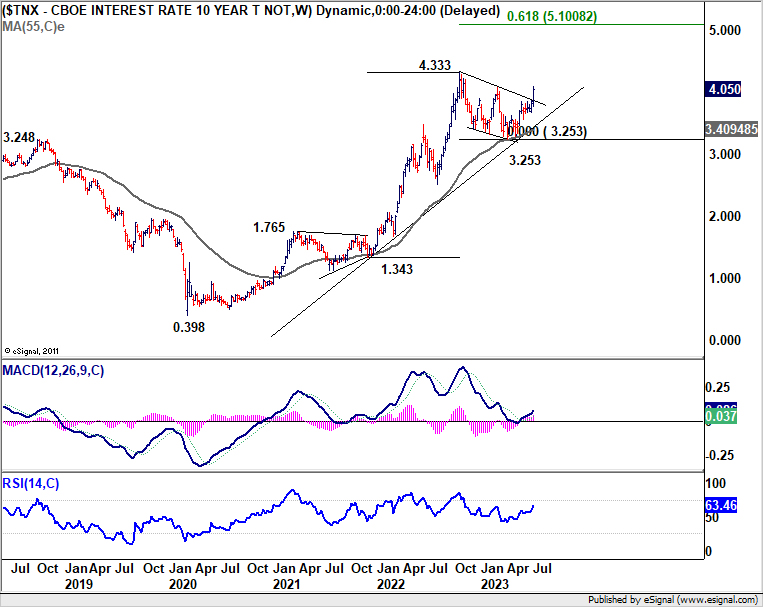
In the bigger picture, outlook is staying bullish with strong support from 55 W EMA. Firm break of 4.333 would resume whole up trend from 0.398 (2020 low). Next target would be 61.8% projection of 1.343 to 4.333 from 3.253 at 5.100.
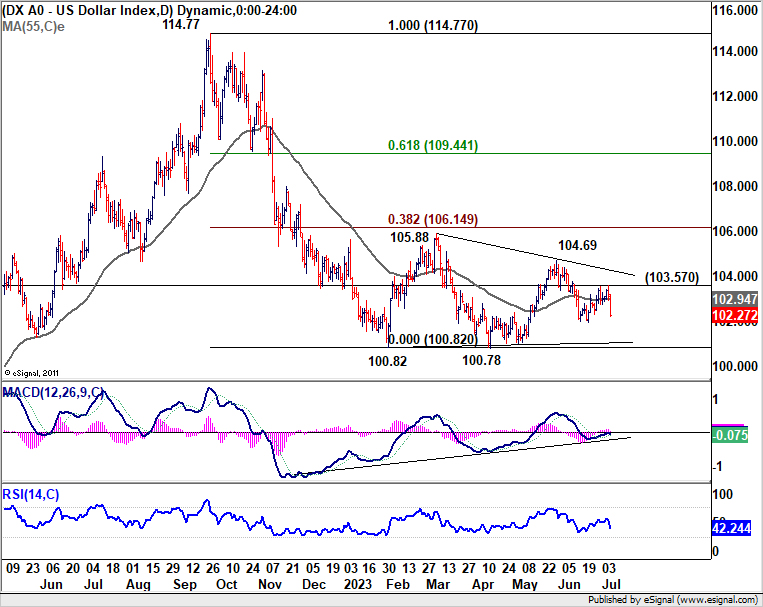
However, the rally in 10-year yield did little to prop up Dollar Index. On the one hand, Germany 10-year yield has indeed surged too, and hit the highest level since March, providing a boost to Euro. On the other hand, as mentioned above, Yen and 10-year JGB yield also jumped.
As mentioned in previous reports, there appears to be little prospect for the Dollar Index breaking through 100.78/82 support zone if Euro and Yen do not rally together strongly. Now, the conditions for this appear to be emerging.
Technically, after last week's steep decline, near-term outlook for DXY will remain bearish as long as 103.57 resistance holds. Break of the 101.92 support could a downside acceleration through 100.78 to resume the larger downtrend from 114.77 (2022 high).
Looking at the broader picture, strong support is still expected from the 61.8% retracement of 89.20 to 114.77 at 98.96 to contain the downside and bring a medium-term rebound. That could happen if BoJ refrain from adjusting its 0.50% cap on 10-year JGB yield, and thus limiting Yen's rally. Another factor could be the spillover of manufacturing recession to services in Eurozone, which is starting to be reflected in PMIs, that reduce the need to extended tightening by ECB beyond July.
However, any significant adjustment in BoJ's YCC and accompanied upside acceleration Yen could propel DXY through 98.6. In this case, Dollar Index might only be able to find a bottom after hitting 61.8% projection of 114.77 to 100.82 from 104.69 at 96.06.
Gold to have a second attempt on bullish reversal
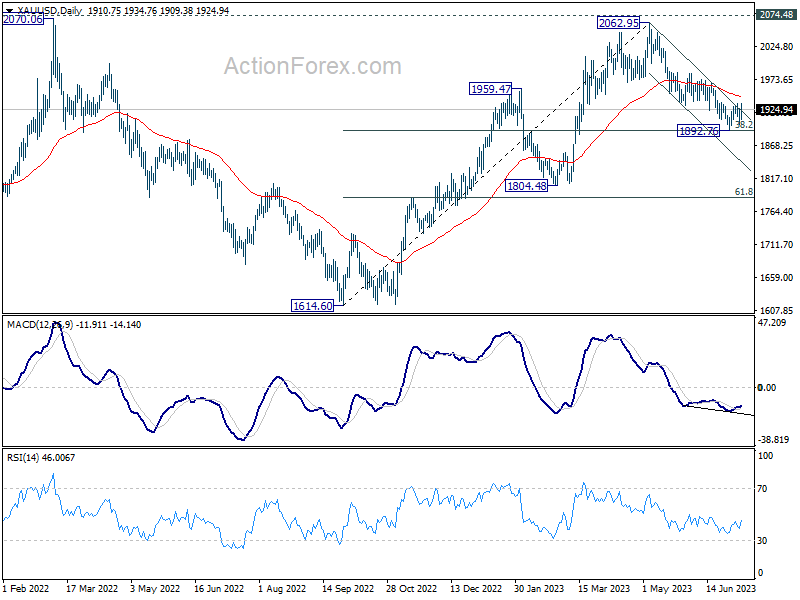
As Dollar succumbs to selling pressure, Gold's failed attempt at a bullish reversal last week could be set for a second wind. Should Gold decisively break 55D EMA (now at 1945.15), it would indicate completion of corrective decline from 2062.95 at 1892.76, just shy of 38.2% retracement of 1614.60 to 2062.95 at 1891.68.
If this bullish scenario materializes, further rally should be expected, potentially stretching up to 61.8% retracement at 1997.93. This implies the possibility of Gold surpassing psychological level of 2000, at least briefly.
The momentum needed for Gold to revisit its 2062.95 and 2074.78 record high will largely hinge on Dollar Index's response to 98.60 fibonacci support mentioned above, after breaking 10078/82. Future movements in Dollar Index and Gold could therefore serve as a confirmation to each others'.
EUR/USD Weekly Outlook
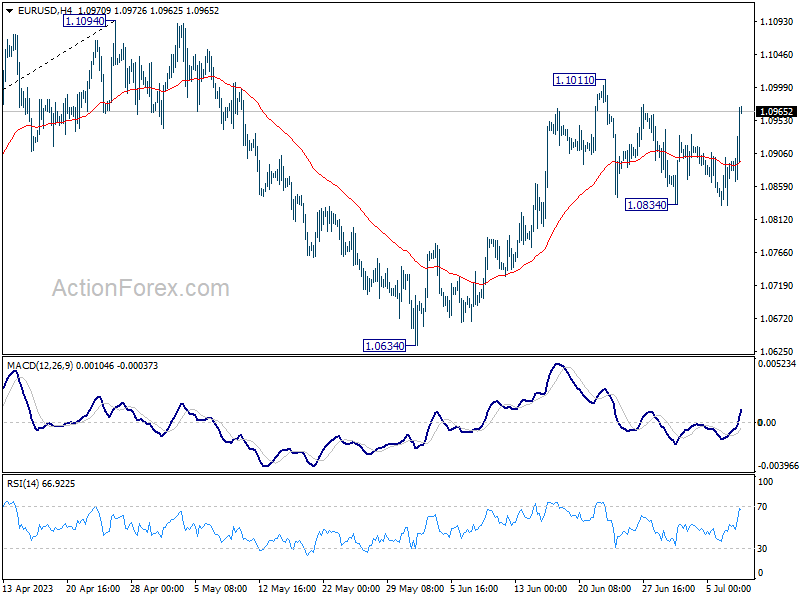
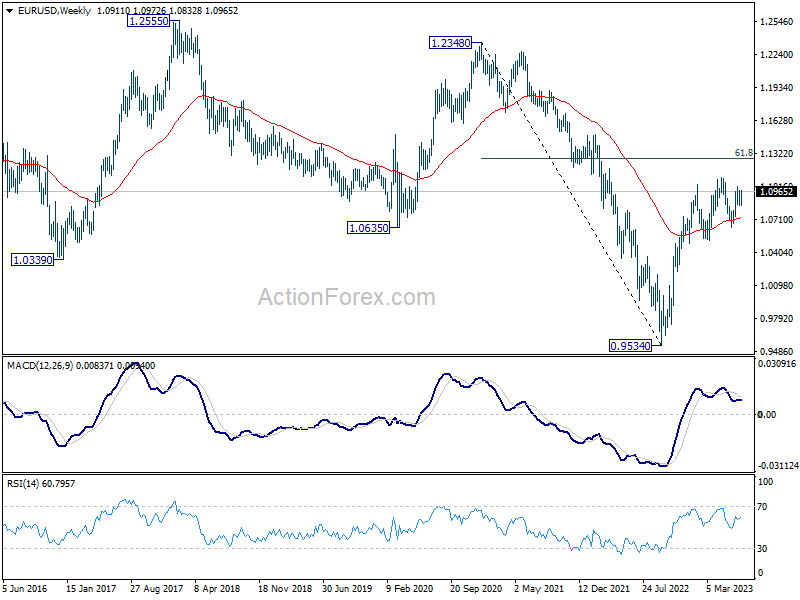
EUR/USD continued to draw strong support from 55 D EMA (now at 1.0859) last week even though it is still bounded in range below 1.1011. Initial bias remains neutral this week first, but further rally is in favor. On the upside, break of 1.1011 will resume the rise from 1.0634 and target 1.1094 resistance. Decisive break there will resume larger up trend from 0.9534 to 1.1273 fibonacci level. However, firm break of 1.0834 will turn bias to the downside for 1.0634 support instead.
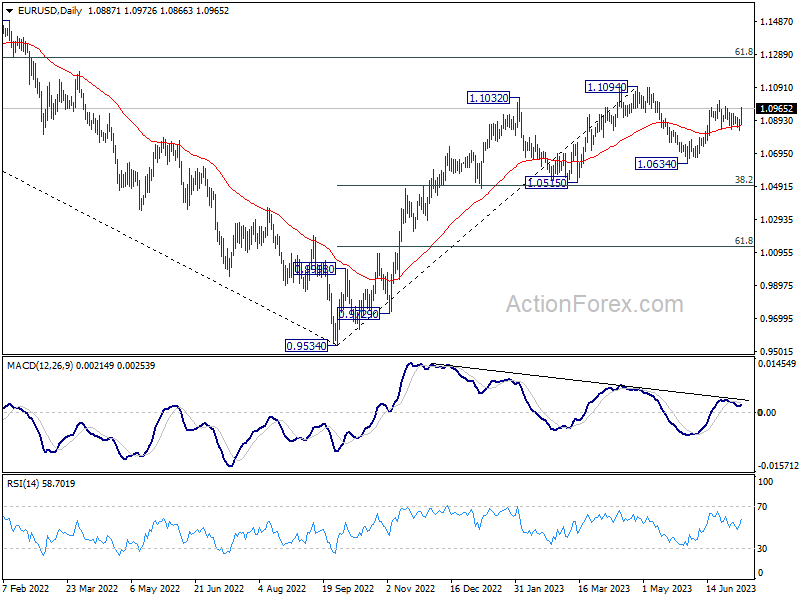
In the bigger picture, as long as 1.0515 support holds, rise from 0.9534 (2022 low) would still extend higher. Sustained break of 61.8% retracement of 1.2348 (2021 high) to 0.9534 at 1.1273 will solidify the case of bullish trend reversal and target 1.2348 resistance next (2021 high).
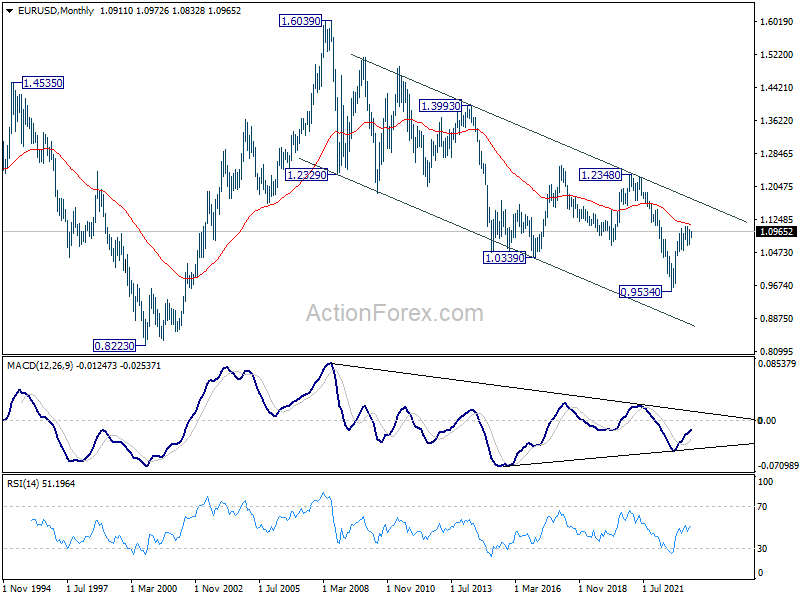
In the long term picture, focus stays on 55 M EMA (now at 1.1135). Rejection by this EMA will revive long term bearishness. However, sustained break above here will be affirm the case of long term bullish reversal and target 1.2348 resistance for confirmation.
EUR/USD Weekly Outlook
EUR/USD continued to draw strong support from 55 D EMA (now at 1.0859) last week even though it is still bounded in range below 1.1011. Initial bias remains neutral this week first, but further rally is in favor. On the upside, break of 1.1011 will resume the rise from 1.0634 and target 1.1094 resistance. Decisive break there will resume larger up trend from 0.9534 to 1.1273 fibonacci level. However, firm break of 1.0834 will turn bias to the downside for 1.0634 support instead.
In the bigger picture, as long as 1.0515 support holds, rise from 0.9534 (2022 low) would still extend higher. Sustained break of 61.8% retracement of 1.2348 (2021 high) to 0.9534 at 1.1273 will solidify the case of bullish trend reversal and target 1.2348 resistance next (2021 high).
In the long term picture, focus stays on 55 M EMA (now at 1.1135). Rejection by this EMA will revive long term bearishness. However, sustained break above here will be affirm the case of long term bullish reversal and target 1.2348 resistance for confirmation.
USD/JPY Weekly Outlook
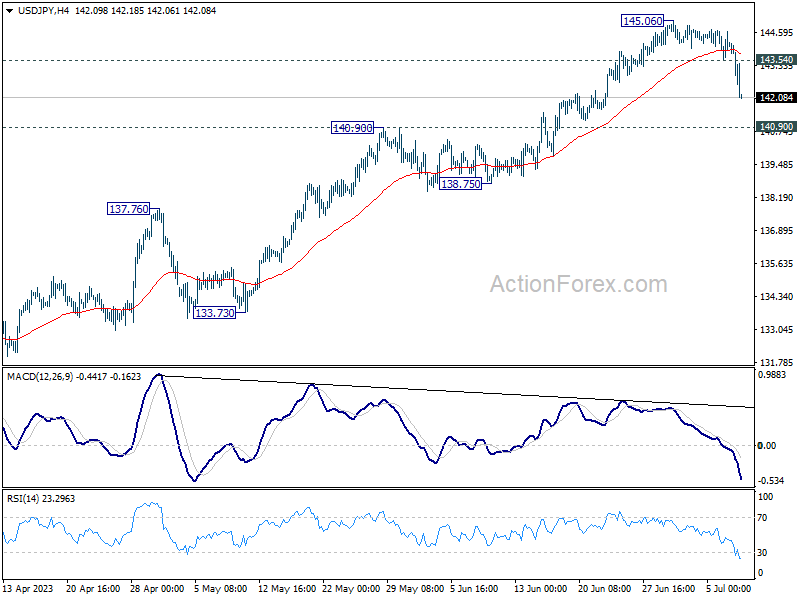
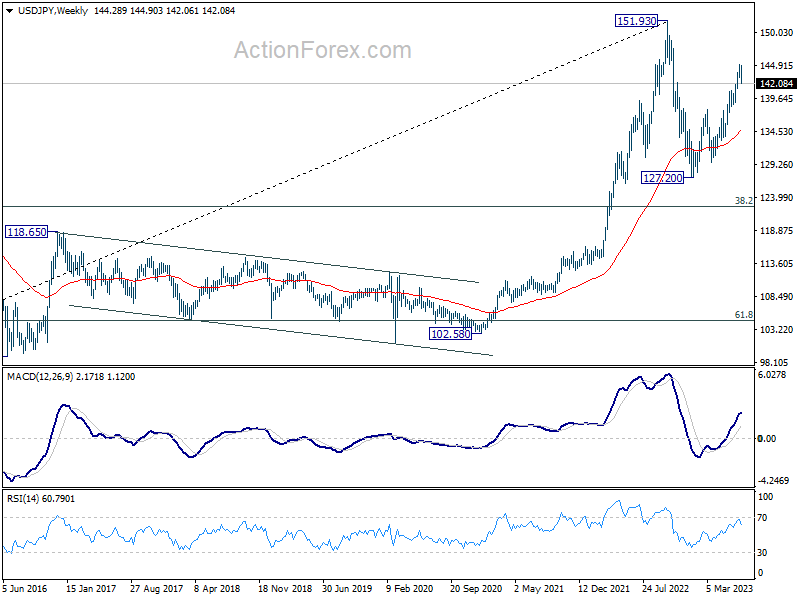
USD/JPY's steep decline last week confirmed short term topping at 145.06, in bearish divergence condition in 4H MACD. Initial bias is now on the downside this week for 140.90 resistance turned support. Firm break there will raise the chance that whole rebound from 127.20 has completed. Deeper decline should then be seen to 137.90 resistance turned support for confirmation. On the upside, above 143.54 minor resistance will turn bias back to the upside for retesting 145.06 instead.
In the bigger picture, rise from 127.20 is seen as the second leg of the corrective pattern from 151.93 high. Further rally could still be seen as long as 137.90 resistance turned support holds, to retest 151.93. But strong resistance should be seen there to limit upside. However, Break of 137.90 will indicate that the third leg has started back towards 127.20.
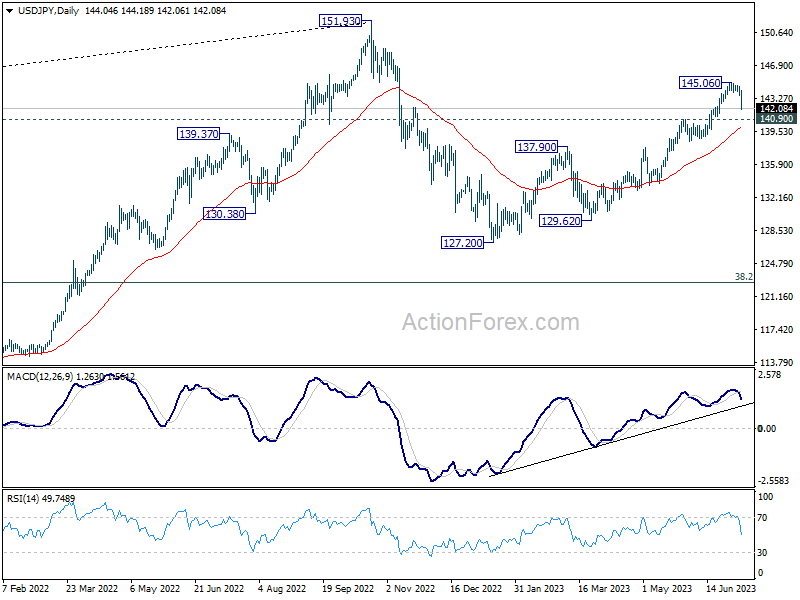
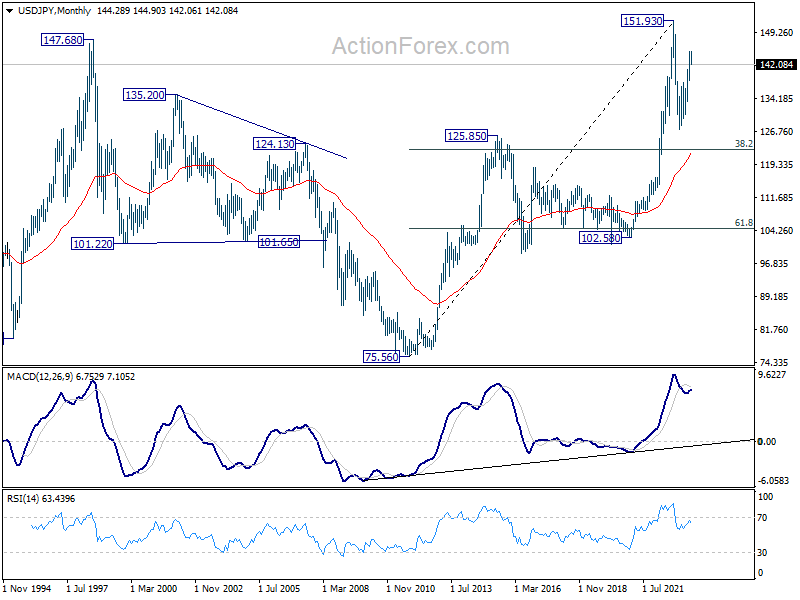
In the long term picture, price action from 151.93 is seen as developing into a corrective pattern to up trend from 75.56 (2011 low). While deeper decline cannot be ruled out, downside should be contained by 38.2% retracement of 75.56 to 151.93 at 122.75.
GBP/USD Weekly Outlook
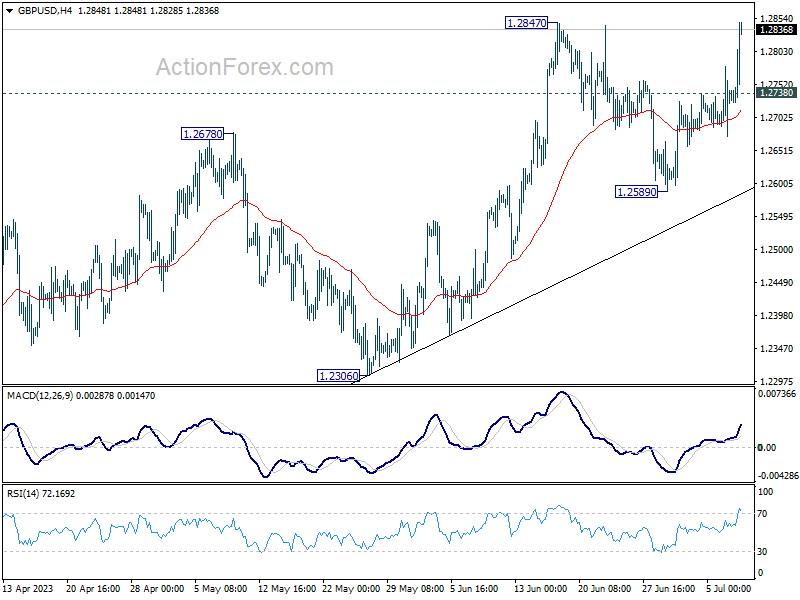
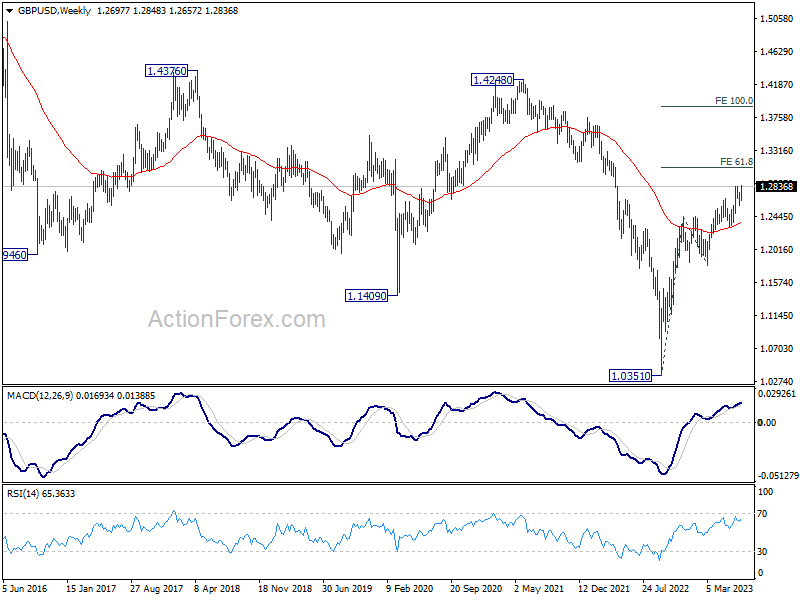
GBP/USD's rebound from 1.2589 accelerated higher last week and breached 1.2847. Initial bias is now on the upside this week. Sustained trading above 1.2847 will confirm resumption of larger up trend from 1.0351. Next target is 61.8% projection of 1.0351 to 1.2445 from 1.1801 at 1.3095. On the downside, below 1.2738 minor support will delay the bullish case and turn intraday bias neutral first.
In the bigger picture, the strong support from 55 W EMA (now at 1.2341) is a medium term bullish sign. Outlook will stay bullish as long as 1.2306 support holds. Rise from 1.0351 medium term bottom (2022 low) is expected to extend further to retest 1.4248 key resistance (2021 high).
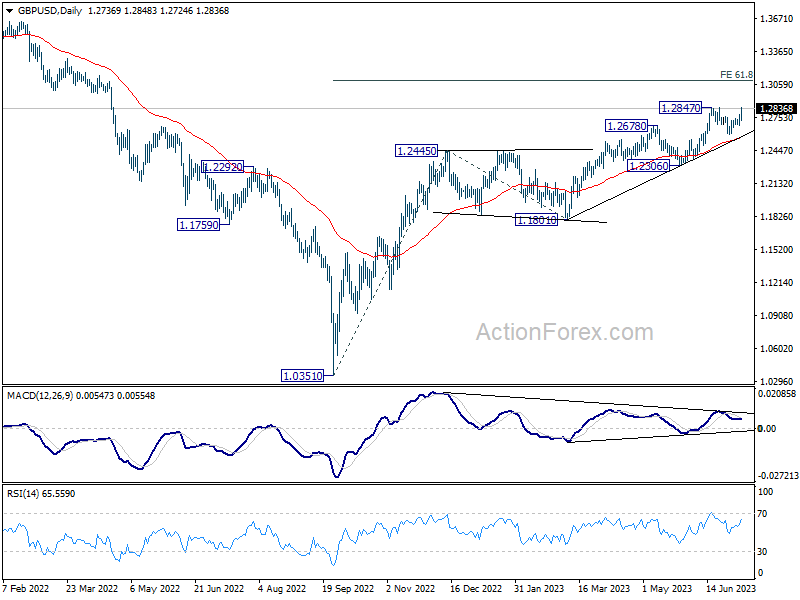
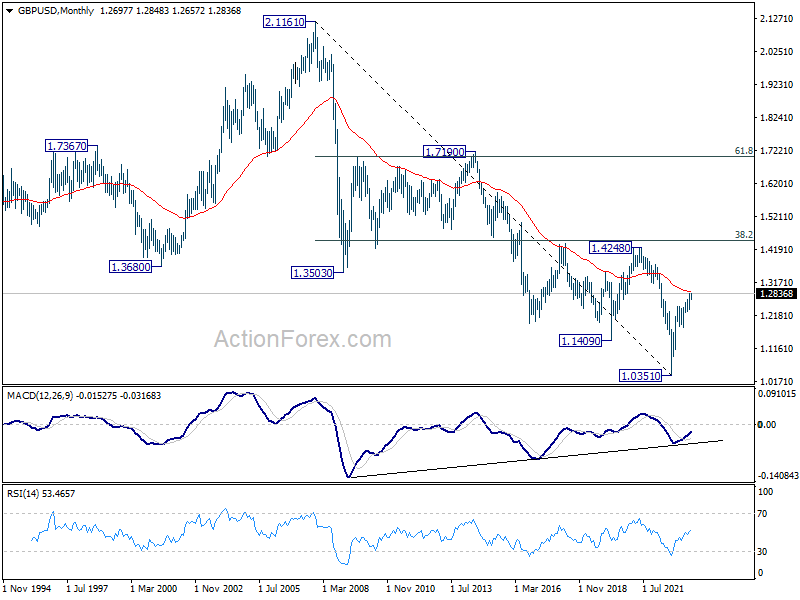
In the long term picture, immediate focus is on 55 M EMA (now at 1.2908). Sustained trading above there add to the case of long term bullish reversal. Nevertheless, break of 1.4248 resistance (2021 high), and 38.2% retracement of 2.1161 (2007 high) to 1.0351 at 1.4480 is needed to confirm. Otherwise, long term outlook is just neutral at best.
USD/CHF Weekly Outlook
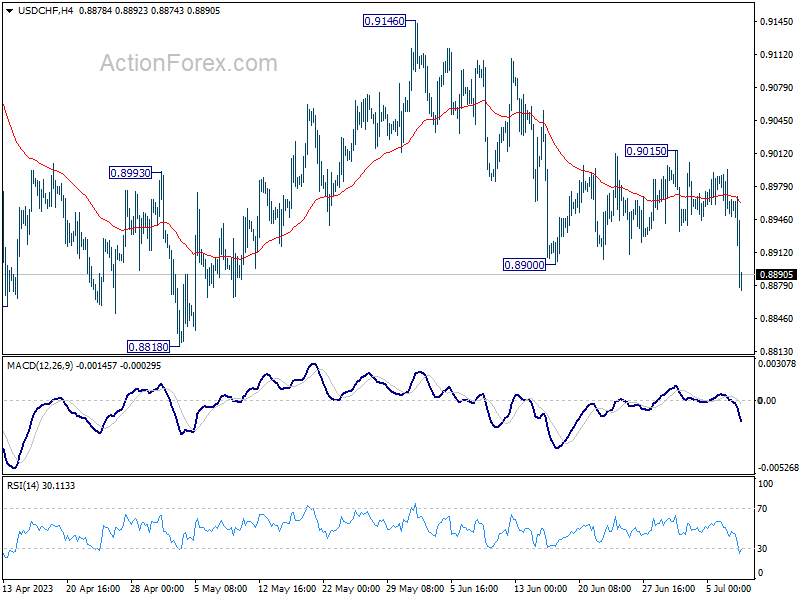
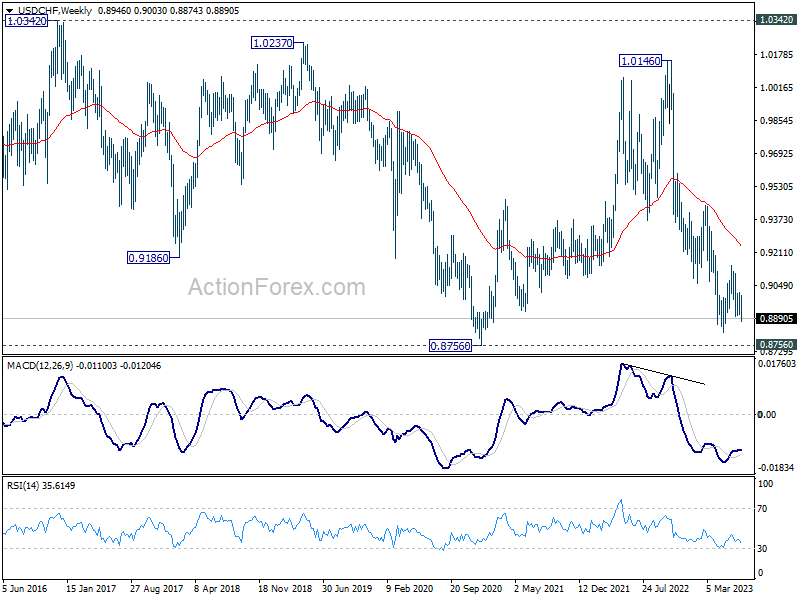
USD/CHF's fall from 0.9146 resumed by breaking through 0.8900 support last week. Initial bias stays on the downside this week for 0.8818 and below, to resume whole down trend from 1.0146. Strong support is expected from 0.8756 to contain downside and bring rebound. Yet, break of 0.9015 resistance is now needed to confirm short term bottoming. Otherwise, outlook will stay bearish.
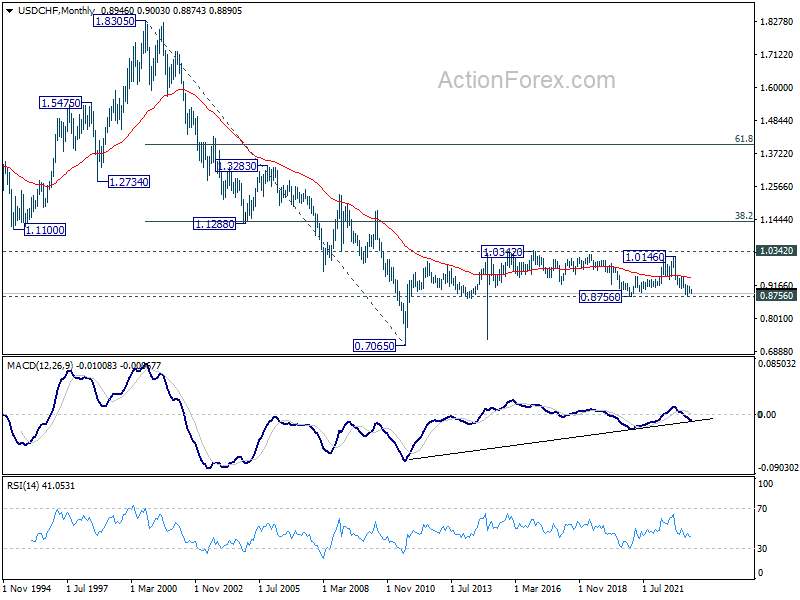
In the bigger picture, fall from 1.1046 (2022 high) is seen as a leg in the long term range pattern from 1.0342 (2016 high). While further decline cannot be ruled out, strong support is expected from 0.8756 long term support to bring reversal. Firm break of 0.9146 resistance should confirm medium term bottoming.
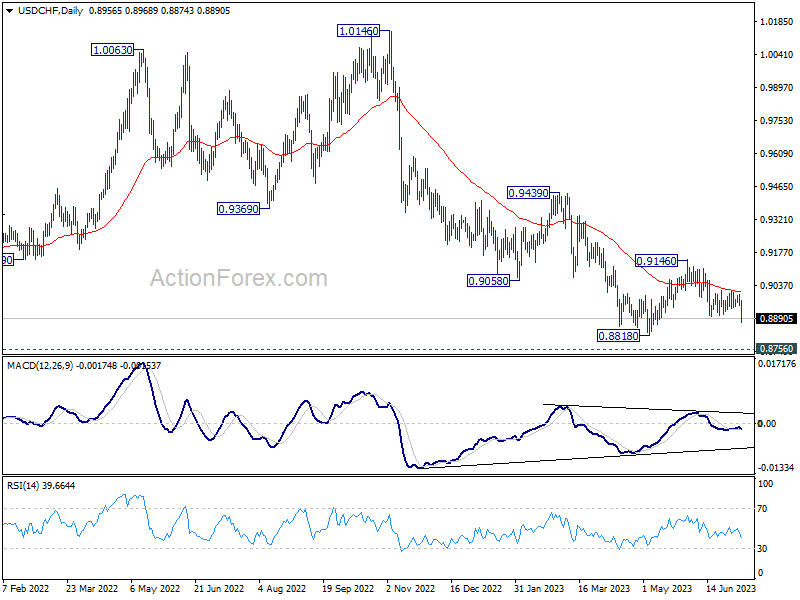
In the long term picture, long term sideway pattern from 1.0342 (2016 high) is expected to continue between 0.8756/1.0342. However, sustained break of 0.8756 will open up deeper fall back towards 0.7065 (2011 low).
AUD/USD Weekly Report
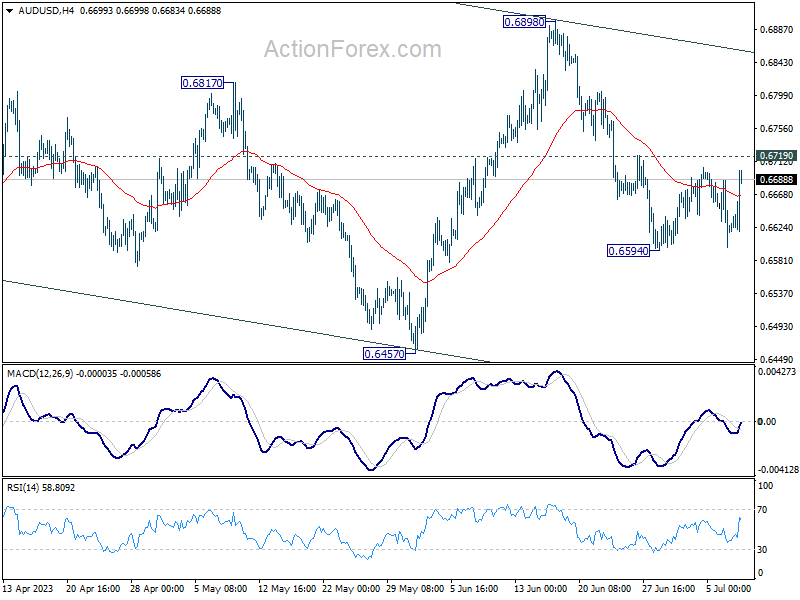
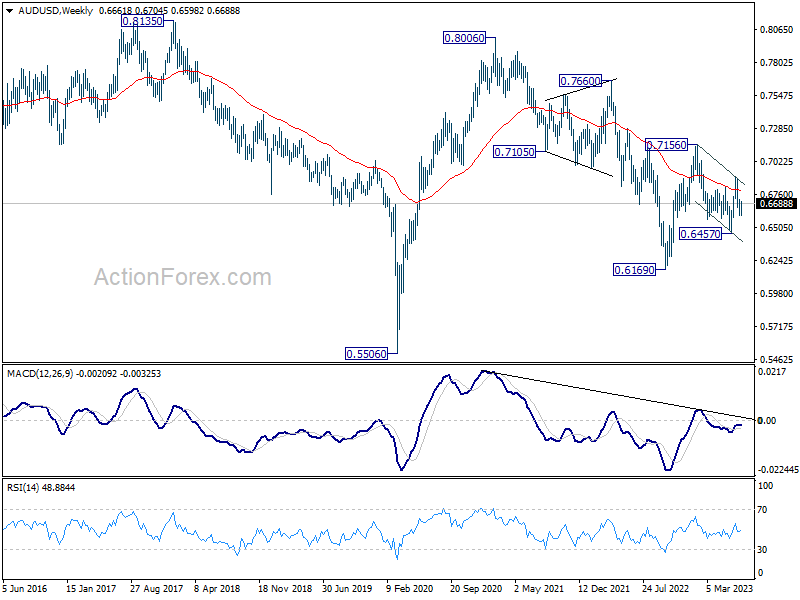
AUD/USD stayed in sideway trading above 0.6594 last week and outlook is unchanged. Initial bias remains neutral this week first. With 0.6710 resistance intact, further decline is in favor. On the downside, break of 0.6594 will resume the decline from 0.6898 to 0.6457 support next. Nevertheless, firm break of 0.6719 will turn bias back to the upside for stronger rebound.
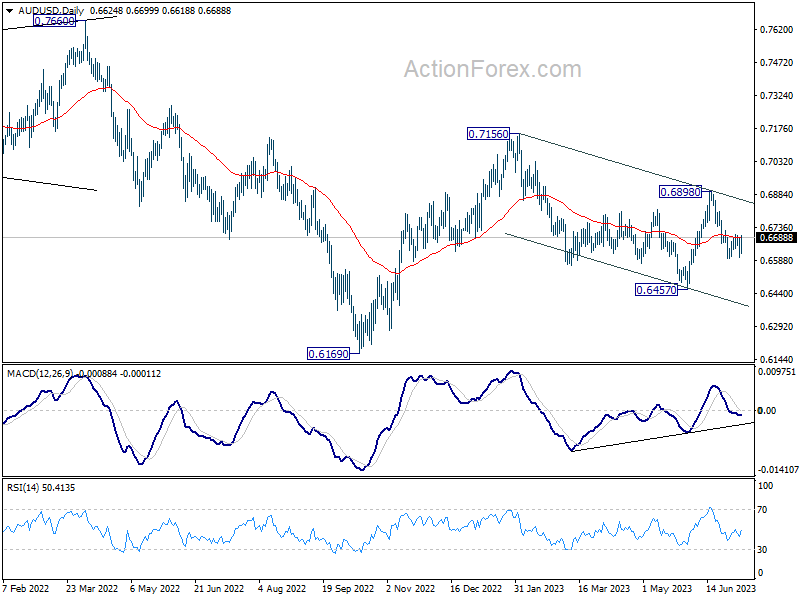
In the bigger picture, price actions from 0.7156 are seen as a correction to the rebound from 0.6169 only, rather than part of larger down trend from 0.8006 (2021 high). Break of 0.6457 could cannot be ruled out but downside should be contained above 0.6169. Meanwhile, nevertheless, break of 0.6898 resistance will argue that rise from 0.6169 is ready to resume through 0.7156.
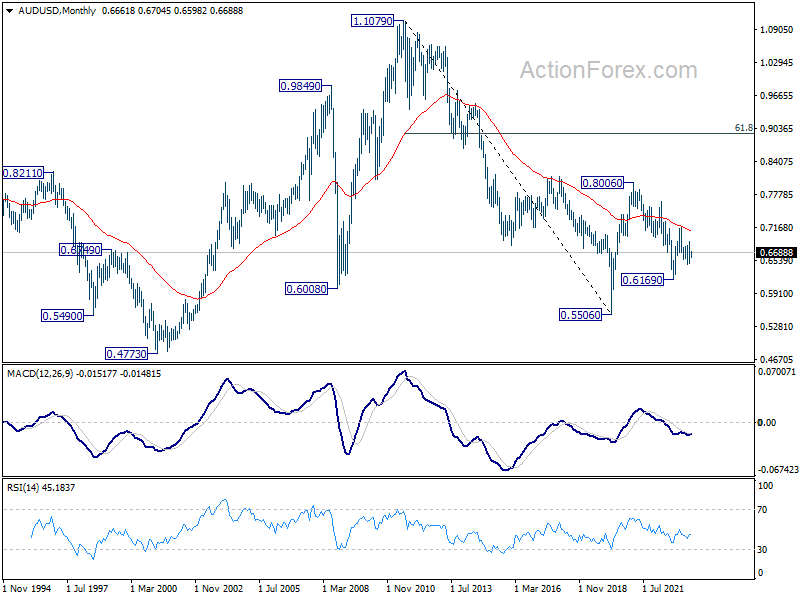
In the long term picture, fall from 0.8006 is seen as a corrective move to up rise from 0.5506 (2020 low). This correction could have completed at 0.6169. Sustained trading above 55 M EMA (now at 0.7088) will affirm this case, and indicate that rise from 0.5506 is ready to resume. However, firm break of 0.6169 will revive long term bearishness and turn focus back to 0.5506 low.
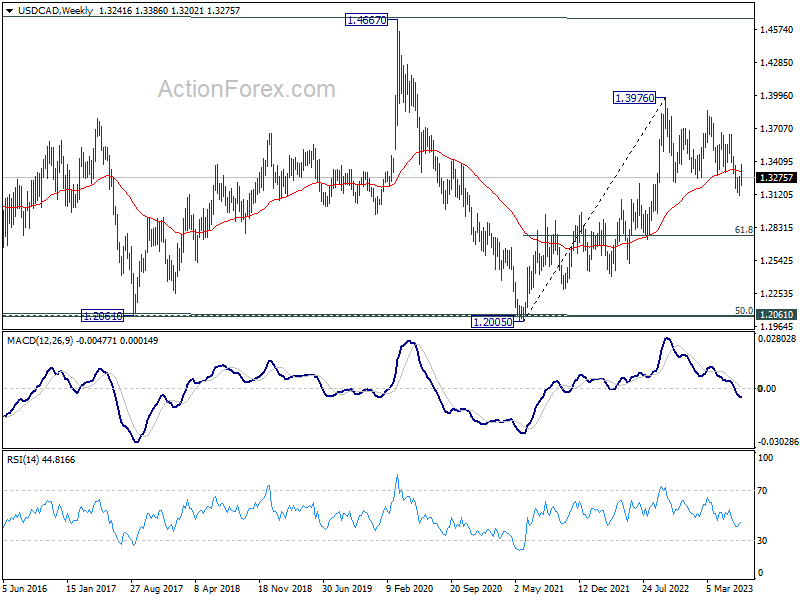
USD/CAD Weekly Outlook
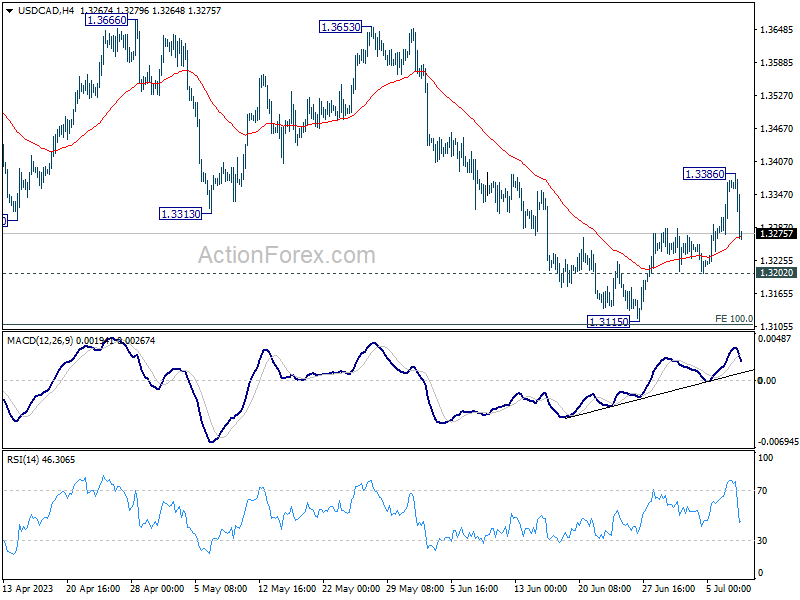
USD/CAD rebounded strongly to 1.3386 last week, but failed to sustain above 55 D EMA (now at 1.3366), and retreated deeply. Initial bias is turned neutral this week first. On the upside, break of 1.3386 and sustained trading above 55 D EMA will argue that whole corrective pattern from 1.3976 has completed with three waves down to 1.3115. Further rally should then be seen to 1.3653 resistance next. Nevertheless, break of 1.3202 support will bring retest of 1.3115 low instead.
In the bigger picture, price actions from 1.3976 are viewed as a correction to up trend from 1.2005 (2021 low) only. Hence, the up trend is in favor to resume through 1.3976 at a later stage. Nevertheless, another fall below 1.3115 will extending the decline from 1.3976 to 61.8% retracement of 1.2005 to 1.3976 at 1.2758, and raise the chance of bearish trend reversal.
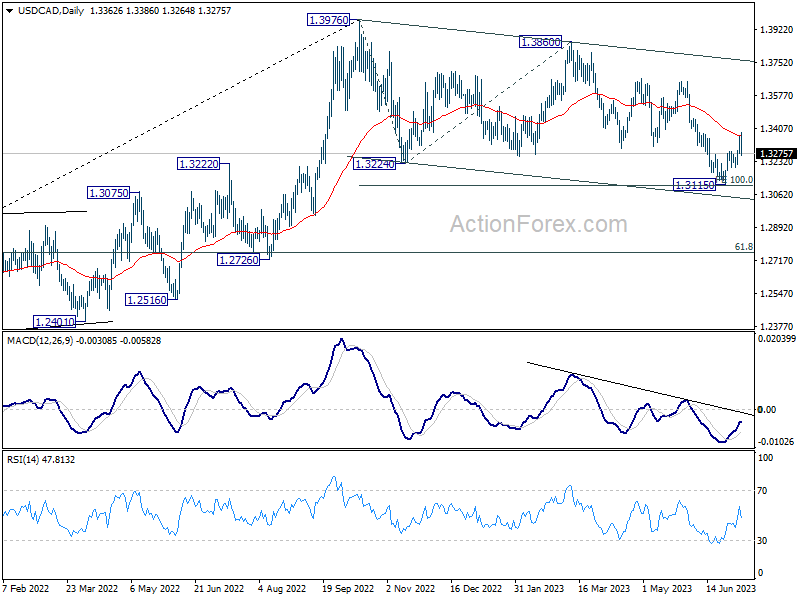
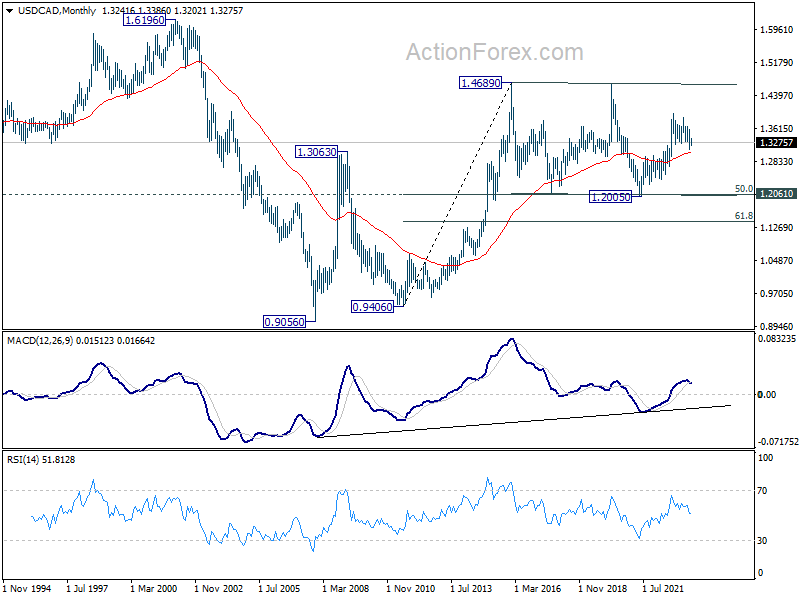
In the longer term picture, price actions from 1.4689 (2016 high) are seen as a consolidation pattern only, which might have completed at 1.2005. That is, up trend from 0.9506 (2007 low) is expected to resume at a later stage. This will remain the favored case as 55 M EMA (now at 1.3048) holds.