

Sample Category Title
GBP/USD Regains Strength, USD/CAD Corrects Lower
GBP/USD started a strong increase and retested 1.2850. USD/CAD is correcting gains and trading below the 1.3300 support.
Important Takeaways for GBP/USD and USD/CAD Analysis Today
- The British Pound started a steady increase above the 1.2760 resistance.
- There was a break above a connecting trend line with resistance near 1.2780 on the hourly chart of GBP/USD at FXOpen.
- USD/CAD declined below the 1.3320 and 1.3300 support levels.
- It traded below a key bullish trend line with support at 1.3320 on the hourly chart at FXOpen.
GBP/USD Technical Analysis
On the hourly chart of GBP/USD at FXOpen, the pair was able to climb above the 1.2720 resistance zone. The British Pound gained strength after it broke the 50-hour simple moving average at 1.2760.
During the increase, there was a break above a connecting trend line with resistance near 1.2780. It opened the doors for a move toward the 1.2850 resistance where the bears emerged. A high is formed near 1.2849 and the pair is now consolidating gains.
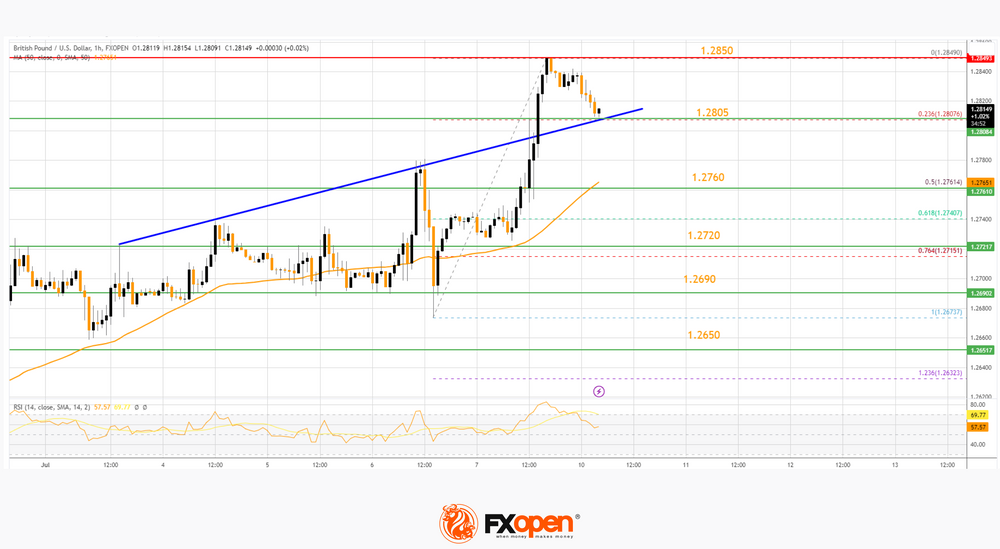
The RSI dipped below the 60 level on the GBP/USD chart and the pair is now testing the 23.6% Fib retracement level of the upward move from the 1.2673 swing low to the 1.2849 high.
Immediate resistance is forming near the 1.2850 level. The next resistance is near 1.2880. An upside break above the 1.2880 zone could send the pair toward 1.2950. Any more gains might open the doors for a test of 1.3000.
On the downside, initial support is near the 1.2805 area. The next major support is near the 50% Fib retracement level of the upward move from the 1.2673 swing low to the 1.2849 high at 1.2760 and the 50-hour simple moving average.
If there is a break below 1.2760, the pair could extend its decline. The next key support is near the 1.2720 level. Any more losses might call for a test of the 1.2650 support.
USD/CAD Technical Analysis
On the hourly chart of USD/CAD at FXOpen, the pair started a fresh decline from the 1.3385 resistance zone. The US Dollar gained bearish momentum below the 1.3360 support against the Canadian Dollar.
The pair traded below a key bullish trend line with support at 1.3320. The bears were able to push the pair below the 50% Fib retracement level of the upward move from the 1.3313 swing low to the 1.3386 high.
It is now trading well below the 50-hour simple moving average on the USD/CAD chart. Immediate support is near the 76.4% Fib retracement level of the upward move from the 1.3313 swing low to the 1.3386 high at 1.3255.
A close below the 1.3255 level might trigger a strong decline. In the stated case, USD/CAD might test 1.3200. Any more losses may possibly open the doors for a drop toward the 1.3150 support.
On the upside, the pair is facing resistance near 1.3300. The first major resistance is near the 50-hour simple moving average at 1.3320. If there is an upside break above 1.3320, the pair could rise toward the 1.3360 resistance.
The next major resistance is near the 1.3385 level, above which it could rise steadily toward the 1.3450 resistance zone.
China Equities Bulls Still on Waiting list
- Deflationary spiral risk has negated confidence in China equities.
- US dollar has continued to hold steady against the yuan despite a broad-based sell-off against other major currencies ex-post US non-farm payrolls.
- The key intermediate support to watch on the USD/CNH will be at 7.2160.
Weak China inflation data offset positive China Big Tech news flow
The dreaded fear of a deflationary spiral in China has reached “code red” where the latest consumer inflation rate for June has flattened to 0% year-on-year from a gain of 0.2% year-on-year in May and came in below expectations of an increase of 0.2%. This latest reading in CPI is the weakest rate since February 2021.
In addition, producers’ prices (factory gate prices) continued to deteriorate further into contraction mode; it dropped -5.4% year-on-year, faster than a 4.6% fall in May, and worse than expectations of a -5.0% decline. Overall, it has marked the ninth consecutive month of producer deflation and its steepest fall since December 2015.
Time is running out for Chinese policymakers to negate the steepening rout in the internal demand environment that can potentially lead to further loss in consumer and business confidence if the deflationary spiral starts to be persistent. It may lead to a liquidity trap scenario in China where monetary policy tools will be less effective to stimulate real economic growth.
The forward pricing mechanisms of the stock market seem to have started to take into account some aspects of the negative feedback loop triggered by the liquidity trap scenario, earlier intraday gains of between 1% to 3.2% seen in today’s Asian session on the Hang Seng indices as well as China’s benchmark CSI 300 driven by China Big Tech equities as Chinese regulators have signalled on last Friday after the close of the Asian session to end a two-year plus of crackdown on the technology sector have been reduced by slightly more than half, CSI 300 (0.5%), Hang Seng Index (0.8%), Hang Seng TECH Index (1.25%), and Hang Seng China Enterprises Index (0.7%) at this time of the writing.
China’s yuan remained soft despite the broader USD sell-off
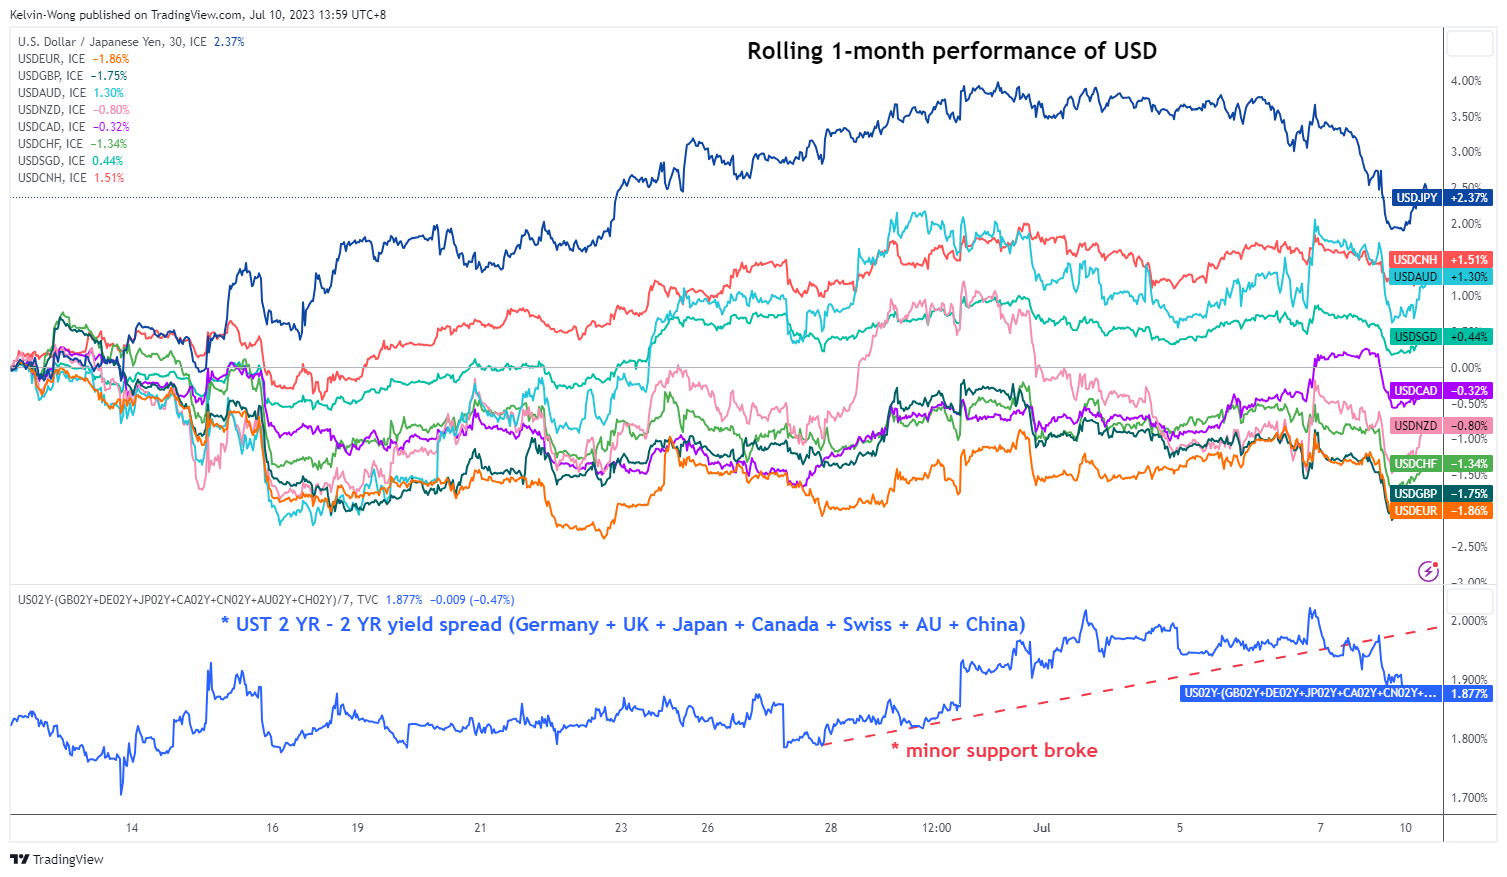
Fig 1: US dollar rolling 1-month performance as of 10 Jul 2023 (Source: TradingView, click to enlarge chart)
The US dollar sold off last Friday, 7 July reinforced by technical factors after the US Dollar Index cracked below its 50-day moving average that had been acting as a prior minor support since 28 June 2023, also ex-post US non-farm payrolls for June that came in below expectations (209K added vs. 225K consensus). Based on the rolling one-month performances as of today, the USD is weakest against the EUR (-1.89%), GBP (1.81%), and CHF (-1.35%) while holding steady against the offshore yuan, CNH (+1.44%).
In addition, the US Treasury 2-year yield premium over an average of key developed nations’ 2-year sovereign yields (Germany, UK, Japan, Canada, Switzerland, Australia, China) has narrowed as well.
USD/CNH short and medium-term uptrend phases remain intact
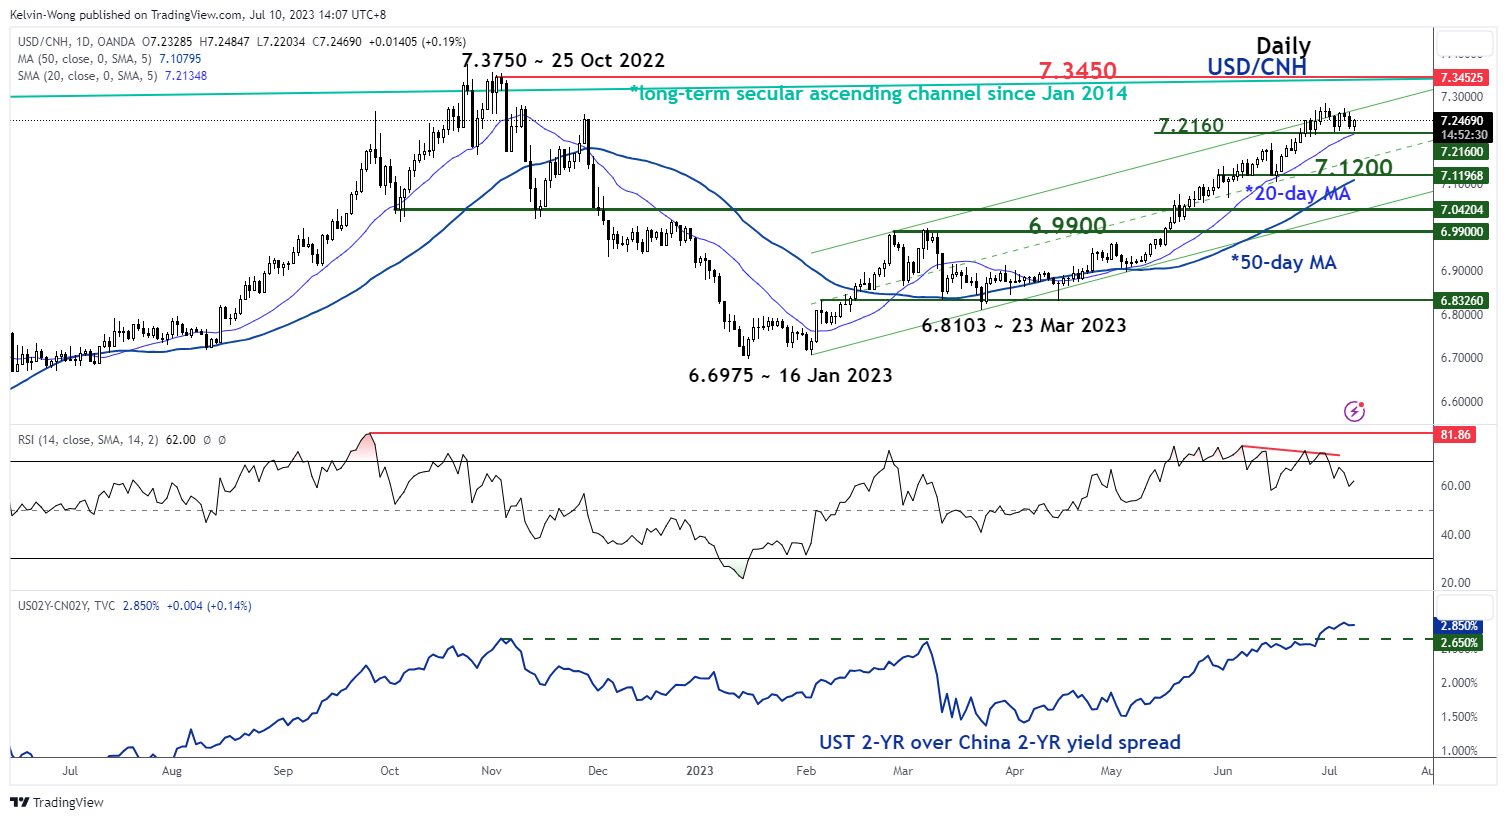
Fig 2: USD/CNH short & medium-term trends as of 10 Jul 2023 (Source: TradingView, click to enlarge chart)
Since the start of its upside acceleration on 4 May 2023, the USD/CNH has managed to evolve above its 20-day moving average and today’s price action has managed to stage a rebound after a retest on it. If the 20-day moving average now acting as a key intermediate support at 7.2160 is not broken down, the USD/CNH is likely to remain in its short-term bullish trend trajectory which in turn may see further potential weakness in the CSI 300 and Hang Seng indices.
The only catalyst for a potential revival of bullish animal spirits in China equities is a clear signal from China’s State Council on the implementation of new fiscal stimulus measures in terms of scope and timing.
Nasdaq 100 Technical: Potential Minor Bearish Double Top
- The bulls of the Nasdaq 100 have staged another retreat at the key 15,270 resistance.
- Medium-term upside momentum has started to wane as indicated by the daily RSI.
- Minor bearish “Double Top” sighted with its neckline support at 14,700.
This is a follow-up on our prior analysis “Nasdaq 100 Technical: “Risk of a medium-term blow-off top” published on 27 June 2023. So far, its price actions have failed to have a daily close above the 15,270 key medium-term pivotal resistance after an intraday breach above it on 5 July.
Bulls halted again at the 15,270 level
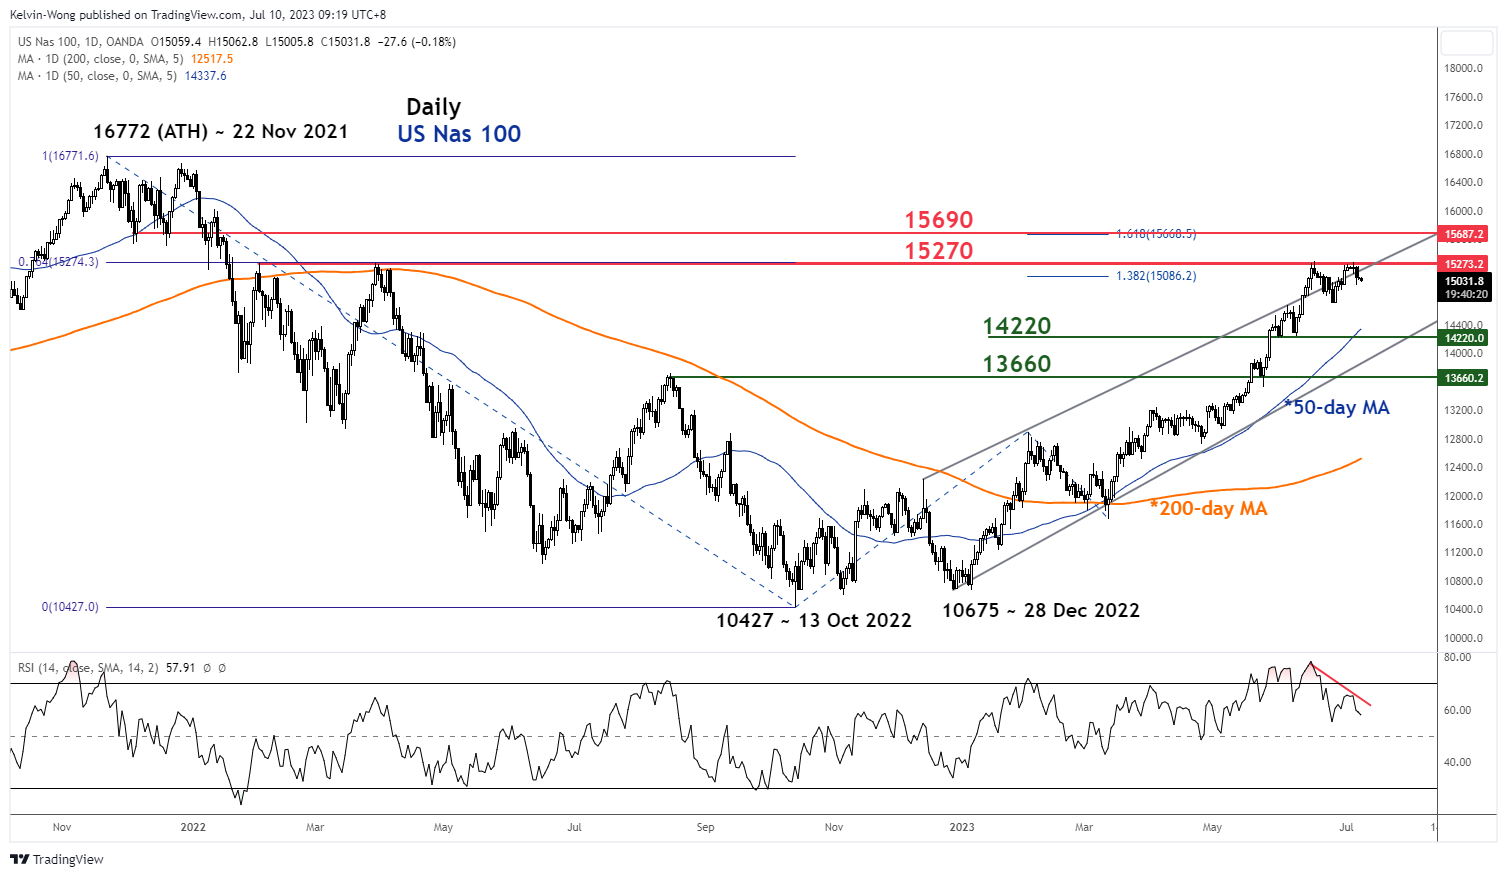
Fig 1: US Nas 100 medium-term trend as of 10 Jul 2023 (Source: TradingView, click to enlarge chart)
After a retest on the key 15,270 resistance level on 5 July 2023 (printed an intraday high of 15,283), the US Nas 100 Index (a proxy for the Nasdaq 100 futures) has staged a decline of -2.1% to print a low of 14,964 on 6 July 2023.
Additional bearish elements have emerged
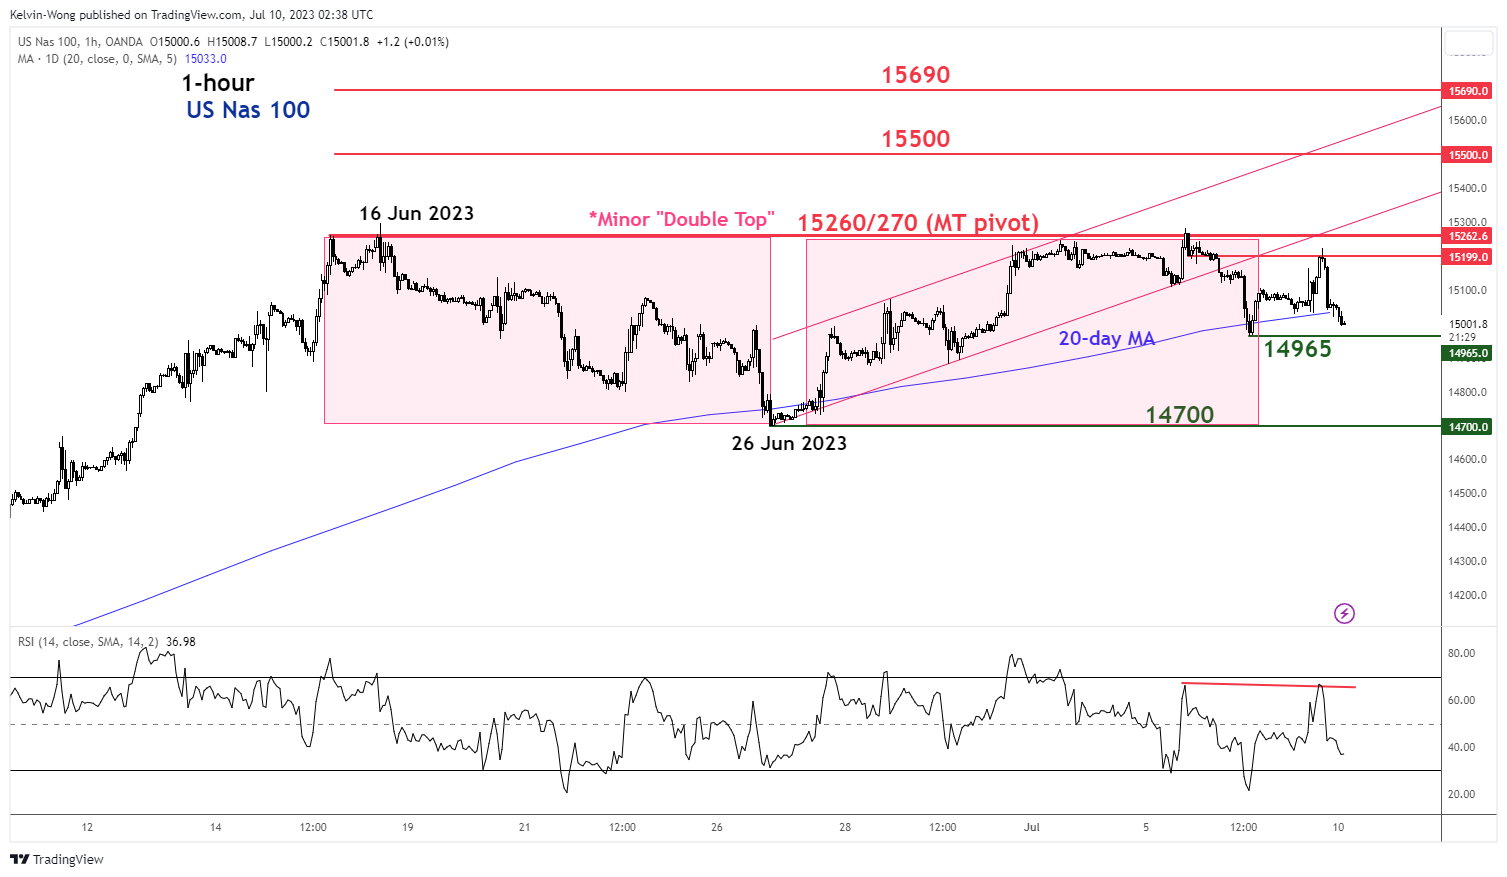
Fig 2: US Nas 100 minor short-term trend as of 10 Jul 2023 (Source: TradingView, click to enlarge chart)
The daily RSI oscillator flashed a bearish divergence signal on 4 July 2023 after it exited from its overbought region (above 70 level) which suggests that medium-term upside momentum has started to wane.
In a shorter time horizon (1-hour chart), the price actions of the Index have traced out an impending minor bearish “Double Top” configuration with its neckline support of 14,700.
Also, on the 1-hour chart, the price actions have staged a bearish breakout below the minor ascending channel support followed by a crack below the 20-day moving average in today’s Asian session at this time of the writing that indicates a potential minor downtrend phase may have kickstarted.
Watch the 15,270 key medium-term pivotal resistance to maintain the bearish tone and a break below 14,965 exposes the next support at 14,700 (the neckline of the minor “Double Top”).
However, a clearance above 15,270 sees the next resistances coming in at 15,500 and 15,690.
Technical Outlook and Review
DXY:
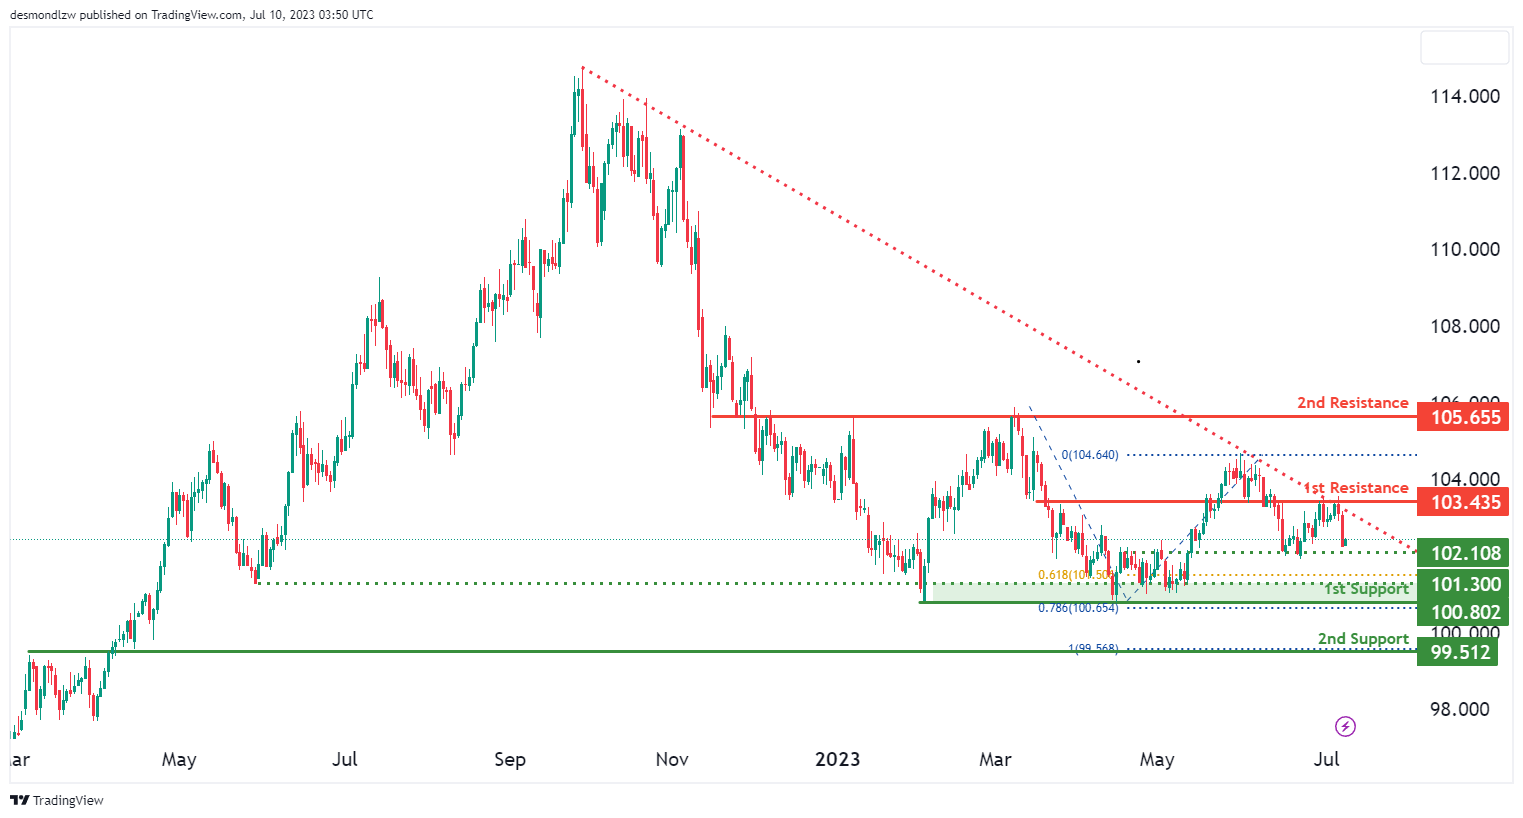
The DXY (US Dollar Index) chart currently demonstrates a bearish momentum, indicating a downward bias in the market. This is supported by the price being below a major descending trend line, which suggests the potential continuation of the bearish trend.
There is a possibility for a bearish reaction off the first resistance level, indicating a potential area where selling pressure could increase. This resistance level, located at 103.44, is considered significant as it represents an overlap resistance. If the price fails to break above this level, it could signal the continuation of the bearish trend.
In the event of a bearish continuation, the price may drop towards an intermediate support level at 102.11. This level is important to monitor as it could potentially act as a temporary support zone, slowing down the downward momentum.
On the downside, there is a first support zone between 100.80 and 101.30. This support zone is of particular interest as it aligns with the 61.80% and 78.60% Fibonacci Projection levels, adding to its significance. A break below the intermediate support level at 102.11 could trigger a move towards this support zone.
Furthermore, the second support level at 99.51 serves as an additional area of support. This level acts as an overlap support and also coincides with the 100.00% Fibonacci Projection level, enhancing its importance.
EUR/USD:
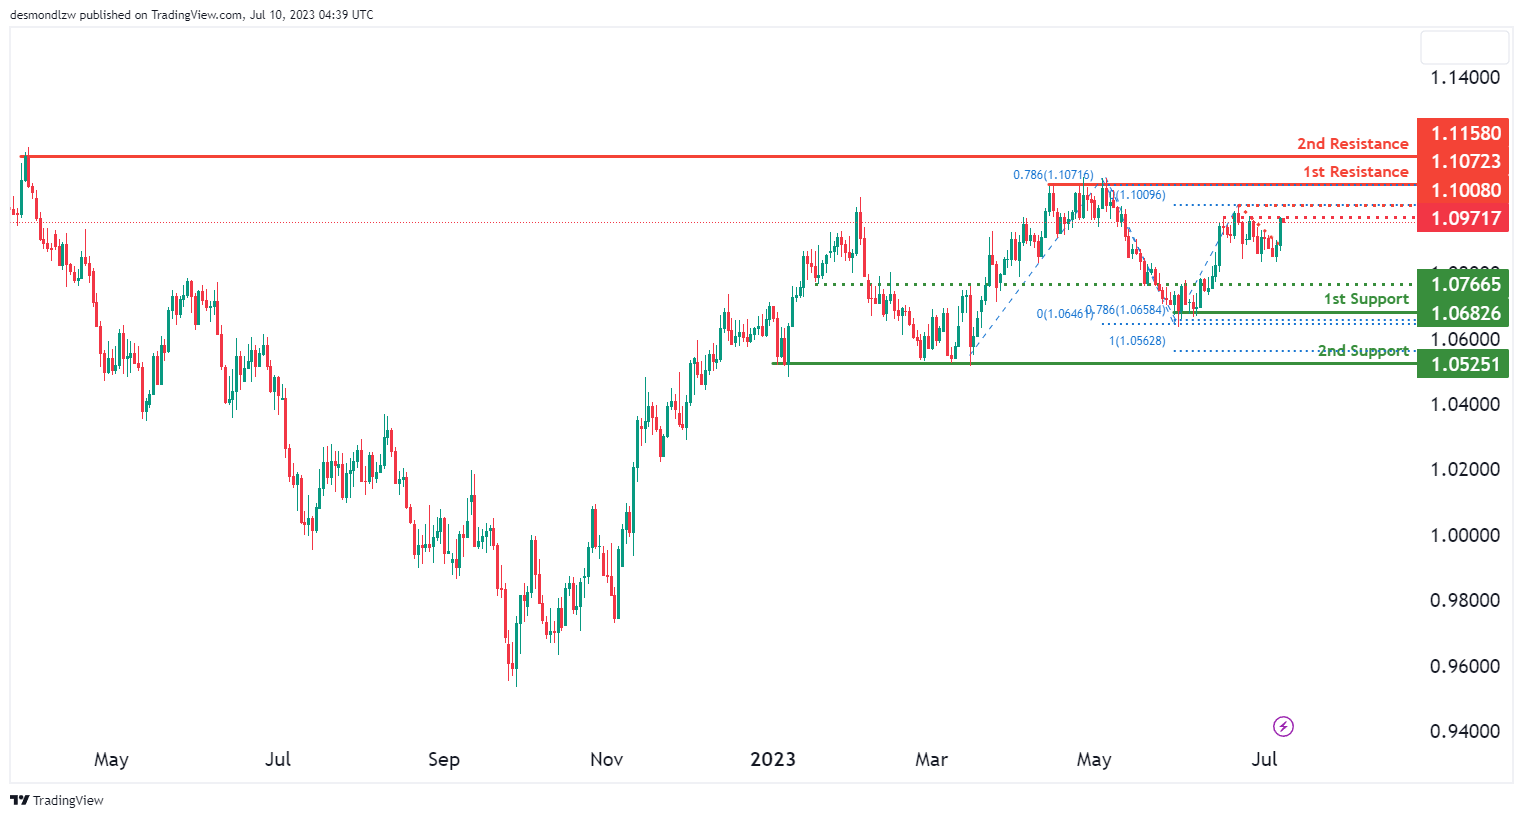
The EUR/USD chart currently exhibits a weak bullish momentum with low confidence, suggesting a potential upward movement in the market. However, caution is advised due to the lack of strong conviction in the bullish trend.
There is a possibility for a bullish continuation towards the first resistance level at 1.1072. This level represents a multi-swing high resistance and coincides with a 78.60% Fibonacci Projection, making it a significant barrier for further price advancement. Furthermore, the second resistance level at 1.1158 is an overlap resistance, suggesting a significant barrier.
On the downside, the first support level at 1.0683 is considered a good level of support. It represents a multi-swing low support and aligns with a 78.60% Fibonacci Projection. This level may act as a potential area of price support.
Additionally, the second support level at 1.0525 is an overlap support that also aligns with a 100% Fibonacci Projection, further reinforcing its significance as a level of potential downside support.
EUR/JPY:
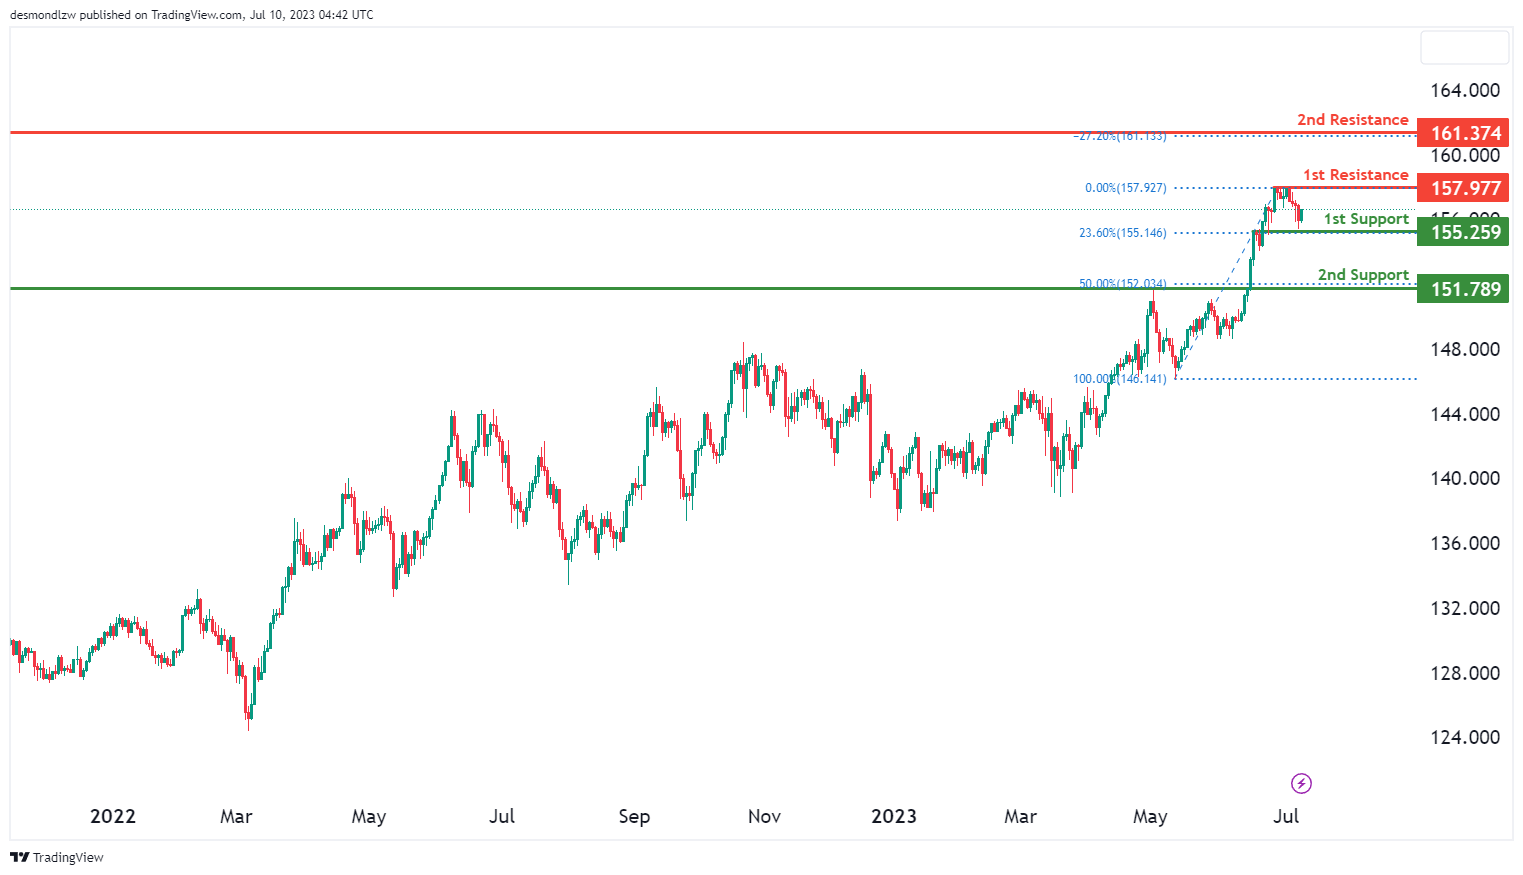
The EUR/JPY instrument is currently demonstrating a strong bullish overall momentum, indicating a potential continuation of the upward movement in the market.
There is a possibility for the price to continue its bullish trajectory towards the first resistance level located at 157.98. This resistance level holds significant importance as it has previously acted as a barrier to price advancement during multiple swings, suggesting that it may offer resistance once again.
On the support side, the first support level at 155.26 is considered strong and robust. It also serves as a pullback support. Additionally, this support level aligns with a 23.60% Fibonacci Retracement, further enhancing its significance as a potential area of price support.
Furthermore, the second support level at 151.79 is viewed as robust due to its characteristics as an overlap support and a 50% Fibonacci Retracement. Together, these factors reinforce the strength of the support level.
On the resistance side, the second resistance level at 161.37 stands out as noteworthy as it is an overlap resistance that aligns with a -27% Fibonacci Expansion level, which can pose a considerable challenge to the upward movement.
EUR/GBP:
The EUR/GBP chart currently exhibits a strong bullish overall momentum, indicating a potential continuation of the upward movement in the market.
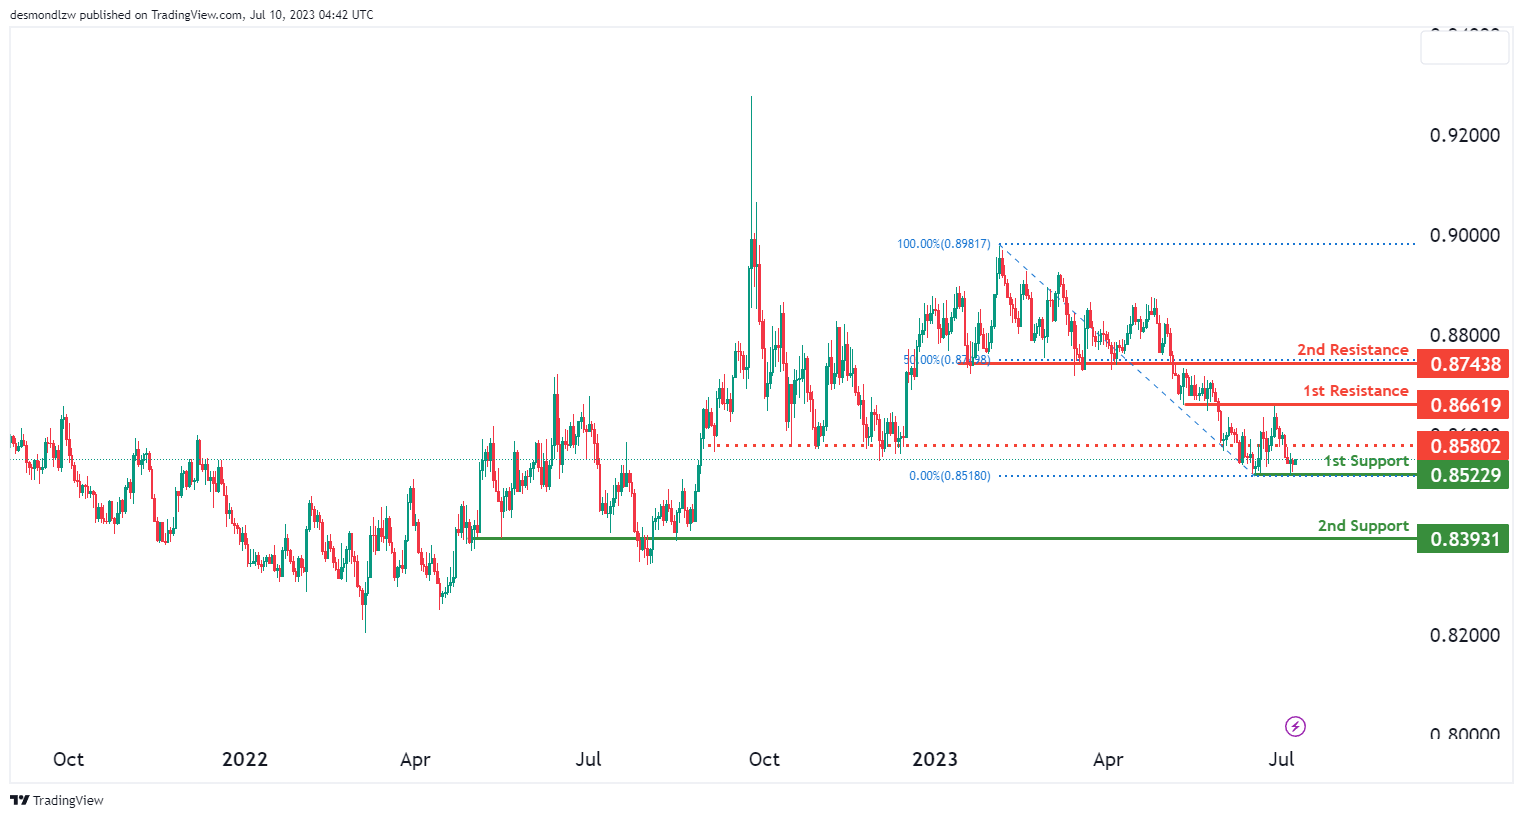
There is a plausible scenario where the price might follow a bullish continuation towards the first resistance level at 0.8662. This resistance level holds noteworthy significance as it has previously acted as a barrier to price advancement, displaying characteristics of an overlap resistance.
Turning our attention to the support levels, the first support level at 0.8523 is positioned as a strong level of potential price support and is characterised as a multi-swing low support. Furthermore, the second support level at 0.8393 is considered robust due to its overlap support characteristic. This level enhances the overall strength of the support area.
Additionally, the second resistance level at 0.8744 holds significant importance for the upward movement. It is an overlap resistance and aligns with a 50% Fibonacci Retracement level, which adds further weight to its significance. The confluence of these factors forms a considerable hurdle for further advancement.
It is also worth noting the presence of an intermediate resistance level at 0.8580 that holds significance as an overlap resistance.
GBP/USD:
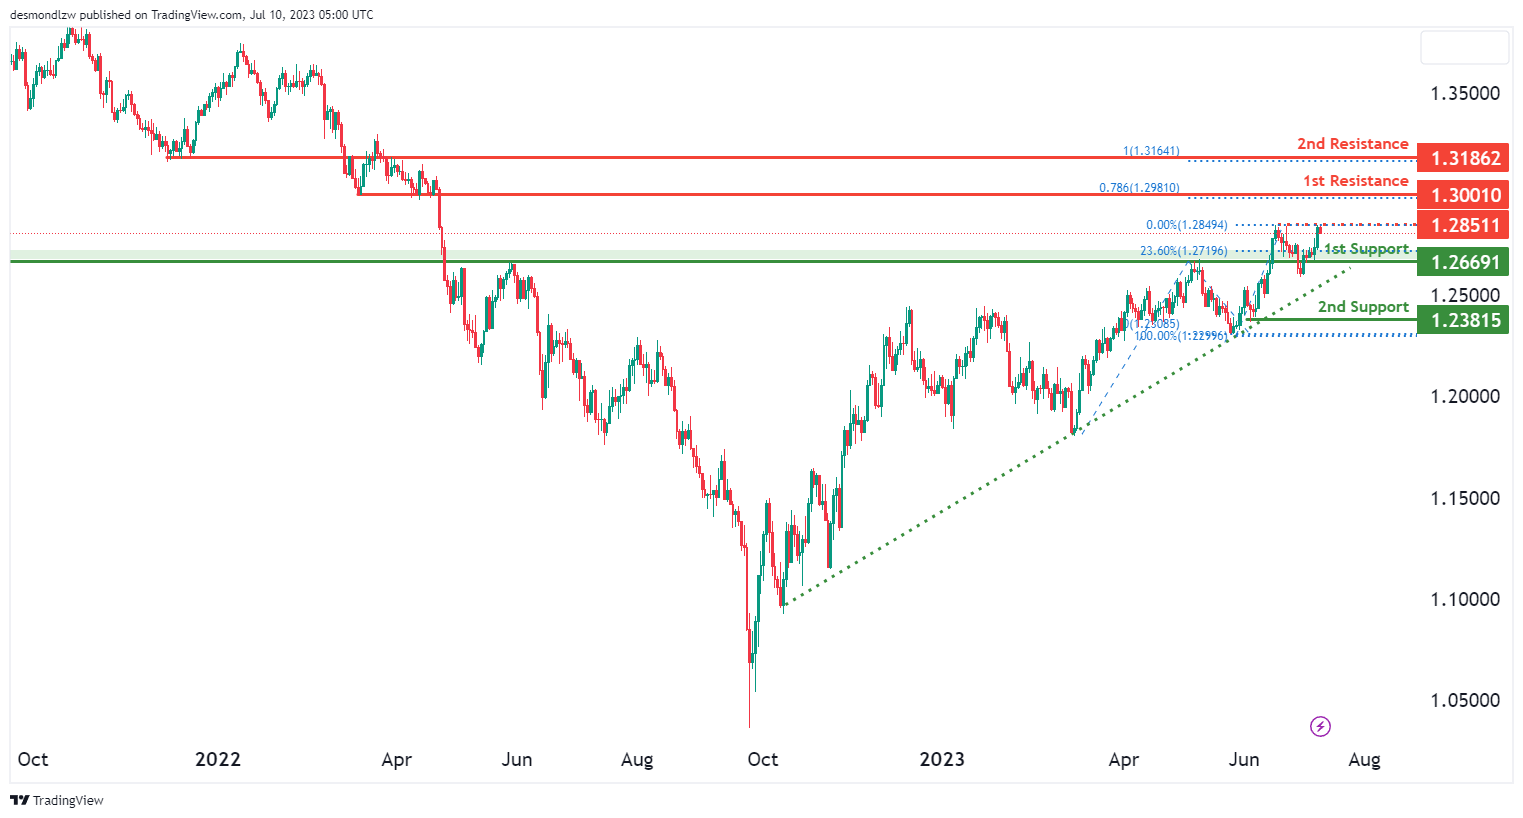
The GBP/USD chart currently exhibits a weak bullish overall momentum with low confidence. However, there is a potential for a bullish continuation in the market.
The first support level at 1.2669 is considered a good level of potential price support. It is characterised as an overlap support that aligns with a 23.60% Fibonacci Retracement, which adds further significance to its potential as a support level. Furthermore, the second support level at 1.2382 is identified as a multi-swing low support, suggesting that it has served as a significant level in the past.
On the upside, the first resistance level at 1.3001 is viewed as a significant level of potential price resistance. It is characterised as an overlap resistance that aligns with a 78.60% Fibonacci Projection level, which adds further weight to its significance. Additionally, the second resistance level at 1.3186 is identified as an overlap resistance and coincides with a 100% Fibonacci Projection, further enhancing its significance as a potential barrier to the upward movement.
GBP/JPY:
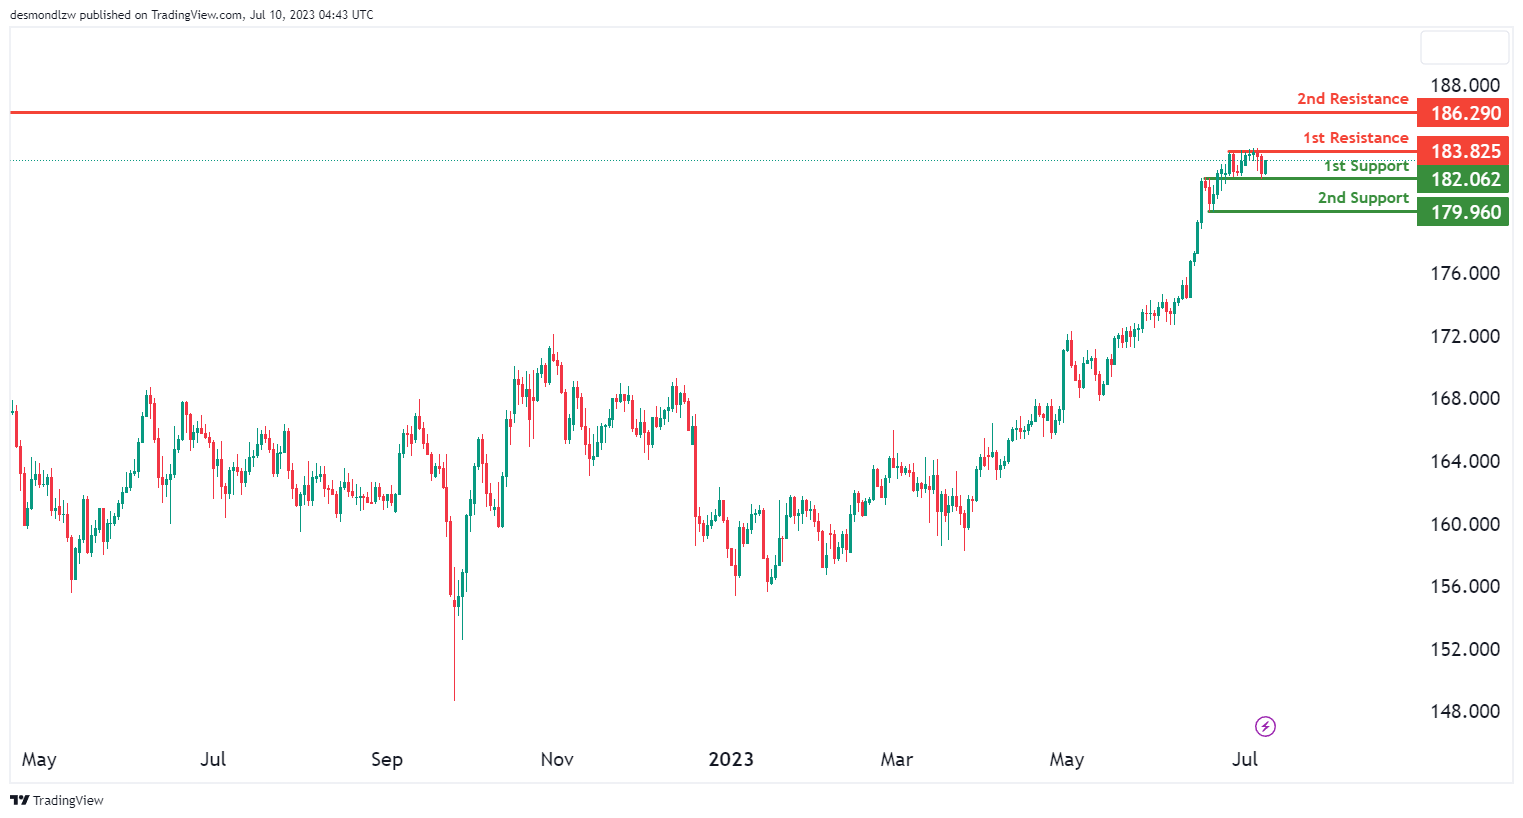
The GBP/JPY chart currently indicates a bullish overall momentum, suggesting a favourable environment for potential upward movement in the market.
The first support level at 182.06 is viewed as a strong level of potential price support and is considered a pullback support. Additionally, the second support level at 179.96 is recognized as a good level due to its swing low support characteristics.
On the resistance side, the first resistance level at 183.83 is considered a significant barrier to the upward movement. It is identified as a multi-swing high resistance. Furthermore, the second resistance level at 186.29 is seen as a notable level due to its swing-high resistance characteristics, potentially posing a challenge for further upward movement.
USD/CHF:
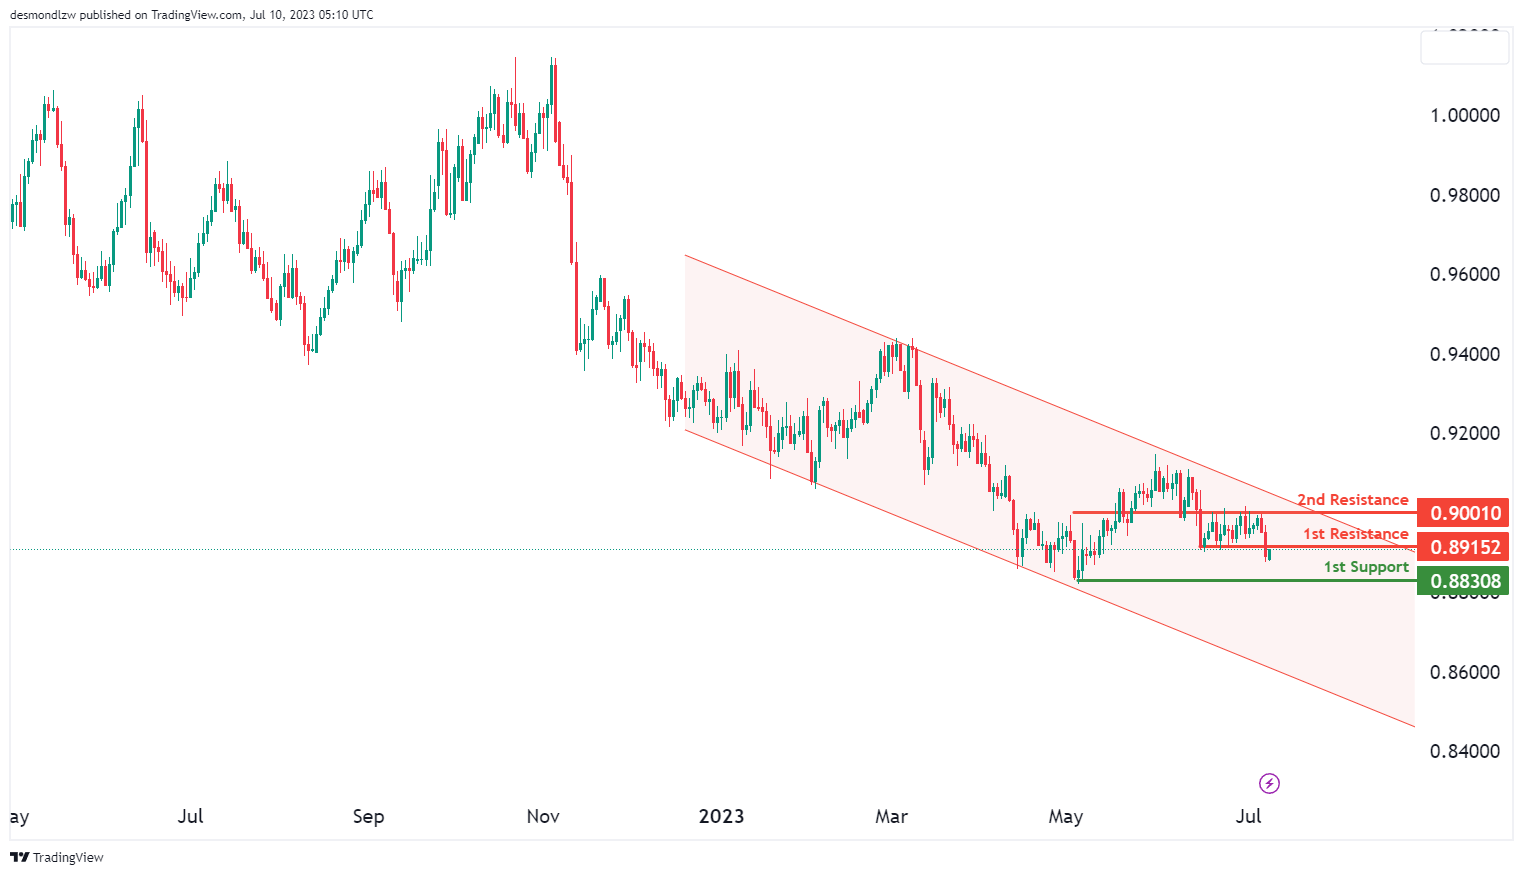
The USD/CHF chart currently indicates a bullish momentum with a potential for a bearish reaction off the first resistance level, followed by a potential drop towards the first support level. The first support level at 0.8831 is identified as a swing low support, indicating that it has previously acted as a significant level.
On the resistance side, the first resistance level at 0.8915 is considered significant as it represents an overlap resistance. This suggests a level that has the potential to act as a barrier to further upward movement. Furthermore, the second resistance level at 0.9001 is identified as an additional overlap resistance, reinforcing its significance as a potential level where upward movement is restricted..
USD/JPY:
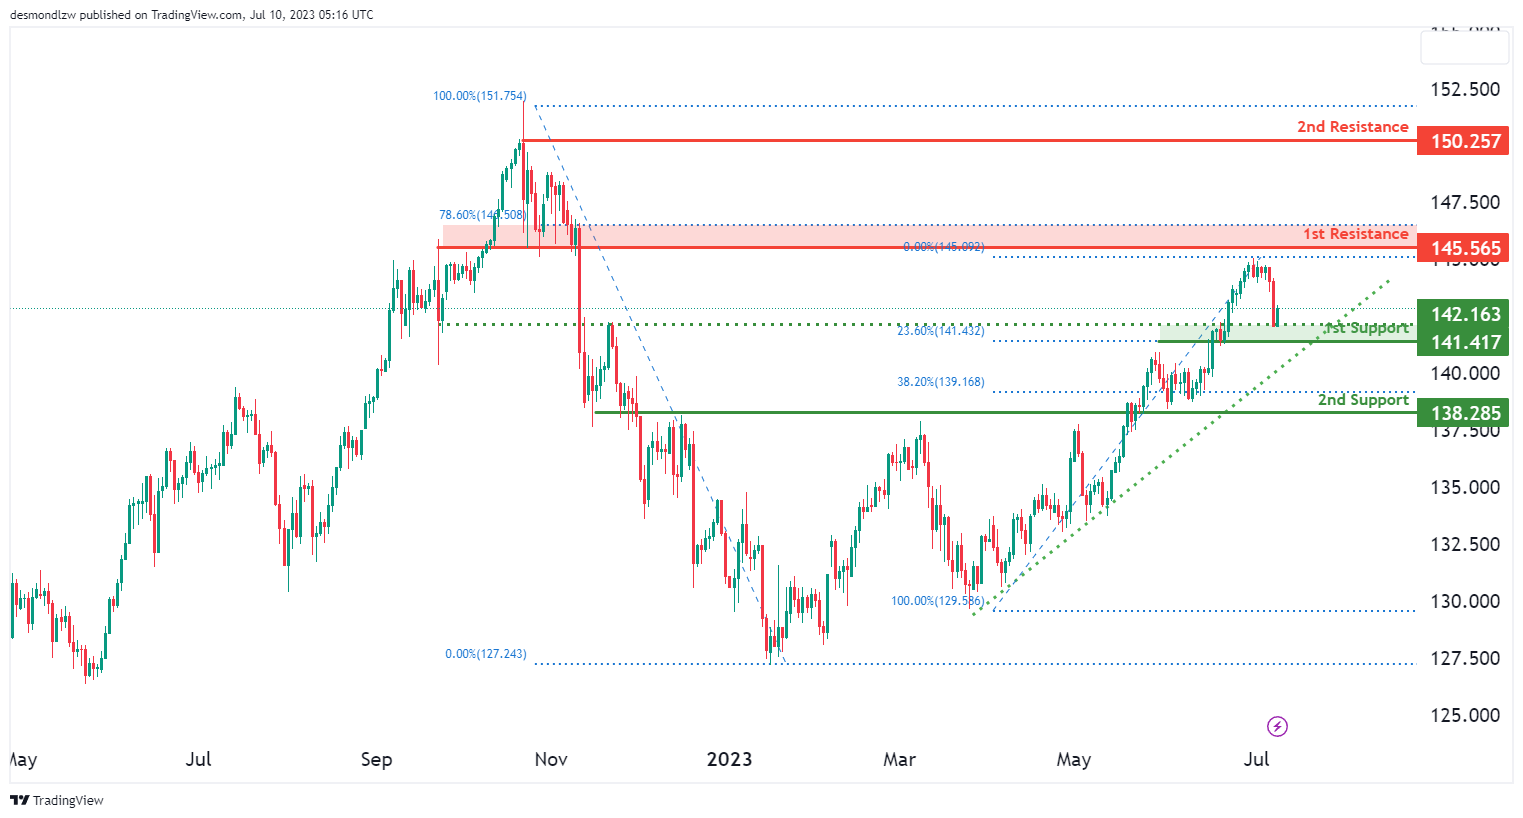
The USD/JPY chart currently demonstrates a strong bullish momentum with high confidence, indicating a favourable outlook for potential upward movement in the market.
The first support level at 141.42 is considered significant as it represents a pullback support and aligns with a 23.60% Fibonacci Retracement. Additionally, the second support level at 138.29 is viewed as a pullback support and coincides with a 38.20% Fibonacci Retracement level.
On the upside, the first resistance level at 145.57 is deemed significant as it represents an overlap resistance that aligns close to the 78.6% Fibonacci Retracement level. Furthermore, the second resistance level at 150.26 is identified as a swing-high resistance, indicating its historical significance as a strong barrier.
USD/CAD:
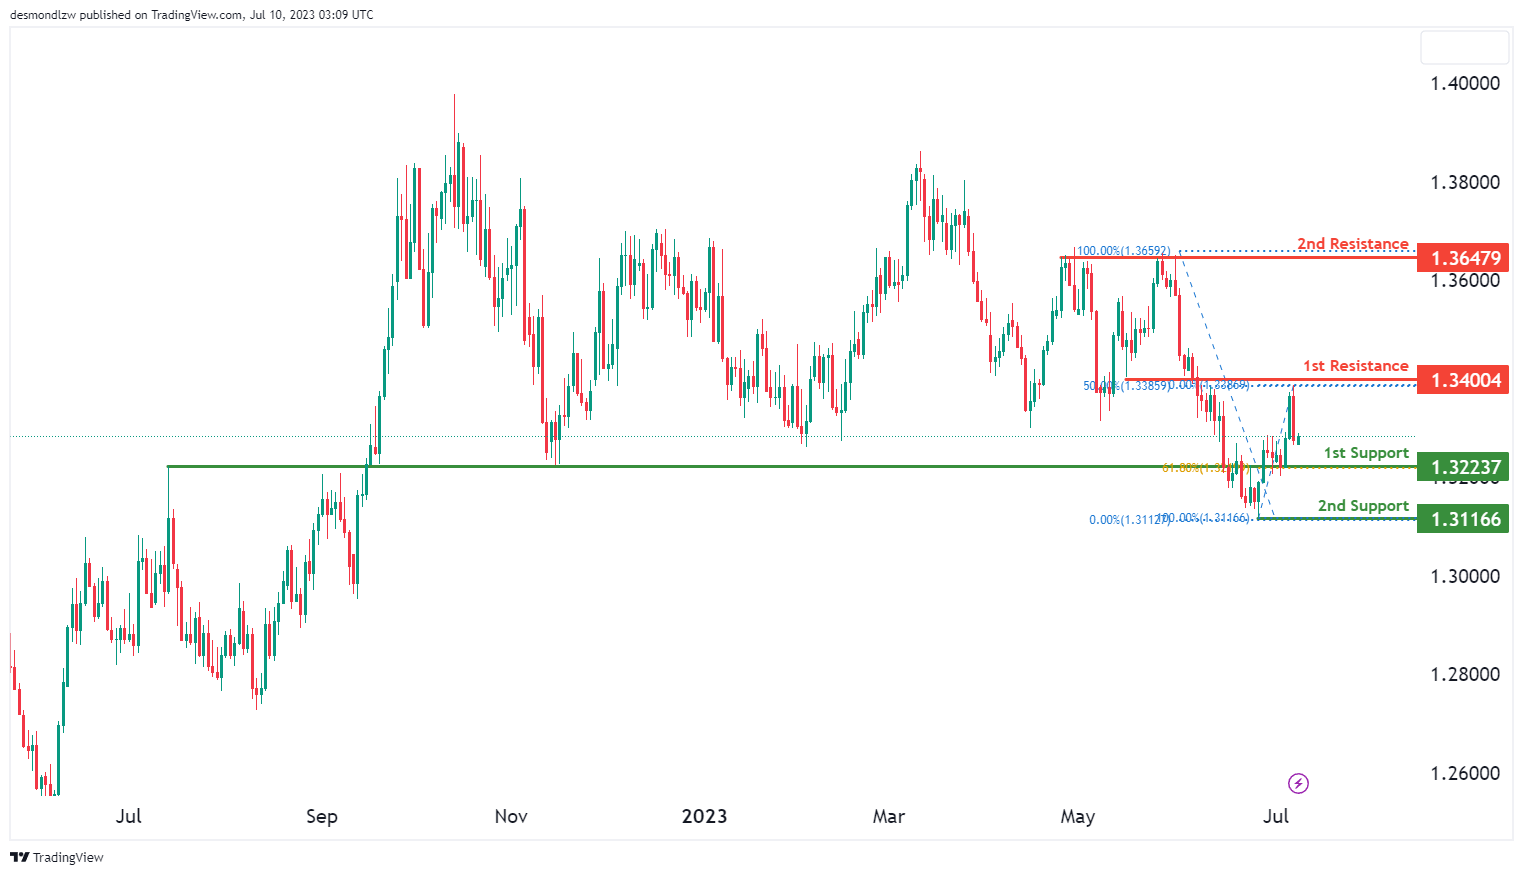
The USD/CAD chart currently displays a bearish momentum, indicating a potential downward movement in the market.
The first support level at 1.3224 is considered significant as it represents an overlap support and aligns with a 61.80% Fibonacci Retracement level. This confluence of support factors enhances its potential as a significant support level. Additionally, the second support level at 1.3117 acts as a swing-low support, indicating its historical significance as a support level.
On the upside, the first resistance level at 1.3400 is identified as an overlap resistance. This potentially acts as a barrier to further upward movement. Furthermore, the second resistance level at 1.3648 represents another overlap resistance, indicating its potential significance as a barrier level.
AUD/USD:
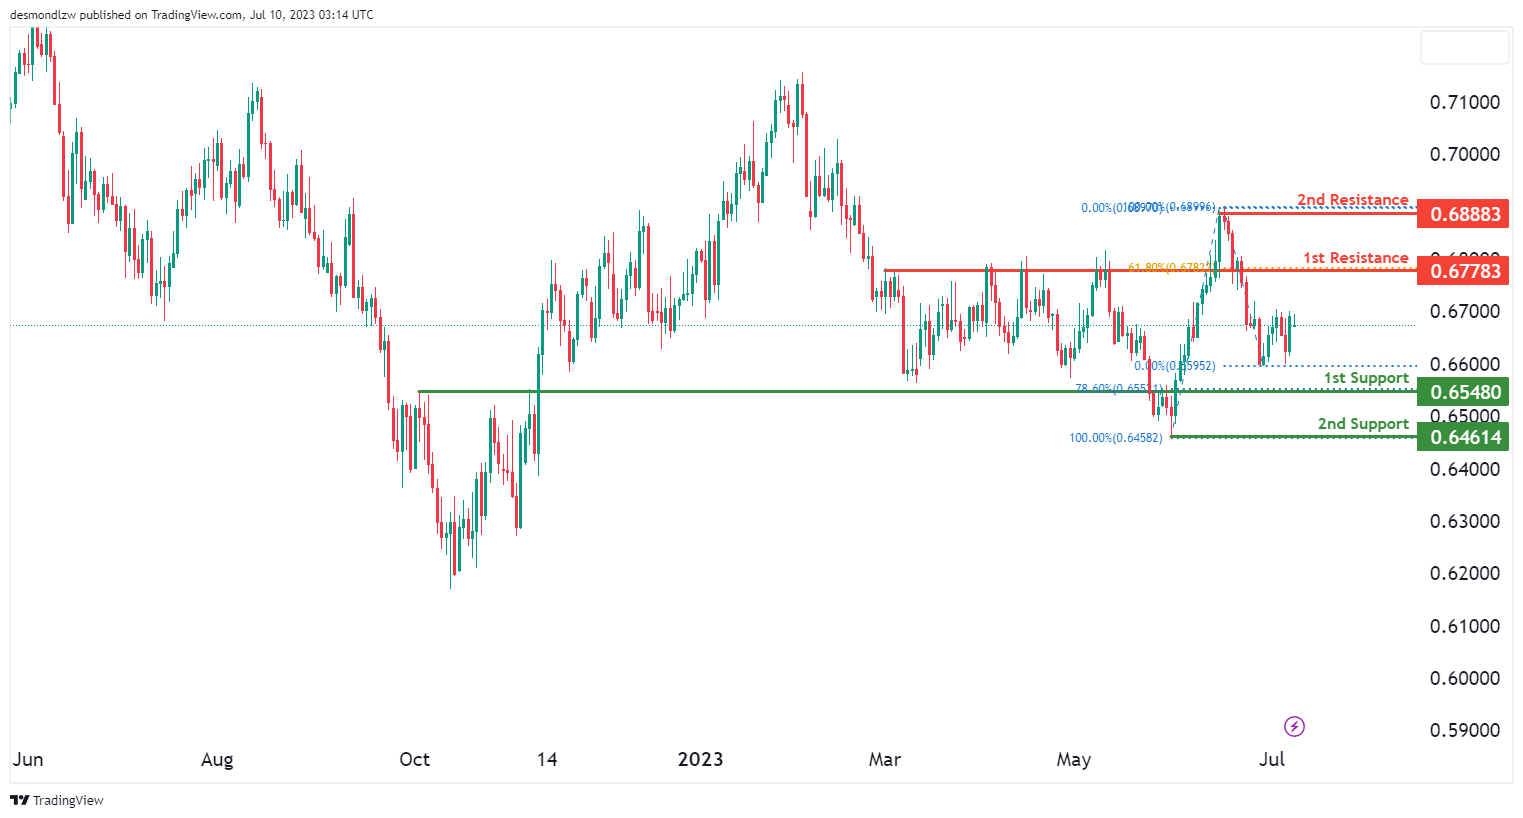
The AUD/USD chart currently demonstrates a bullish momentum, indicating a potential upward movement in the market. There is a possibility for a bullish continuation towards the first resistance level.
This resistance level, located at 0.6778, is considered significant as it represents an overlap resistance. Additionally, it aligns with a 61.80% Fibonacci Retracement level, further reinforcing its importance. If the price manages to break above this resistance level, it could signal the continuation of the bullish trend.
In the event of a bullish continuation, the price may aim for the second resistance level at 0.6888. This level represents a swing high resistance and could act as a barrier for further upward movement.
On the downside, the first support level at 0.6548 plays a crucial role in providing a floor for the price. This support level is considered significant as it represents an overlap support. Moreover, it coincides with a 78.60% Fibonacci Retracement level, adding to its importance as a potential support zone.
Furthermore, the second support level at 0.6461 serves as a swing-low support and represents a previous area where the price found support and reversed its downtrend.
NZD/USD
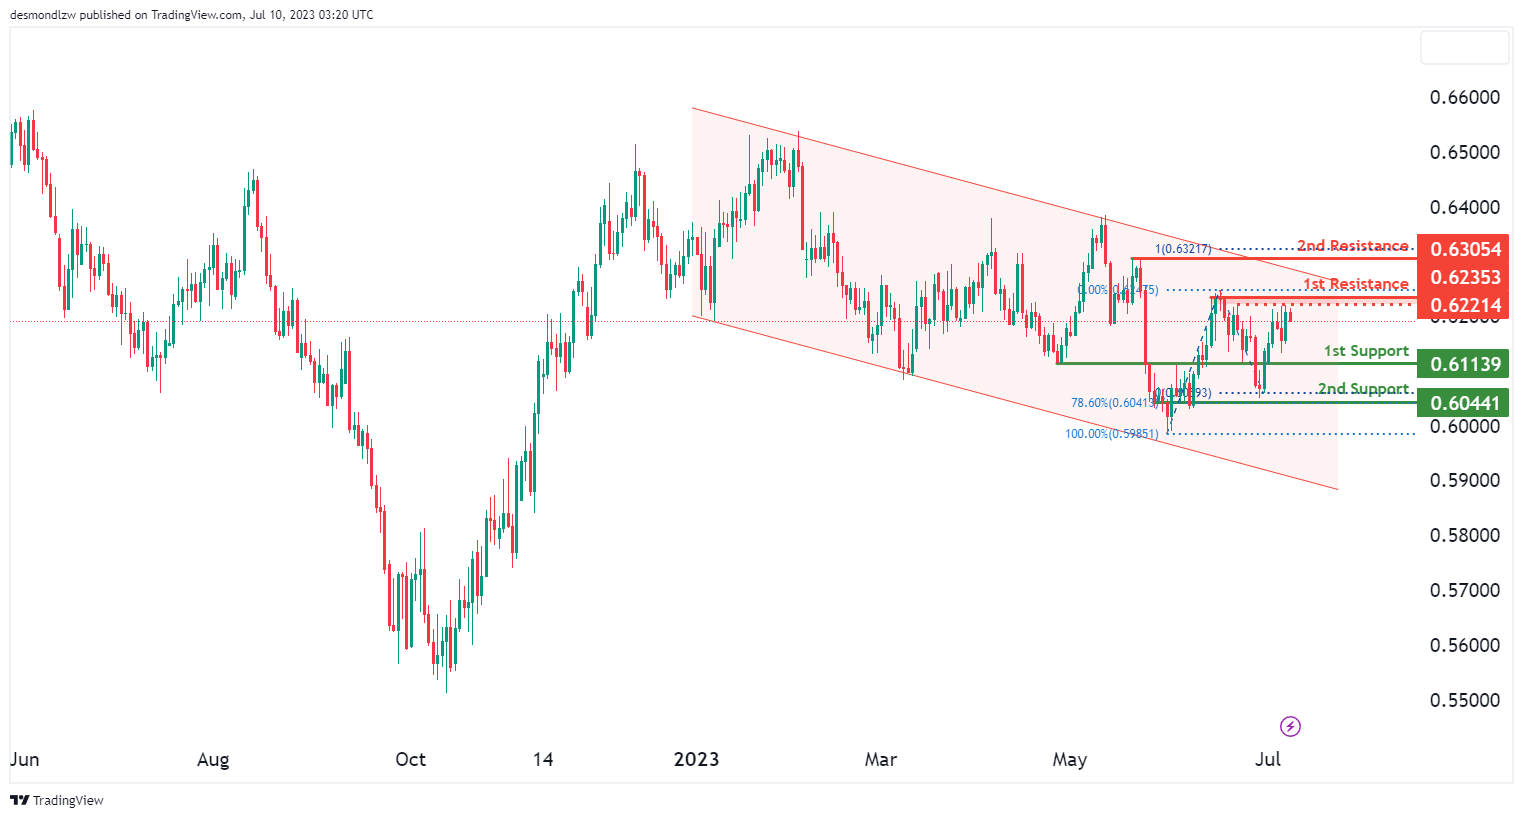
The NZD/USD chart currently shows a bearish momentum, indicating a potential downward movement in the market. There is a possibility for a bearish continuation towards the first support level.
This support level, located at 0.6114, is considered significant as it represents an overlap support. It is an area where previous buying interest was observed, and it could act as a potential floor for the price. Additionally, the second support level at 0.6044 also acts as an overlap support, further reinforcing its significance. This support level aligns with a 78.60% Fibonacci Retracement level, indicating a potential area of strong support based on the Fibonacci analysis.
On the upside, the first resistance level at 0.6235 plays a crucial role in providing a barrier for further upward movement. This resistance level is considered significant as it represents an overlap resistance. It is an area where previous selling pressure was observed, and it could act as a potential ceiling for the price.
Furthermore, the second resistance level at 0.6305 acts as a pullback resistance. It represents a level where the price may encounter selling pressure after a retracement. This resistance level coincides with a 100% Fibonacci Projection level, further adding to its importance as a potential barrier for upward movement.
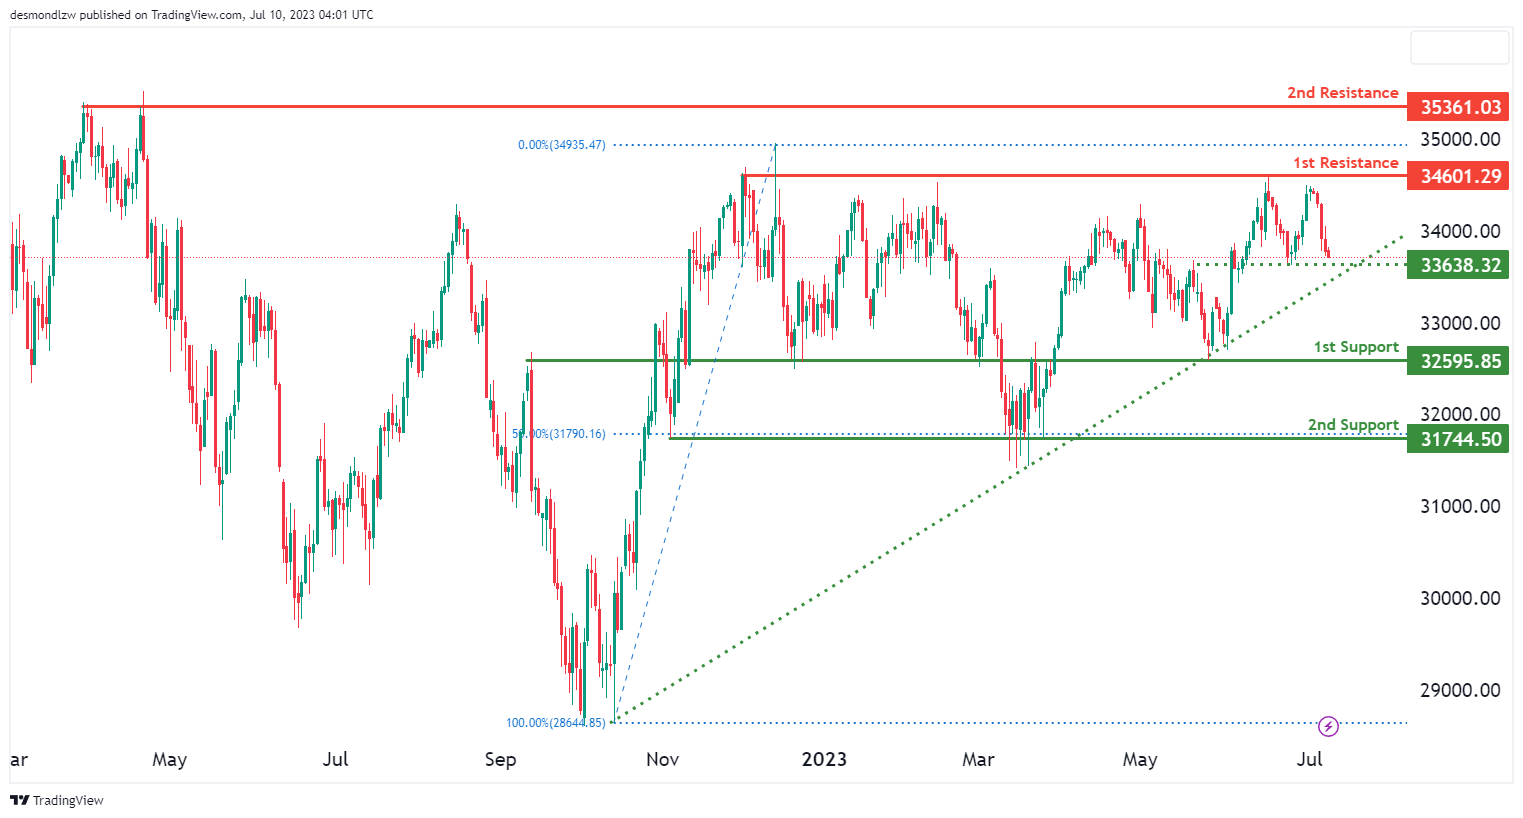
DJ30:
The DJ30 (Dow Jones Industrial Average) chart currently displays a bearish momentum, indicating a potential downward movement in the market.
The chart analysis reveals an intermediate support level at 33638.32, which is a crucial area to watch for a potential bullish rebound. This support level represents a significant level where previous price declines have been halted.
The first support level at 32595.85 further strengthens the potential downside support. It is considered a significant overlap support level.
Additionally, the second support level at 31744.50 acts as a multi-swing-low support, further reinforcing its importance. This level represents a zone where the price has experienced multiple bounces in the past..
On the upside, the first resistance level at 34601.29 is a significant overlap resistance. It represents a level potentially acting as a barrier for further price advancement.
Furthermore, the second resistance level at 35361.03 is a multi-swing-high resistance. It represents a level where the price has encountered selling pressure and experienced multiple rejections.
GER30:
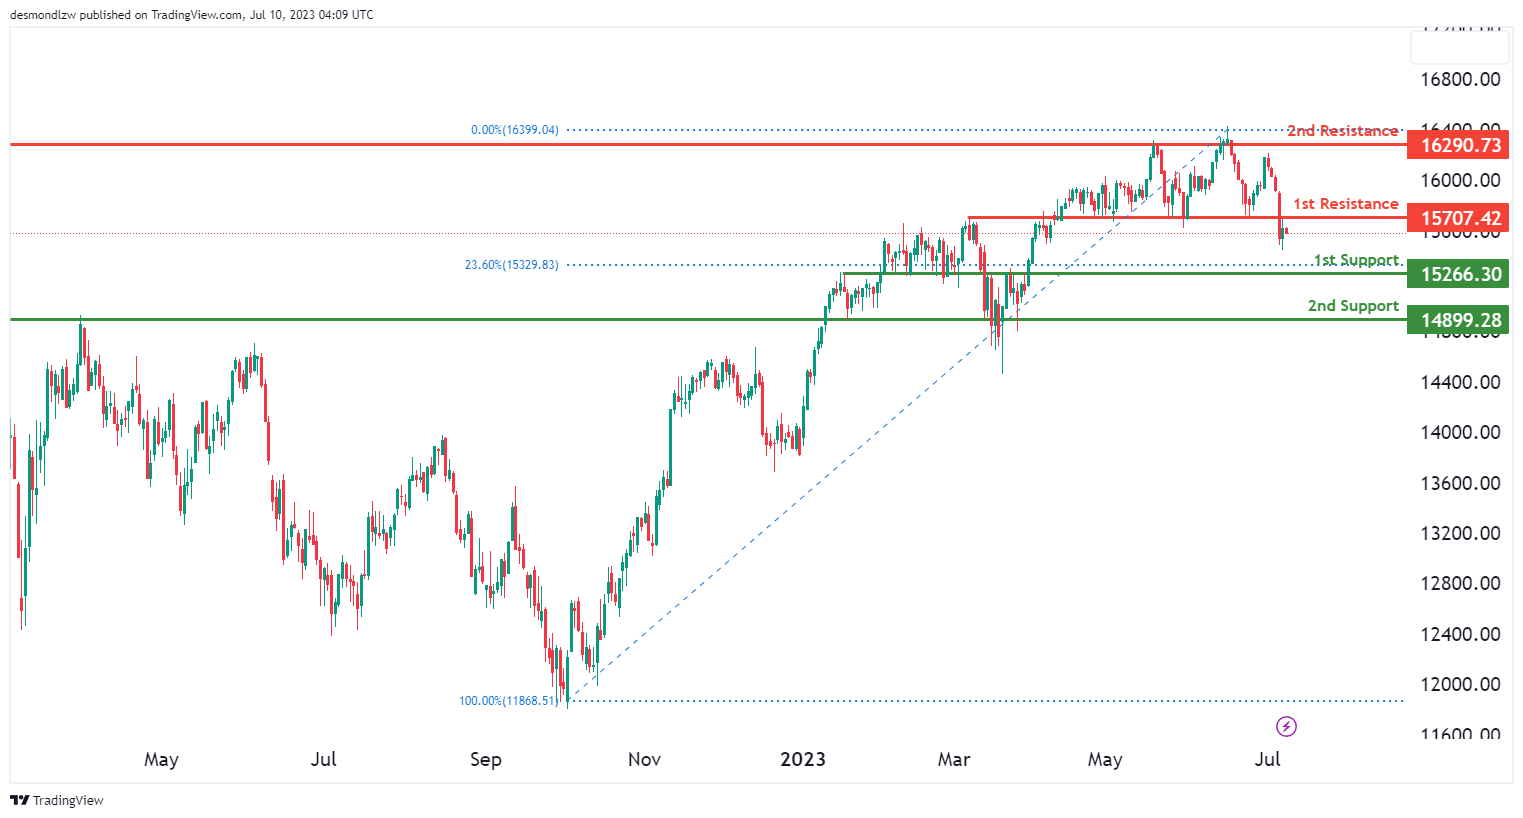
The GER30 (DAX) chart currently indicates a bearish overall momentum, suggesting a potential downward movement in the market.
The chart analysis reveals a potential bearish reaction off the first resistance level. This level represents a significant barrier for further price advancement, where previous selling pressure has been observed.
In the event of a bearish reaction, the price could potentially drop towards the first support level located at 15266.30. This support level is considered significant due to its characteristics of overlap support and a 23.60% Fibonacci retracement.
Furthermore, the second support level at 14899.28 is also viewed as a good level of support. It exhibits overlap support characteristics, reinforcing the potential downside support in the event of a price decline.
On the resistance side, the first resistance level at 15707.42 is considered significant as it represents an overlap resistance. It is a price level that potentially acts as a barrier for further price advancement.
Furthermore, the second resistance level at 16290.73 is seen as a notable level due to its characteristics as a multi-swing high resistance. This level represents a zone where the price has experienced multiple rejections. It suggests that there is a significant area of resistance, potentially limiting further upward movement.
US500
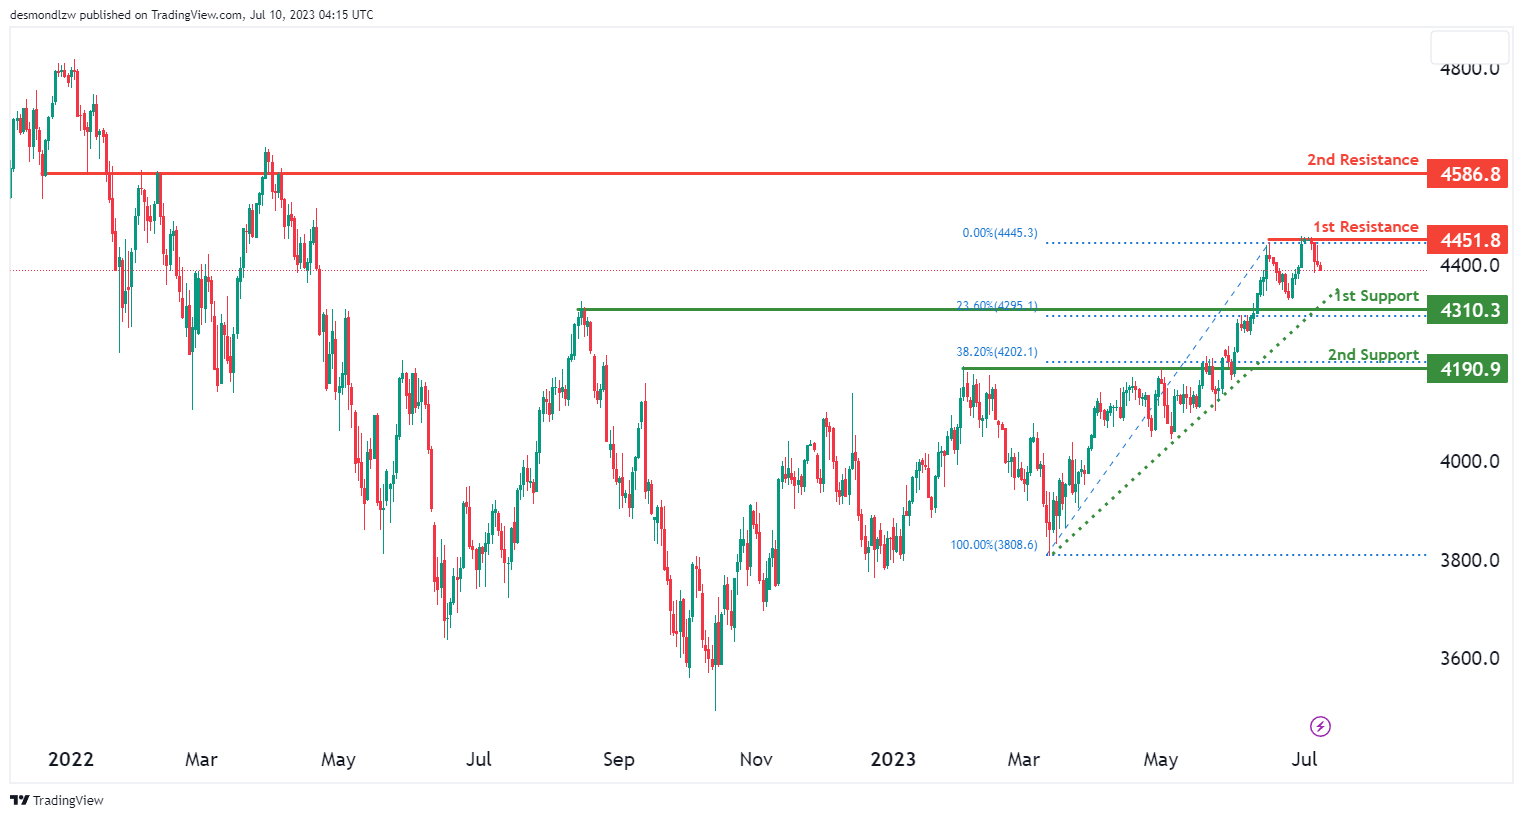
The US500 (S&P 500) chart currently demonstrates a bearish overall momentum, indicating a downward bias in the market. There is a potential for a bearish continuation as the price could move towards the first support level at 4,310.30. This support level is considered significant as it is an overlap support, meaning that it has acted as a support level in the past, and it also coincides with a 23.60% Fibonacci Retracement, adding further strength to its significance.
Furthermore, the second support level at 4,190.90 also plays a crucial role in supporting the price. It is an overlap support, indicating that it has shown historical significance as a support level. Additionally, it aligns with a 38.20% Fibonacci Retracement, which adds to its credibility as a potential area of support.
On the upside, the first resistance level at 4,451.80 serves as a multi-swing high resistance. This means that it has previously acted as a barrier for the price, preventing it from moving higher. As a result, it is expected to offer significant resistance if the price attempts to move upward.
Moreover, the second resistance level at 4,586.80 is an additional overlap resistance. This suggests that it has played a role as a resistance level in the past and is likely to pose a challenge to any further upward movement.
BTC/USD:
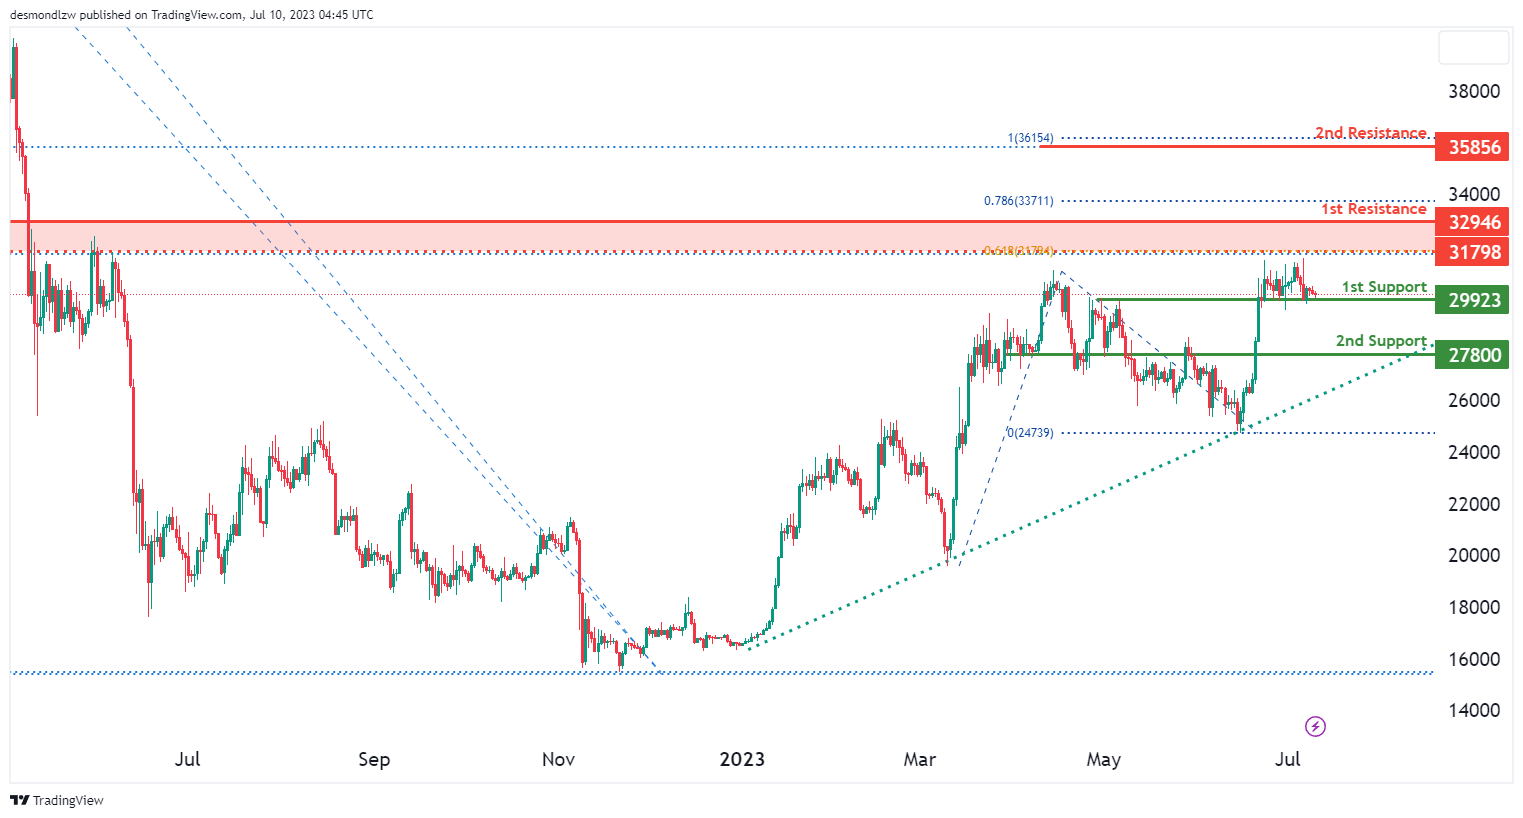
The BTC/USD (Bitcoin) chart currently exhibits a bullish momentum, indicating a potential for upward movement in the market.
The first support level at 29,923 is considered as a pullback support. Additionally, the second support level at 27,800 acts as an overlap support, further reinforcing its potential to provide support to the price.
On the upside, the first resistance level at 32,946 is identified as an overlap resistance. This potentially acts as a barrier to further upward movement. Furthermore, the second resistance level at 35,856 coincides with a 100.00% Fibonacci Projection level.
ETH/USD:
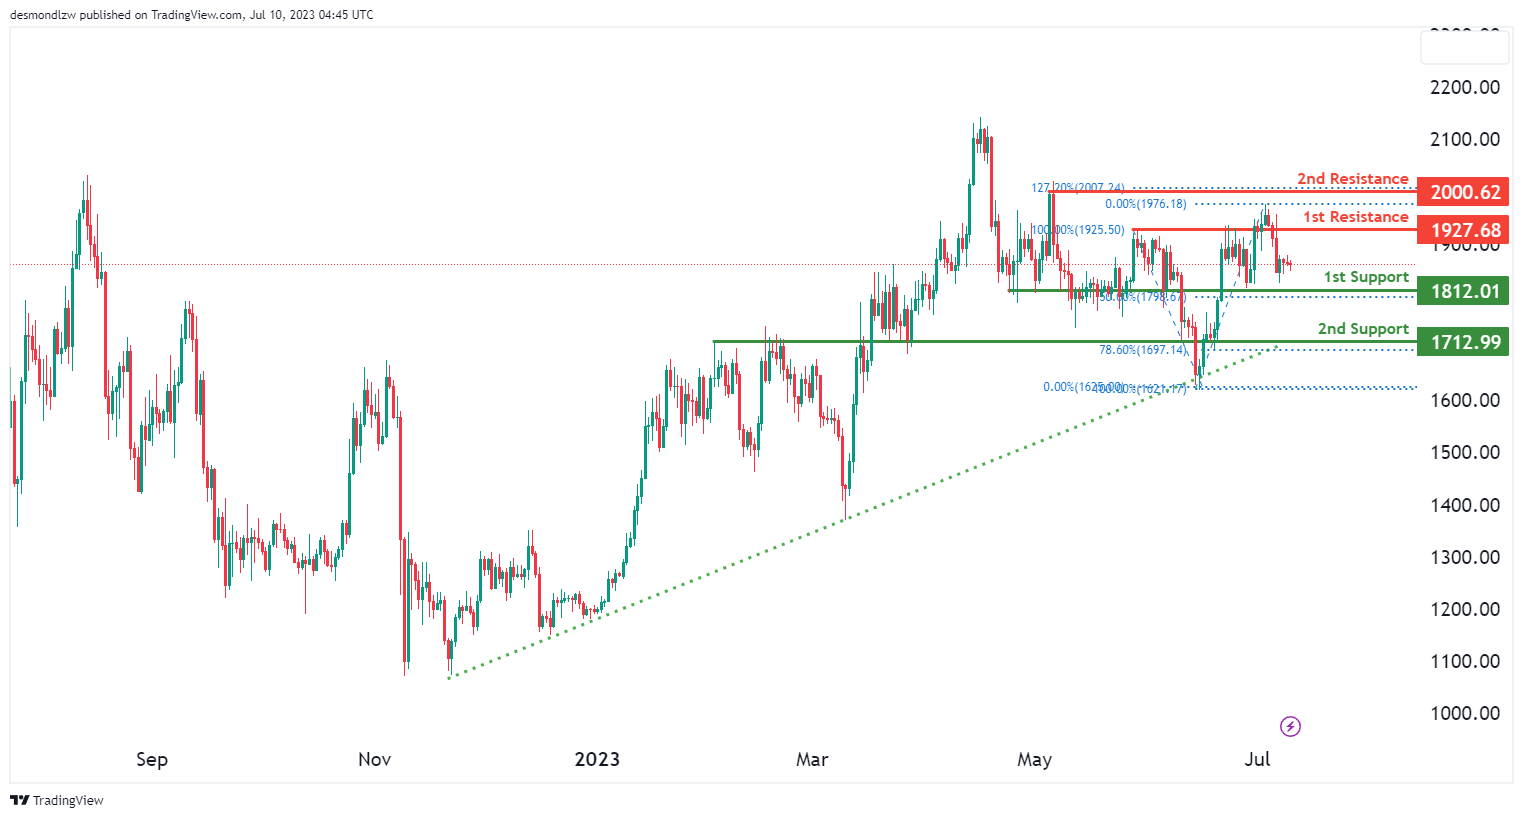
The ETH/USD (Ethereum) chart is currently displaying a weak bullish overall momentum with low confidence. In the short term, the price might potentially drop further to the 1st support at 1812.01 before bouncing from there and rising towards the 1st resistance. This support level is considered strong due to an overlap support and a 50% Fibonacci Retracement.
Furthermore, the 2nd support level, found at 1712.99, is viewed as robust due to an overlap support and a 78.60% Fibonacci Retracement.
On the other hand, the 1st resistance level is situated at 1927.68 and is deemed significant because of an overlap resistance. Lastly, the 2nd resistance stands at 2000.62, recognized as a swing high resistance and a 127.20% Fibonacci Extension, potentially posing a significant barrier to the price’s upward movement.
WTI/USD:
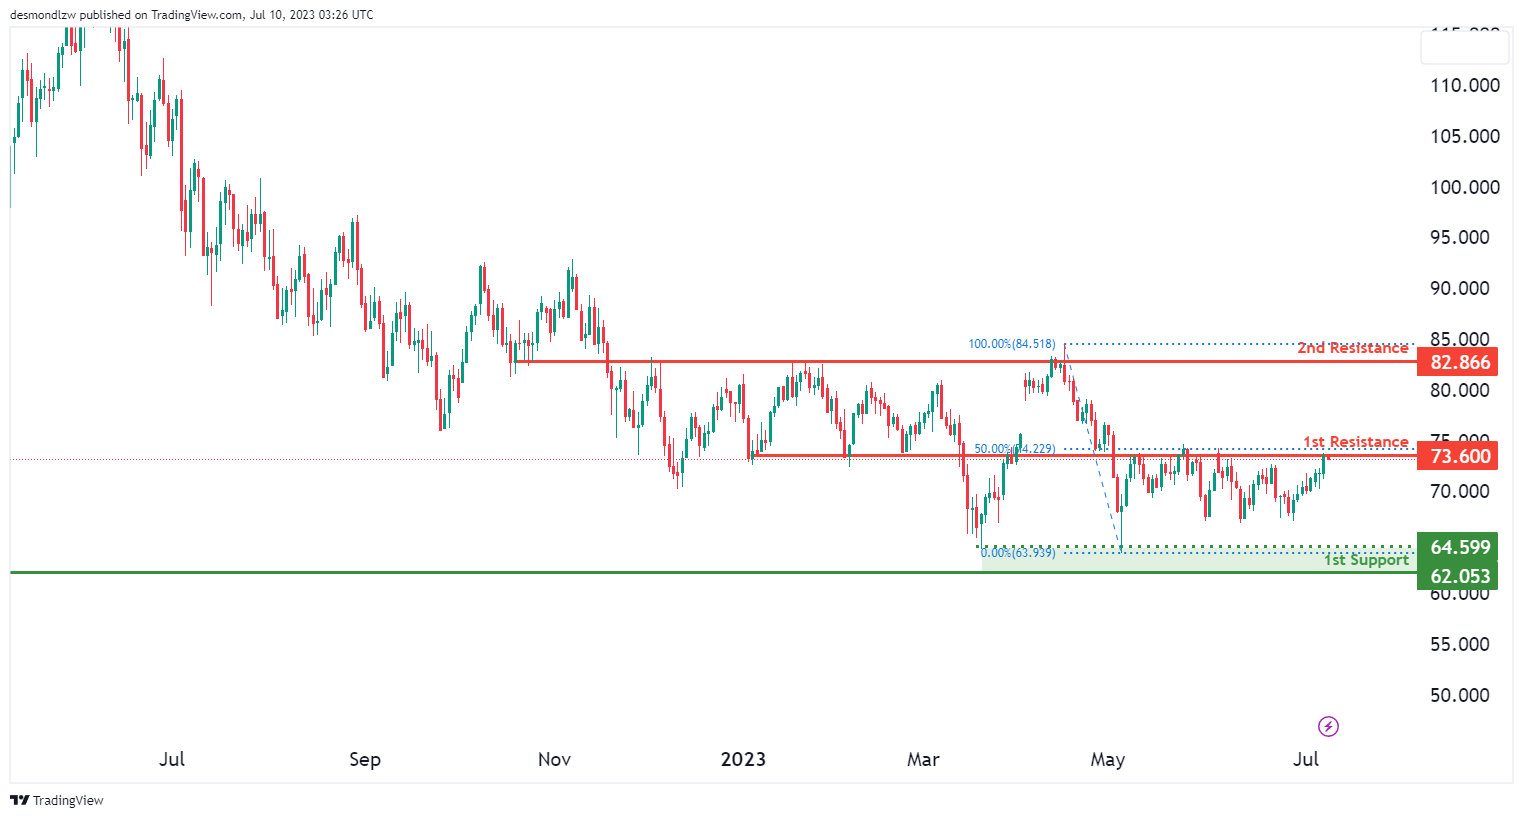
The WTI/USD (West Texas Intermediate crude oil) chart currently displays a weak bearish momentum with low confidence, suggesting a potential for a bearish reaction off the first resistance level.
A possible bearish reaction is possible as the price approaches the first resistance level at 73.60. This level is identified as an overlap resistance level that aligns with a 50% Fibonacci Retracement level, further reinforcing its significance as a potential turning point for the price. Furthermore, the second resistance level at 82.87 is considered a notable overlap resistance.
On the downside, in the event of a bearish reaction, there is an intermediate support level at 64.60. This level is identified as an overlap support and is expected to provide some temporary stabilisation to the price if it drops from the first resistance level. Furthermore, the first support level at 62.05 is considered significant as it represents an overlap support.
XAU/USD (GOLD):
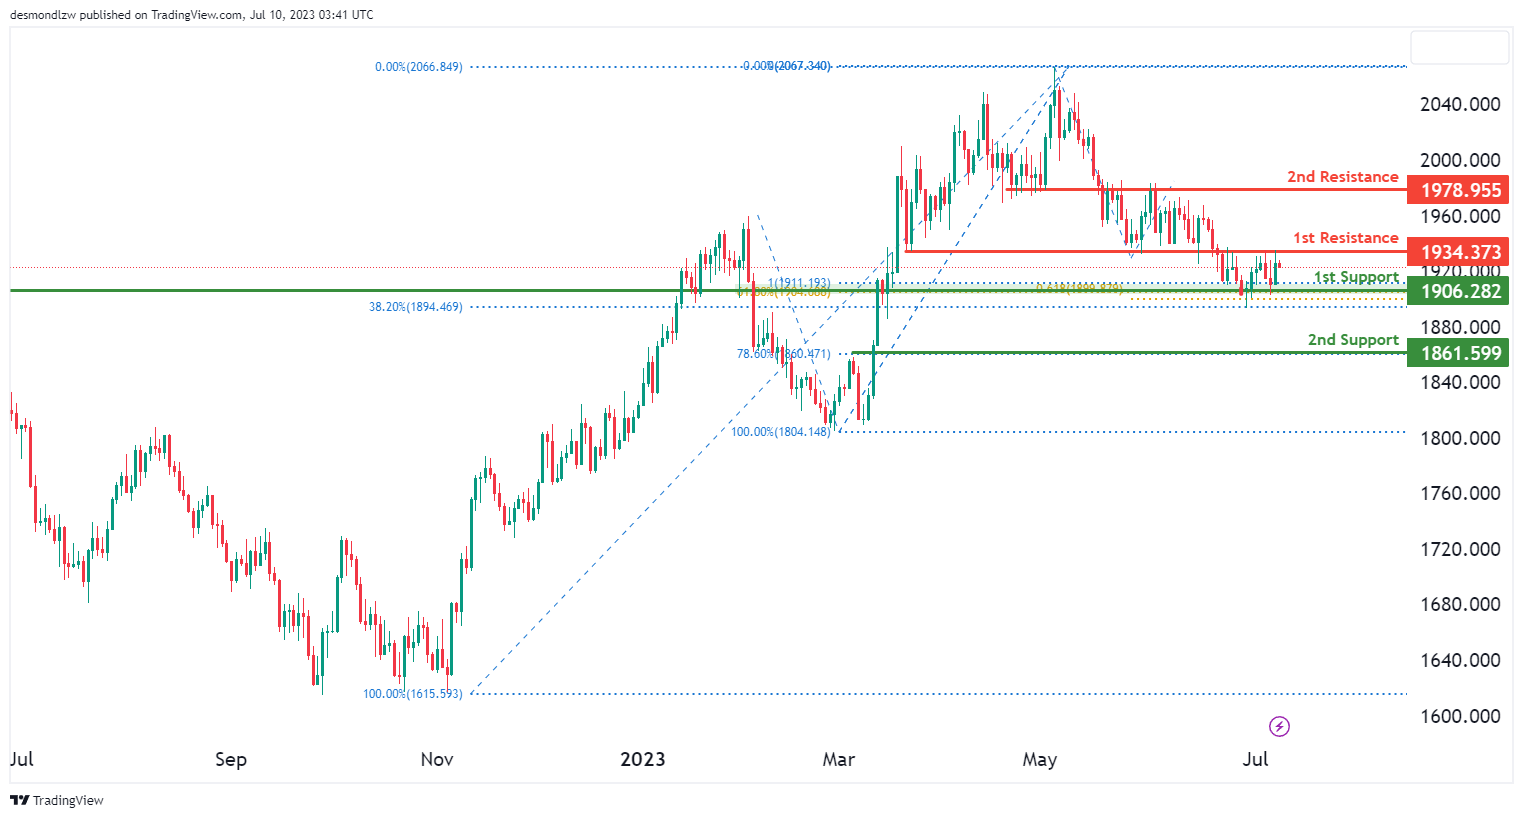
The XAU/USD (Gold) chart currently exhibits a neutral momentum, indicating a lack of clear direction in the market. During this phase, there is a potential for price to fluctuate within a certain range, bounded by the first support and first resistance levels.
The first support level at 1906.28 is considered significant as it represents an overlap support that aligns with a confluence of Fibonacci retracement and projection levels, specifically the 61.80% and 38.20% Fibonacci retracement levels, as well as the 61.8% Fibonacci projection level. This confluence adds to the significance of the support level, increasing the likelihood of it providing a solid base for the price. The second support level at 1861.60 is a support level that aligns with the 78.6% Fibonacci Retracement level.
On the upside, the first resistance level at 1934.37 is identified as an overlap resistance. Additionally, the second resistance level at 1978.96 is considered an additional overlap resistance, adding to the significance of potential resistance in the market.
Chinese Deflation
Asia began the trading week digesting the news of a softer-than-expected NFP read, faster-than-expected wages growth in the US, combined with deflation in Chinese consumer and producer prices.
Lower job additions came as a relief for Fed watchers on Friday, but the wages grew faster than expected, and the unemployment rate fell slightly to 3.6%. All in all, the US jobs data was still hot, and backed the Federal Reserve’s (Fed) campaign of policy tightening with further rate hikes. This being said, the US 2-year yield slipped below 5%, the 10-year yield consolidated above 4%, as the US dollar index was sold off aggressively below the 50 and 100-DMAs.
Due Wednesday, US inflation is expected to have fallen from 4% to around 3% in June, with a possibly uptick in the monthly data. But core inflation could prove stickier at around the 5% mark. In all cases, softening, and ideally softer-than-expected inflation figures carry the potential of pushing the Fed hawks back. That could give quick support to the US stocks which ended the first week of July, and the first week of H2, in the negative.
Earnings season
The earnings season kicks off this week with big US bank earnings. JP Morgan, Wells Fargo and Citigroup will be reporting earnings on Friday. Earnings of large banks may have reached their peak last quarter due to several factors. 1: Net interest income is likely to continue declining, 2. credit costs are gradually returning to normal and increasing, and 3. inflation is putting pressure on expenses. Then, banks are preparing for anticipated regulatory changes by increasing their liquidity levels, raising debt capital, and holding back on share repurchases. These actions are negatively affecting earnings per share growth for banks in general and could have a parallel negative impact on stock prices as well.
Also, we now observe steady deposit and loans, and a revenue increase in some US regional banks – which at the current price levels are considered as being undervalued. The major concern is the rising Fed rates that will continue putting pressure on the US banking system. And the regional banks remain the most in danger.
Chinese deflation
The Chinese inflation came in unexpectedly soft in June. Consumer prices fell 0.2% m-o-m, as the decline in producer prices accelerated more than expected to 5.4% y-o-y. The Chinese efforts to boost economy and inflation are not working. That’s maybe why the Chinese regulators chose to ease pressure on their tech giants. Last Friday, the regulators finally ended a yearlong inspection of Alibaba’s Ant Group and said that the tech industry will see ‘normalized supervision’. Alibaba shares jumped 8% in New York last Friday but would that be enough to bring investor confidence back is not sure yet.
The morose Chinese inflation limited appetite in oil this morning in Asia, but the price of a barrel of crude rallied past the $73pb to the 100-DMA last Friday, as the fresh round of production cuts from Ryad and Moscow slowly but surely brought the oil bulls back to the battlefield as long-term supply worries started weighing on mood in the bears’ camp. Trend and momentum indicators are now comfortably bullish, and hint that the rally could extend. The next natural target for the oil bulls is the 200-DMA, which stands near the $77pb level.
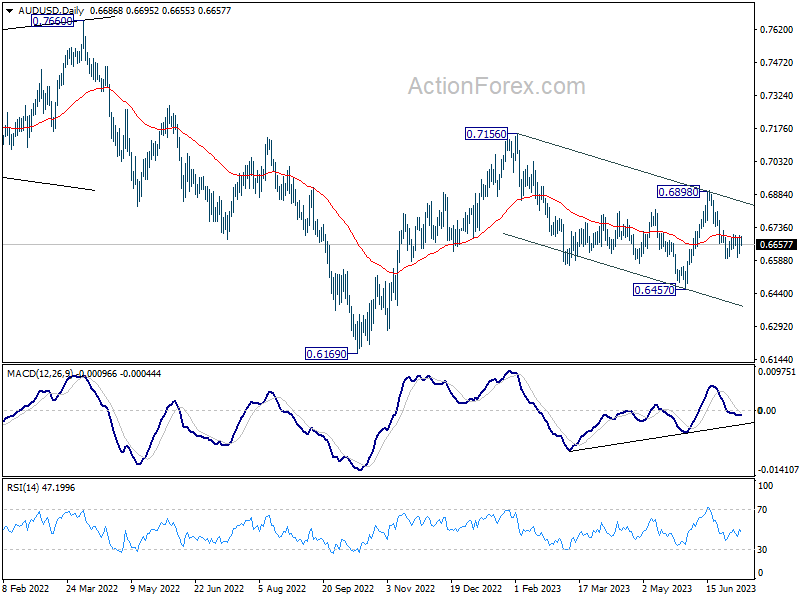
AUD/USD Daily Report
Daily Pivots: (S1) 0.6640; (P) 0.6671; (R1) 0.6723; More...
AUD/USD dips mildly today but stays inside established range above 0.6594. Intraday bias remains neutral for the moment. With 0.6710 resistance intact, further decline is in favor. On the downside, break of 0.6594 will resume the decline from 0.6898 to 0.6457 support next. Nevertheless, firm break of 0.6719 will turn bias back to the upside for stronger rebound.
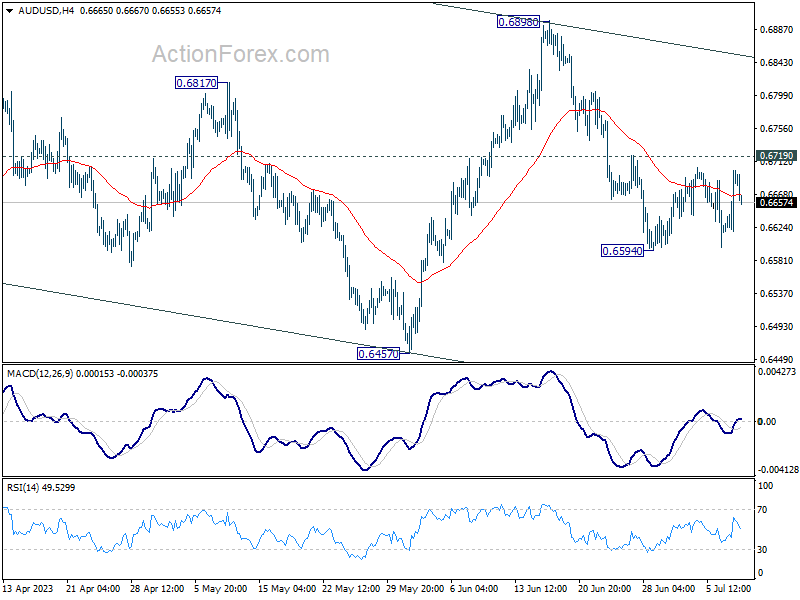
In the bigger picture, price actions from 0.7156 are seen as a correction to the rebound from 0.6169 only, rather than part of larger down trend from 0.8006 (2021 high). Break of 0.6457 could cannot be ruled out but downside should be contained above 0.6169. Meanwhile, nevertheless, break of 0.6898 resistance will argue that rise from 0.6169 is ready to resume through 0.7156.
Mild Dollar Recovery; Mixed Risk Markets; Eyes on RBNZ Hold and BoC Hike
Dollar recovers mildly during today's Asian trading session but remains generally weak. Concurrently, Japanese Yen has begun to pare back some of its late rally from last week, but there is no sign of sustained selling. Risk markets are showing a mixed performance, reacting minimally to China's data that indicate escalating deflation risks.
Notably, the majority of major currency pairs stays bounded within Friday's range, with New Zealand Dollar being an exception. Kiwi appears to be softening slightly as market anticipates RBNZ to maintain its current policy rate later in the week. Conversely, Canadian Dollar is experiencing a slight firming, buoyed by rise in oil prices and anticipated BoC rate hike. Meanwhile, European majors show no clear direction as of now.
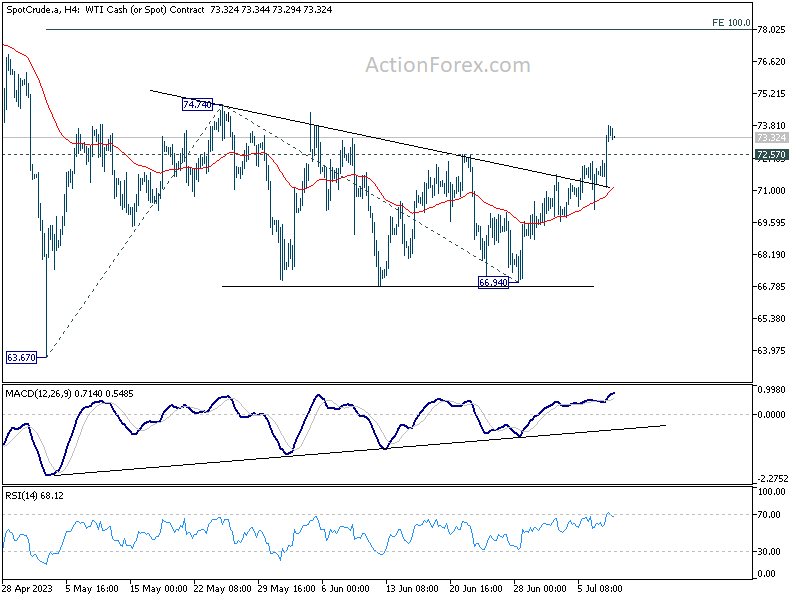
Technically, WTI crude oil's break of 72.57 resistance suggests that triangle consolidation from 74.74 has possibly completed at 66.94 already. Further rise is now in favor to 74.74 resistance first. Firm break there will target 100% projection 63.67 to 74.74 from 66.94 at 78.01. It's too early to talk about larger bullish trend reversal in oil. So, focuses will be on topping signal around 78.01 projection level.
In Asia, at the time of writing, Nikkei is down -0.14%. Hong Kong HSI is up 0.75%. China Shanghai SSE is up 0.15%. Singapore Strait Times is up 0.34%. Japan 10-year JGB yield is up 0.0333 at 0.470.
China's PPI down -5.4% yoy, CPI flat in Jun
China's factory-gate inflation, as measured by PPI, marked its ninth consecutive decline in June, slumping by -5.4% yoy. This drop is the steepest since December 2015 and outstripped -4.6% yoy in May, a well as expectation of -5.0 yoy. PPI fell -0.8% on a month-on-month basis in June, slightly less than the -0.9% mom fall registered in May.
National Bureau of Statistics statistician Dong Lijuan pointed to tumbling commodity prices, particularly oil and coal, as the driving force behind the slump in factory-gate prices. The comparison to high base figures from the previous year also played a role in the significant drop.
Additionally, China's CPI continued to lose momentum, sliding from 0.2% yoy in May to 0.0% yoy in June, its lowest reading since February 2021. This downturn defied expectations of a 0.2% yoy. On a month-on-month basis, June's CPI mirrored the previous month, dipping by -0.2%.
Analysing the CPI's components, core CPI, which excludes volatile food and energy prices, showed a tempered 0.4% yoy rise, compared to 0.6% yoy in May. Food prices accelerated by 2.3% yoya leap from May's 1.0% yoy increase, while non-food prices moved in the opposite direction, falling by -0.6% yoy in contrast to a flat performance in May.
The sustained descent in PPI, coupled with lackluster CPI, underlines the ongoing deflationary pressures in China's economy.
ECB Villeroy said rates nearing a high plateau
Speaking at a conference in Aix-en-Provence, France, ECB Governing Council member Francois Villeroy de Galhau stated that Eurozone was nearing the "high point" of interest rates, a level expected to be sustained to allow full transmission of monetary policy effects.
Villeroy added, "But when I say high point this isn't a peak, rather it will be a high plateau, on which we will have to remain for a sufficiently long time to fully transmit all the effects of monetary policy."
Joining him on the panel was fellow Governing Council member Mario Centeno, who underlined ECB's focus on headline inflation, noting its more rapid than anticipated decrease. However, he also highlighted the importance of core inflation, which he acknowledged was not dropping as swiftly.
Centeno stressed, "We target headline inflation, that's very important. And headline inflation is coming down, actually it's coming down faster than the way up."
Centeno went on to add, "Core inflation stands out as a very important indicator. It's not coming down as fast as headline inflation, but we also need to remember that in the way up it played exactly the same trajectory. So we need to remain confident too in the way we are fighting inflation."
RBNZ to hold steady, BoC to thread forward; US inflation, UK GDP, and more...
This week presents a significant blend of international central bank activities and key economic indicators. On the monetary policy front, the anticipated pause by RBNZ and BoC hike will be complemented by release of Fed's Beige Book and ECB minutes. In addition, the release of inflation data from the US, as well as GDP and employment figures from the UK, will also be integral to the unfolding developments in the markets.
RBNZ is widely anticipated to maintain its interest rates unchanged at 5.50% this week, drawing the curtains on its 20-month tightening cycle. Following its May decision, which saw a 25bps rise in OCR approved by a 5-2 vote, economists interpret the statement as a shift by the central bank into a "wait and see mode." Consensus amongst the country's leading banks - ANZ, ASB, Bank of New Zealand, Kiwibank, and Westpac - aligns with the market's expectation of no rate changes this round. Meanwhile, RBNZ is anticipated to reiterate its reluctance to initiate interest rate cuts any time in the near future.
In contrast, BoC is expected to forge ahead with its recently resumed tightening cycle, hiking interest rates by 25bps to 5.00%. While some analysts forecast a pause post-July, the trajectory beyond remains hazy. The central bank's preferred CPI trim and median still linger at high levels, and the pace at which they'll decelerate is uncertain. As a result, market will keenly parse BoC's guidance for indications of its confidence post-rate hike.
In other central bank activities, ECB will publish accounts of June monetary policy meeting. The details shouldn't deviate from recently repeated messages that another rate hike is there to be delivered this month. The case for September is uncertain and will be data-dependent. Meanwhile, Fed will also release Beige Book economic report.
On the data front, much focus will be on US CPI and PPI, and on whether they would support two or more Fed hikes this year as the "strong majority" of FOMC members anticipated. UK GDP and employment data will prove crucial amidst rising concerns about hard landing due to BoE extension of its tightening efforts to curb inflation. There are talks that BoE rate could hit as high as 7%. Observers are also keeping a keen eye on Germany's ZEW economic sentiment, Australia's Westpac consumer sentiment and NAB business confidence, along with China's CPI and PPI.
Here are some highlights for the week:
- Monday: Japan bank lending, current account; China CPI, PPI; Eurozone investor confidence.
- Tuesday: Australia Westpac consumer sentiment, NAB business confidence; Germany CPI final, ZEW economic sentiment; UK employment.
- Wednesday: RBNZ rate decision; Japan machine orders PPI; US CPI, Fed's Beige Book; BoC rate decision.
- Thursday: New Zealand BNZ manufacturing; China trade balance; UK GDP, production, trade balance; Eurozone industrial production, ECB meeting accounts; US PPI, jobless claims.
- Friday: Swiss PPI; Eurozone trade balance; Canada manufacturing sales; US import prices, U of Michigan sentiment.
AUD/USD Daily Report
Daily Pivots: (S1) 0.6640; (P) 0.6671; (R1) 0.6723; More...
AUD/USD dips mildly today but stays inside established range above 0.6594. Intraday bias remains neutral for the moment. With 0.6710 resistance intact, further decline is in favor. On the downside, break of 0.6594 will resume the decline from 0.6898 to 0.6457 support next. Nevertheless, firm break of 0.6719 will turn bias back to the upside for stronger rebound.
In the bigger picture, price actions from 0.7156 are seen as a correction to the rebound from 0.6169 only, rather than part of larger down trend from 0.8006 (2021 high). Break of 0.6457 could cannot be ruled out but downside should be contained above 0.6169. Meanwhile, nevertheless, break of 0.6898 resistance will argue that rise from 0.6169 is ready to resume through 0.7156.
Economic Indicators Update
| GMT | Ccy | Events | Actual | Forecast | Previous | Revised |
|---|---|---|---|---|---|---|
| 23:50 | JPY | Bank Lending Y/Y Jun | 3.20% | 3.50% | 3.40% | |
| 23:50 | JPY | Current Account (JPY) May | 1.70T | 1.87T | 1.90T | |
| 01:30 | CNY | CPI Y/Y Jun | 0.00% | 0.20% | 0.20% | |
| 01:30 | CNY | PPI Y/Y Jun | -5.40% | -5.00% | -4.60% | |
| 05:00 | JPY | Eco Watchers Survey: Outlook Jun | 53.6 | 54.8 | 55 | |
| 08:30 | EUR | Eurozone Sentix Investor Confidence Jul | -18.9 | -17 | ||
| 12:30 | CAD | Building Permits M/M May | 7.30% | -18.80% | ||
| 14:00 | USD | Wholesale Inventories May F | -0.10% | -0.10% |
China’s PPI down -5.4% yoy, CPI flat in Jun
China's factory-gate inflation, as measured by PPI, marked its ninth consecutive decline in June, slumping by -5.4% yoy. This drop is the steepest since December 2015 and outstripped -4.6% yoy in May, a well as expectation of -5.0 yoy. PPI fell -0.8% on a month-on-month basis in June, slightly less than the -0.9% mom fall registered in May.
National Bureau of Statistics statistician Dong Lijuan pointed to tumbling commodity prices, particularly oil and coal, as the driving force behind the slump in factory-gate prices. The comparison to high base figures from the previous year also played a role in the significant drop.
Additionally, China's CPI continued to lose momentum, sliding from 0.2% yoy in May to 0.0% yoy in June, its lowest reading since February 2021. This downturn defied expectations of a 0.2% yoy. On a month-on-month basis, June's CPI mirrored the previous month, dipping by -0.2%.
Analyzing the CPI's components, core CPI, which excludes volatile food and energy prices, showed a tempered 0.4% yoy rise, compared to 0.6% yoy in May. Food prices accelerated by 2.3% yoya leap from May's 1.0% yoy increase, while non-food prices moved in the opposite direction, falling by -0.6% yoy in contrast to a flat performance in May.
The sustained descent in PPI, coupled with lackluster CPI, underlines the ongoing deflationary pressures in China's economy.
ECB Villeroy said rates nearing a high plateau
Speaking at a conference in Aix-en-Provence, France, ECB Governing Council member Francois Villeroy de Galhau stated that Eurozone was nearing the "high point" of interest rates, a level expected to be sustained to allow full transmission of monetary policy effects.
Villeroy added, "But when I say high point this isn't a peak, rather it will be a high plateau, on which we will have to remain for a sufficiently long time to fully transmit all the effects of monetary policy."
Joining him on the panel was fellow Governing Council member Mario Centeno, who underlined ECB's focus on headline inflation, noting its more rapid than anticipated decrease. However, he also highlighted the importance of core inflation, which he acknowledged was not dropping as swiftly.
Centeno stressed, "We target headline inflation, that's very important. And headline inflation is coming down, actually it's coming down faster than the way up."
Centeno went on to add, "Core inflation stands out as a very important indicator. It's not coming down as fast as headline inflation, but we also need to remember that in the way up it played exactly the same trajectory. So we need to remain confident too in the way we are fighting inflation."
EUR/USD Resumes Increase and Eyes Fresh Monthly High
Key Highlights
- EUR/USD started a fresh increase from the 1.0835 support.
- It broke a major bearish trend line with resistance near 1.0890 on the 4-hour chart.
- GBP/USD also started a fresh increase and climbed above 1.2780.
- Crude oil prices are rising above the key $72.50 resistance.
EUR/USD Technical Analysis
The Euro found support near the 1.0835 zone against the US Dollar. EUR/USD remained stable and started a fresh increase above the 1.0865 resistance.

Looking at the 4-hour chart, the pair broke a major bearish trend line with resistance near 1.0890. The pair settled above the 1.0920 resistance, the 200 simple moving average (green, 4 hours), and the 100 simple moving average (red, 4 hours).
There was a clear move above the 61.8% Fib retracement level of the downward move from the 1.1012 swing high to the 1.0835 low.
It is now facing resistance near the 1.1000 level. The next major resistance is near 1.1020. If there is a move above the 1.1020 resistance, the pair could rise toward 1.1080. Any more gains might send the pair toward the 1.1120 level.
Immediate support is near the 1.0920 zone or the 100 simple moving average (red, 4 hours). The next major support is near the 1.0880 level.
If there is a downside break below the 1.0880 support, the pair could decline toward the 1.0850 level. The main support is still near 1.0835.
Looking at GBP/USD, the pair started a strong increase and was able to clear a major hurdle near the 1.2780 level.
Economic Releases
- US Wholesale Inventories for May 2023 – Forecast +0.1%, versus -0.1% previous.