Sample Category Title
EUR/CHF Daily Outlook
Daily Pivots: (S1) 0.9740; (P) 0.9750; (R1) 0.9763; More...
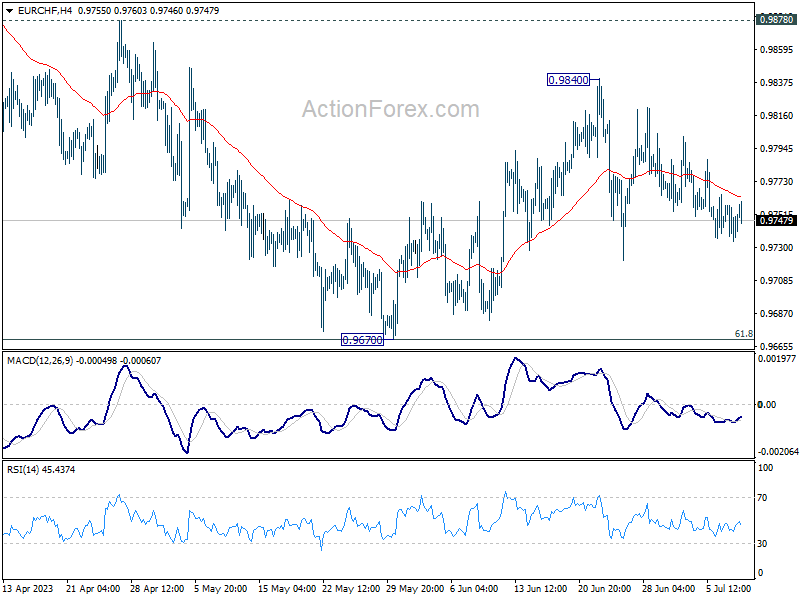
Intraday bias in EUR/CHF remains neutral as range trading continues. On the upside break of 0.9840 will resume the rebound from 0.9670. That will also revive the case that whole corrective decline from 1.0095 has completed at 0.9670. Further rally should be seen to 0.9878 resistance next. However, sustained trading below 0.9670 will resume the whole fall from 1.0095.
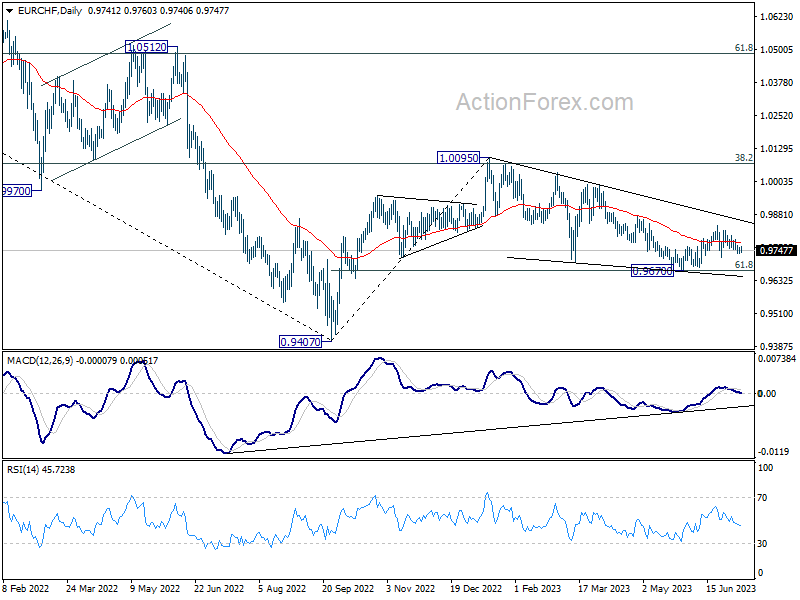
In the bigger picture, medium term outlook is staying bearish as the pair is capped below falling 55 W EMA (now at 0.9913). Down trend form 1.2004 (2018 high) is in favor to extend through 0.9407 at a later stage. Nevertheless, decisive break of 38.2% retracement of 1.1149 to 0.9407 will raise the chance of bullish trend reversal.
EURCHF Hovers at Lower Part of Prevailing Rectangle
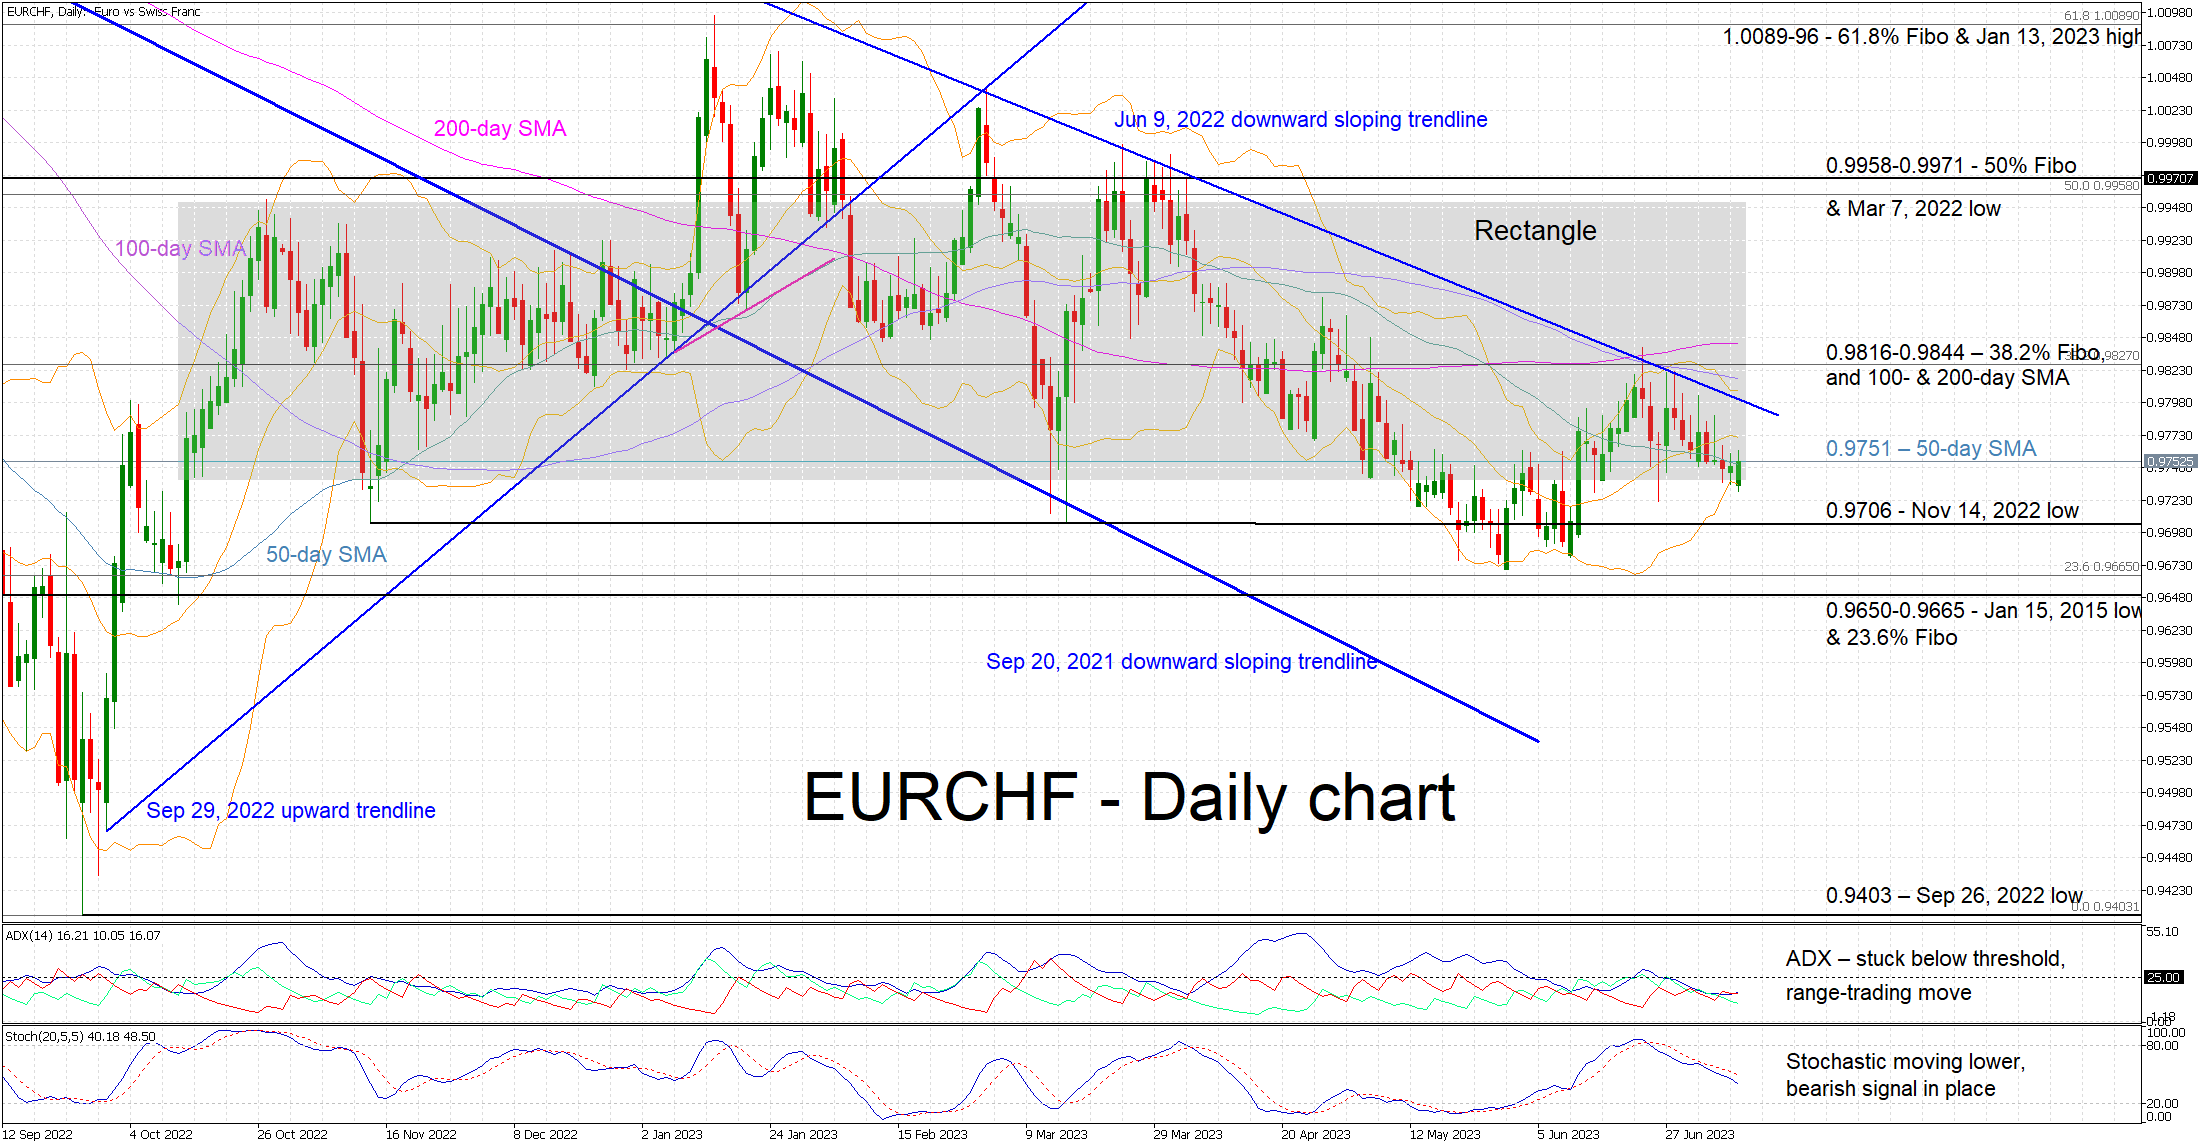
EURCHF is edging higher today, battling again with the lower boundary of the rectangle that has been defining the price action since October 13, 2022. The bears remain firmly in control, but they probably have to deliver a sizeable sell-off soon before the market starts to seriously question their determination.
Supporting the bears’ intentions, the stochastic oscillator is still reflecting a bearish tendency in the market. The same cannot be said for the Average Directional Movement Index (ADX) that remains stuck below its 25-threshold and thus signaling a range-trading market. More interestingly, the persistent convergence of the 100- and 200-day simple moving averages (SMAs) is usually associated with an imminent move, but it also reveals a frail balance between market participants.
Should the bears decide to stage another breakout, they first have to break the 50-day SMA at 0.9751. They could then revisit the lower boundary of the rectangle and test the support set by the November 14, 2022 low at 0.9706. But the real target remains the 0.9650-0.9665 range that eluded them at the May 30 drop.
On the flip side, if the bulls decide to push the market higher, they would have to overcome the key June 9, 2022 downward sloping trendline and the much talked-about 0.9816-0.9844 area. This is occupied by the 100- and 200-day simple moving averages (SMAs) and the 38.2% Fibonacci retracement of the June 9, 2022 – September 26, 2022 downtrend respectively. If successful, they could then set their eyes on the upper boundary of the rectangle, a tad below the 0.9958-0.9971 range.
To sum up, EURCHF bears appear ready for another breakout but their ability to deliver such a move is under question.
Gold Consolidates after Failing to Re-enter Range
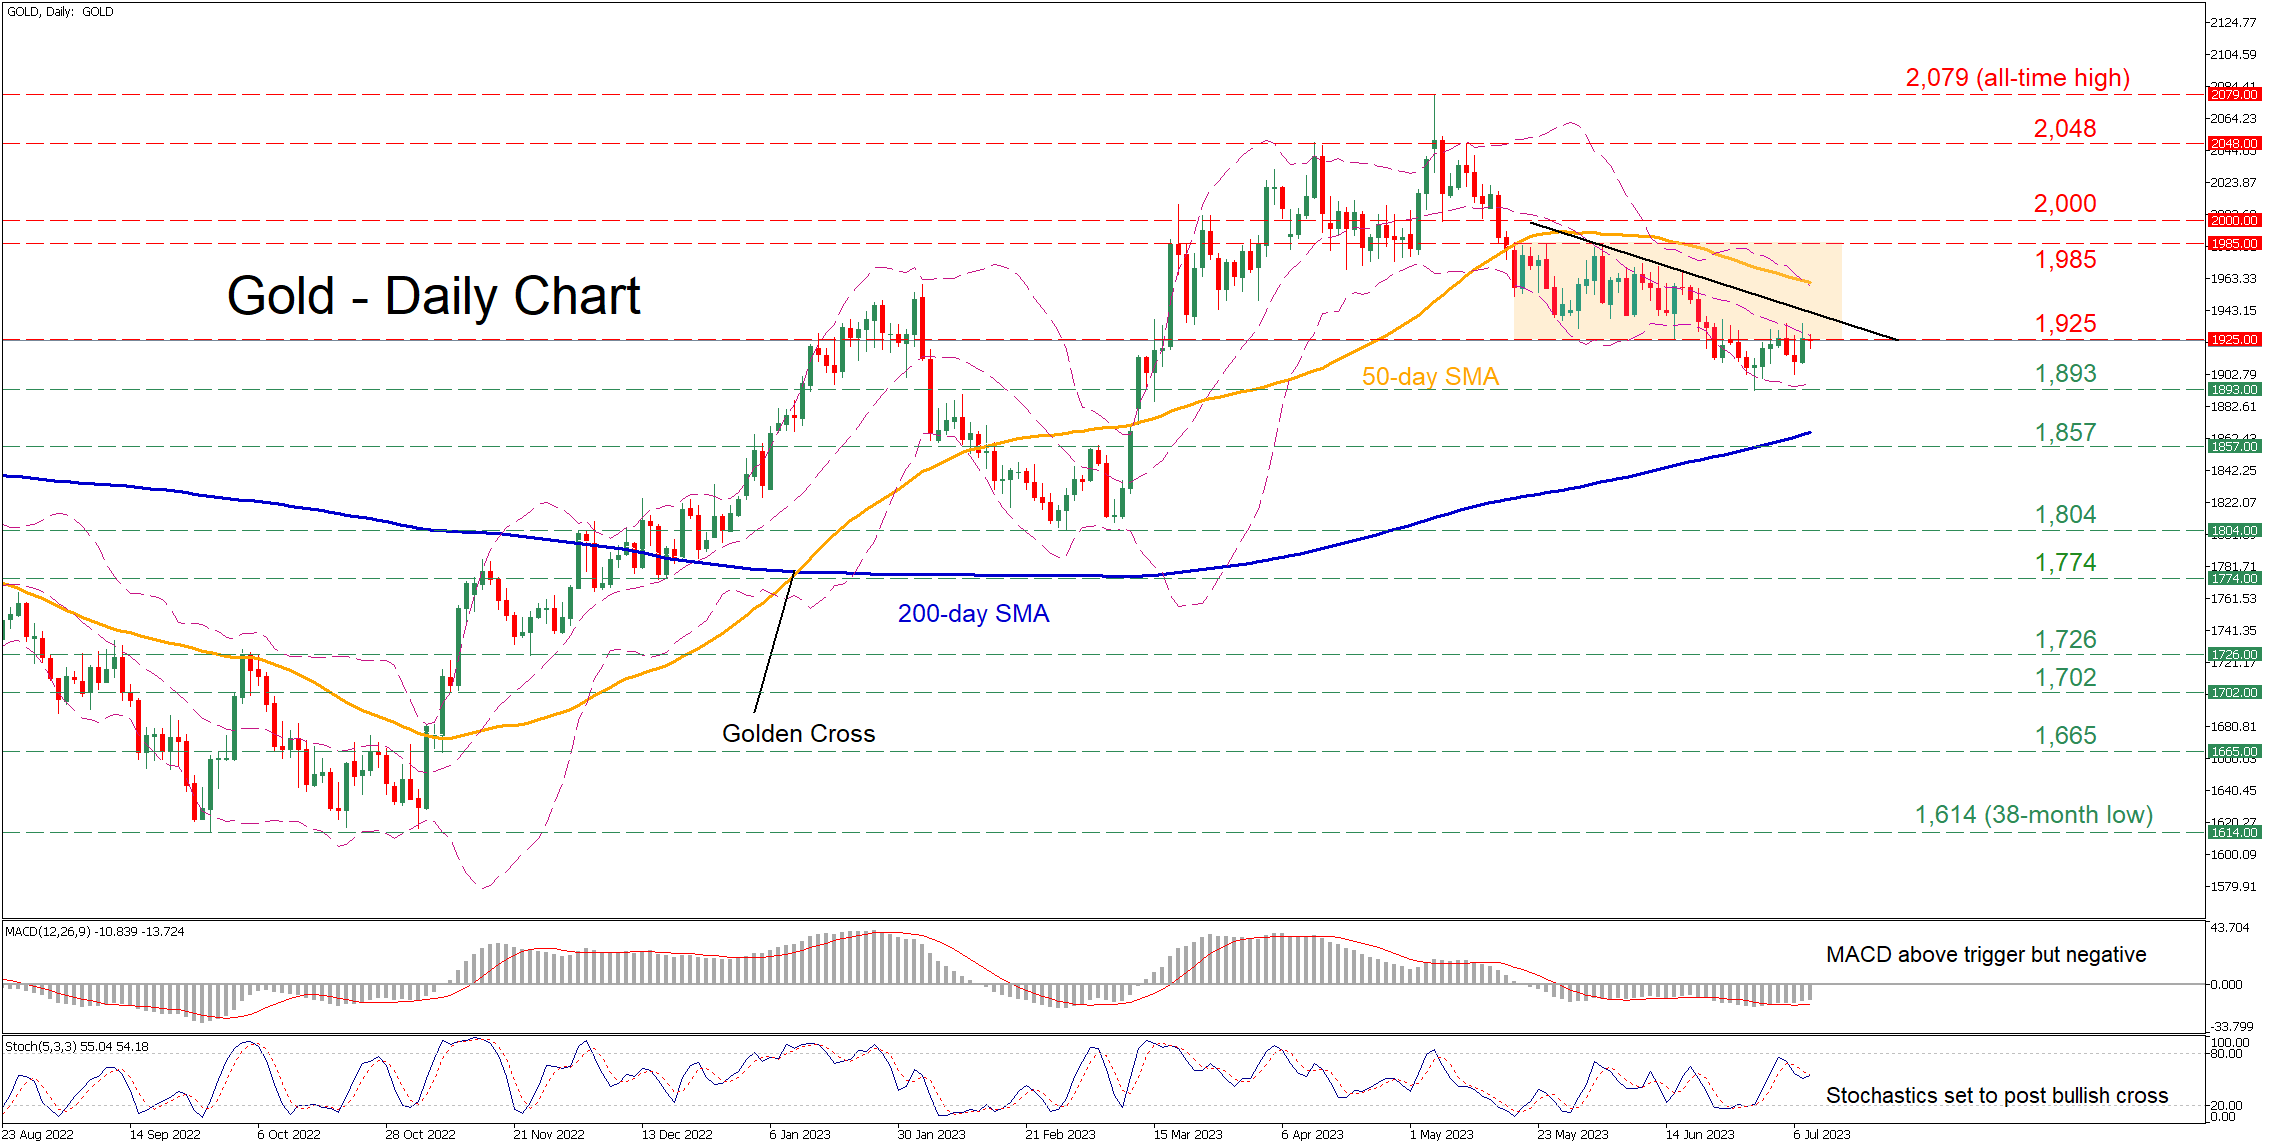
Gold had been moving sideways for more than a month, but the bears managed to push the price below the lower boundary of that range. Even though bullion posted a mild recovery after bouncing off the three-month bottom of 1,893, its attempts to re-enter the neutral pattern have been repeatedly repelled around the 1,925 mark.
The short-term oscillators currently suggest that the positive momentum is picking up, but bearish forces retain the upper hand. Specifically, the MACD crossed above the red signal line in the negative zone, while the stochastic oscillator is set to post a bullish cross.
If bullish pressures persist, the lower end of the rangebound pattern at 1,925 might be the first barrier for the bulls to clear. Piercing above that wall, the price could face the restrictive trendline that connects the recent lower highs before it challenges the upper boundary of the tight range at 1,985. Should that barricade fail, traders could eye the crucial 2,000 psychological mark.
On the flipside, bearish actions could push the price towards the recent three-month low of 1,893. Should that floor collapse, the spotlight could turn to the March resistance of 1,857, which lies very close to the 200-day simple moving average (SMA). A violation of that region could pave the way for the 2023 bottom of 1,804.
Overall, gold seems unable to edge higher after testing multiple times the lower boundary of the rectangle pattern. Hence, a failure to reclaim that crucial territory could trigger a significant retreat.
BoJ upgrades assessment on three regions, all picking or recovering moderately
In the Regional Economic Report released today, BoJ painted an encouraging picture of economic recovery. Despite challenges like past spike in commodity prices. All nine regions "had been either picking up or recovering moderately".
Moreover, three regions - Tokai, Chugoku, and Kyushu-Okinawa - have received upgrades in their economic outlooks, while the views on Hokkaido, Tohok, Hokuriku, Kanto-Koshinetsu, Kinki, and Shikoku remain unchanged.
The report also revealed that numerous regions have seen wage increases across small and mid-sized firms broadening to an extent not witnessed in recent years. However, the future of these wage hikes remains uncertain.
Takeshi Nakajima, BoJ's branch manager overseeing Kansai western Japan region, underscored this ambiguity, stating that it's premature to predict if companies will continue raising wages next year. "A lot of companies in the region say that will depend on this year's earnings and what their rivals could do," Nakajima said during a news conference.
He added, "If companies can earn enough revenues to pay for higher wages, there's hope wage rises will continue. Given uncertainty over the outlook, however, it's premature to say decisively that this will happen."
EUR/USD Daily Outlook
Daily Pivots: (S1) 1.0900; (P) 1.0936; (R1) 1.1006; More...
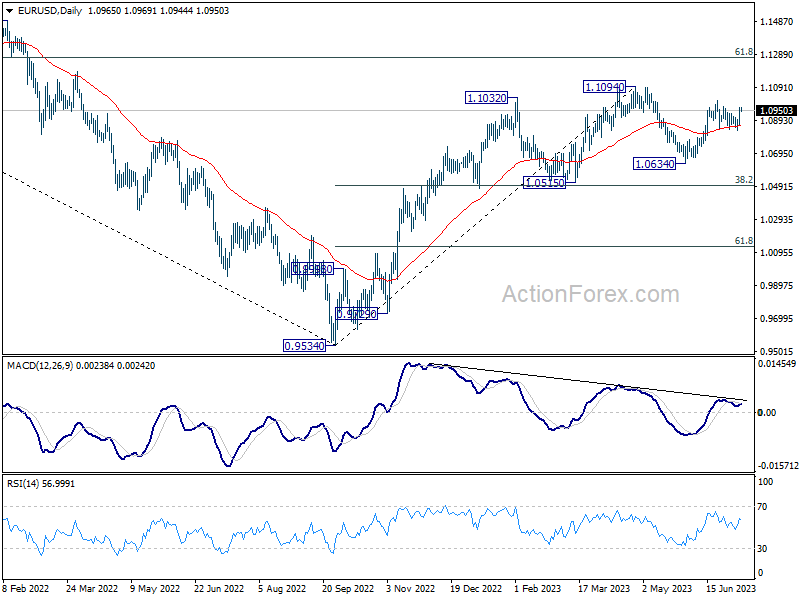
Intraday bias in EUR/USD remains neutral for the moment, and further rally is in favor. On the upside, break of 1.1011 will resume the rise from 1.0634 and target 1.1094 resistance. Decisive break there will resume larger up trend from 0.9534 to 1.1273 fibonacci level. However, firm break of 1.0834 will turn bias to the downside for 1.0634 support instead.
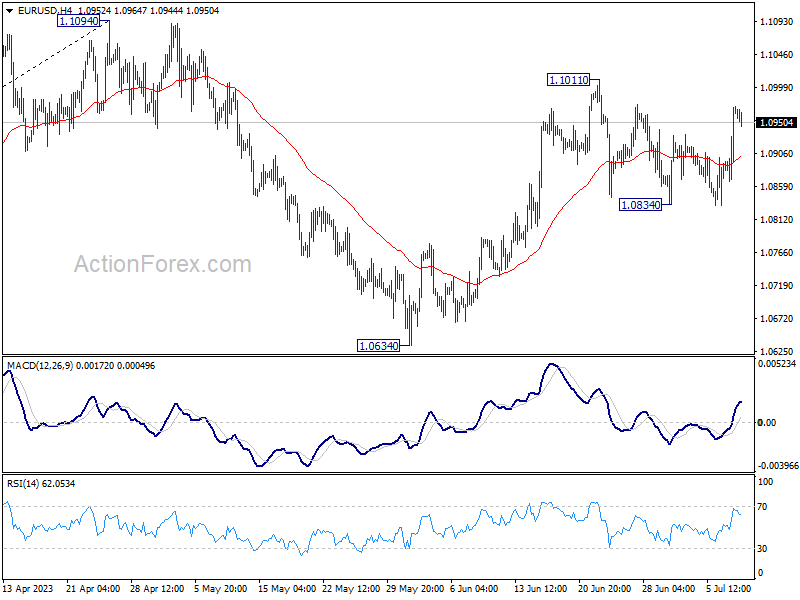
In the bigger picture, as long as 1.0515 support holds, rise from 0.9534 (2022 low) would still extend higher. Sustained break of 61.8% retracement of 1.2348 (2021 high) to 0.9534 at 1.1273 will solidify the case of bullish trend reversal and target 1.2348 resistance next (2021 high).
GBP/USD Daily Outlook
Daily Pivots: (S1) 1.2760; (P) 1.2805; (R1) 1.2883; More...
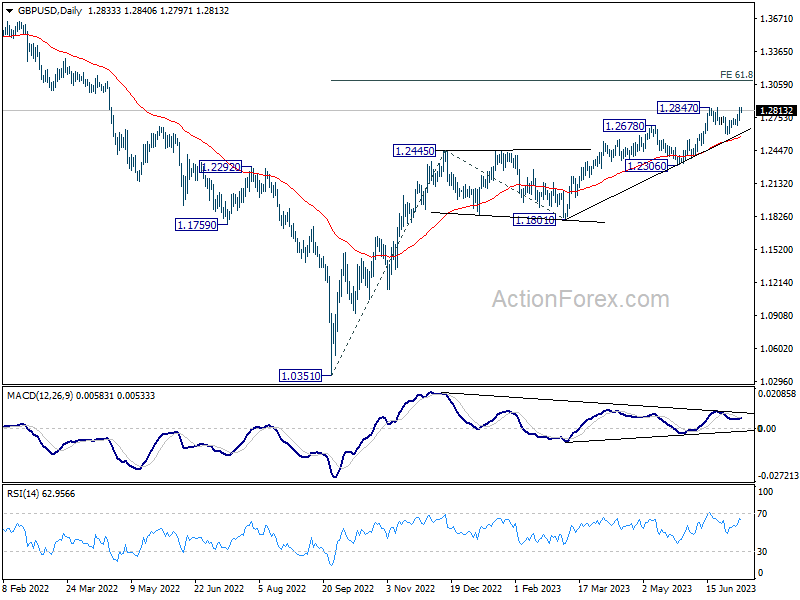
Intraday bias in GBP/USD stays on the upside at this point. Sustained trading above 1.2847 will confirm resumption of larger up trend from 1.0351. Next target is 61.8% projection of 1.0351 to 1.2445 from 1.1801 at 1.3095. On the downside, below 1.2738 minor support will delay the bullish case and turn intraday bias neutral first.
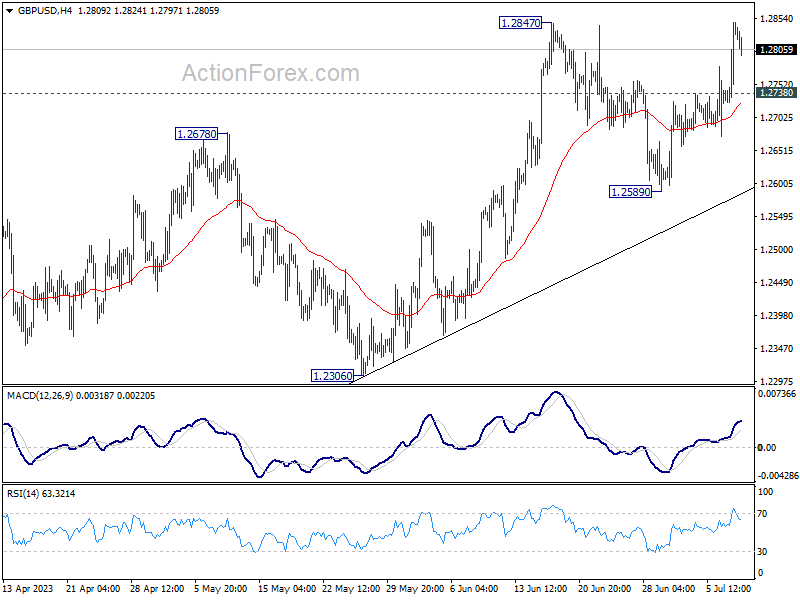
In the bigger picture, the strong support from 55 W EMA (now at 1.2341) is a medium term bullish sign. Outlook will stay bullish as long as 1.2306 support holds. Rise from 1.0351 medium term bottom (2022 low) is expected to extend further to retest 1.4248 key resistance (2021 high).
USD/CHF Daily Outlook
Daily Pivots: (S1) 0.8855; (P) 0.8913; (R1) 0.8949; More...
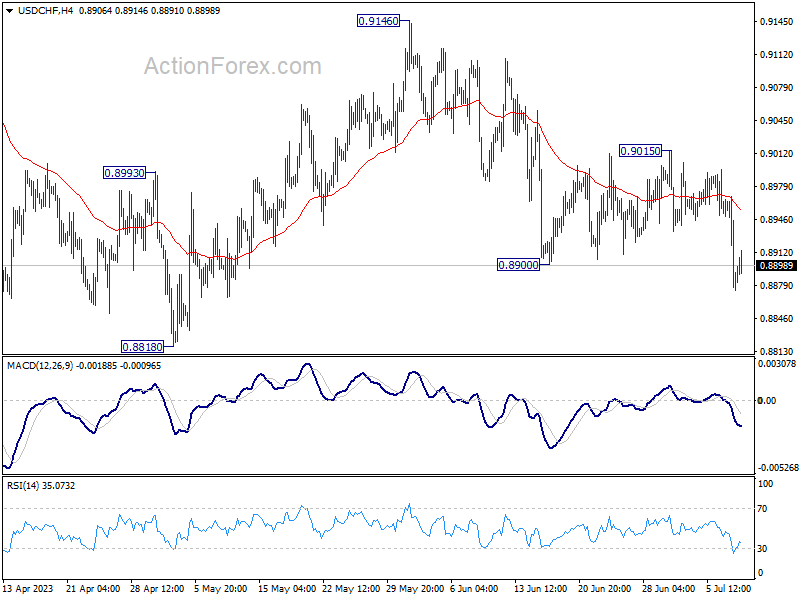
Intraday bias in USD/CHF remains on the downside. Current fall from 0.9146 should target 0.8818 and below, to resume whole down trend from 1.0146. Strong support is expected from 0.8756 to contain downside and bring rebound. Yet, break of 0.9015 resistance is now needed to confirm short term bottoming. Otherwise, outlook will stay bearish.
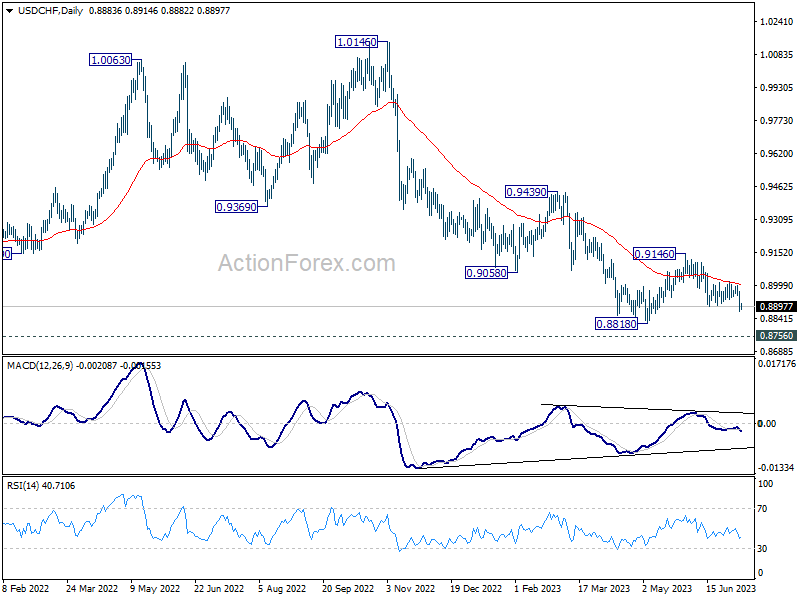
In the bigger picture, fall from 1.1046 (2022 high) is seen as a leg in the long term range pattern from 1.0342 (2016 high). While further decline cannot be ruled out, strong support is expected from 0.8756 long term support to bring reversal. Firm break of 0.9146 resistance should confirm medium term bottoming.
USD/JPY Daily Outlook
Daily Pivots: (S1) 141.42; (P) 142.81; (R1) 143.54; More...
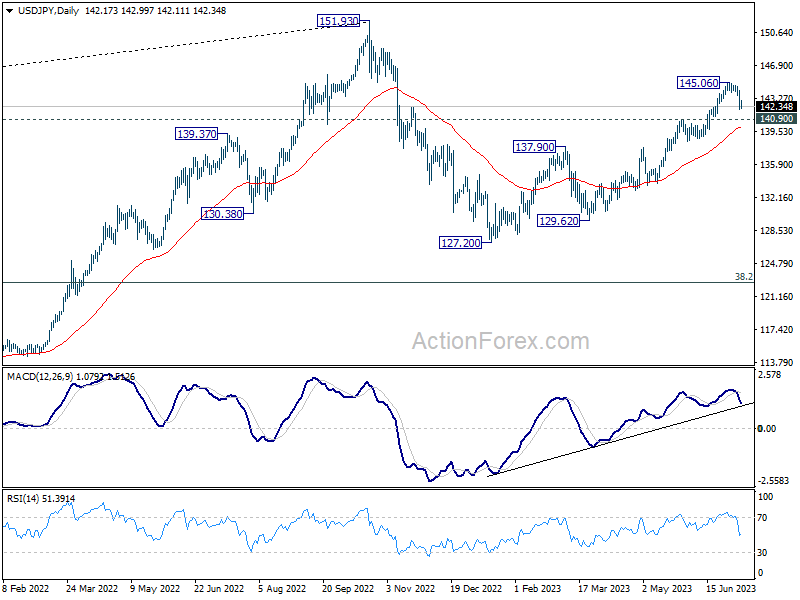
Intraday bias in USD/JPY remains on the downside at this point. Fall from 145.06 short term top should target 140.90 resistance turned support. Firm break there will raise the chance that whole rebound from 127.20 has completed. Deeper decline should then be seen to 137.90 resistance turned support for confirmation. On the upside, above 143.54 minor resistance will turn bias back to the upside for retesting 145.06 instead.
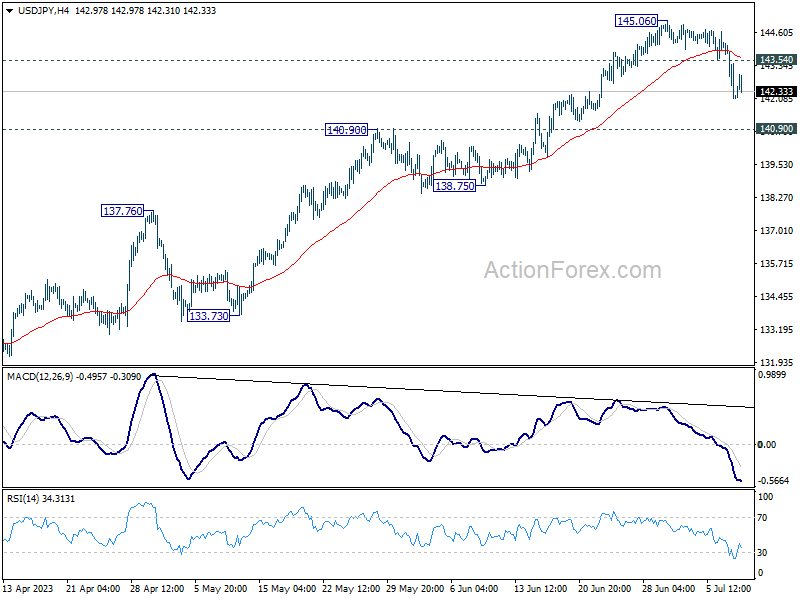
In the bigger picture, rise from 127.20 is seen as the second leg of the corrective pattern from 151.93 high. Further rally could still be seen as long as 137.90 resistance turned support holds, to retest 151.93. But strong resistance should be seen there to limit upside. However, Break of 137.90 will indicate that the third leg has started back towards 127.20.
USD/CAD Daily Outlook
Daily Pivots: (S1) 1.3233; (P) 1.3310; (R1) 1.3354; More....
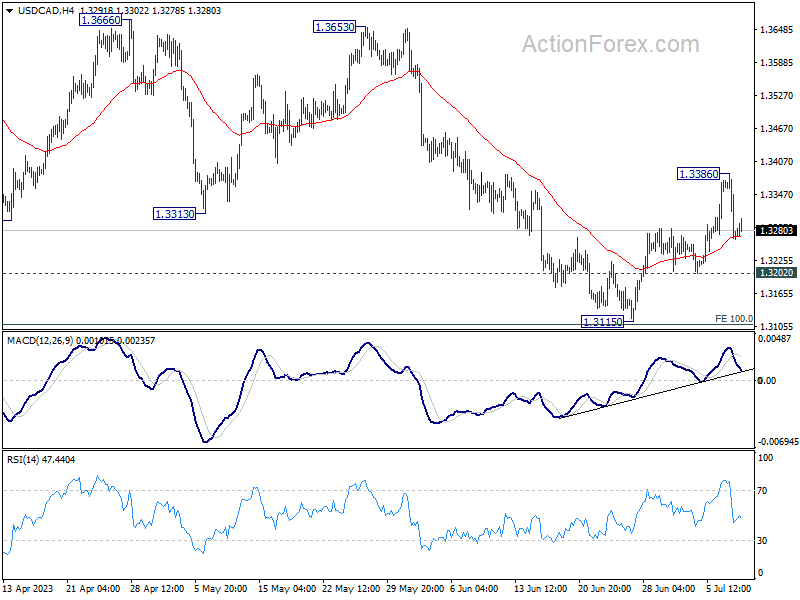
Intraday bias in USD/CAD stays neutral at this point. On the upside, break of 1.3386 and sustained trading above 55 D EMA will argue that whole corrective pattern from 1.3976 has completed with three waves down to 1.3115. Further rally should then be seen to 1.3653 resistance next. Nevertheless, break of 1.3202 support will bring retest of 1.3115 low instead.
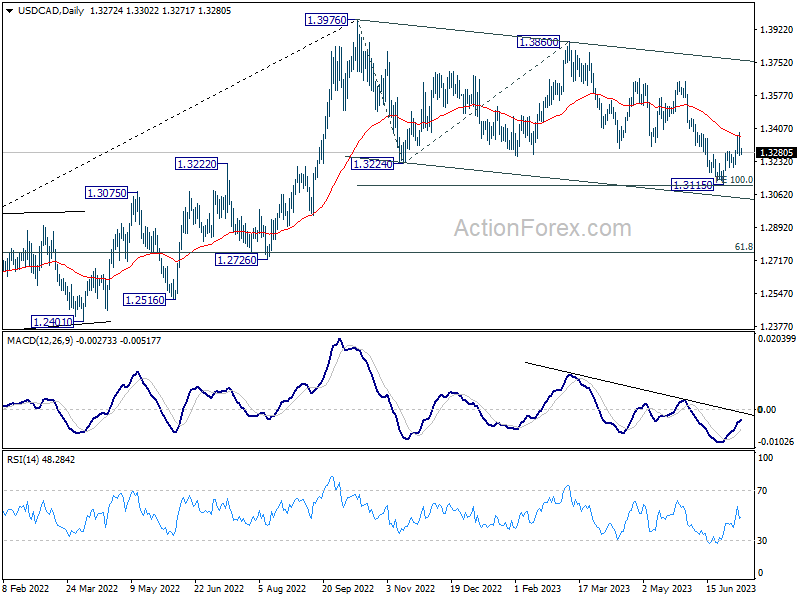
In the bigger picture, price actions from 1.3976 are viewed as a correction to up trend from 1.2005 (2021 low) only. Hence, the up trend is in favor to resume through 1.3976 at a later stage. Nevertheless, another fall below 1.3115 will extending the decline from 1.3976 to 61.8% retracement of 1.2005 to 1.3976 at 1.2758, and raise the chance of bearish trend reversal.
AUD/USD Technical Analysis
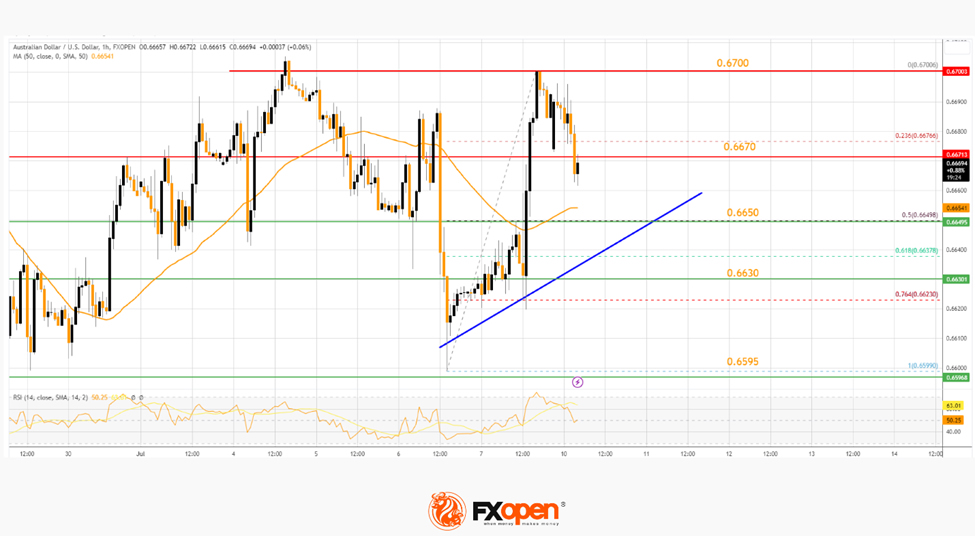
On the hourly chart of AUD/USD at FXOpen, the pair started a fresh increase above the 0.6650 resistance. The Aussie Dollar traded above the 0.6670 resistance before the bears appeared.
The pair tested the 0.6970 zone before there was a bearish reaction. There was a move below the 0.6670 support. However, it is still above the 50-hour simple moving average. There is also a key bullish trend line with support at 0.6650.
If there is a move below the trend line support, the pair could decline toward 0.6630. Any more losses might send the pair toward the 0.6595 support.
On the upside, the first key resistance is near 0.6670. If there is an upside break above the 0.6670 zone, the pair could rise steadily toward the 0.6700 level. Any more gains might send AUD/USD toward 0.6740.