Sample Category Title
GBP/JPY Daily Outlook
Daily Pivots: (S1) 182.69; (P) 183.35; (R1) 184.19; More...
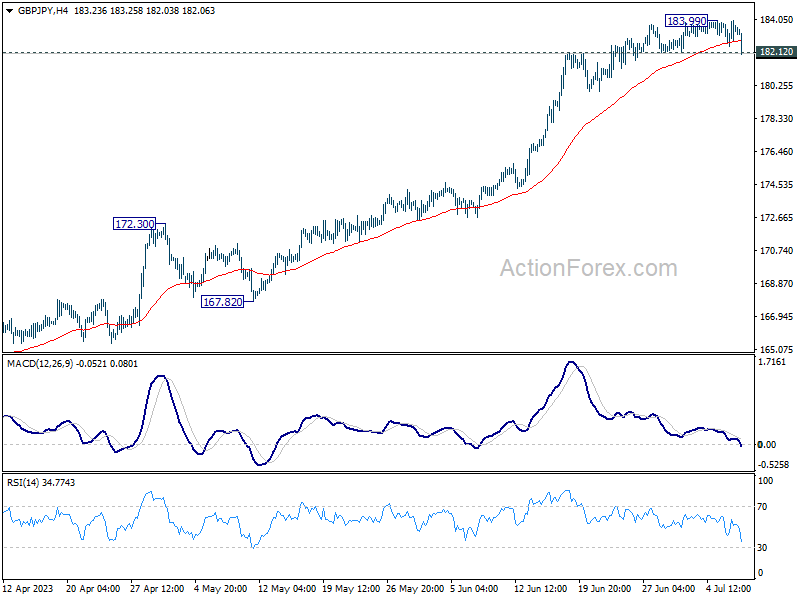
GBP/JPY's correction from 183.99 is extending today. Firm break of 182.12 support will bring deeper fall to 55 D EMW (now at 175.98). But downside should be contained above 172.30 resistance turned support to bring another rally. On the upside, break of 183.99 will resume larger up trend.
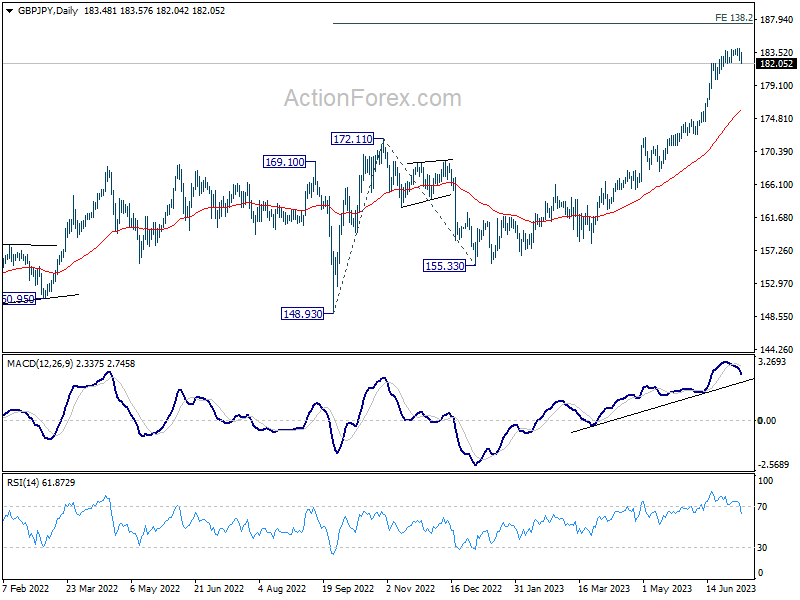
In the bigger picture, up trend from 123.94 (2020 low) is extending. Next target is 195.86 (2015 high). For now, medium term outlook will remain bullish as long as 172.11 resistance turned support holds, even in case of deep pull back.
EUR/JPY Daily Outlook
Daily Pivots: (S1) 156.12; (P) 156.64; (R1) 157.43; More....
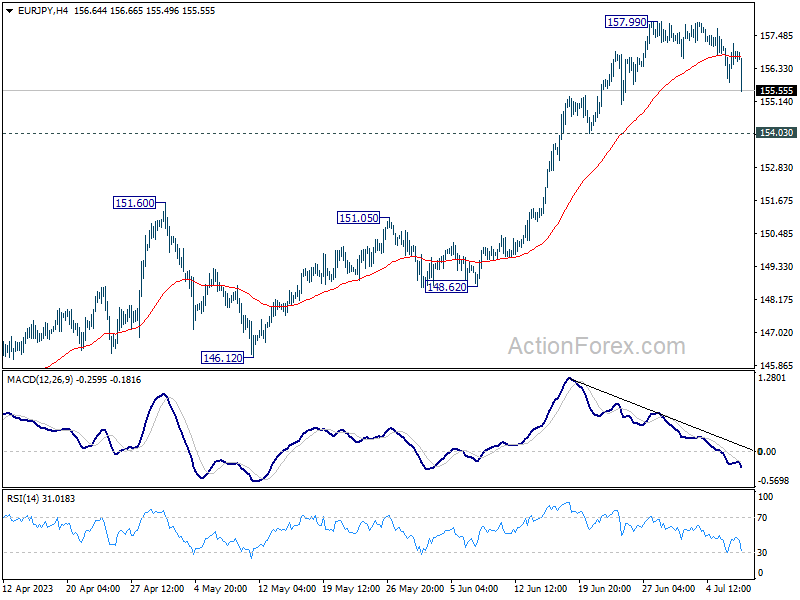
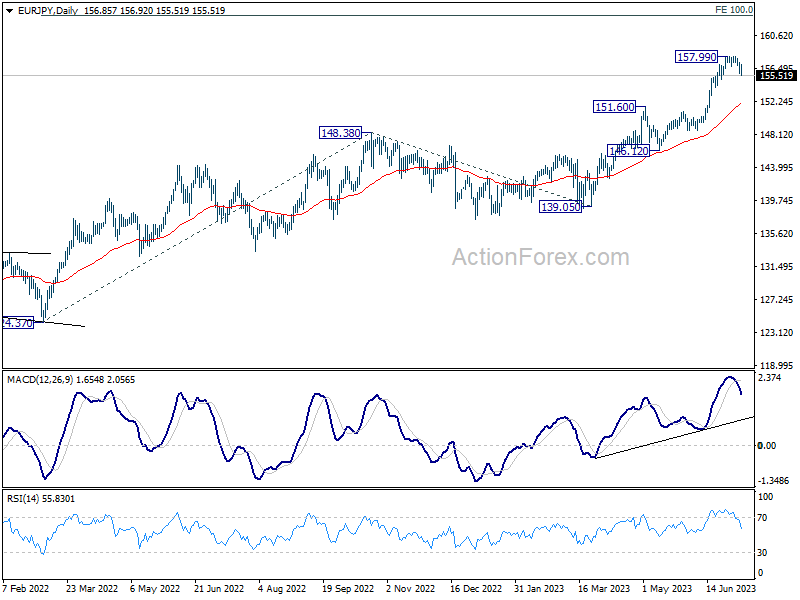
Intraday bias in EUR/JPY remains on the downside as correction from 157.99 is extending to 154.03 support or below. But overall outlook will stay bullish as long as 151.60 resistance turned support holds. Larger rally is still expected to resume through 157.99 after the correction completes.
In the bigger picture, rise from 114.42 (2020 low) is in progress. Next target is 100% projection of 124.37 to 148.38 from 138.81 at 162.82. For now, medium term outlook will remain bullish as long as 151.60 resistance turned support holds, even in case of deep pull back.
EUR/GBP Daily Outlook
Daily Pivots: (S1) 0.8526; (P) 0.8545; (R1) 0.8569; More...
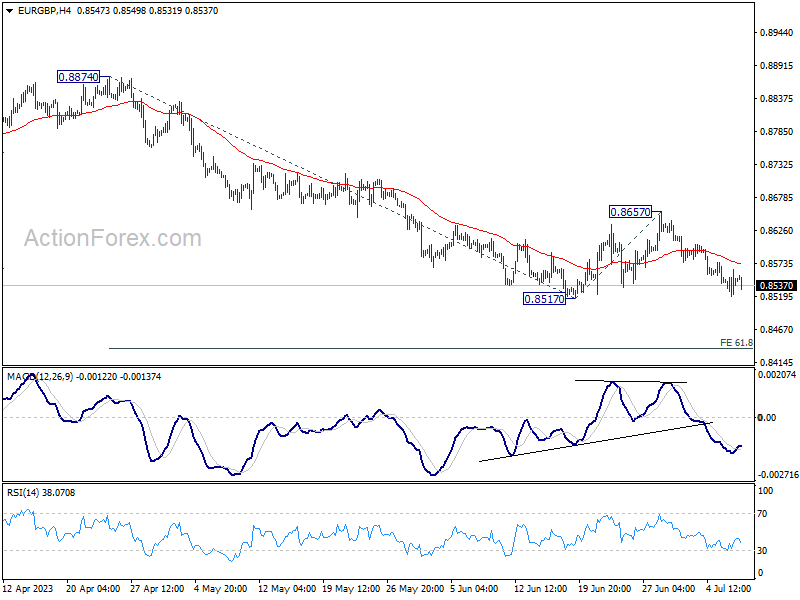
EUR/GBP recovered ahead of 0.8517 support and intraday bias stays neutral. Outlook also remains bearish for deeper decline. Break of 0.8517 will resume the whole decline from 0.8977. Next target will be 61.8% projection of 0.8874 to 0.8517 from 0.8650 at 0.8436. On the upside, above 0.8657 resistance will turn bias to the upside for stronger rebound instead.
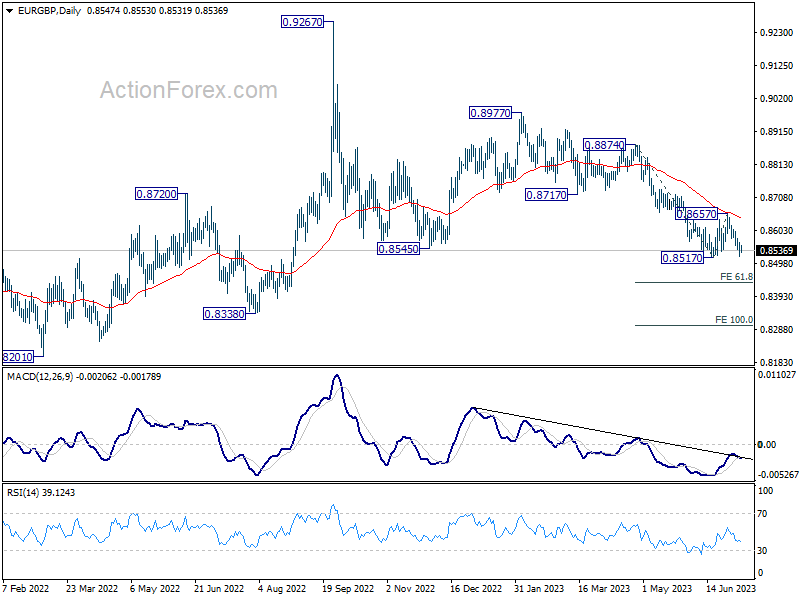
In the bigger picture, the down trend from 0.9267 (2022 high) is still in progress. It's seen as part of the long term range pattern from 0.9499 (2020 high). Deeper fall could be seen towards 0.8201 (2022 low). But strong support should be seen from there to bring reversal. This will now remain the favored case as long as 0.8717 support turned resistance holds.
EUR/AUD Daily Outlook
Daily Pivots: (S1) 1.6313; (P) 1.6377; (R1) 1.6504; More...
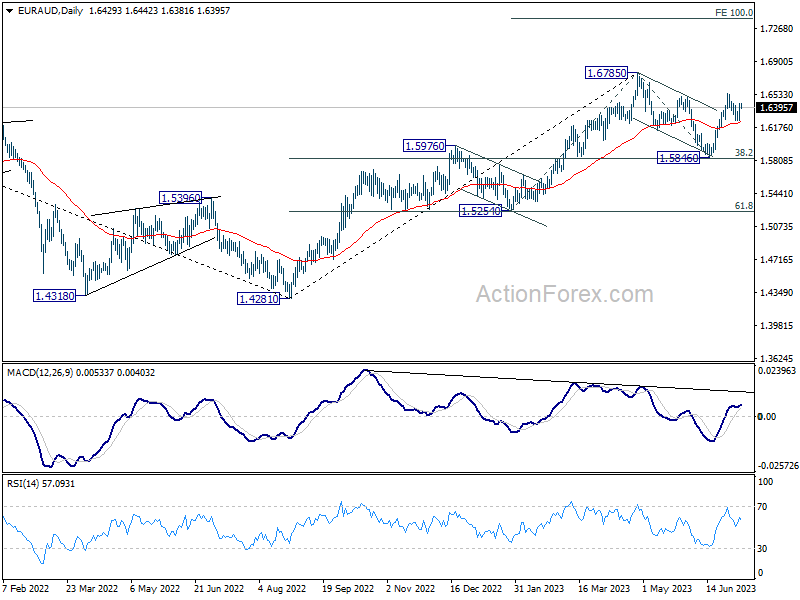
EUR/AUD rebounded after drawing support from 1.6255 but stays below 1.6552 resistance. Intraday bias remains neutral first. Further rally is expected with 1.6255 support intact. As noted before, correction from 1.6785 should have completed with three waves down to 1.5846. Above 1.6552 will target a retest on 1.6785 high next. Nevertheless, on the downside, firm break of 1.6255 will dampen this view and turn bias to the downside for 1.5846 support.
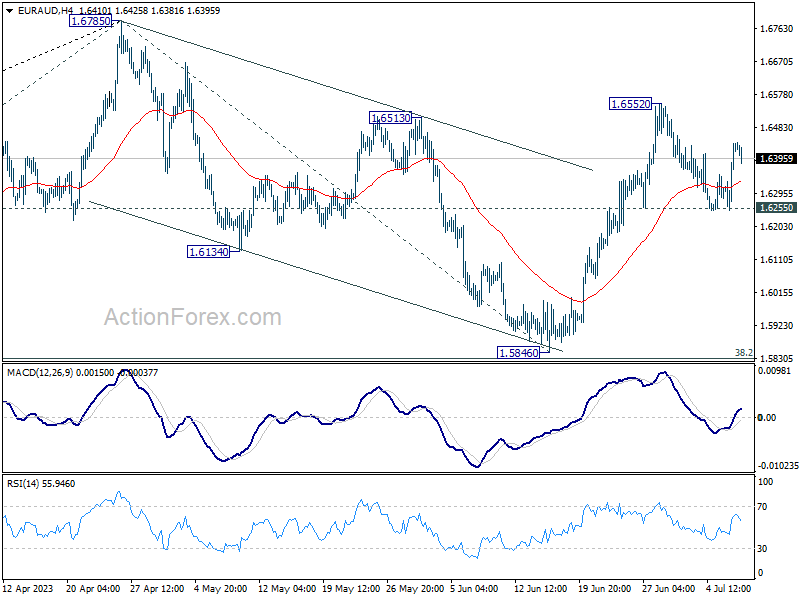
In the bigger picture, with 38.2% retracement of 1.4281 to 1.6785 at 1.5828 intact, rally from 1.4281 is still in progress. Firm break of 1.6785 will confirm rise resumption. Next target is 100% projection of 1.5254 to 1.6785 from 1.5846 at 1.7377. On the other hand, rejection by 1.6785 will extend the corrective pattern with another fall leg. But outlook will stay bullish as long as 1.5828 holds.
EUR/CHF Daily Outlook
Daily Pivots: (S1) 0.9738; (P) 0.9752; (R1) 0.9766; More...
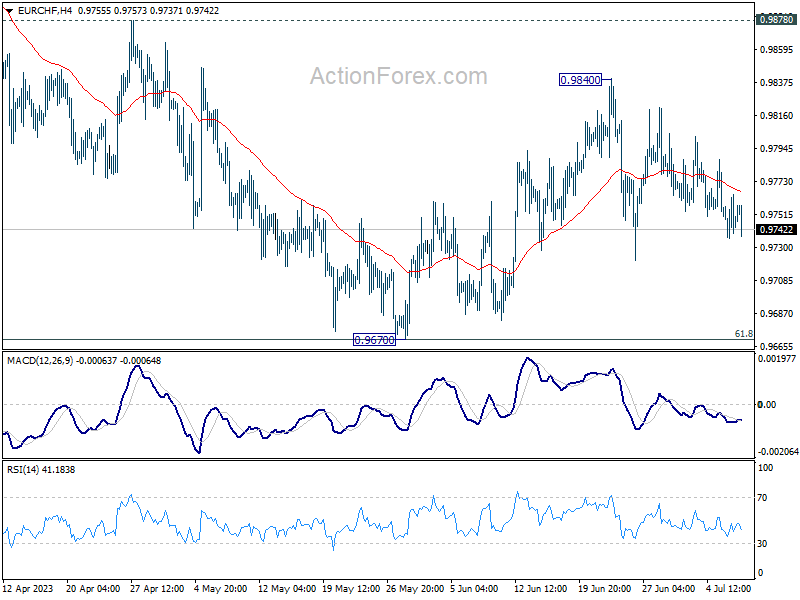
Intraday bias in EUR/CHF stays neutral as recent sideway trading is extending. On the upside break of 0.9840 will resume the choppy rebound from 0.9670. That will also revive the case that whole corrective decline from 1.0095 has completed at 0.9670. Further rally should be seen to 0.9878 resistance next. However, sustained trading below 0.9670 will resume the whole fall from 1.0095.
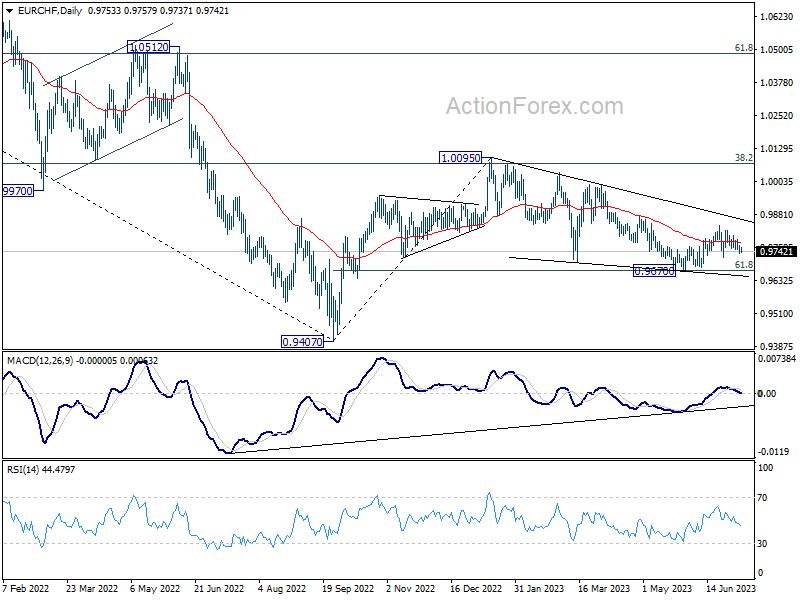
In the bigger picture, medium term outlook is staying bearish as the pair is capped below falling 55 W EMA (now at 0.9913). Down trend form 1.2004 (2018 high) is in favor to extend through 0.9407 at a later stage. Nevertheless, decisive break of 38.2% retracement of 1.1149 to 0.9407 will raise the chance of bullish trend reversal.
ECB Lagarde warns of simultaneous rise in company profits and wages
ECB President Christine Lagarde voiced concerns over lingering inflation risks in a recent interview with Geneviève Van Lède, conducted on July 5.
Lagarde noted that while inflation "has started to decline," it remains "still higher than our medium-term target of 2%," according to the ECB's staff projections. The expectation is for it to remain above target in 2024 and 2025, indicating a continued need to work towards reigning in inflation to meet the target.
On the economic growth front, Lagarde highlighted that growth "has been flat in the last two quarters." However, she added, "We estimate euro area growth to be around 0.9% in 2023." She further asserted that "we should see a return to potential growth over the period 2024-25."
Lagarde also pointed out an interesting development in the context of high inflation. She noted that current period of high inflation did not correspond with a decrease in firms' profit margins; in fact, margins saw an increase in certain instances, especially where demand for goods and services surpassed supply. Simultaneously, wages have experienced an unexpected rise.
In this complex backdrop, Lagarde stressed, "it is important to know whether firms are going to reduce their margins a little to meet their employees' expectations of higher wages and to restore some of their purchasing power," a trend typically seen during past inflation episodes.
Alternatively, there could be a twofold increase in margins and wages. She warned that a simultaneous increase in both would exacerbate inflation risks, cautioning that "we would not stand idly by in the face of such risks."
Gold Price Struggles While Crude Oil Price Aims Higher
Gold price is moving lower below the $1,918 support. Crude oil price is rising as the bulls aim for a move above the $72.20 resistance.
Important Takeaways for Gold and Oil Prices Analysis Today
- Gold price failed to clear the $1,930 resistance and start a fresh decline against the US Dollar.
- A major bearish trend line is forming with resistance near $1,925 on the hourly chart of gold at FXOpen.
- Crude oil prices are also moving higher above the $71.50 resistance zone.
- There is a key bullish trend line forming with support near $70.50 on the hourly chart of XTI/USD at FXOpen.
Gold Price Technical Analysis
On the hourly chart of Gold at FXOpen, the price struggled to start a fresh increase above the $1,930 resistance. The price started a fresh decline below the $1,918 support.
There was a close below the 50-hour simple moving average and $1,912. It tested the $1,910 support zone. A low is formed at $1,902.60 and the price is now consolidating losses above the 23.6% Fib retracement level of the downward move from the $1,927 swing high to the $1,902 low.
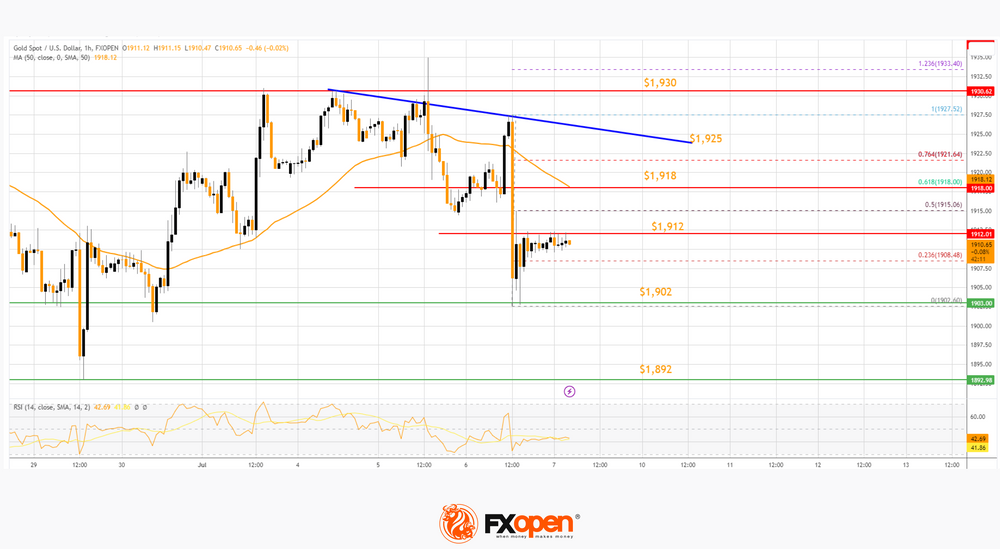
The price is now facing resistance near the $1,912 level. The next major resistance is near the 50-hour simple moving average at $1,918. It is close to the 61.8% Fib retracement level of the downward move from the $1,927 swing high to the $1,902 low.
The main resistance is near a bearish trend line at $1,925 and then $1,930. An upside break above the $1,930 resistance could send Gold price toward $1,938. Any more gains may perhaps set the pace for an increase toward the $1,950 level.
Initial support on the downside is near the $1,902 level. The first major support is near the $1,892 level. If there is a downside break below the $1,892 support, the price might decline further. In the stated case, the price might drop toward the $1,880 support.
Oil Price Technical Analysis
On the hourly chart of WTI Crude Oil at FXOpen, the price remained stable above the $69.50 support against the US Dollar. A base was formed and the price started a decent increase above the $71 level.
There was a clear move above the 50% Fib retracement level of the downward move from the $72.32 swing high to the $70.23 low. It is now trading above the 50-hour simple moving average and the RSI is rising toward 60.
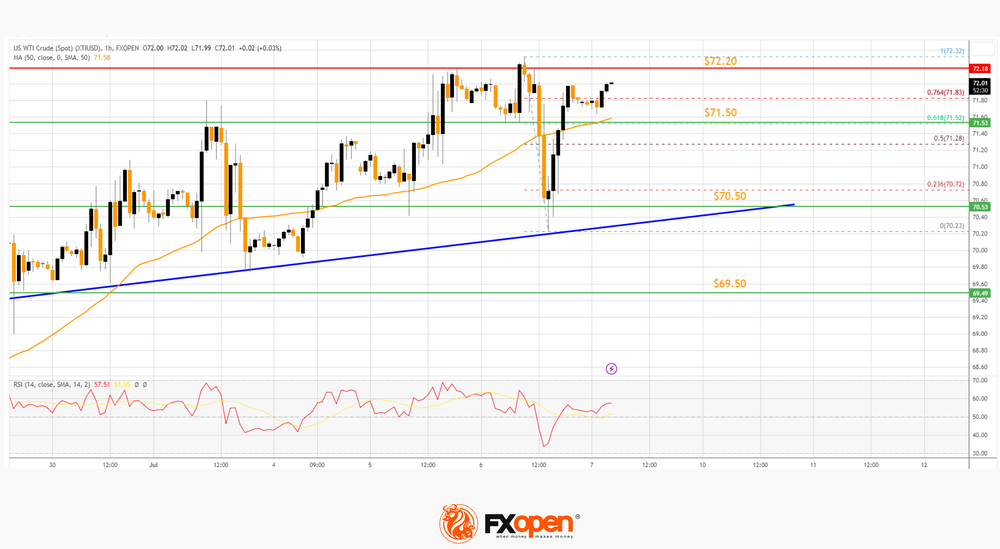
The bulls are showing strength above the 76.4% Fib retracement level of the downward move from the $72.32 swing high to the $70.23 low.
If the price climbs further higher, it could face resistance near $72.20. The first major resistance is near the $72.50 level. Any more gains might send the price toward the $74.00 level in the coming days.
Conversely, the price might correct gains and retest the 50-hour simple moving average at $71.50. The next major support on the WTI crude oil chart is near $70.50 and a connecting bullish trend line. If there is a downside break, the price might decline toward $69.50. Any more losses may perhaps open the doors for a move toward the $68.20 support zone.
Is It Finally Time for a Meaningful Correction in CHFJPY?
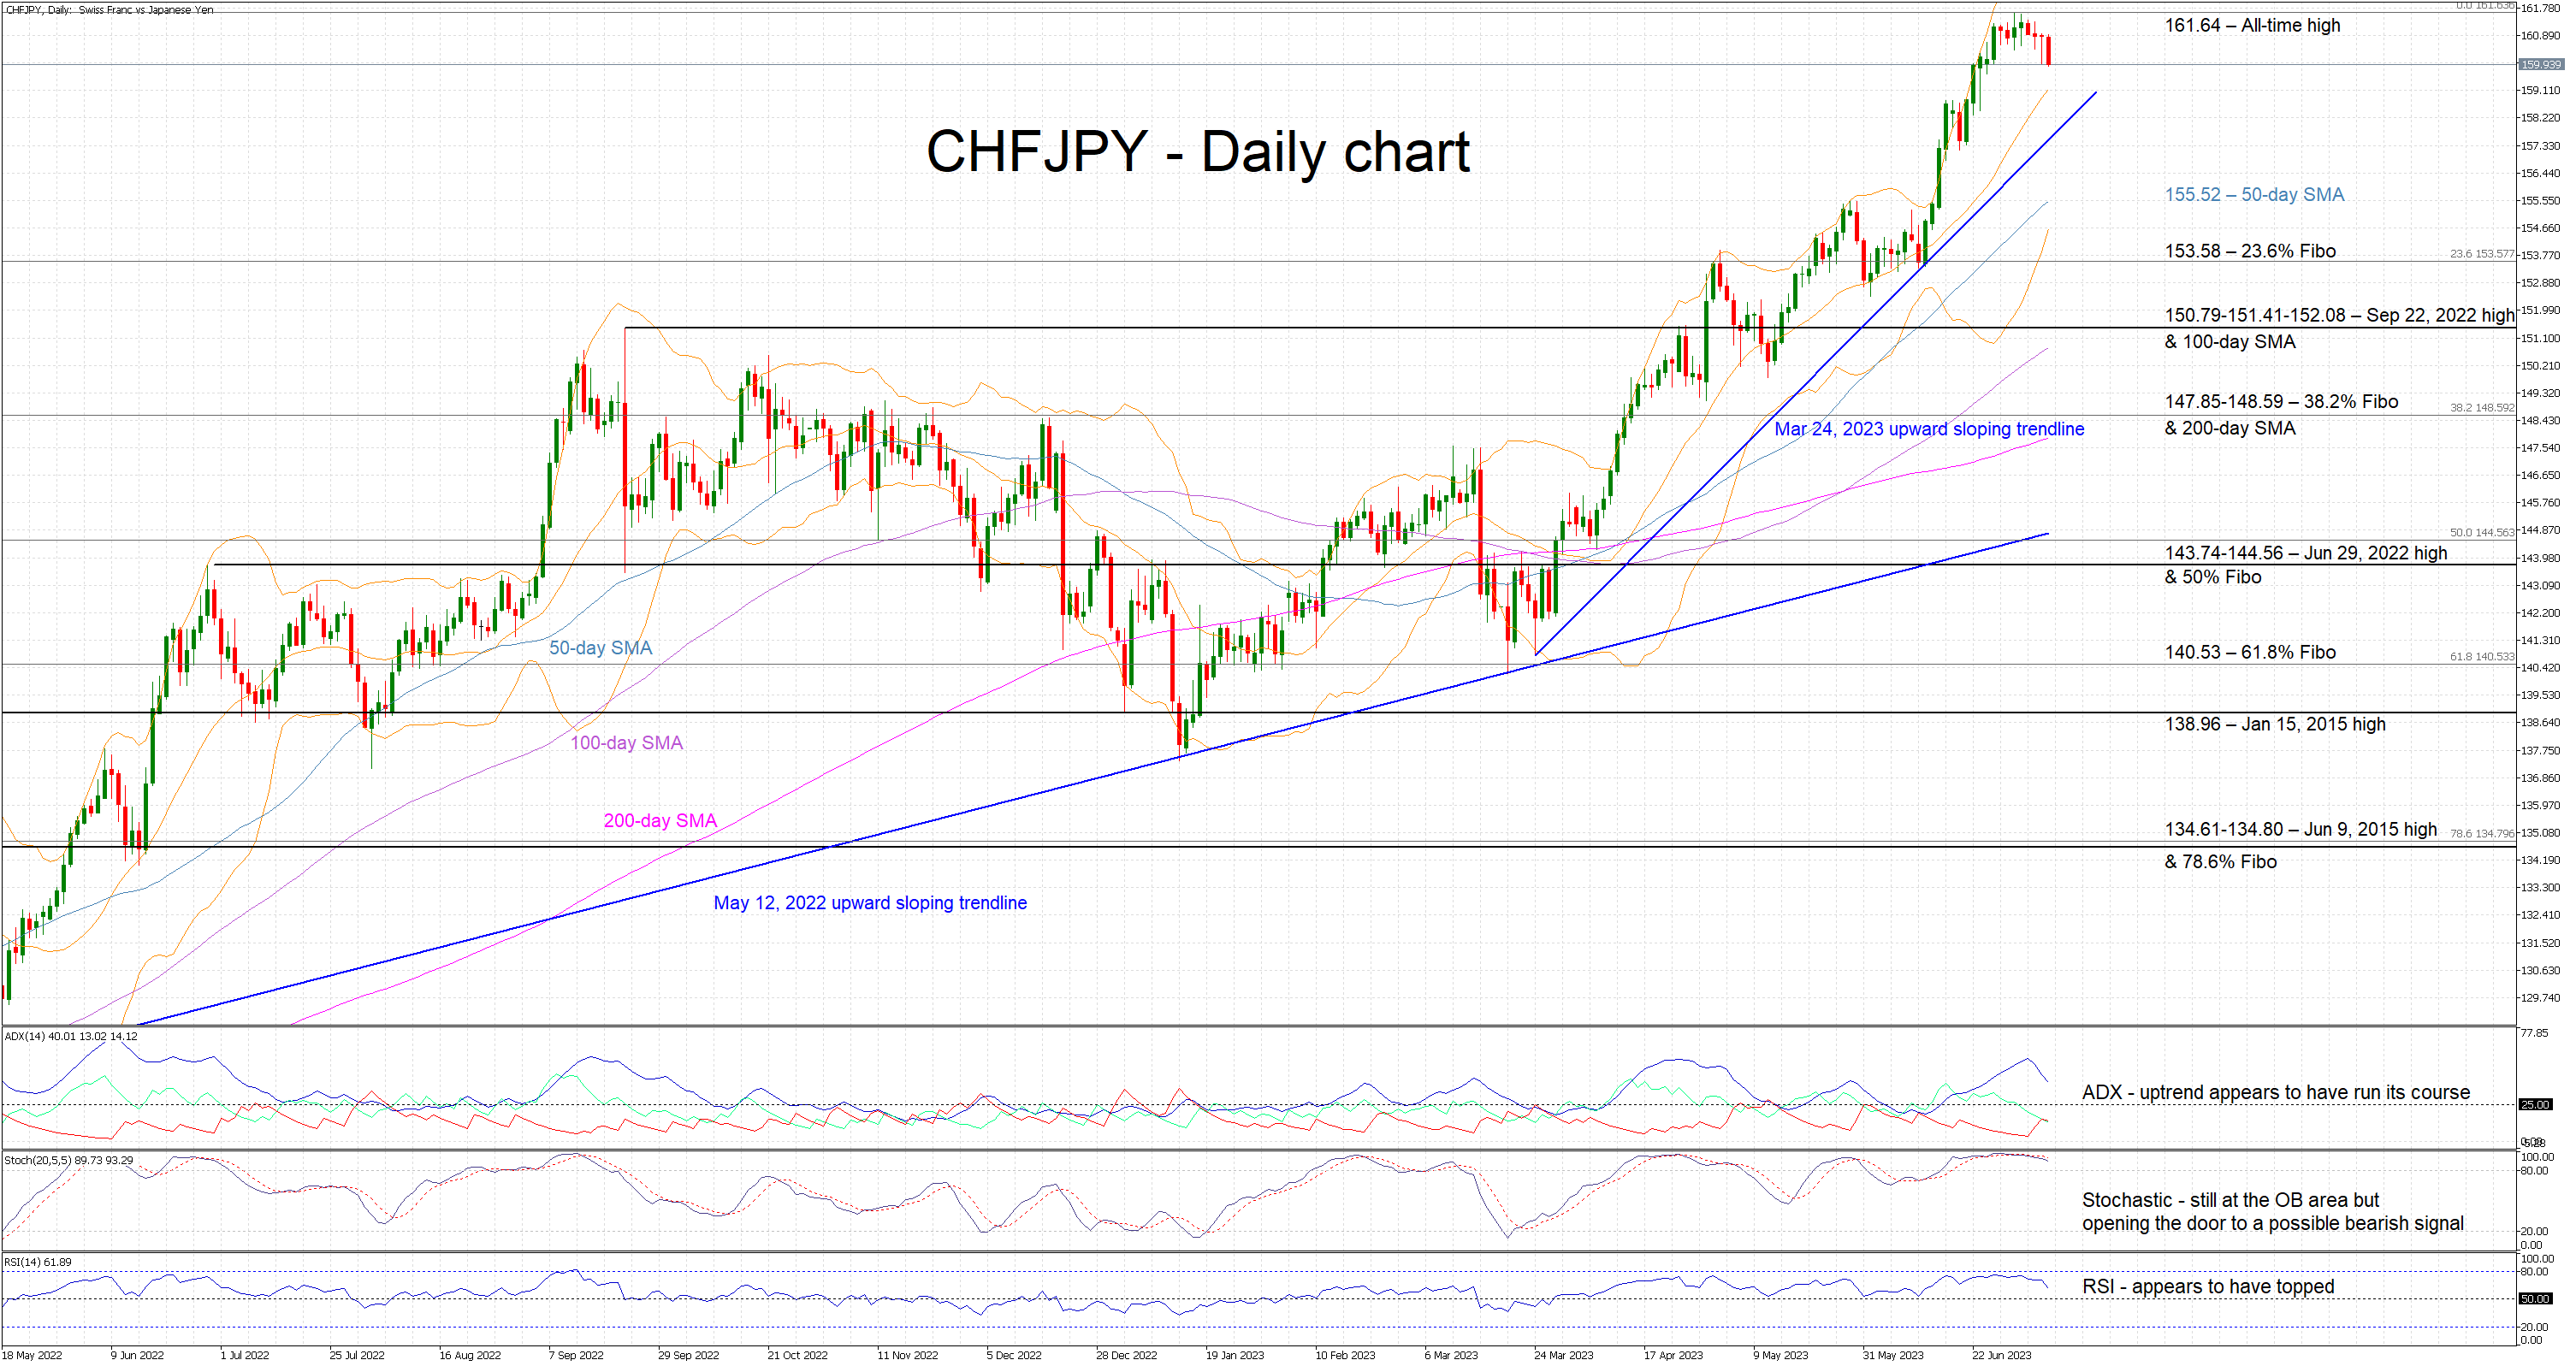
CHFJPY is experiencing its fourth consecutive red-candle session after recording an all-time high of 161.64. It has been an almost exponential move from the January 13, 2023 low of 137.42 and like other JPY pairs, CHFJPY has not experienced a proper correction since the mid-March sell-off.
The momentum indicators are gradually opening the door to a sizeable pullback. The stochastic oscillator is gliding lower but remains in its overbought (OB) territory. A break below its OB area would be clearly seen as a bearish sign. Similarly, the RSI appears to have topped and it is now heading towards its 50-midpoint. More interestingly, the Average Directional Movement Index (ADX) seems to give the strongest rally-exhaustion signal. It is moving aggressively lower, supporting the argument that the recent bullish trend has potentially run its course for now.
Should the bearish signals multiply, the CHFJPY bears would be keen for a move towards the 50-day simple average (SMA) at 155.52, provided that they successfully overcome the March 24, 2023 upward sloping trendline. They could then set their eyes on the 23.6% Fibonacci retracement of the May 15, 2022 – June 30, 2023 uptrend at 153.58.
On the other hand, the bulls’ aim seems easier despite the fact that they continue to venture into uncharted waters. They may decide to make another all-time high, above the current high of 161.64, aiming for the 165 level.
To sum up, CHFJPY bulls remain comfortably in control of the market, but the chances of a correction are gradually increasing. Bulls could begrudgingly accept a short-term sell-off provided that it does not push CHFJPY below the March 24, 2023 upward sloping trendline.
USDCAD Rebounds Strongly from 9-month Lows
USDCAD had been in a steady downtrend since late May, generating a clear structure of lower lows. However, the pair found its feet at the nine-month bottom of 1.3115 and retraced back higher, with the price challenging the ascending trendline that connects the pair's higher lows from November 2022 since early May.
The momentum indicators currently suggest that near-term risks are tilted to the upside. Specifically, the RSI is flatlining comfortably above its 50-neutral mark, while the stochastics are positively charged within the 80-overbought zone.
Should the price extend its advance above the trendline and the 50-day simple moving average (SMA), initial resistance could be found at 1.3460. Jumping above the latter, the pair could face the April peak of 1.3666. Even higher, the spotlight could turn to the 1.3700 psychological mark, which held strong in December 2022.
Alternatively, if the recovery falters and the pair dives lower again, the May support of 1.3319 may curb any downside attempts. A break below that zone could trigger a retreat towards the February low of 1.3262. Failing to halt there, the price might then revisit the August 2022 bottom of 1.3225.
In brief, USDCAD has been in a recovery phase after its steep decline came to a halt at a fresh 2023 low. For that rebound to resume, the price needs to reclaim its 50-day SMA.

EUR/USD Technical Analysis
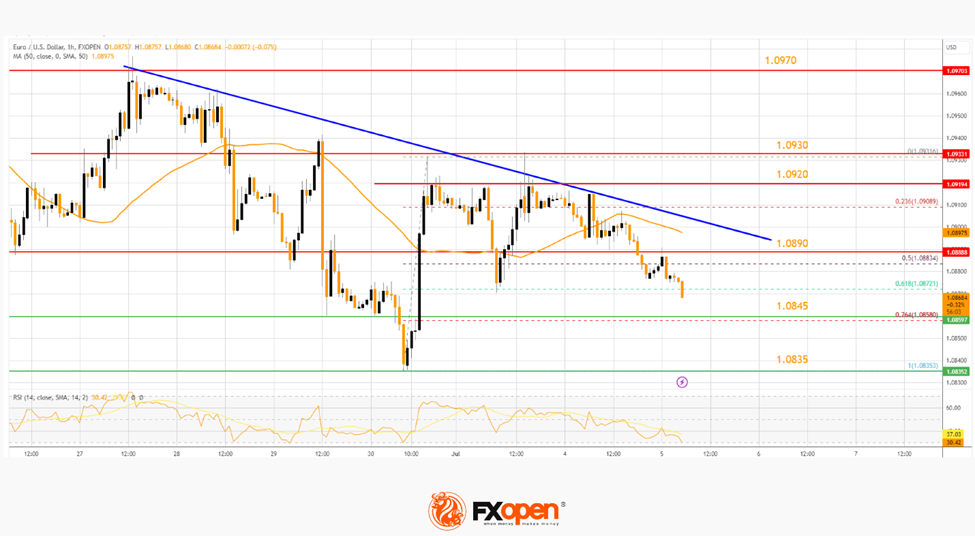
On the hourly chart of EUR/USD at FXOpen, the pair started a decent increase from the 1.0835 zone. The Euro climbed above the 1.0860 resistance against the US Dollar.
There was a break above the 50-hour simple moving average. It is now facing strong resistance near a connecting bearish trend line at 1.0890. A clear move above the trend line might send the pair toward the 1.0920 resistance.
The next major resistance is near the 1.0930 zone. Any more gains might send the pair toward the 1.0980 resistance.
Conversely, the pair might start another decline and retest the 50-hour simple moving average at 1.0875. The next major support is near 1.0860, below which EUR/USD could test the 1.0835 support. Any more losses could send the pair to 1.0810.