Sample Category Title
GBPAUD at 17-Month High But Bearish Pressure Intensifies
GBPAUD has almost completed a 17-month long round-trip as it is currently testing the January 28, 2022 high. It has been an impressive 20% rally since the September 2022 lows with the price action religiously obeying the September 26, 2022 upward sloping trendline. The recent pattern of higher highs remains in place, but the June 12 lower low is not a positive signal for the bulls.
In addition, the momentum indicators are showing rally exhaustion signs. The Average Directional Movement Index (ADX) is hovering around its 25-threshold and hence remains in waiting mode, and the RSI stands above its 50-midpoint but it has probably peaked. In the meantime, the stochastic oscillator has broken below its moving average, opening the door to a bearish signal. More interestingly, a bearish divergence has formed as the higher highs in GBPAUD have been met by lower highs in the stochastic.
Should the GBPAUD bears try to recapture the market reins, they would turn their attention to September 26, 2022 upward sloping trendline and the 1.8724-1.8820 range, defined by the October 11, 2018 high and the 50-day simple moving average (SMA). Even lower, the 1.8517-1.8553 area, populated by the 78.6% Fibonacci retracement of the January 28, 2022 – September 26, 2022 downtrend and 100-day SMA, could prove tougher to crack than currently envisaged by the bulls.
On the flip side, the bulls must be feeling very confident and hence preparing to break the 1.9183-1.9220 area. If successful, they will have the chance to register a new 2023 high and the highest print since May 7, 2020. They could then set their eyes on the December 16, 2019 high at 1.9521.
To conclude, GBPAUD bulls are firmly in control but there are increasing signs that the bears could soon have their chance to record a sizeable correction.
Strong ADP Jobs report Shakes Stocks, Boosts USD
ADP released another super strong job report for the US, noting private sector employment growth of 497k in June. This is more than double the expected 226k growth and completely contradicts the idea that the world’s largest economy has entered or is close to a deep recession.
A gain of almost half a million jobs in one month promises a noticeable boost to Americans’ income and spending, the main driver of US GDP. Although the APD data has repeatedly contradicted official statistics, it is one of the most influential labour market indicators ahead of tomorrow’s official release.
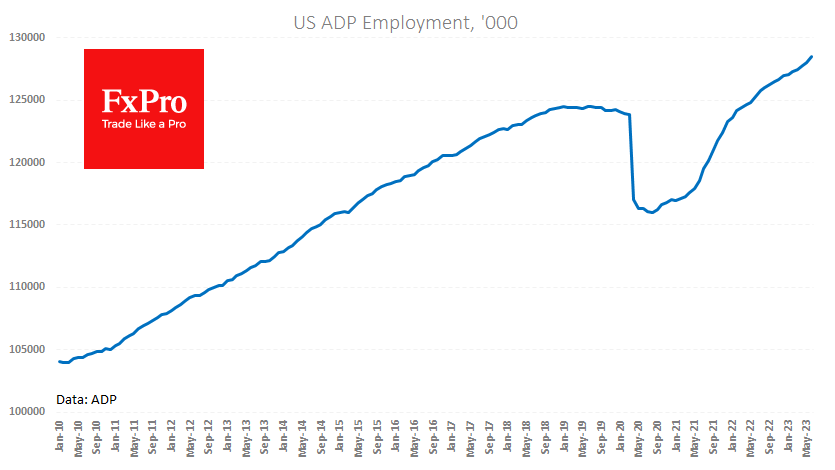
If the official statistics confirm the current data, markets should be prepared for further decisive rate hikes. And that could be bad news for equity indices as rising bond yields become increasingly attractive on a risk/reward basis, increasing the chances of a correction in the Nasdaq100 and other major indices.
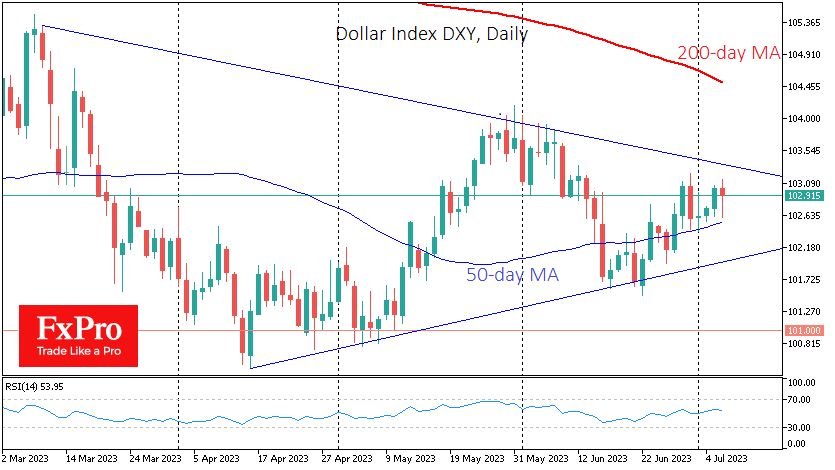
At the same time, a strong labour market could revive interest in the dollar, which has recently lost ground. The Dollar Index rose 0.3% immediately after the ADP release, recouping much of its intraday losses. However, this move could be extended as the DXY defends a position above its 50-day moving average, confirming a bullish medium-term trend.
Fed Logan advocates for more restrictive monetary policy
Dallas President Fed Lorie Logan has voiced concerns about inflation and suggested that a more restrictive monetary policy may be necessary. She indicated that, based on the recent economic data and the Fed's dual-mandate goals, it would have been fitting to raise the federal funds target range FOMC June meeting.
However, Logan pointed out the "challenging and uncertain environment," arguing that "it can make sense to skip a meeting and move more gradually."
Logan expressed deep concerns about whether inflation will return to target levels in a timely and sustainable manner. She further noted, "the continuing outlook for above-target inflation and a stronger-than-expected labor market calls for more-restrictive monetary policy."
On the notion of a delayed impact from past policy actions, Logan expressed skepticism, saying, "I'm skeptical about the potential for large additional effects from this channel." This stance challenges the widely held view that policy measures often take time to influence the economy, suggesting the need for swift action in addressing the current economic issues.
ADP Report Another Huge Blow to Fed Pause Hopes, Jobless Claims in Line
Federal Reserve policymakers may well be dreading tomorrow's jobs report now after today's ADP number once again obliterated estimates, coming in more than double the consensus forecast.
That's almost become the norm on payrolls day but FOMC policymakers, along with investors, may have been hoping the tide would now turn after such as intense tightening cycle over the last 18 months. But if the ADP report is anything to go by, we're headed for another red-hot jobs report.
If a rate hike this month wasn't already nailed on, it probably is now. The ADP isn't often a great precursor to the NFP number but this is a report you simply can't ignore. I'm sure everyone will be revising up their expectations on the back of it and wondering just how much longer this labour market resilience can last. How high must rates go?
Jobless claims crept up again but were just about in line with expectations and still probably lower than what many will have anticipated at this stage. Next up is JOLTS and it will take something seriously shocking to bring balance back to this debate. It's no longer a question of if the Fed hikes this month but how many more after that?
Despite positive momentum, Oil falls short once more
Oil prices are retreating in risk-averse trade today. The ADP report has clearly had a negative impact given it likely means we're facing another red-hot jobs report tomorrow and the prospect of higher rates for longer.
It also came at an opportune time, with the price flirting with the peak from two weeks ago, only to turn south having fallen just shy of surpassing it. That means we're seen yet another failed new high or low in recent weeks and the gradual consolidation, roughly between $72-$77 is still in play.
This time it was close and there was good momentum going into the ADP release but it seems the jobs number was just too big. A repeat performance tomorrow could cement that and undo the efforts of the Saudis and Russians earlier this week in seeking to drive the price higher.
Is Gold vulnerable to another big break?
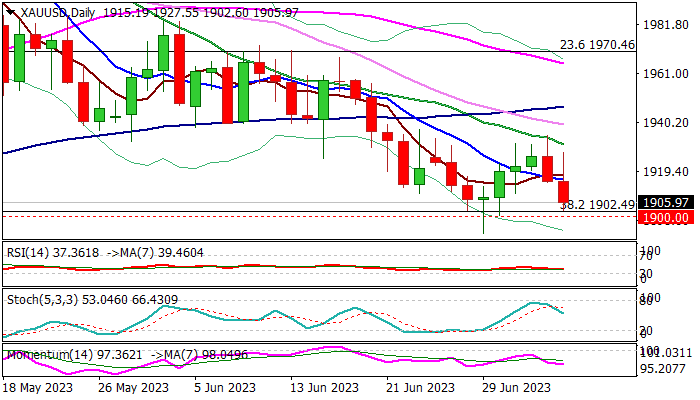
Gold's brief rebound is seemingly over, with the price already struggling around $1,930-$1,940 before ADP delivered a hammer blow to it. The yellow metal is back trading just above $1,900, a level that's now looking very vulnerable ahead of tomorrow's jobs report.
If it manages to hold above in the interim, a hot report could be the straw that breaks the camel's back. Suddenly it will become a question of whether another hike in September is unavoidable against the backdrop of such a hot labour market. These aren't the only figures that matter but they do significantly weaken the case for another pause.
XAU/USD: Gold Falls Sharply on Upbeat US Private Sector Payroll Data
Gold price fell sharply on Thursday, after US ADP private payrolls rose way above expectations in June (497K vs 228K f/c and downwardly revised May figure from 278K to 267K).
Upbeat data point to strong labor market, despite growing fears of recession, due to high borrowing cost and improve the overall sentiment, prompting traders into riskier assets, which lifted the dollar index
The yellow metal was down over $20 immediately after release of US ADP report and cracked the upper boundary of strong support zone between $1902 and $1892 (Fibo 38.2% of $1614/$2080 / psychological / June 29 spike low).
Sustained break through $1900 support zone would generate strong bearish signal for continuation of larger downtrend, paused for a mild correction during the past week and expose targets at $1863/$1847 (200DMA (Fibo 50% of $1614/$2080).
Weak technical picture on daily chart (14-momentum in negative territory / most of MA’s in bearish configuration) add to bearish near-term outlook, though strong headwinds are still to be expected at $1900 zone.
Near-term action needs to stay below 10DMA ($1916) to keep fresh bears in play and guard upper pivots at $1930/34 (falling 20DMA / July 5 top).
Traders will wait for Friday’s release of US non-farm payrolls data for June, to get more details about the condition of US labor market.
Res: 1916; 1930; 1934; 1946.
Sup: 1900; 1892; 1871; 1863.
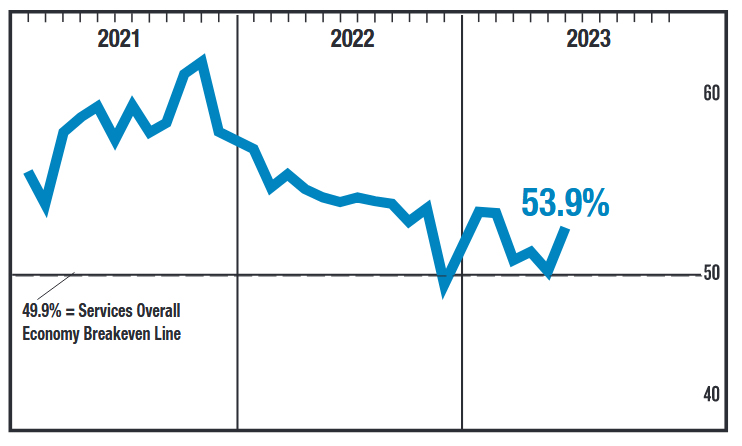
US ISM services rose to 53.9, corresponds to 1.4% annualized GDP growth
US ISM Services PMI rose from 50.3 to 53.9 in June, above expectation of 51.3. Business activity/production jumped from 51.5 to 59.2. New orders rose from 52.9 to 55.5 Employment rose from 49.2 to 53.1. Prices dropped from 56.2 to 54.1.
ISM said, "The past relationship between the Services PMI and the overall economy indicates that the Services PMI for June (53.9 percent) corresponds to a 1.4-percent increase in real gross domestic product (GDP) on an annualized basis."
Sunset Market Commentary
Markets:
Markets took off this morning where they ended yesterday: by selling bonds. The move started as US traders returned from the 4th of July Holiday and accelerated a first time after a technical break of the 10y yield above 3.85/3.87%. FOMC Minutes delivered a second blow by showing more disagreement than expected over the Fed’s skip strategy. Some favoured a 25 bps rate hike, but accepted the status quo. Minutes showed a lot of references to resilient inflation and resilient growth with the influential staff now reducing the odds of a recession later this year to 50/50. Most Fed governors are now in the camp of at least two more rate hikes this year, as Fed Chair Powell also confirmed at a conference at the end of last month. For the umpteenth time this cycle, markets are positioned very dovish confirmed to Fed talk. For the umpteenth time, they have to reposition higher. Interestingly, the long end of the curve is suffering as well with real yields driving the move. Markets come to terms with the (even) higher for (even) longer idea with the theoretical concept of neutral rate (equilibrium rate given price stability and full employment) being rethought. Instead of the long-assumed 2.5% for the US, it is likely going to be higher. Core bonds immediately found themselves on a slippery slope this morning with early US eco releases making it a triple whammy. The US ADP labour market report showed another astonishing amount of net job gains (+497k vs +225k expected) in June while US jobless claims more or less leveled (248k from 239k vs 245k expected) below the psychologic 250k barrier. US yields add 5 bps (30-yr) to 15 bps (2-yr) at the time of writing. The US 2-yr yield broke through 5%, setting a new cycle peak at 5.12% (highest since 2006). The next target stands at 5.26% which is the 2006 high. The US 10-yr yield pushed above 4%, eying the YTD high at 4.09%. UK Gilts and German Bunds joined the sell-off. UK yields rise by more than 10 bps across the curve. The UK 2-yr and 10-yr yields set new cycle highs at respectively 5.5% and 4.66%. German yields increase by 8.1 bps to 12.2 bps with the belly of the curve underperforming the wings. From a technical point of view, the German 10-yr yield finally leaves key resistance at 2.56% behind. The YTD/cycle high stands at 2.77%. Rising real rates are taking their toll on stock markets. Main European benchmarks lose more than 1.5%. In FX space, it’s again very quiet amongst majors. Sterling slightly outperforms both the euro and the dollar. Moves in cable (GBP/USD) and EUR/USD are technically insignificant, but EUR/GBP tested the 0.8518 YTD low. The Japanese yen is stuck between risk-off flows and rising core bond yields. The US non-manufacturing ISM and JOLTS job openings will still be released later today with official payrolls on offer tomorrow.
News & Views:
The UK June Decision Maker Panel survey (DMP) showed that realized output price inflation slowed from 7.6% in May to 6.9% in June. The DMP covers prices from firms across the whole economy, not just consumer-facing firms. The trend decline develops rather slowly (3-month moving average 7.3% from 7.6%). Over the next year, businesses expect output price inflation to ‘fall’ to 4.9%, down from 5.1% May. One-year ahead CPI inflation expectations decreased to 5.7% from 5.9%. However, expectations for three-year ahead CPI inflation increased slightly (by 0.2 ppts) to 3.7%. Current CPI perceptions of firms were close to the 8.7% actual CPI. Annual unit cost growth was unchanged at 9.4% while expected unit cost growth again accelerated from 6.4% to 6.9%. Expected wage growth was also slightly higher at 5.3%. 47% of firms reported that the overall level of uncertainty facing their business was high or very high. Both sales and price uncertainty increased slightly in the monthly series, although the three-month moving averages decreased for both series. Price uncertainty remains at relatively high levels.
The US trade deficit narrowed from $74.5bn to $69bn in May. The decline occurred as imports (0.8% M/M) dropped much faster than exports (-2.3% Y/Y), with the decline mainly driven by consumer goods and industrial supplies. The goods balance deficit improved from $96.2bn to $91,26bn. At the same time the US services balance improved slightly further from $21.58bn to $22,28bn. The petroleum balance eased slightly from $2.98bn to $2.34bn. The US petroleum balance already trades in positive territory since March last year.
EUR/USD Mid-Day Outlook
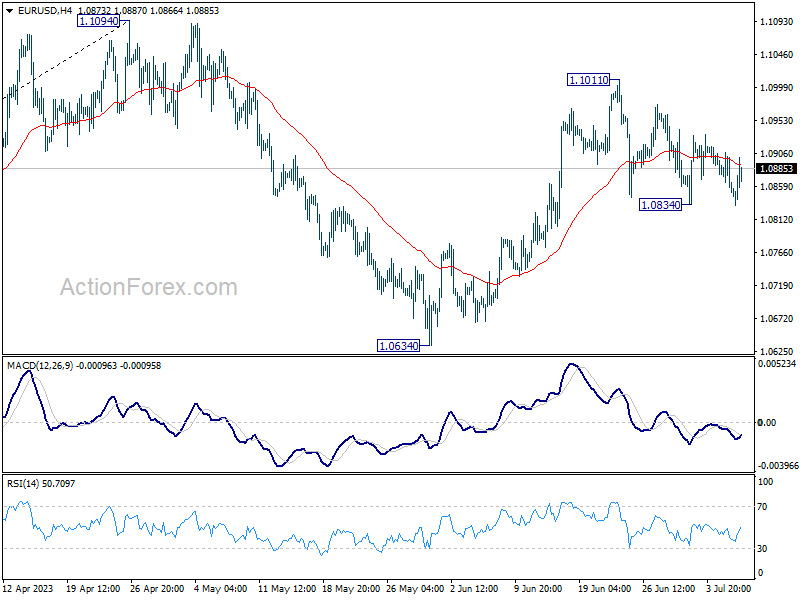
Daily Pivots: (S1) 1.0834; (P) 1.0871; (R1) 1.0891; More...
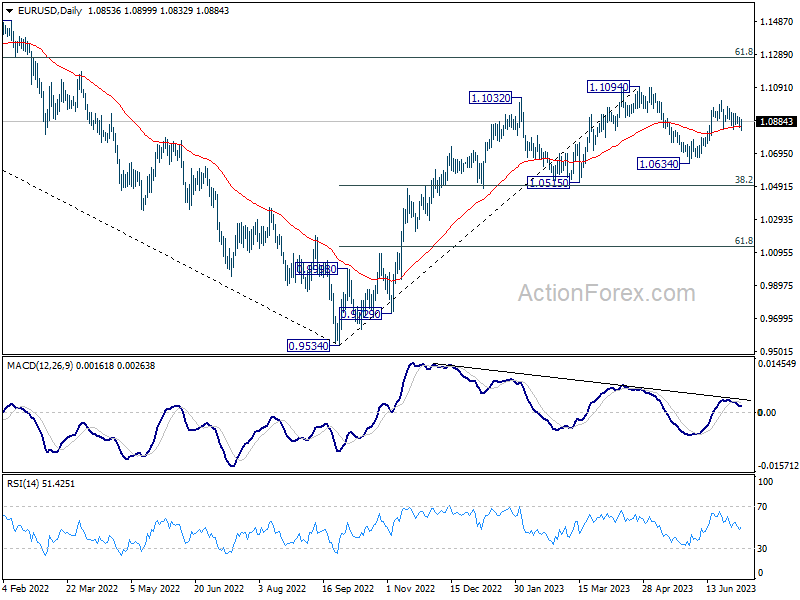
Intraday bias in EUR/USD remains neutral as sideway trading is still in progress. On the upside, break of 1.1011 will resume the rise from 1.0634 and target 1.1094 resistance. Decisive break there will resume larger up trend from 0.9534 to 1.1273 fibonacci level. However, firm break of 1.0834 will turn bias to the downside for 1.0634 support instead.
In the bigger picture, as long as 1.0515 support holds, rise from 0.9534 (2022 low) would still extend higher. Sustained break of 61.8% retracement of 1.2348 (2021 high) to 0.9534 at 1.1273 will solidify the case of bullish trend reversal and target 1.2348 resistance next (2021 high).
GBP/USD Mid-Day Outlook
Daily Pivots: (S1) 1.2683; (P) 1.2709; (R1) 1.2730; More...
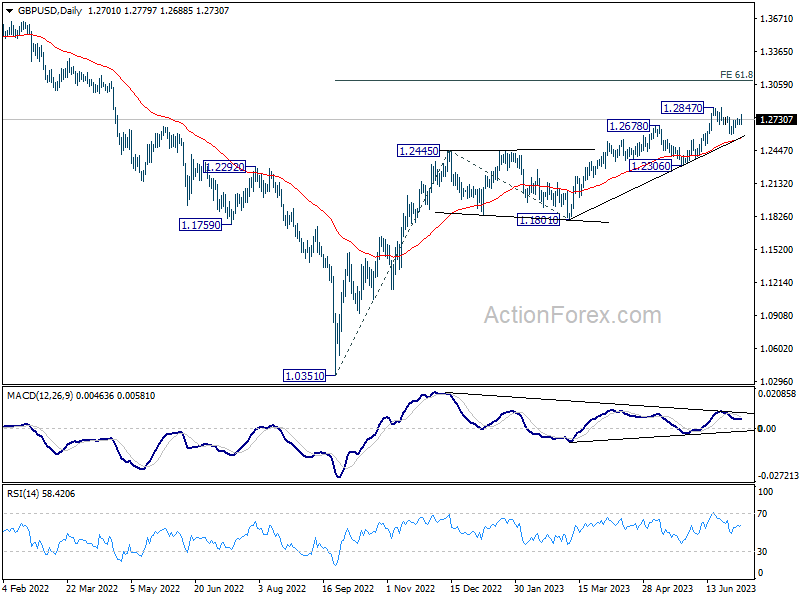
Intraday bias in GBP/USD remains neutral even though it's trying to extending the recovery from 1.2589. On the upside, firm break of 1.2847 will resume larger up trend from 1.0351 to 61.8% projection of 1.0351 to 1.2445 from 1.1801 at 1.3095. On the downside, though, break of 1.2589 will extend the fall from 1.2847 to 55 D EMA (now at 1.2558).
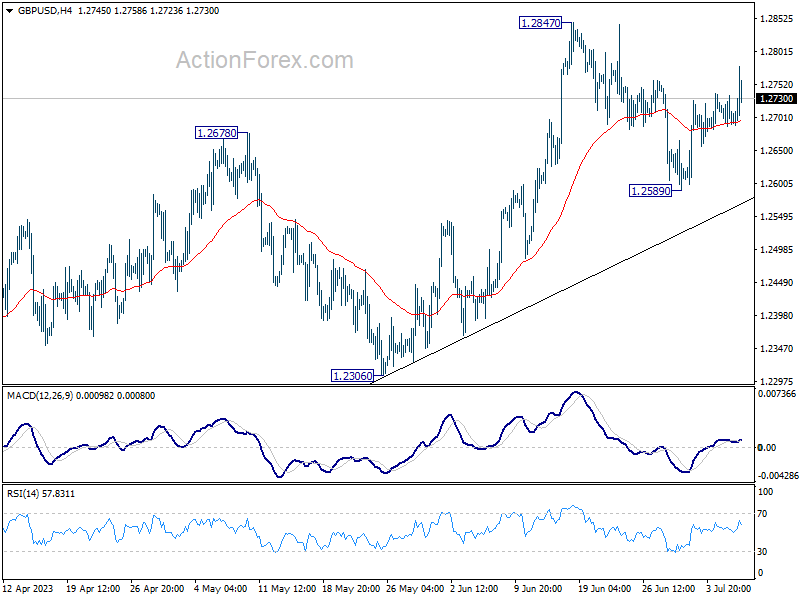
In the bigger picture, the strong support from 55 W EMA (now at 1.2341) is a medium term bullish sign. Outlook will stay bullish as long as 1.2306 support holds. Rise from 1.0351 medium term bottom (2022 low) is expected to extend further to retest 1.4248 key resistance (2021 high).
USD/CHF Mid-Day Outlook
Daily Pivots: (S1) 0.8968; (P) 0.8982; (R1) 0.9001; More...
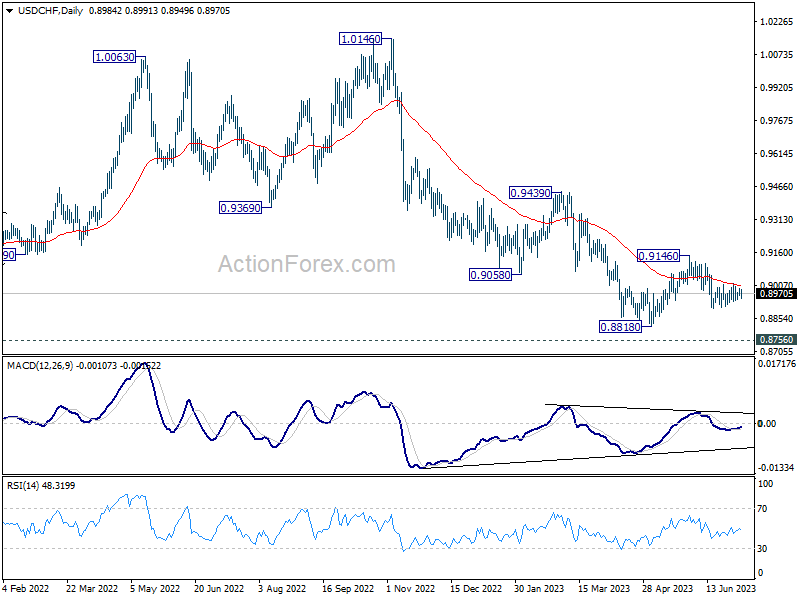
USD/CHF is still extending sideway trading and intraday bias remains neutral, while further decline is in favor. On the downside, break of 0.8900 will resume the fall from 0.9146 to 0.8818 low or below. On the upside, above 0.9015 will bring stronger rise towards 0.9146 resistance instead.
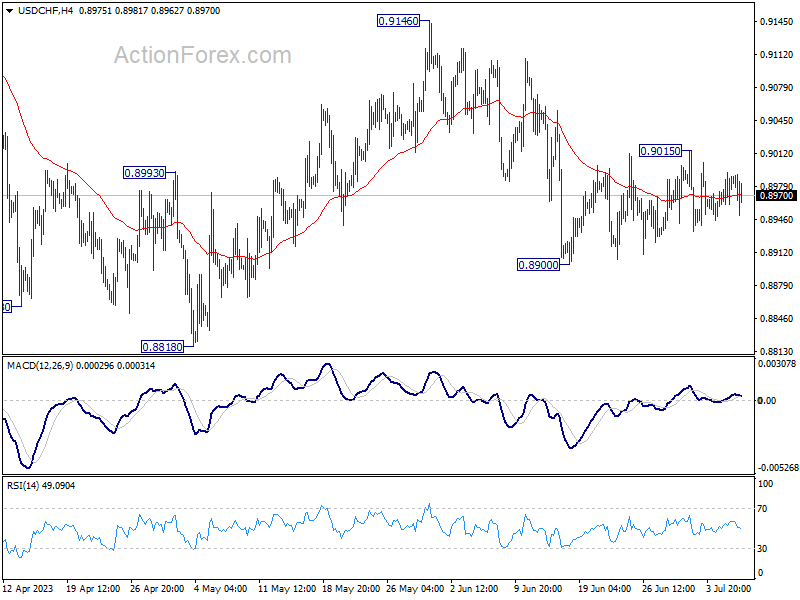
In the bigger picture, fall from 1.1046 (2022 high) is seen as a leg in the long term range pattern from 1.0342 (2016 high). While further decline cannot be ruled out, strong support is expected from 0.8756 long term support to bring reversal. Firm break of 0.9146 resistance should confirm medium term bottoming.