Sample Category Title
AUDUSD Remains Suppressed by 200-day SMA
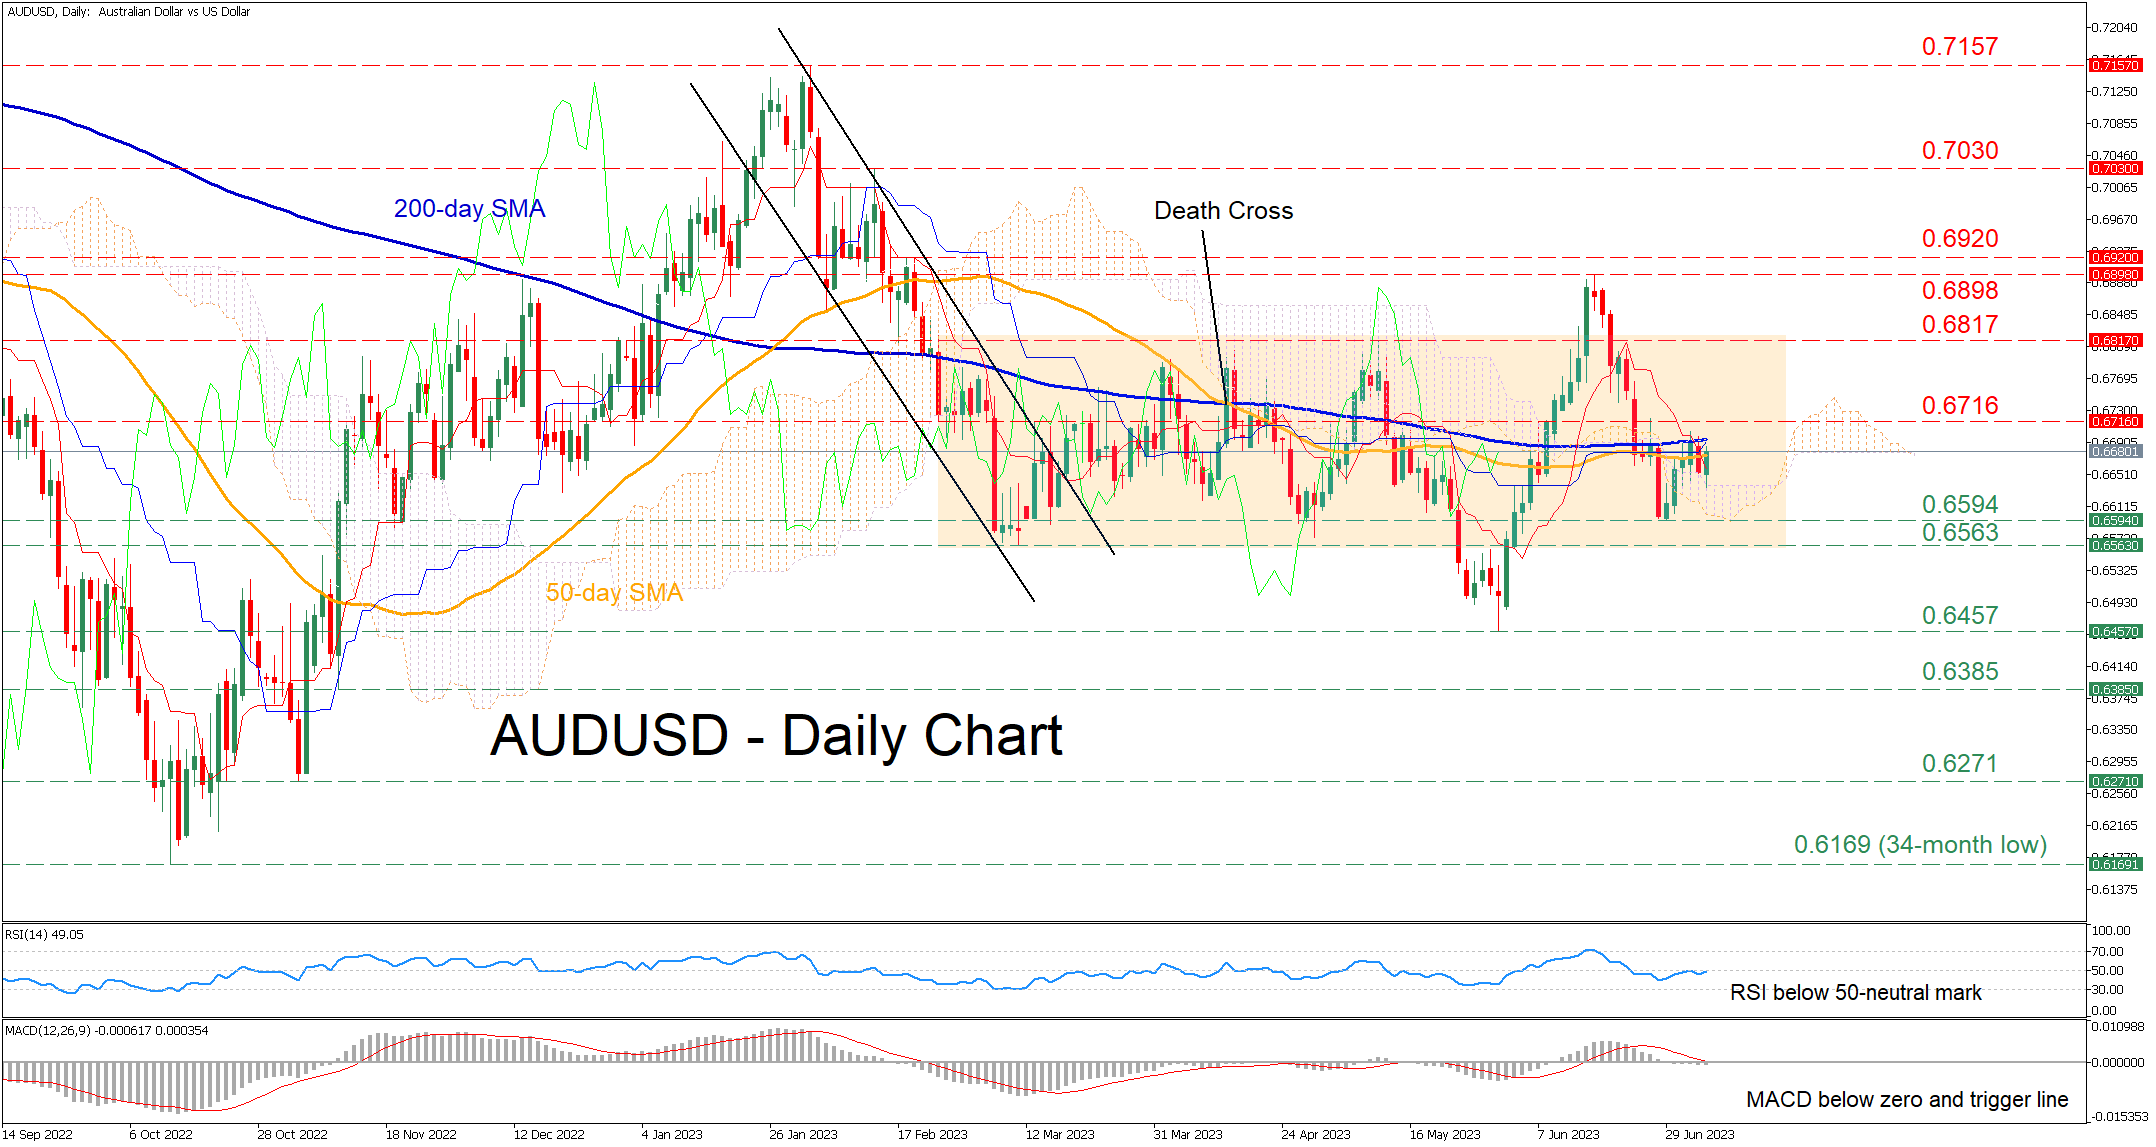
AUDUSD has been on a wild ride during the past two months, posting a false bearish breakout from its rangebound pattern which was followed by a false bullish breakout. In the past few sessions, the pair has been repeatedly held down by the 200-day simple moving average (SMA), but the bulls have not surrendered yet.
This inability to claim the congested region that includes both the 50- and 200-day SMAs is also reflected in the short-term oscillators. Specifically, the RSI has failed multiple times to jump above the 50-neutral mark, while the MACD remains below both zero and its red signal line.
If bullish pressures persist and the price crosses above the 200-day SMA, the recent resistance of 0.6716 might curb initial advances. Clearing this region, the pair could face 0.6817, which is the upper border of the rectangle pattern. A violation of that zone could pave the way for the four-month peak of 0.6898.
On the flipside, bearish actions could send the price back towards the recent support of 0.6594. Should that barricade fail, the spotlight could turn to the March bottom of 0.6563, which coincides with the floor of the recent rangebound movement. Dipping lower, the pair could descend towards the 2023 bottom of 0.6457.
In brief, AUDUSD remains capped by its 200-day SMA despite buyers’ consecutive attempts to conquer that region. For a recovery to occur, the price needs to clearly jump above this fortified zone.
US 30 Cash Index Might Be Close to a New Bearish Move
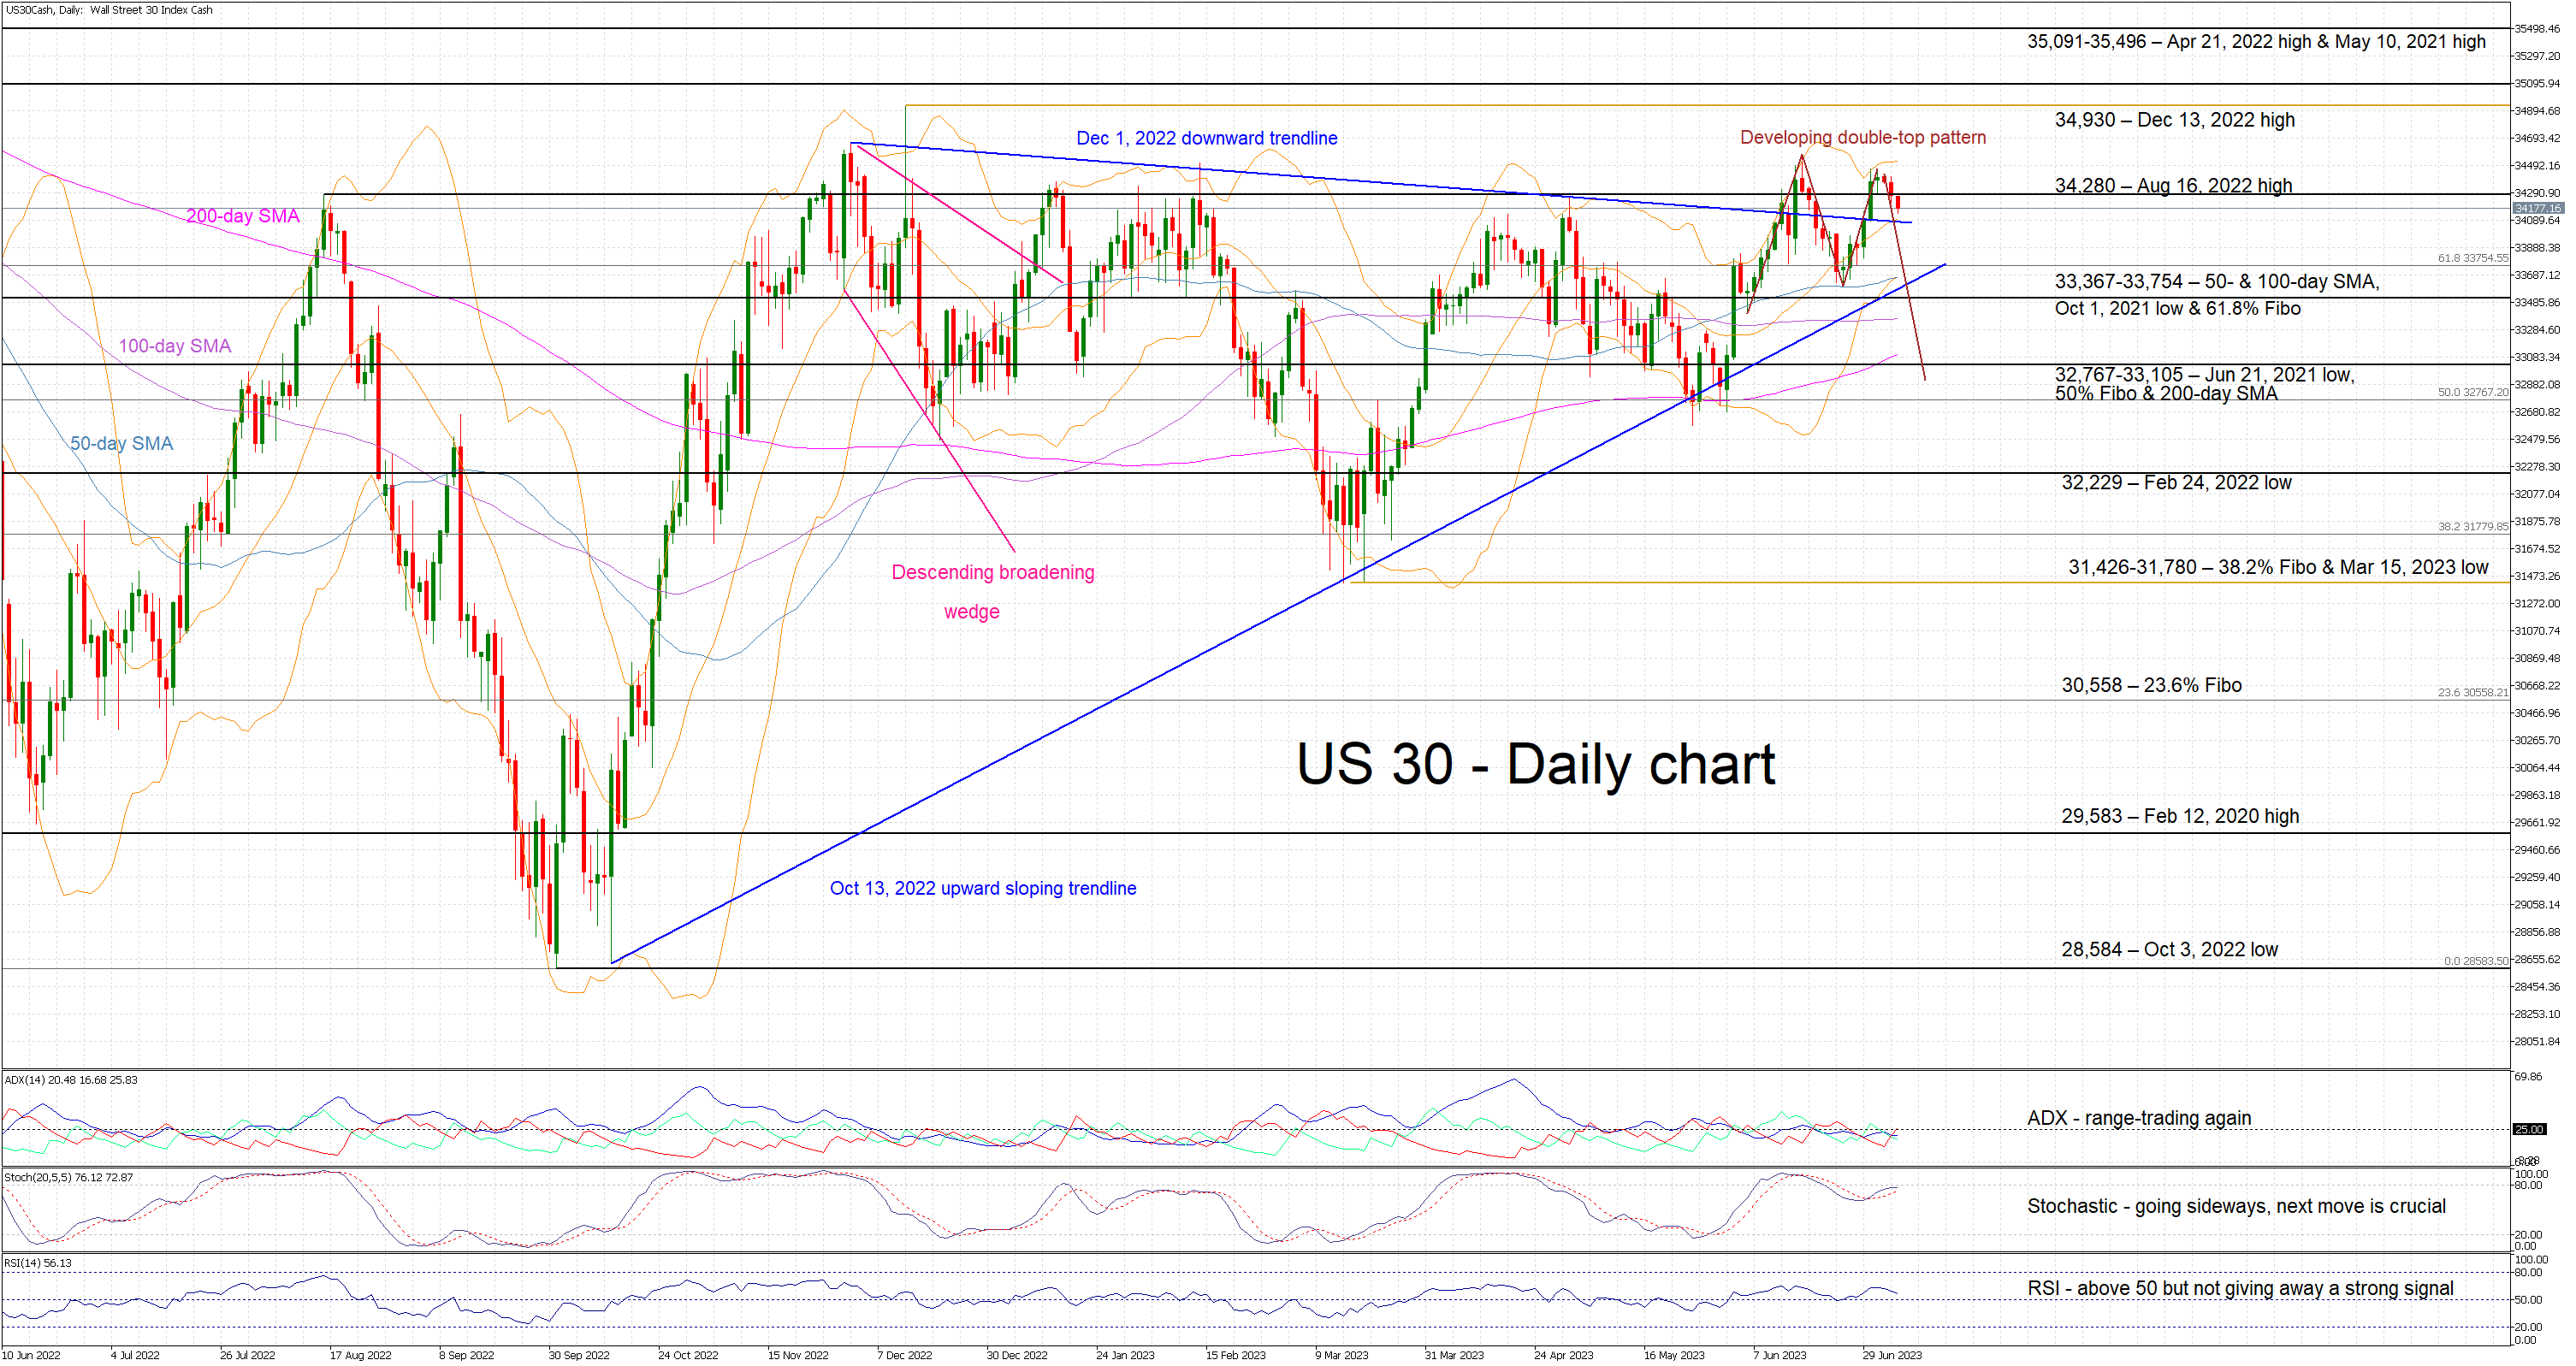
The US 30 cash index is edging lower today, testing the support set by the December 1, 2022 downward sloping trendline. Interestingly, a bearish double-top pattern is gradually forming with the neckline standing at the June 26 low of 33,606. A move below this neckline is needed for this structure to be deemed as valid, with the primary target then set at the 32,600 area.
The momentum indicators are not ready to support this developing structure. The RSI remains above its 50-midpoint and the Average Directional Movement Index (ADX) remains stuck below its 25-threshold and thus pointing to a range-trading phase. More importantly, the stochastic oscillator is trading sideways, a tad below its overbought area, and preparing to test its moving average. A decisive move lower would be seen as a bearish signal, favouring the aforementioned double-top pattern.
Should the bears decide to grab the market reins, they would try to overcome the December 1, 2022 downward sloping trendline. They would then come up against the arguably very important 33,367-33,754 area. The combination of the 50- and 100-day simple moving averages (SMAs), the October 1, 2021 low, the 61.8% Fibonacci retracement of the January 5, 2022 – October 3, 2022 downtrend at 33,754 and the October 13, 2022 upward sloping trendline means that the bears’ determination would really be put to the test there.
On the other hand, the bulls would love a retest of the August 16, 2022 high at 34,280. The December 13, 2022 high at 34,930 would be the next aim, a tad below the busier 35,091-35,496 range defined by the April 21, 2022 and May 10, 2021 highs respectively.
To sum up, US 30 index bears are probably feeling more confident on the back of a developing bearish pattern despite the momentum indicators’ muted stance.
Nikkei 225 Technical: Minor Corrective Decline in Progress
Nikkei 225 Technical: Minor Corrective Decline in Progress
- Price actions have broken below the 20-day moving average and minor ascending channel support.
- Potential short-term corrective decline within a medium-term uptrend in place since the 15 March 2023 low.
- 33,200 is key short-term resistance to watch.
This is a follow-up analysis of our prior report, “Nikkei 225 Technical: Overstretched rally” published on 15 June 2023.
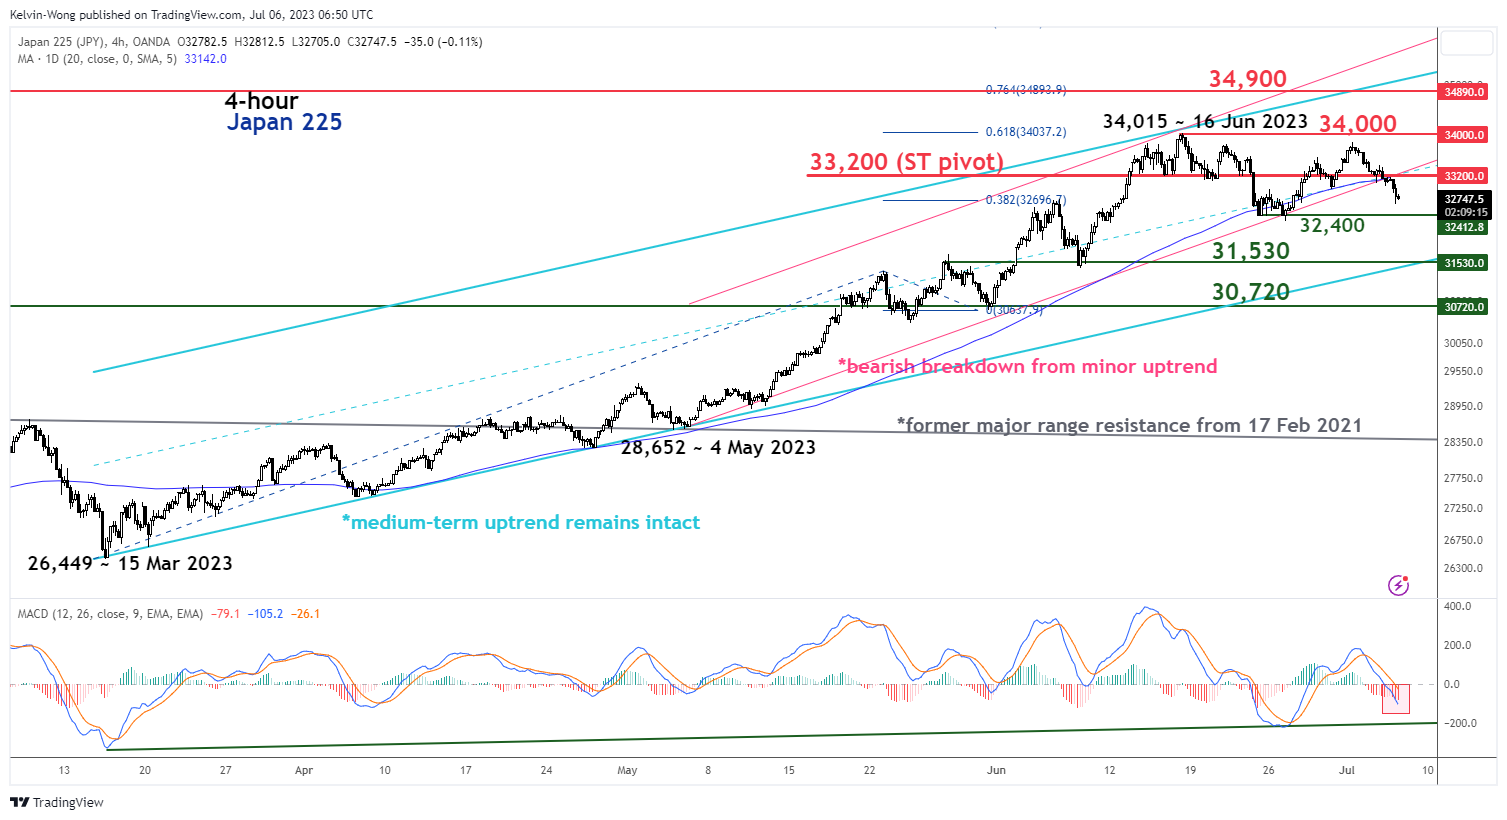
Fig 1: Japan 225 short-term & medium-term trends as of 6 Jul 2023 (Source: TradingView, click to enlarge chart)
After a stellar up move of +29% within three months from its 15 March 2023 low to hit a 33-year high on 16 June 2023, the Japan 225 Index (a proxy of the Nikkei 225 futures) has dropped by -5% to print a recent minor low of 32,305 on 27 June 2023.
Minor uptrend from 4 May 2023 low is likely to be damaged
The Index has just staged a bearish breakdown below the lower limit (support) of a minor ascending channel in place since the 4 May 2023 low of 28,652 and the 20-day moving average which suggests that the prior minor uptrend has likely reversed to the downside.
In a longer-term frame, the medium-term uptrend phase of the Index is still intact at this juncture as the price actions are still holding above the lower limit of the medium-term ascending channel in place since the 15 March 2023 low of 26,449.
The short-term MACD trend indicator has turned bearish.
The 4-hour MACD has inched lower below its zero centreline and may have further downside pressure before it reaches its ascending trendline support (in green) which reinforces the minor decline seen in the price actions of the Index at this juncture.
Watch the 33,200 key short-term pivotal resistance to maintain the short-term bearish tone with the next supports coming in at 32,400 and 31,530.
On the flip side, a clearance above 33,200 invalidates the bearish tone to expose the 34,000 intermediate resistance, and above it sees the upper boundary of the medium-term ascending channel that is acting as a resistance at 34,900.
WTI Oil: Fresh OPEC+ Production Cuts Inflate Oil Prices
WTI oil keeps firm tone on prospect of tighter supply after the biggest world oil exporters Saudi Arabia and Russia decided to further cut production, earlier this week.
Two top OPEC+ members extend cartel’s campaign in reducing oil output, which started last November, arguing the latest decision by continuous action in doing whatever necessary to support market.
On the other hand, the United States criticized decision, as the biggest oil producer outside the cartel calls for increasing production to help global economy and also upset by strengthening cooperation between two countries, in light of a conflict in Ukraine, in which Russia and the Western World are on opposite sides.
Analysts expect that additional production cuts should balance the energy market, threatened by slower than expected economic growth of China, world’s largest oil importer, as the economy is struggling to accelerate recovery in post-Covid period.
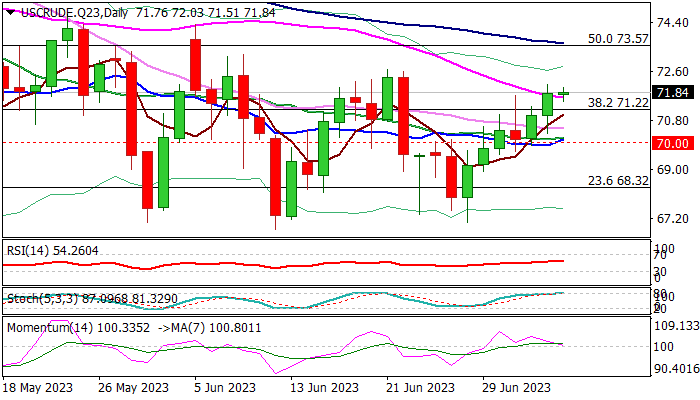
Oil price rose in past few sessions and pressuring the top of near-term range ($72.68), break of which is needed to signal an end of directionless phase and confirm formation of higher base at $67.00 zone.
Violation of $72.68 pivot would open way for further recovery and expose targets at $73.60 (50% retracement of $83.51/$63.63 fall / 100DMA / daily cloud top) and $74.70 (May 24 high) in extension.
Near-term action needs to hold above $71.22 (broken Fibo 38.2%) to keep bullish bias, while break here and extension below daily cloud base ($70.56) would weaken near-term structure and warn of extended range trading.
Fading bullish momentum and overbought stochastic on daily chart, counter for now bullish setup of MA’s (10/20/30).
Res: 72.14; 72.68; 73.60; 74.33.
Sup: 71.22; 70.56; 70.00; 69.58.
FTSE 100 Drops Below June Low
Earlier we wrote about the reasons for the weak behavior of the UK stock market.
Firstly, it is the highest inflation among the G7 countries.
Yesterday JP Morgan analysts suggested that the base rate in the UK could be raised to 7% under certain scenarios. And the likelihood of a hard landing for the British economy next year is rising due to the impact of rising borrowing costs on business confidence and rising unemployment.
Secondly, this is a decline in commodity prices, which is important for the FTSE 100 index, where the share of oil and mining companies is relatively large. Commodity prices reflect expectations of a global economic growth outlook that has been overshadowed by news from China. There, according to the latest data, activity in the services sector in June grew at the slowest pace in 5 months.
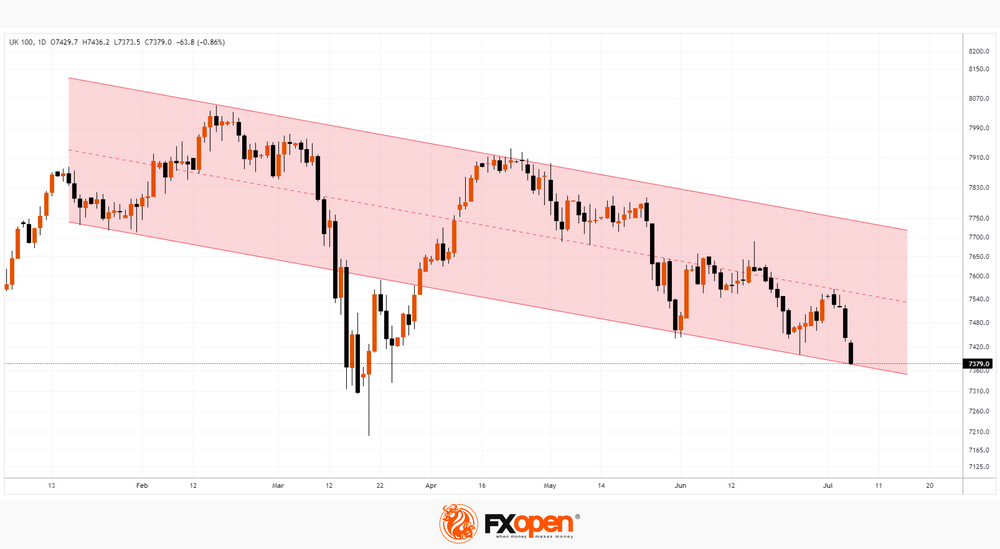
At the same time, the FTSE 100 chart gives hope to the bulls, as the price of the index is at the level of the lower line of the descending channel (shown in red), which, it is possible, will show support properties for the FTSE 100, which may lead to a slowdown in the fall or even a short-term rebound.
A Slew of Labour Market Data Comes ahead of Official June Payrolls Report Tomorrow
Markets
Core bonds fell yesterday. Underperformance of US Treasuries vs Bunds triggered a technical break in the US 10y yield. The reference added 7.6 bps to 3.93%, surpassing 3.90% (December 2022 correction high) with 3.92% (61.8% recovery on the October 2022 – April 2023 correction lower) following soon. The front-end of the curve added 1-6.1 bps with the 2-y yield gently closing in on the symbolic 5% barrier. Hitting that barrier also officially turns the page on the mid-March regional banking tremors. US yields had a rocky start in European morning dealings with the Chinese PMI setback still lingering and as the ECB’s survey showed consumer (1-y) inflation expectations easing further. They lifted off in the early afternoon and gained further traction as the US joined for its first full trading day after a long weekend. The FOMC meeting minutes published late in the US session supported yields but didn’t really add momentum. The key takeaway is that the decision to pause in June wasn’t as unanimous as chair Powell made it sound. Those favouring to hike again simply deemed it “acceptable” to sit one out in June. Another interesting feature was that Fed staff saw the possibility of the economy avoiding a recession as almost as likely as the mildrecession baseline. German yields rose between 1-4.2 bps with the long end underperforming. Gilt yields in the UK also steamed ahead. The 2-y yield (+5.8 bps) hit a new cycle high while the 10-y tenor (+7.8 bps) closed at the highest level since the Sep-Oct 2022 gilt crash. Bets for the BoE hiking rates to 6.5% are rising to about 40%. Equities were under pressure as real yields drove yesterday’s move. The EuroStoxx50 eased 0.92%, Wall Street ended 0.18-0.38% lower. The dollar profited. EUR/USD retreated from 1.0879 to 1.0854, DXY rose to 103.37. Sterling wiped out earlier losses to close stronger for the day. EUR/GBP finished at 0.8544.
Yields in the US add another few bps in Asian dealings this morning but we look at today’s and tomorrow’s data releases for yesterday’s technical break in US yields to be confirmed. The calendar today includes the US services ISM. The indicator unexpectedly fell to 50.3 in April. We expect the sector to remain above the neutral 50 barrier in May though (consensus 51.2). A slew of labour market data comes ahead of the official June payrolls report tomorrow. Markets brace themselves for the weekly jobless claims (245k expected), JOLTS (9885k) and ADP employment (245k). Releases more or less in line with analyst estimates could sustain the recent core bond yield increase. Cracking tough resistance in the US 10-y yield around 4.01%/4.08% may need payroll approval though. Potential negative spillovers to stock markets, which are already under pressure in Asian dealings, may further support the USD with first resistance in EUR/USD located at around 1.08.
News and views
The Hungarian forint suffered a significant setback yesterday with EUR/HUF closing at 381.50 from an open at 375. From a technical point of view, the pair closed above the upper end of the sideways trading channel in place since April (EUR/HUF 368-380). The Polish zloty and Czech koruna were in the defensive as well. One driver they have in common is the divergence between central bank policy with the core (EMU/US) still on a hiking path (& real rates rising) and regional markets placing the emphasis on rate cuts as a next step. On a country-level, there is some nervousness in the run-up to Friday’s approval of the 2024 budget. The state’s fiscal council said that next year’s plan was “stretched” and will likely need an overhaul. Concerns about the deteriorating fiscal position and the ongoing battle with the EU over frozen grants and loans (€30bn) in the corruption and rule of law quarrel are becoming top of mind for investors.
The quarterly survey from the British Chamber of Commerce revealed that 45% of UK companies expects to lift prices over the next three months. That’s down from 55% in the previous survey and the first <50% figure since 2021. Wage pressures are now the main inflationary force for businesses, the BCC said, rather than energy or material costs. Later today, the Bank of England’s decision maker panel survey for June will be released and give an update on firms’ inflation expectations. Earlier this week, Citi/YouGov consumer survey found 1y ahead consumer inflation expectations rising from 4.7% to 5%.
USD/JPY Daily Outlook
Daily Pivots: (S1) 144.26; (P) 144.49; (R1) 144.91; More...
Intraday bias in USD/JPY is now on the downside with break of 55 4H EMA (now at 143.90). Correction from 145.06 is extending lower, but near term outlook will remain mildly bullish as long as 140.90 resistance turned support holds. On the upside, break of 145.06 will resume larger rise to 161.8% projection of 127.20 to 137.90 from 129.62 at 146.93.
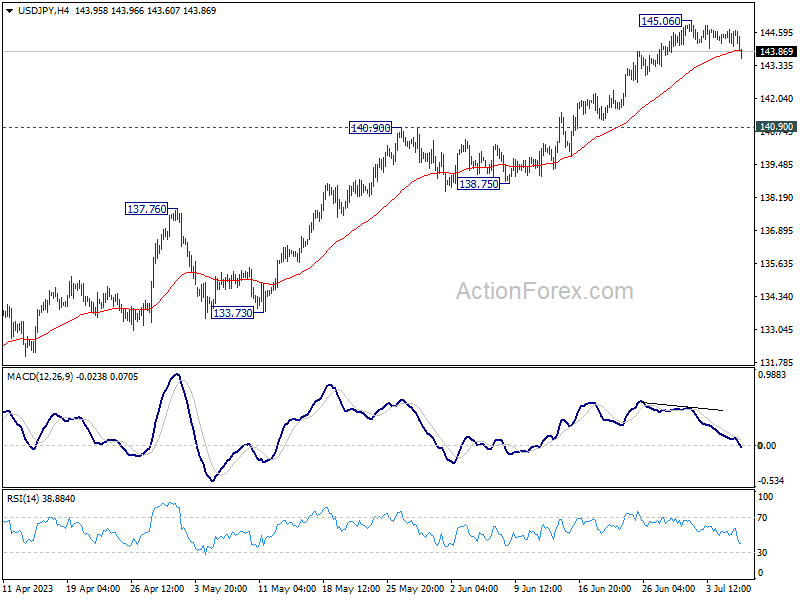
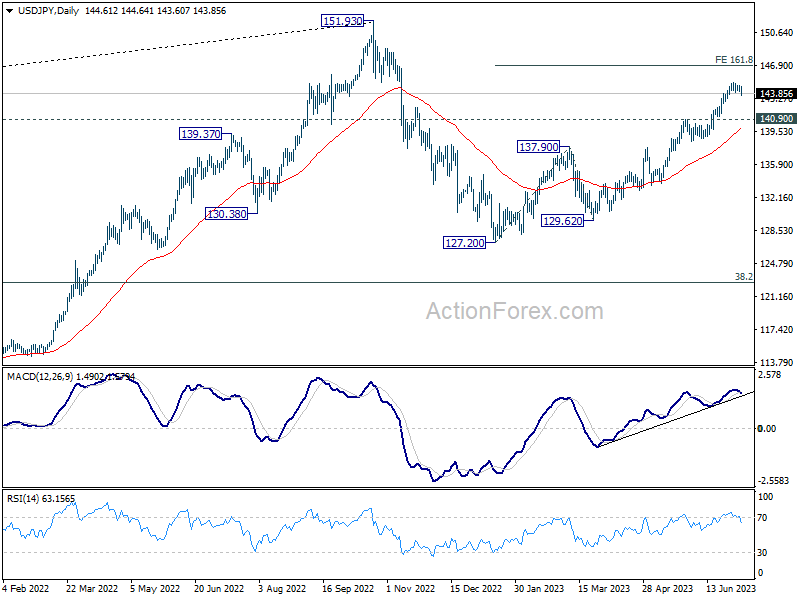
In the bigger picture, rise from 127.20 is currently seen as the second leg of the corrective pattern from 151.93 high. Further rally is expected as long as 138.75 support holds, to retest 151.93. But strong resistance could be seen there to limit upside. Break of 138.75 will indicate the the third leg has started back towards 127.20.
USD/CHF Daily Outlook
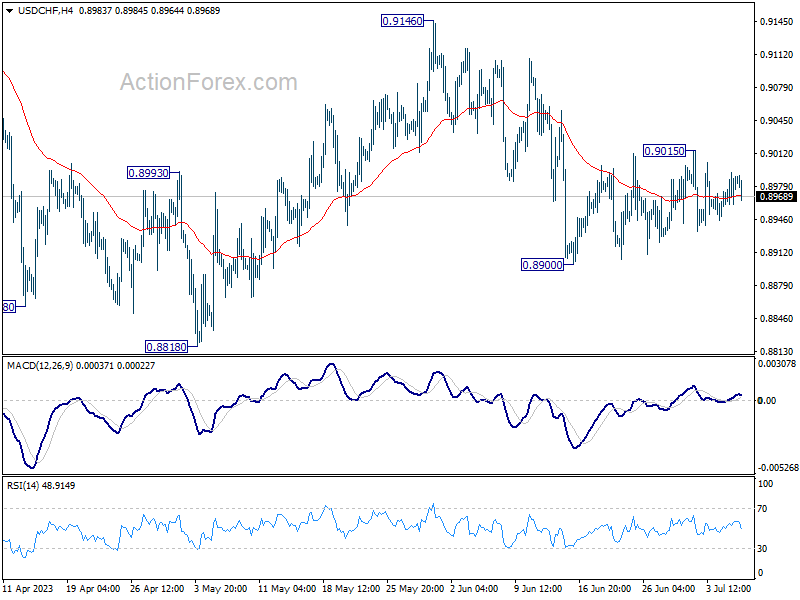
Daily Pivots: (S1) 0.8968; (P) 0.8982; (R1) 0.9001; More...
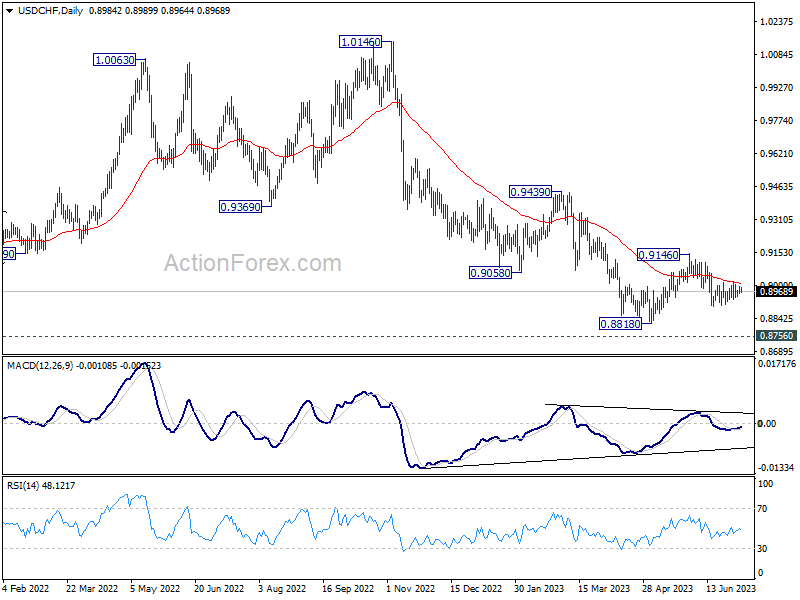
No change in USD/CHF's outlook as range trading continues. Intraday bias remains neutral and further decline is in favor. On the downside, break of 0.8900 will resume the fall from 0.9146 to 0.8818 low or below. On the upside, above 0.9015 will bring stronger rise towards 0.9146 resistance instead.
In the bigger picture, fall from 1.1046 (2022 high) is seen as a leg in the long term range pattern from 1.0342 (2016 high). While further decline cannot be ruled out, strong support is expected from 0.8756 long term support to bring reversal. Firm break of 0.9146 resistance should confirm medium term bottoming.
GBP/USD Daily Outlook
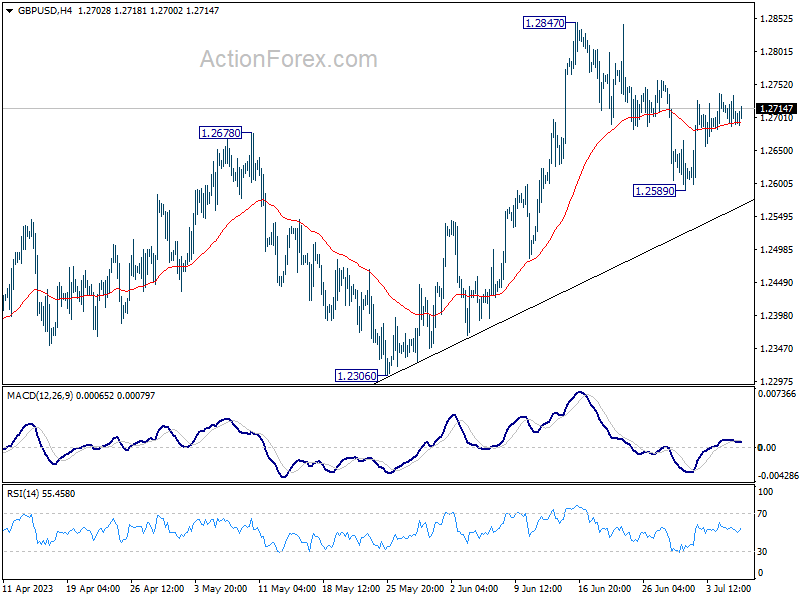
Daily Pivots: (S1) 1.2683; (P) 1.2709; (R1) 1.2730; More...
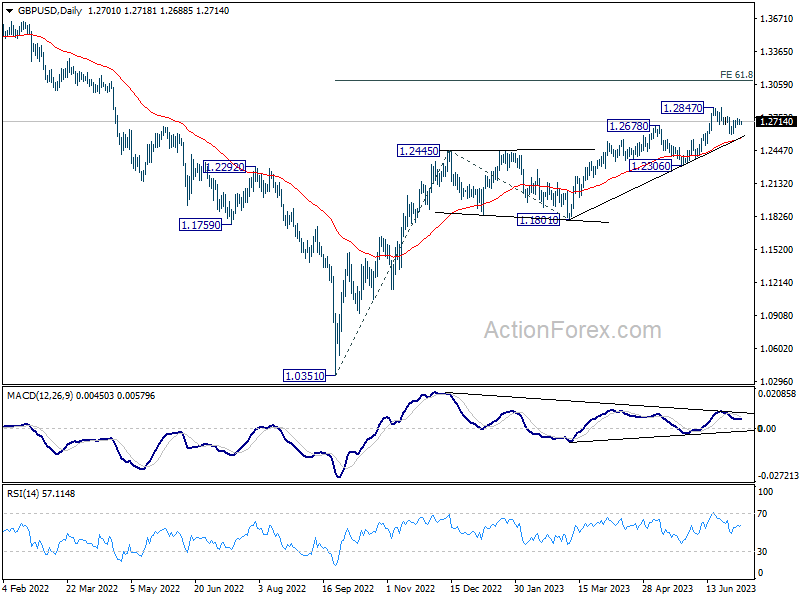
Intraday bias in GBP/USD is turned neutral first as recovery from 1.2589 lost momentum. On the upside, firm break of 1.2847 will resume larger up trend from 1.0351 to 61.8% projection of 1.0351 to 1.2445 from 1.1801 at 1.3095. On the downside, though, break of 1.2589 will extend the fall from 1.2847 to 55 D EMA (now at 1.2558).
In the bigger picture, the strong support from 55 W EMA (now at 1.2341) is a medium term bullish sign. Outlook will stay bullish as long as 1.2306 support holds. Rise from 1.0351 medium term bottom (2022 low) is expected to extend further to retest 1.4248 key resistance (2021 high).
EUR/USD Daily Outlook
Daily Pivots: (S1) 1.0834; (P) 1.0871; (R1) 1.0891; More...
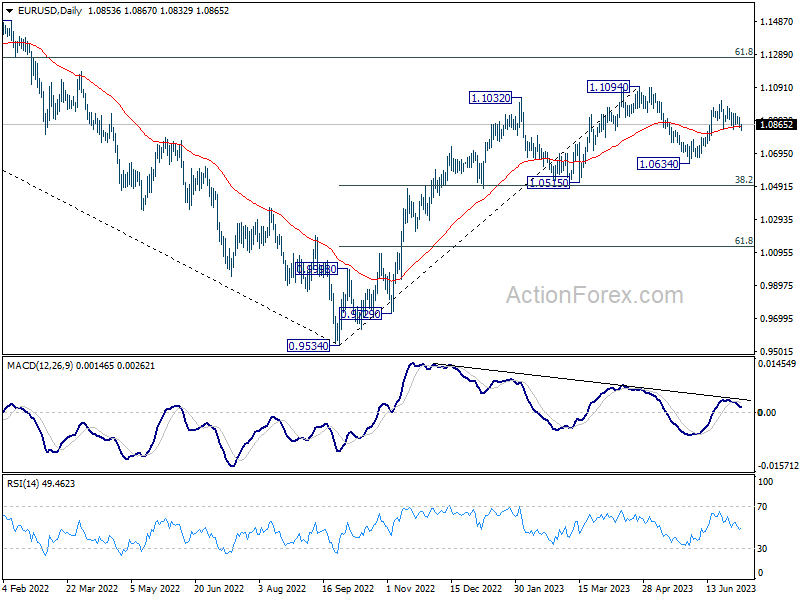
EUR/USD recovered ahead of 1.0834 support and stays in range trading. Intraday bias remains neutral for the moment and further rally is in favor. On the upside, break of 1.1011 will resume the rise from 1.0634 and target 1.1094 resistance. Decisive break there will resume larger up trend from 0.9534 to 1.1273 fibonacci level. However, firm break of 1.0834 will turn bias to the downside for 1.0634 support instead.
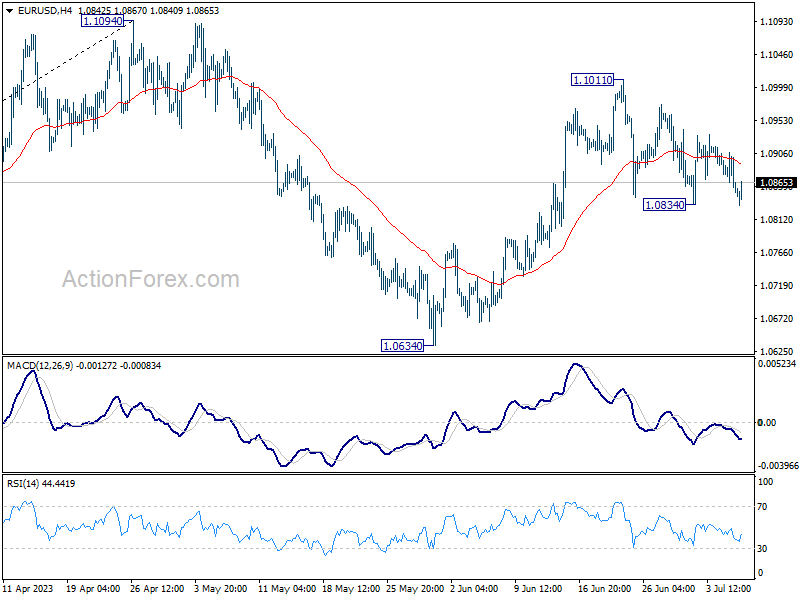
In the bigger picture, as long as 1.0515 support holds, rise from 0.9534 (2022 low) would still extend higher. Sustained break of 61.8% retracement of 1.2348 (2021 high) to 0.9534 at 1.1273 will solidify the case of bullish trend reversal and target 1.2348 resistance next (2021 high).