Sample Category Title
EUR/USD Daily Outlook
Daily Pivots: (S1) 1.0834; (P) 1.0871; (R1) 1.0891; More...
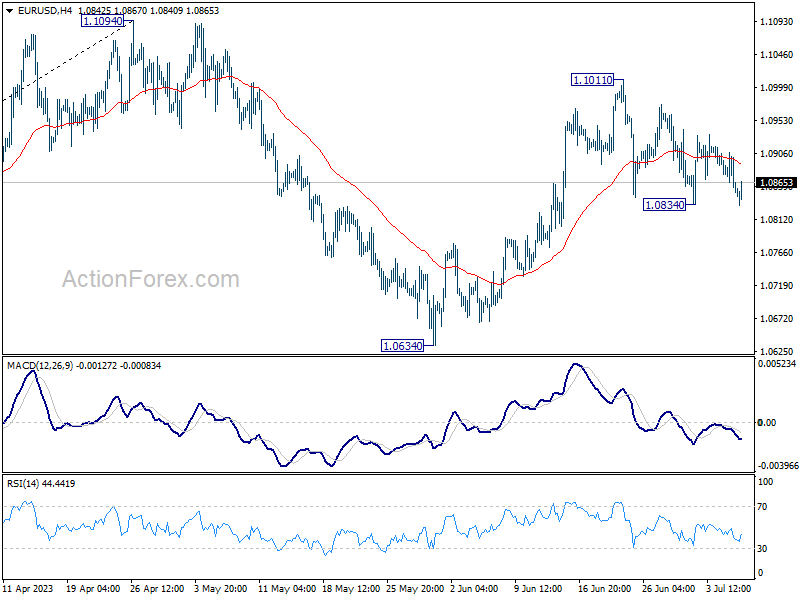
EUR/USD recovered ahead of 1.0834 support and stays in range trading. Intraday bias remains neutral for the moment and further rally is in favor. On the upside, break of 1.1011 will resume the rise from 1.0634 and target 1.1094 resistance. Decisive break there will resume larger up trend from 0.9534 to 1.1273 fibonacci level. However, firm break of 1.0834 will turn bias to the downside for 1.0634 support instead.
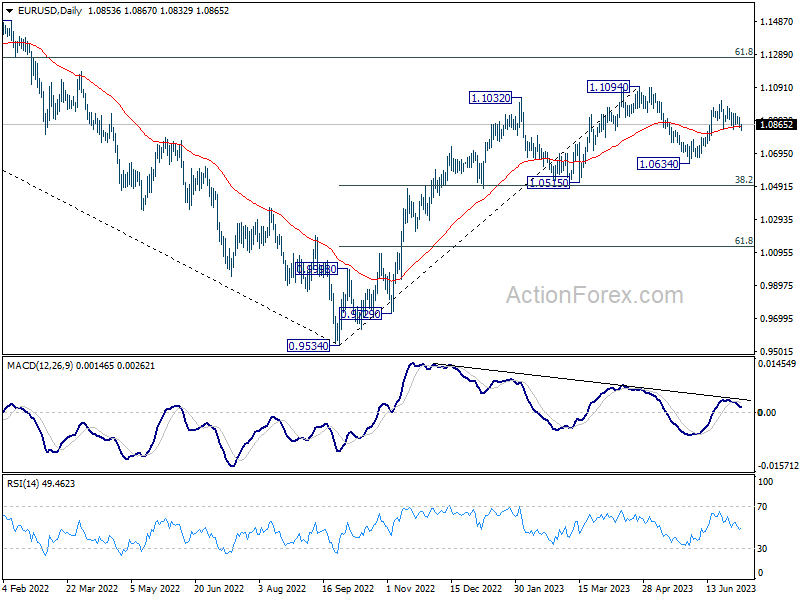
In the bigger picture, as long as 1.0515 support holds, rise from 0.9534 (2022 low) would still extend higher. Sustained break of 61.8% retracement of 1.2348 (2021 high) to 0.9534 at 1.1273 will solidify the case of bullish trend reversal and target 1.2348 resistance next (2021 high).
AUD/USD Daily Report
Daily Pivots: (S1) 0.6639; (P) 0.6668; (R1) 0.6685; More...
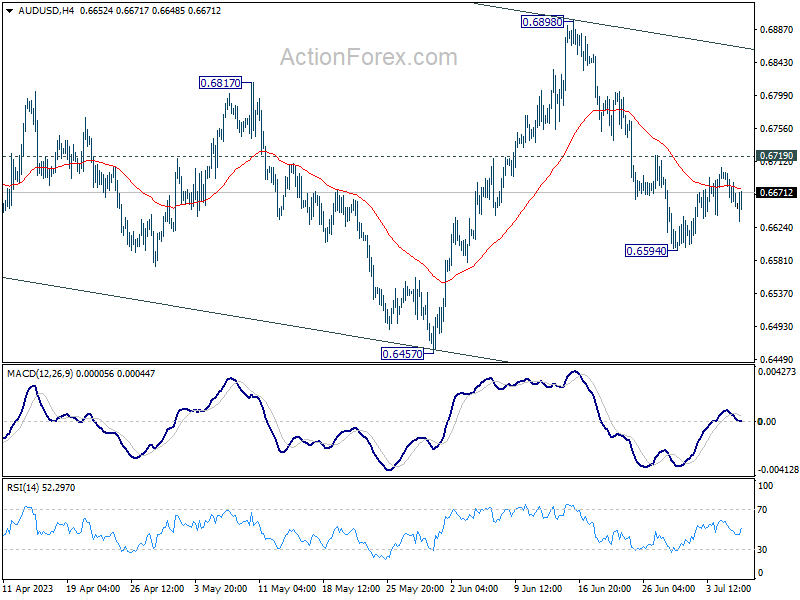
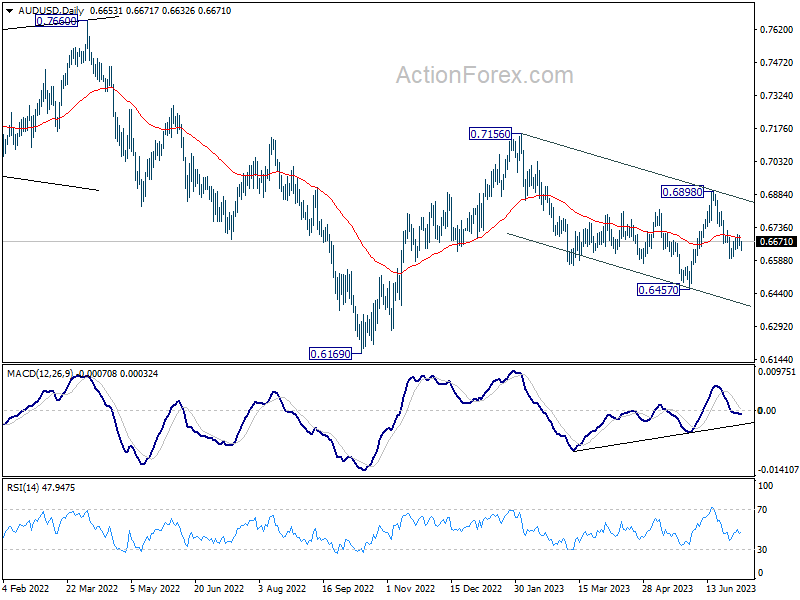
Intraday in AUD/USD remains neutral at this point as sideway trading continues above 0.6594. With 0.6710 resistance intact, further decline is in favor. On the downside, break of 0.6594 will resume the decline from 0.6898 to 0.6457 support next. Nevertheless, firm break of 0.6719 will turn bias back to the upside for stronger rebound.
In the bigger picture, price actions from 0.7156 are seen as a correction to the rebound from 0.6169 only, rather than part of larger down trend from 0.8006 (2021 high). Break of 0.6457 could be seen but downside should be contained above 0.6169. This will now remain the favored case as high as 0.6898 resistance holds. Nevertheless, break of 0.6898 resistance will argue that rise form 0.6169 is ready to resume through 0.7156.
USD/CAD Daily Outlook
Daily Pivots: (S1) 1.3238; (P) 1.3265; (R1) 1.3311; More....
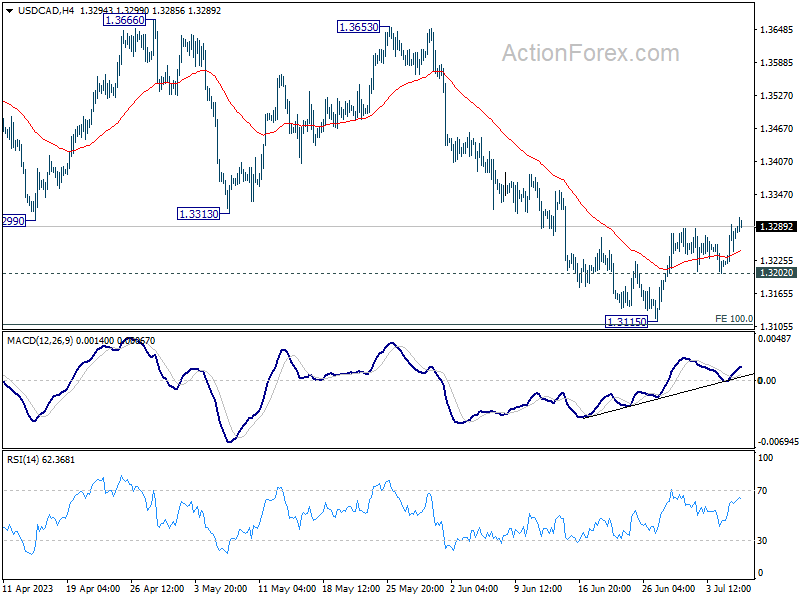
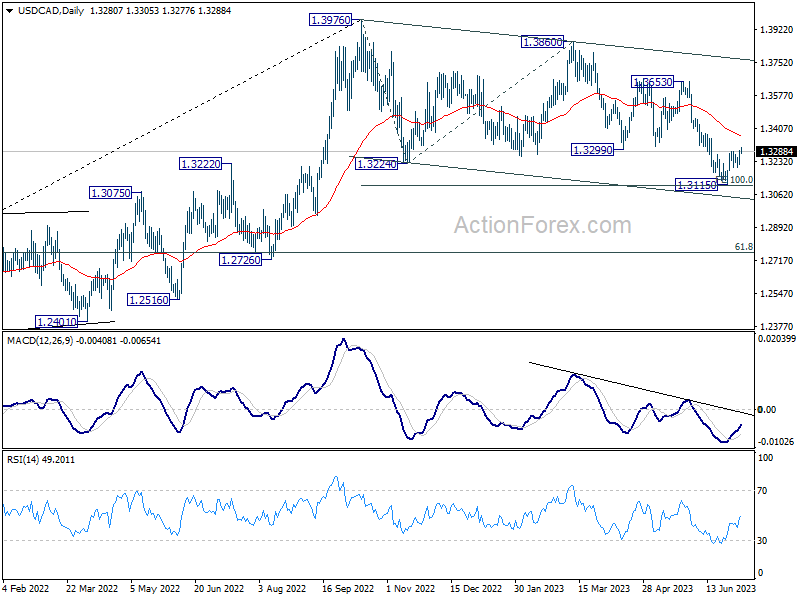
Intraday bias in USD/CAD remains on the upside as rebound from 1.3115 is extending. Further rally should be seen to 55 D EMA (now at 1.3369). On the downside, break of 1.3202 minor support will turn bias back to the downside for retesting 1.3115 low instead.
In the bigger picture, price actions from 1.3976 are still viewed as a correction to up trend from 1.2005 (2021 low). Risk will stay on the downside as long as 1.3299 support turned resistance holds. Next target is 61.8% retracement of 1.2005 to 1.3976 at 1.2758. However, sustained trading above 1.3229 will raise the chance that the correction has completed and turn focus back to 1.3653 resistance.
EUR/GBP Daily Outlook
Daily Pivots: (S1) 0.8532; (P) 0.8554; (R1) 0.8566; More...
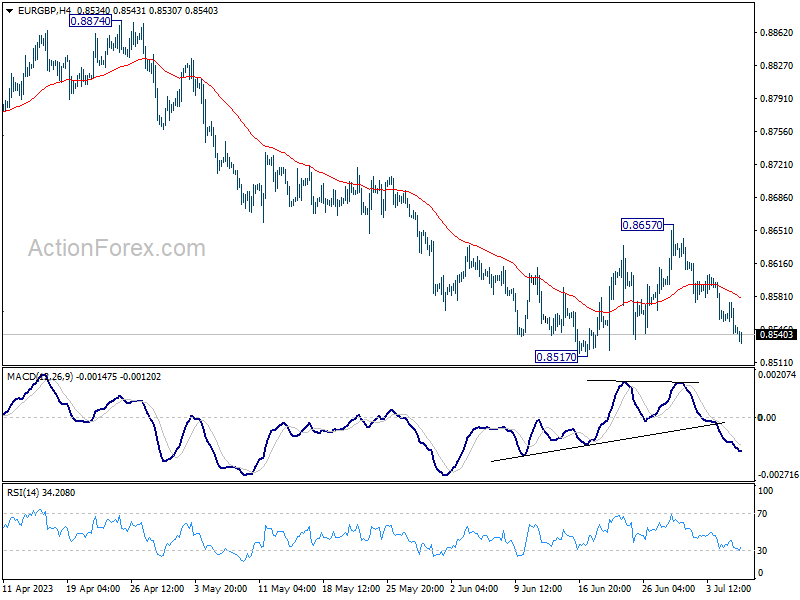
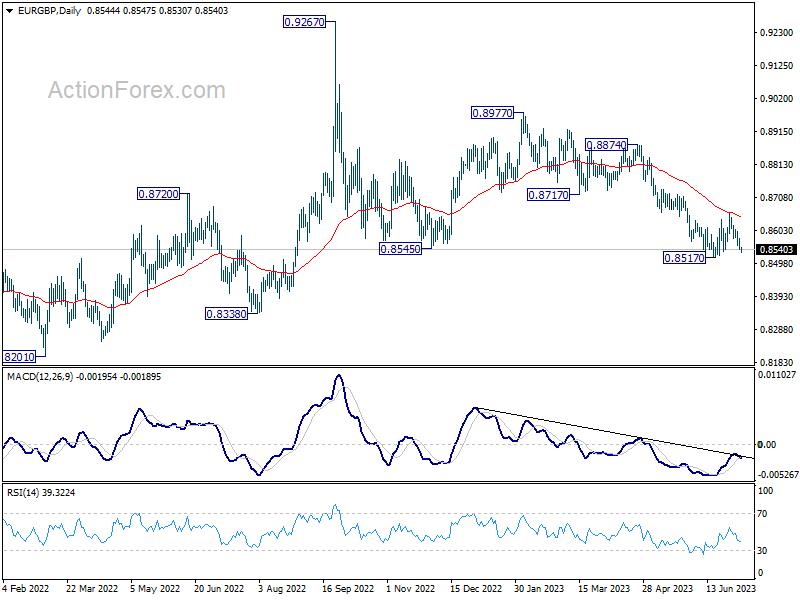
EUR/GBP is bounded in range above 0.8517 and intraday bias remains neutral. Also outlook stays bearish for deeper decline. Break of 0.8517 will resume the whole decline from 0.8977. On the upside, above 0.8657 resistance will resume the rebound from 0.8517 towards 0.8717 support turned resistance.
In the bigger picture, the down trend from 0.9267 (2022 high) is still in progress. It's seen as part of the long term range pattern from 0.9499 (2020 high). Deeper fall could be seen towards 0.8201 (2022 low). But strong support should be seen from there to bring reversal. This will now remain the favored case as long as 0.8717 support turned resistance holds.
EUR/AUD Daily Outlook
Daily Pivots: (S1) 1.6254; (P) 1.6304; (R1) 1.6359; More...
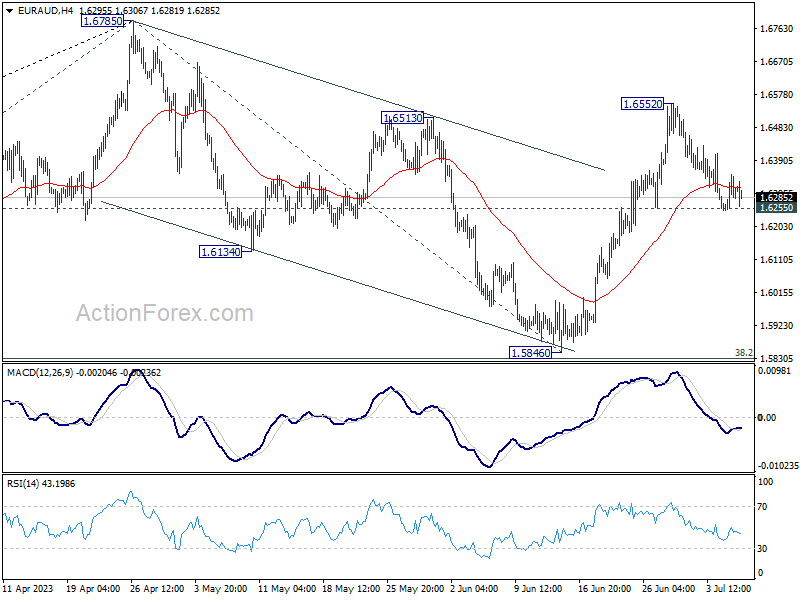
Outlook in EUR/AUD remains unchanged and intraday bias stays neutral. Further rally is expected with 1.6255 support intact. As noted before, correction from 1.6785 should have completed with three waves down to 1.5846. Above 1.6552 will target a retest on 1.6785 high next. Nevertheless, on the downside, firm break of 1.6255 will dampen this view and turn bias to the downside for 1.5846 support.
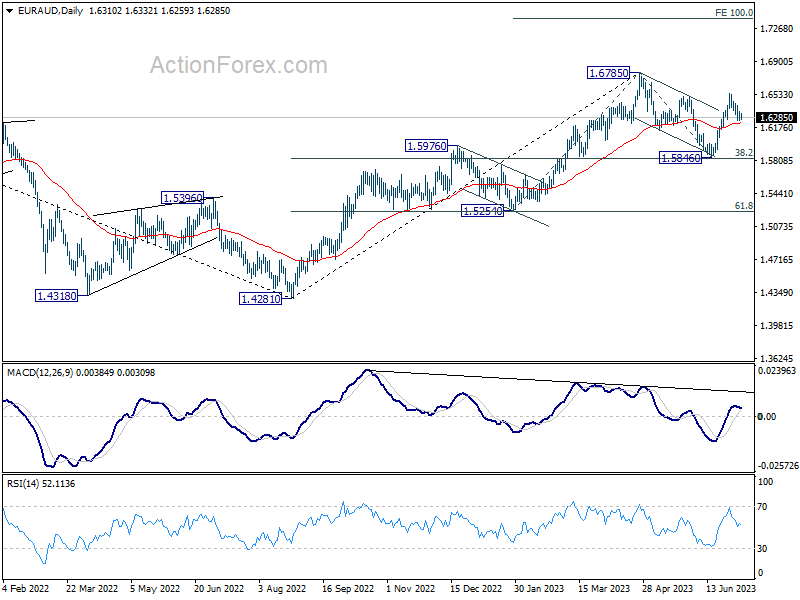
In the bigger picture, with 38.2% retracement of 1.4281 to 1.6785 at 1.5828 intact, rally from 1.4281 is still in progress. Firm break of 1.6785 will confirm rise resumption. Next target is 100% projection of 1.5254 to 1.6785 from 1.5846 at 1.7377. On the other hand, rejection by 1.6785 will extend the corrective pattern with another fall leg. But outlook will stay bullish as long as 1.5828 holds.
EUR/CHF Daily Outlook
Daily Pivots: (S1) 0.9743; (P) 0.9766; (R1) 0.9780; More...
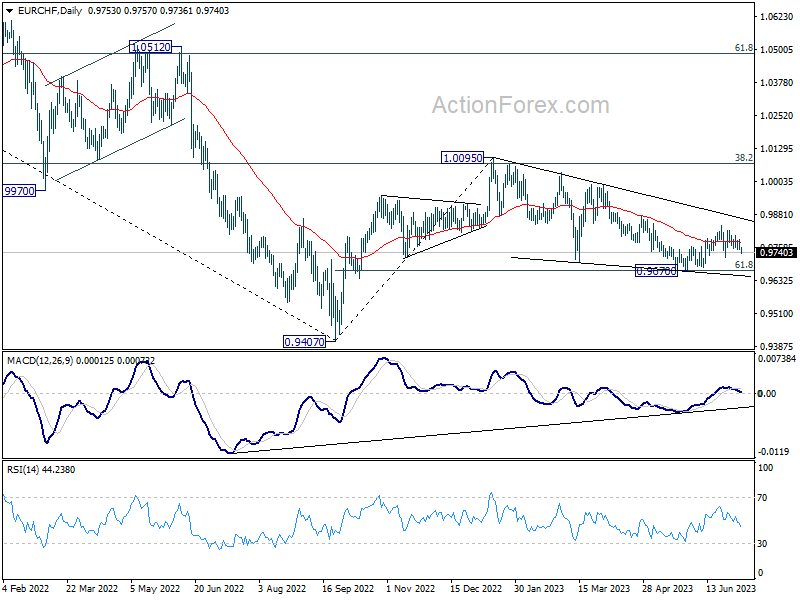
Intraday bias in EUR/CHF remains neutral as sideway trading continues. On the upside break of 0.9840 will resume the choppy rebound from 0.9670. That will also revive the case that whole corrective decline from 1.0095 has completed at 0.9670. Further rally should be seen to 0.9878 resistance next. However, sustained trading below 0.9670 will resume the whole fall from 1.0095.
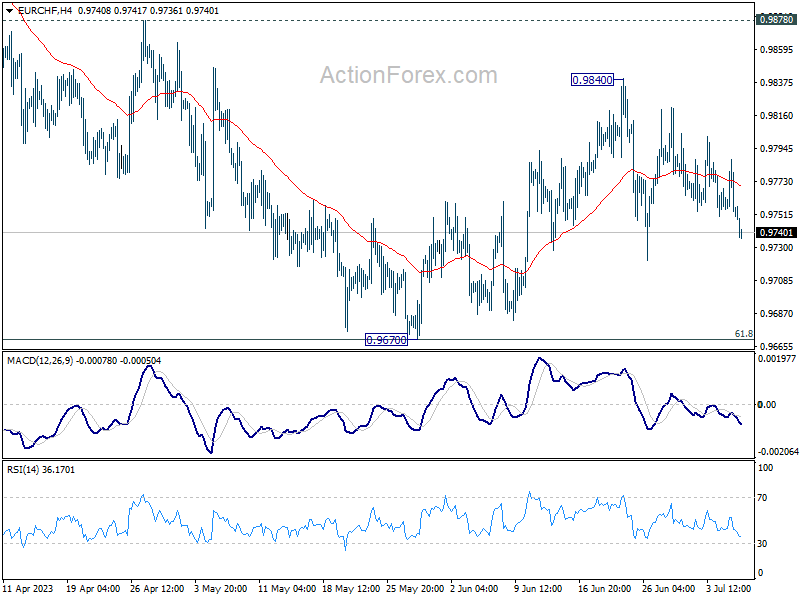
In the bigger picture, medium term outlook is staying bearish as the pair is capped below falling 55 W EMA (now at 0.9913). Down trend form 1.2004 (2018 high) is in favor to extend through 0.9407 at a later stage. Nevertheless, decisive break of 38.2% retracement of 1.1149 to 0.9407 will raise the chance of bullish trend reversal.
GBP/JPY Daily Outlook
Daily Pivots: (S1) 183.29; (P) 183.65; (R1) 184.15; More...
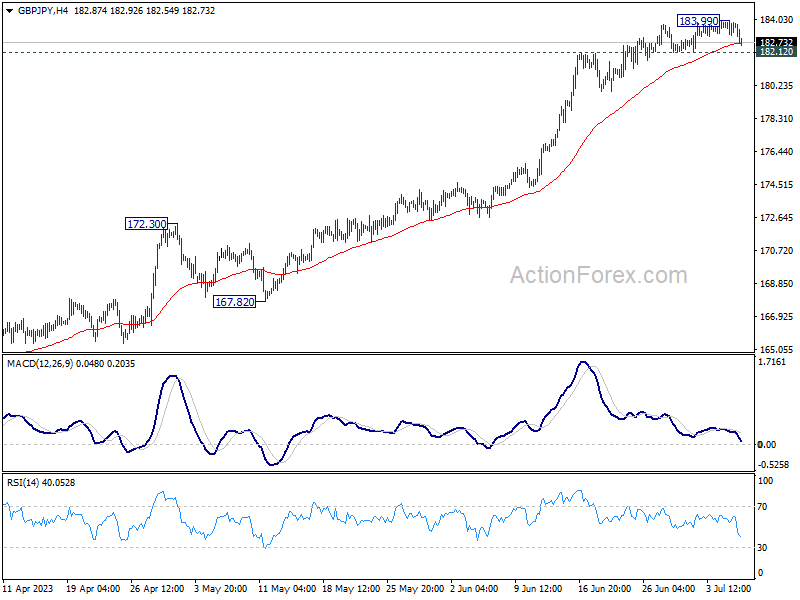
Intraday bias in GBP/JPY is turned neutral with current retreat. Break of 182.12 support will turn bias back to the downside for deeper correction. But downside should be contained above 172.30 resistance turned support to bring another rally. On the upside, break of 183.99 will resume larger up trend to 138.2% projection of 148.93 to 172.11 from 155.33 at 187.36.
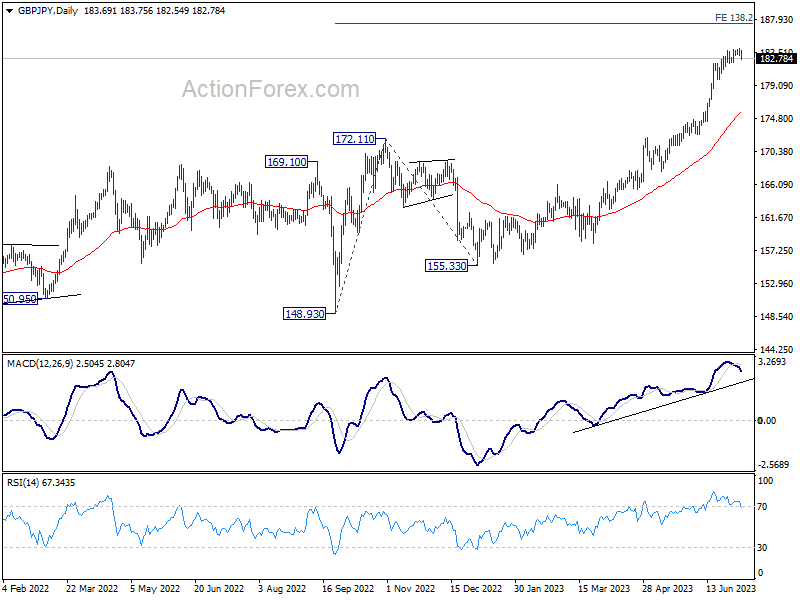
In the bigger picture, up trend from 123.94 (2020 low) is extending. Next target is 195.86 (2015 high). For now, medium term outlook will remain bullish as long as 172.11 resistance turned support holds, even in case of deep pull back.
US Crude Jumps Above 50-DMA
Minutes from the Federal Reserve’s (Fed) latest policy meeting were more hawkish than expected. The minutes revealed that some officials preferred another 25bp hike right away instead of a pause. Almost all of them said that additional hiking would likely be appropriate, and the forecasts showed that they also expect mild recession.
The minutes came to confirm how serious the Fed is in further tightening monetary conditions, and boosted the Fed hike expectations. The US 2-year yield came very close to 5%, the stocks fell, but very slightly. The S&P500 closed the session just 0.20% lower, while Nasdaq 100 gave back only 0.03%. The US dollar gained however, the EURUSD slipped below its 50-DMA, as the Eurozone services PMI fell short of expectations. The June number still hinted at expansion, but the composite PMI slipped into the contraction zone for the first time since January, hinting that activity in Eurozone is slowing because of tightening monetary conditions in the Eurozone as well. On the inflation front, the producer prices fell 1.5% y-o-y in May, the first ever deflation since February 2021. The expectation for the 12-month inflation in EZ fell to 3.9% in May. It’s still twice the ECB’s 2% policy target, but it’s coming down slowly. And the trajectory is certainly more important than the number itself.
Moving forward, further opinion divergence will likely appear along with softening data, but the ECB will continue hiking the rates because officials will be too afraid to stop hiking too early. And as the economic picture worsens, the credit conditions become tighter, the cheap loans dry up and the post-pandemic positivity on peripheral countries fade, we will likely see the yield spread between the core and periphery widen. And the latter could have a negative impact on the single currency’s positive trajectory against the US dollar.
Due today, the ADP report is expected to reveal that the US economy added around 228K new private jobs in June, while the JOLTS is expected to have slipped below 10 mio job openings in May.
US crude clears important resistance
US crude cleared the all-important 50-DMA yesterday. The barrel of US crude trades a touch below the $72bp level this morning. The next important resistance is seen near $73.50, where stands the 100-DMA.
There is a big fight going on between OPEC – who is ready to do anything to push oil prices above $80pb, and the oil bears, who aggressively fight OPEC and sell any price peak that follows an OPEC-led rally. But the persistent production cuts will at some point become a fundamental problem. And the longer the bears fight OPEC and the more OPEC cuts production, the more severe the impact on global oil glut, and the higher the risk of a decent jump in oil prices.
Yet another rally in energy prices would again interfere with the central banks’ fight against inflation and get them to further tighten their policies. And that would apply further pressure on global economy and on asset prices.
A soothing argument is that energy prices cannot rally infinitely when the world is so sensitive to inflation because recession worries will rapidly wane the energy rally and settle the prices at reasonable levels. So even with the most optimistic scenario for oil, there is little chance we see oil prices spike above $90pb. Maybe we could get to the $80bp that will make Saudis happy, though.
Technical Outlook and Review
DXY:
The DXY (U.S. Dollar Index) chart demonstrates a bullish momentum, with price above a major ascending trendline and the bullish Ichimoku cloud.
There is potential for the price to drop further towards the 1st support level in the short term before bouncing and rising towards the 1st resistance level.
The 1st support at 102.75 is an overlap support, and the 2nd support at 102.33 also acts as an overlap support.
On the upside, the 1st resistance at 103.43 is an overlap resistance, with the presence of the 61.80% Fibonacci Projection. Additionally, the 2nd resistance at 103.86 is a pullback resistance and aligns with the 78.60% Fibonacci Retracement.

EUR/USD:
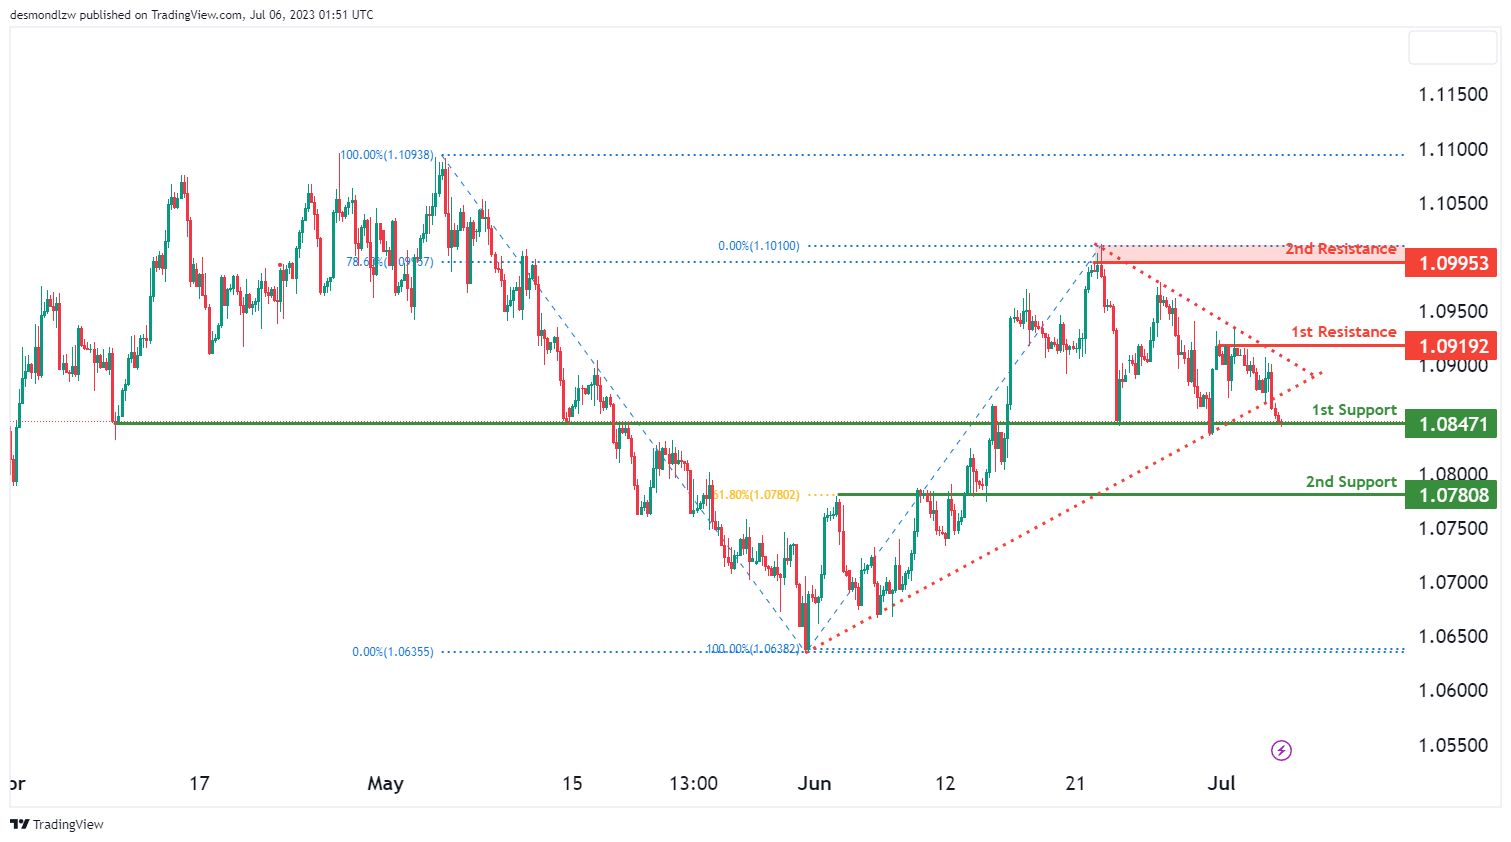
The EUR/USD chart exhibits a bearish momentum, with the price breaking below an ascending support line and being below a major descending trend line.
There is potential for the price to rise towards the 1st resistance in the short term before reversing off it and dropping towards the 1st support.
The 1st support at 1.0847 is an overlap support, and the 2nd support at 1.0780 also acts as an overlap support, coinciding with the 61.80% Fibonacci Retracement.
On the upside, the 1st resistance at 1.0919 represents a multi-swing high resistance. Additionally, the 2nd resistance at 1.0995 is a swing high resistance, aligned with the 78.60% Fibonacci Retracement.
EUR/JPY:
The EUR/JPY instrument currently demonstrates a bearish overall momentum. This movement is primarily due to the price breaking below an ascending support line, thus triggering a potential bearish move.
It’s plausible that the price might follow a bearish continuation towards the 1st support at 155.25, considered strong due to its overlap support. Additionally, the 2nd support is at 154.10 and is viewed as robust because of its swing low support attribute.
Conversely, the 1st resistance is at 156.81 and is deemed significant due to an overlap resistance. Lastly, the 2nd resistance is located at 157.96 and is noted for being a multi-swing high resistance, potentially posing a significant barrier to the price’s upward movement.

EUR/GBP:
The EUR/GBP chart currently demonstrates a bearish momentum, suggesting a potential continuation of the downward movement in the market.
There is a possibility for a bearish continuation towards the 1st support level at 0.8524, which is considered a multi-swing low support. Additionally, the 2nd support level at 0.8493 acts as an overlap support, further indicating potential downside strength.
On the upside, the 1st resistance level at 0.8577 represents an overlap resistance, while the 2nd resistance level at 0.8627 also acts as an overlap resistance.

GBP/USD:
The GBP/USD chart currently demonstrates a bearish momentum, despite being above a major ascending trend line that suggests potential bullish momentum.
There is a possibility for a bearish continuation towards the 1st support level at 1.2673, which is an overlap support and coincides with the 50% Fibonacci Retracement. The 2nd support level at 1.2599 also acts as an overlap support and aligns with the 50% Fibonacci Retracement.
On the upside, the 1st resistance level at 1.2721 represents a multi-swing high resistance, with Fibonacci confluence from the 50% Fibonacci Retracement. Additionally, the 2nd resistance level at 1.2771 is a swing high resistance and coincides with the 78.60% Fibonacci Retracement.

GBP/JPY:
The GBP/JPY instrument is currently demonstrating a bearish momentum on the chart.Price could potentially continue its bearish momentum towards the 1st support level.
The 1st support is located at 182.153, which is considered good due to its overlap support. Additionally, the 2nd support at 180.046 is also favorable as it aligns with an overlap support. On the upside, the 1st resistance at 184.265 is significant as it corresponds to an overlap resistance.

USD/CHF:
The USD/CHF chart currently exhibits a neutral momentum, suggesting a lack of clear market direction.
There is potential for price to fluctuate between the 1st support level at 0.8907, which is a multi-swing low support, and the 1st resistance level at 0.9013, a multi-swing high resistance. Additionally, the 2nd support level at 0.8861 acts as a pullback support, with Fibonacci confluence from the -27% Fibonacci Expansion and the 161.80% Fibonacci Extension. The 2nd resistance level at 0.9111 represents a multi-swing high resistance and aligns with the 61.80% Fibonacci Projection.
Furthermore, the presence of a symmetrical triangle chart pattern indicates a period of consolidation. A breakout above the upper trendline suggests a bullish breakout, while a breakdown below the lower trendline may indicate a bearish breakdown.

USD/JPY:
The USD/JPY chart currently demonstrates a neutral momentum, indicating a lack of clear market direction.
There is potential for price to fluctuate between the 1st support level at 142.30, which is a pullback support with a 38.20% Fibonacci Retracement, and the 1st resistance level at 145.10, an overlap resistance with a 50% Fibonacci Retracement. Additionally, the 2nd support level at 138.08 acts as an overlap support with a 23.60% Fibonacci Retracement, while the 2nd resistance level at 146.67 coincides with a 78.60% Fibonacci Retracement.

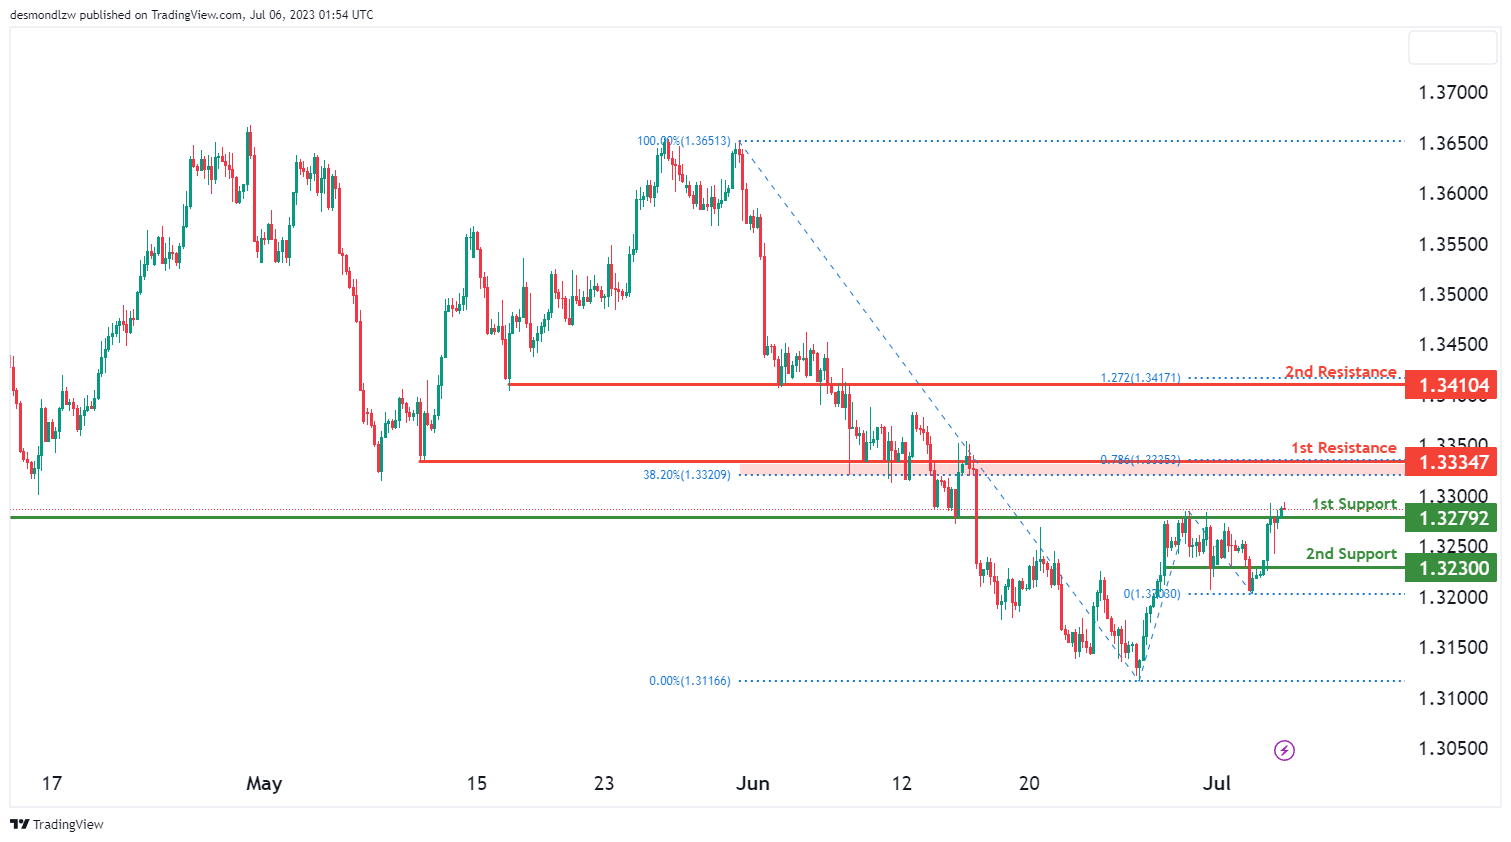
USD/CAD:
The USD/CAD chart currently exhibits a weak bearish momentum with low confidence, suggesting a lack of clear direction in the market.
There is a potential for price to have a bearish reaction off the 1st resistance level at 1.3334, which is a pullback resistance with a 38.20% Fibonacci Retracement and a 78.60% Fibonacci Projection. This could lead to a drop towards the 1st support level at 1.3279, identified as an overlap support.
Additionally, the 2nd support level at 1.3230 acts as a pullback support.
On the upside, the 2nd resistance level at 1.3410 is an overlap resistance and coincides with a 100% Fibonacci Projection.
AUD/USD:
The AUD/USD chart currently exhibits a bullish momentum, suggesting a potential upward movement in the market.
There is a possibility for a bullish bounce off the 1st support level at 0.6639, which is an overlap support and aligns with a 61.80% Fibonacci Retracement. This could lead the price towards the 1st resistance level at 0.6717, identified as an overlap resistance with a 38.20% Fibonacci Retracement.
Additionally, the 2nd support level at 0.6597 acts as a swing low support, while the 2nd resistance level at 0.6799 represents a multi-swing high resistance and coincides with a 61.80% Fibonacci Retracement.

NZD/USD
The NZD/USD chart currently demonstrates a bearish momentum, indicating a potential downward movement in the market.
There is a possibility for a bearish continuation towards the 1st support level at 0.6153, which is an overlap support and aligns with a 38.20% Fibonacci Retracement. Additionally, the 2nd support level at 0.6114 acts as an overlap support and coincides with a 61.80% Fibonacci Retracement.
On the upside, the 1st resistance level at 0.6211 represents a multi-swing high resistance with a 38.20% Fibonacci Retracement. Furthermore, the 2nd resistance level at 0.6246 is a swing high resistance and exhibits a 78.60% Fibonacci Projection.

DJ30:
The DJ30 (Dow Jones Industrial Average) chart currently exhibits a bearish overall. It’s possible that the price might follow a bearish continuation towards the 1st support, which is at 33958.49. This support level is considered strong due to an overlap support and a 61.80% Fibonacci Retracement.
Furthermore, the 2nd support level is at 33633.41 and is deemed strong due to its nature as a swing low support. On the other hand, the 1st resistance level is found at 34534.35, making it a significant barrier owing to its status as a multi-swing high resistance.
The 2nd resistance is even more formidable at 34803.92, primarily due to its swing high resistance attribute, a 61.80% Fibonacci Projection, and a 127.20% Fibonacci Extension, indicating a robust Fibonacci confluence.

GER30:
The GER30 (DAX) chart currently showcases a bullish overall momentum. There’s a possibility that the price might experience a bullish bounce off the 1st support and move towards the 1st resistance.
The 1st support is placed at 15902.63, and it’s considered strong due to the overlap support and a 61.80% Fibonacci Retracement. Furthermore, the 2nd support is found at 15674.94 and is deemed reliable due to its status as an overlap support and a 78.60% Fibonacci Projection.
Conversely, the 1st resistance is situated at 16108.30, and it’s notable for its overlap resistance. Finally, the 2nd resistance stands at 16214.64, recognized as a swing high resistance, posing a significant barrier to the price’s upward movement.

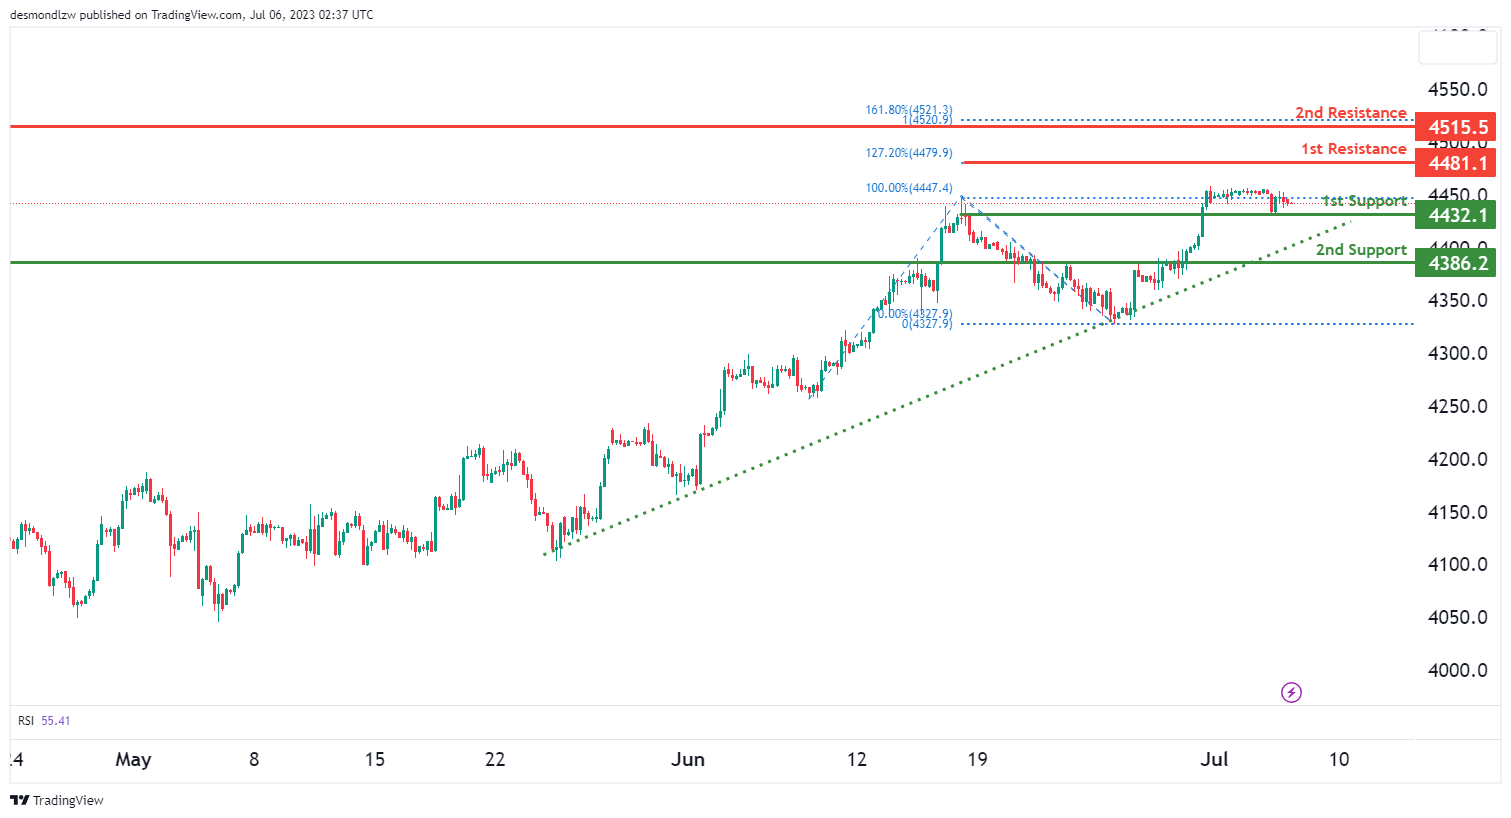
US500
The US500 (S&P 500) index currently exhibits a bullish momentum, with the price above a major ascending trend line indicating the potential for further upward movement.
There is a possibility of a bullish bounce off the 1st support level at 4432.1, which is a strong pullback support, leading the price towards the 1st resistance level at 4481.1, notable for its 127.20% Fibonacci Extension.
The 2nd support level at 4386.2 provides robust support as an overlap support, while the 2nd resistance level at 4515.5 acts as a significant hurdle with its status as a swing high resistance and a 161.80% Fibonacci Extension. This level could present a substantial barrier to the price’s upward advancement.
BTC/USD:
The BTC/USD chart currently demonstrates a neutral momentum, indicating a lack of clear direction in the market. The price has the potential to fluctuate between the 1st resistance level at 31457 and the 1st support level at 29826.
The 1st resistance level at 31457 is characterized by multi-swing high resistance and a 61.80% Fibonacci projection. The 2nd resistance level at 32252 represents a swing high resistance.

ETH/USD:
The ETH/USD instrument currently showcases a bullish overall momentum. The price could potentially experience a bullish bounce off the 1st support, which is at 1893.23, and head towards the 1st resistance. This support level is considered robust due to an overlap support, a 50% Fibonacci Retracement, and a 61.80% Fibonacci Projection, indicating a Fibonacci confluence.
Moreover, the 2nd support is at 1826.24 and is viewed as strong due to its nature as a multi-swing low support.
On the other hand, the 1st resistance is at 1974.61, which is considered significant due to its status as a multi-swing high resistance. Finally, the 2nd resistance is at 2017.96 and is noteworthy due to its swing high resistance, which could pose a considerable barrier to the price’s upward movement.

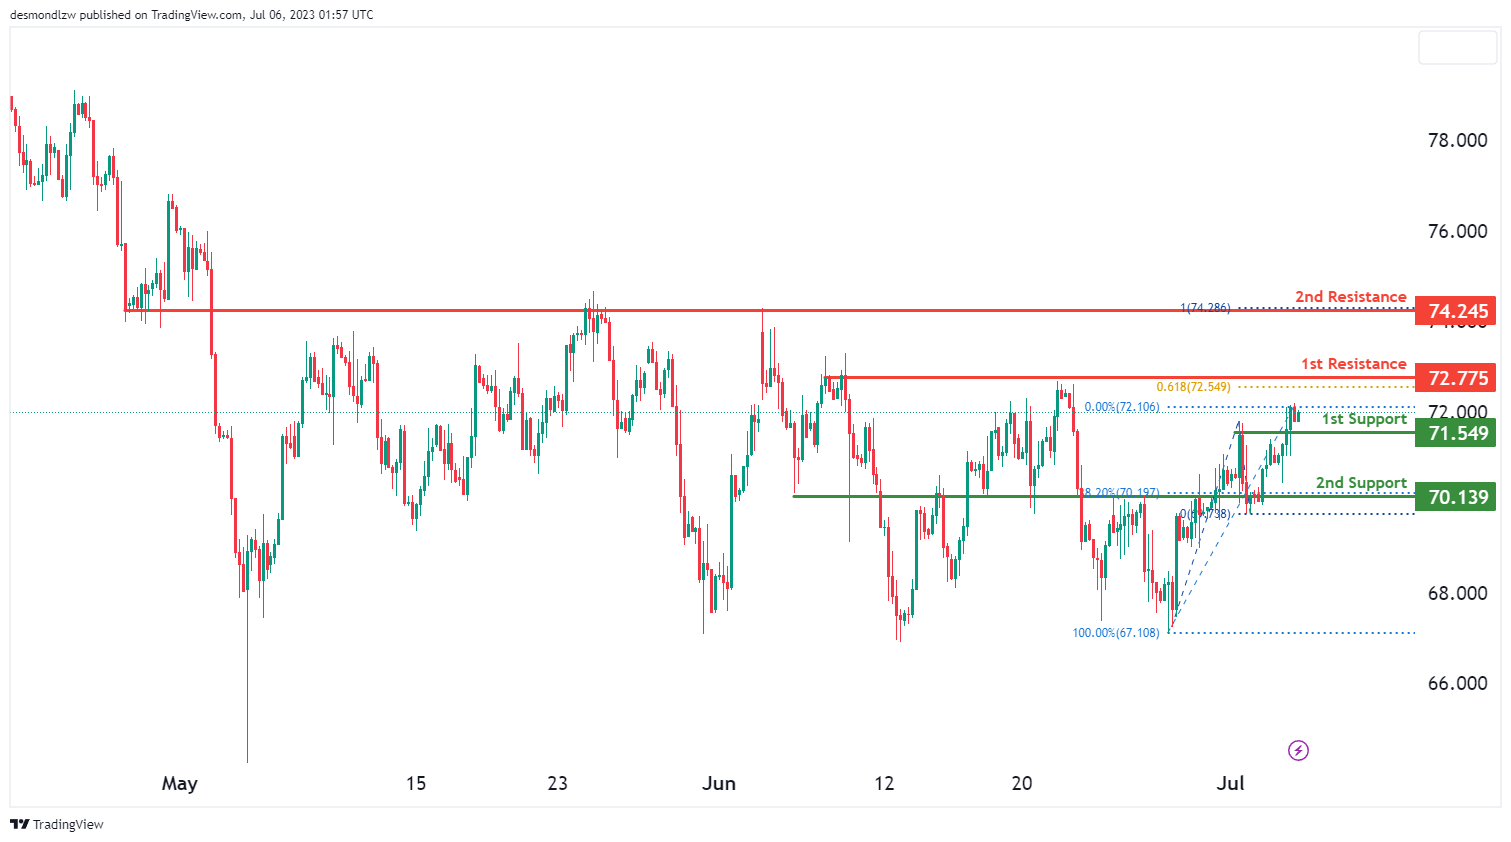
WTI/USD:
The WTI (Crude Oil) chart currently exhibits a bullish momentum, indicating a potential upward movement in the market.
There is a possibility for a bullish continuation towards the 1st resistance level at 72.77, which represents a multi-swing high resistance and aligns with a 61.80% Fibonacci Projection. Additionally, the 2nd resistance level at 74.24 acts as an overlap resistance and coincides with a 100% Fibonacci Projection.
On the downside, the 1st support level at 71.54 provides pullback support, while the 2nd support level at 70.13 acts as an overlap support and aligns with a 78.60% Fibonacci Retracement.
XAU/USD (GOLD):
The XAU/USD (Gold) chart currently demonstrates a bearish momentum, indicating a potential downward movement in the market.
There is a possibility for a short-term rise towards the 1st resistance level at 1932.11, which represents an overlap resistance and aligns with a 50% Fibonacci Retracement. However, the overall bearish momentum suggests a potential reversal from this resistance level, leading to a drop towards the 1st support level at 1913.73, identified as an overlap support.
Additionally, the 2nd support level at 1889.4 acts as another overlap support, providing further potential downside support. On the upside, the 2nd resistance level at 1953.53 represents a swing high resistance and coincides with a 78.60% Fibonacci Retracement.

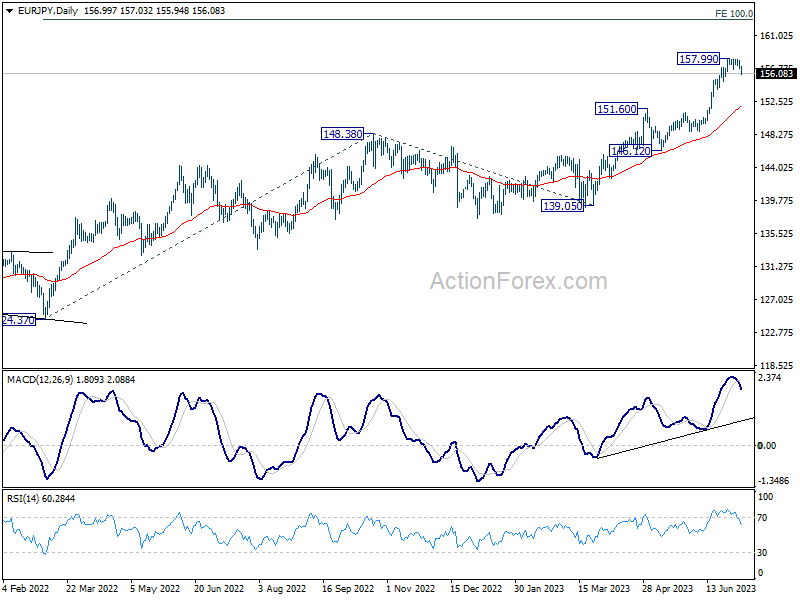
EUR/JPY Daily Outlook
Daily Pivots: (S1) 156.63; (P) 157.18; (R1) 157.56; More....
EUR/JPY's fall from 157.99 is extending lower today and intraday bias is now on the downside with strong break of 55 4H EMA. Deeper correction could be seen to 154.03 support or below. But overall outlook will stay bullish as long as 151.60 resistance turned support holds. Larger rally is still expected to resume through 157.99 after the correction completes.
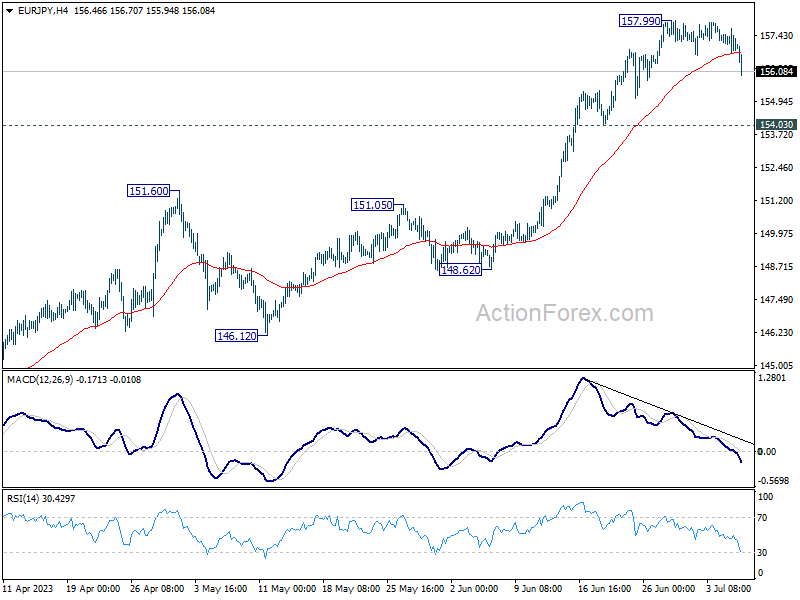
In the bigger picture, rise from 114.42 (2020 low) is in progress. Next target is 100% projection of 124.37 to 148.38 from 138.81 at 162.82. For now, medium term outlook will remain bullish as long as 151.60 resistance turned support holds, even in case of deep pull back.