

Sample Category Title
EUR/USD Holding at Key Support Zone Ahead of EU Inflation Data
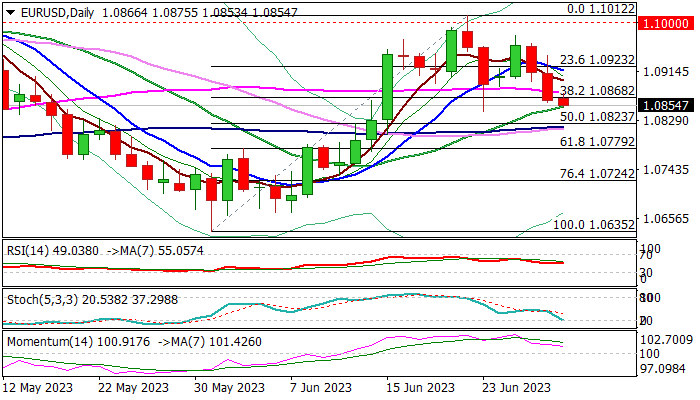
Bears are taking a breather early Friday and consolidating ahead of release of EU June inflation data.
The pair was down almost 0.9% in past two days, pressured by stronger dollar on solid US economic data which add to Fed’s hawkish stance.
Thursday’s close below important Fibo support at 1.0868 (38.2% of 1.0635/1.1012) generated initial bearish signal, which will look for verification on weekly close below this level, with violation of nearby supports at 1.0853/44 (20DMA / June 23 trough) top to strengthen bearish near-term stance and open way for deeper drop.
Daily studies weakened and Monday’s twist of daily cloud is magnetic, contributing to negative outlook, however, overall picture is still bullishly aligned (14-d momentum is in positive territory and price action remains above daily cloud), requiring caution, as bears may face headwinds at this zone.
EU annualized headline inflation is expected to drop further in June (5.6% f/c vs May 6.1%) and provide some relief, but core CPI, closely watched by the ECB, is expected to rise to 5.5% in June from 5.3% previous month, which keeps the policymakers alerted and contributes to signals that the central bank will remain on hiking path.
We will be watching the reaction at 1.0840/50 zone, which is expected to generate fresh direction signal.
Firm break lower to signal bearish continuation and expose targets at (1.0823 (daily Kijun-sen / 50% retracement of 1.0653/1.1012) and 1.0779 (Fibo 61.8%) in extension.
Conversely, failure to break lower would question near-term bears, with lift and close above 55DMA (1.0877) to ease downside pressure, but more work at the upside will be required (break above 10DMA at 1.0916) to signal reversal.
Res: 1.0868; 1.0877; 1.0916; 1.0976.
Sup: 1.0844; 1.0823; 1.0813; 1.0779.
GBPJPY Flatlines Near 7½-Year Peak
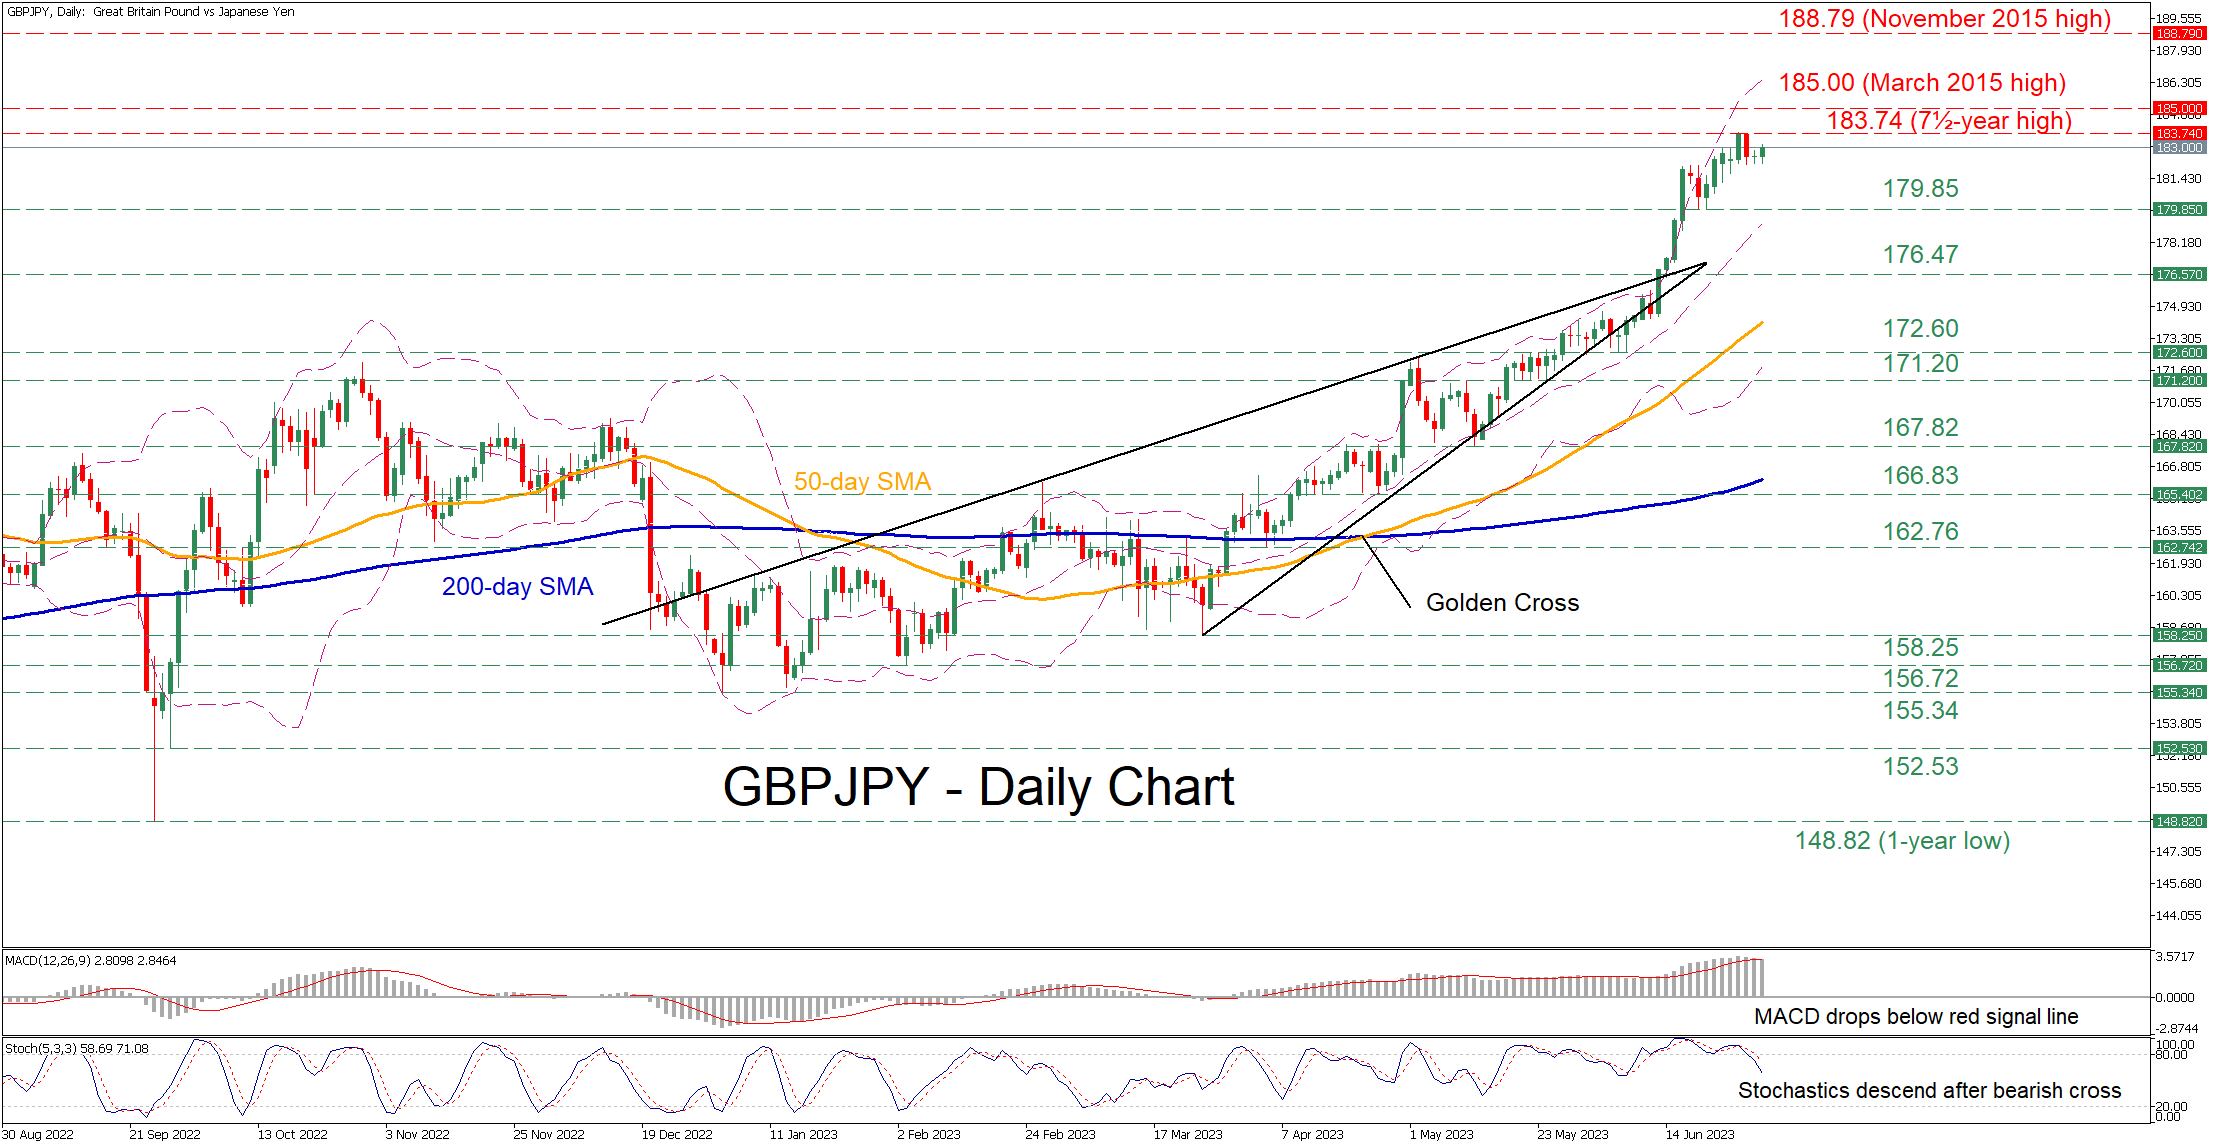
GBPJPY has been stuck in a prolonged uptrend since the beginning of the year, generating a structure of consecutive multi-year highs. In the near-term, the price seems to be consolidating near the 7½-year high of 183.74, appearing to be unable to extend its rally.
The momentum indicators currently suggest that bullish forces are waning. Specifically, the MACD dropped below its red trigger line but remains positive, while the stochastic oscillator is descending after exiting its oversold zone.
Should buying pressures fade and the price reverse lower, the recent support of 179.65 could act as the first line of defense. If that barricade fails, the spotlight could turn to 176.47 before the June low of 172.60 gets tested. Breaking below the latter, the pair could then face the May support of 171.20.
Alternatively, if the pair resumes its advance, the 7½-year high of 183.74 could prove to be the first hurdle for buyers to clear. Breaking above that wall, the price could ascend to post fresh multi-year highs, where the March 2015 peak of 185.00 could cap its upside. A violation of that zone could trigger a rally towards the November 2015 high of 188.79.
In brief, GBPJPY is consolidating near its multi-year highs as positive momentum seems to be fading. Therefore, the pair could adopt a sideways pattern or even experience a pullback before the bulls try to push the price higher.
Gold at a Crossroads
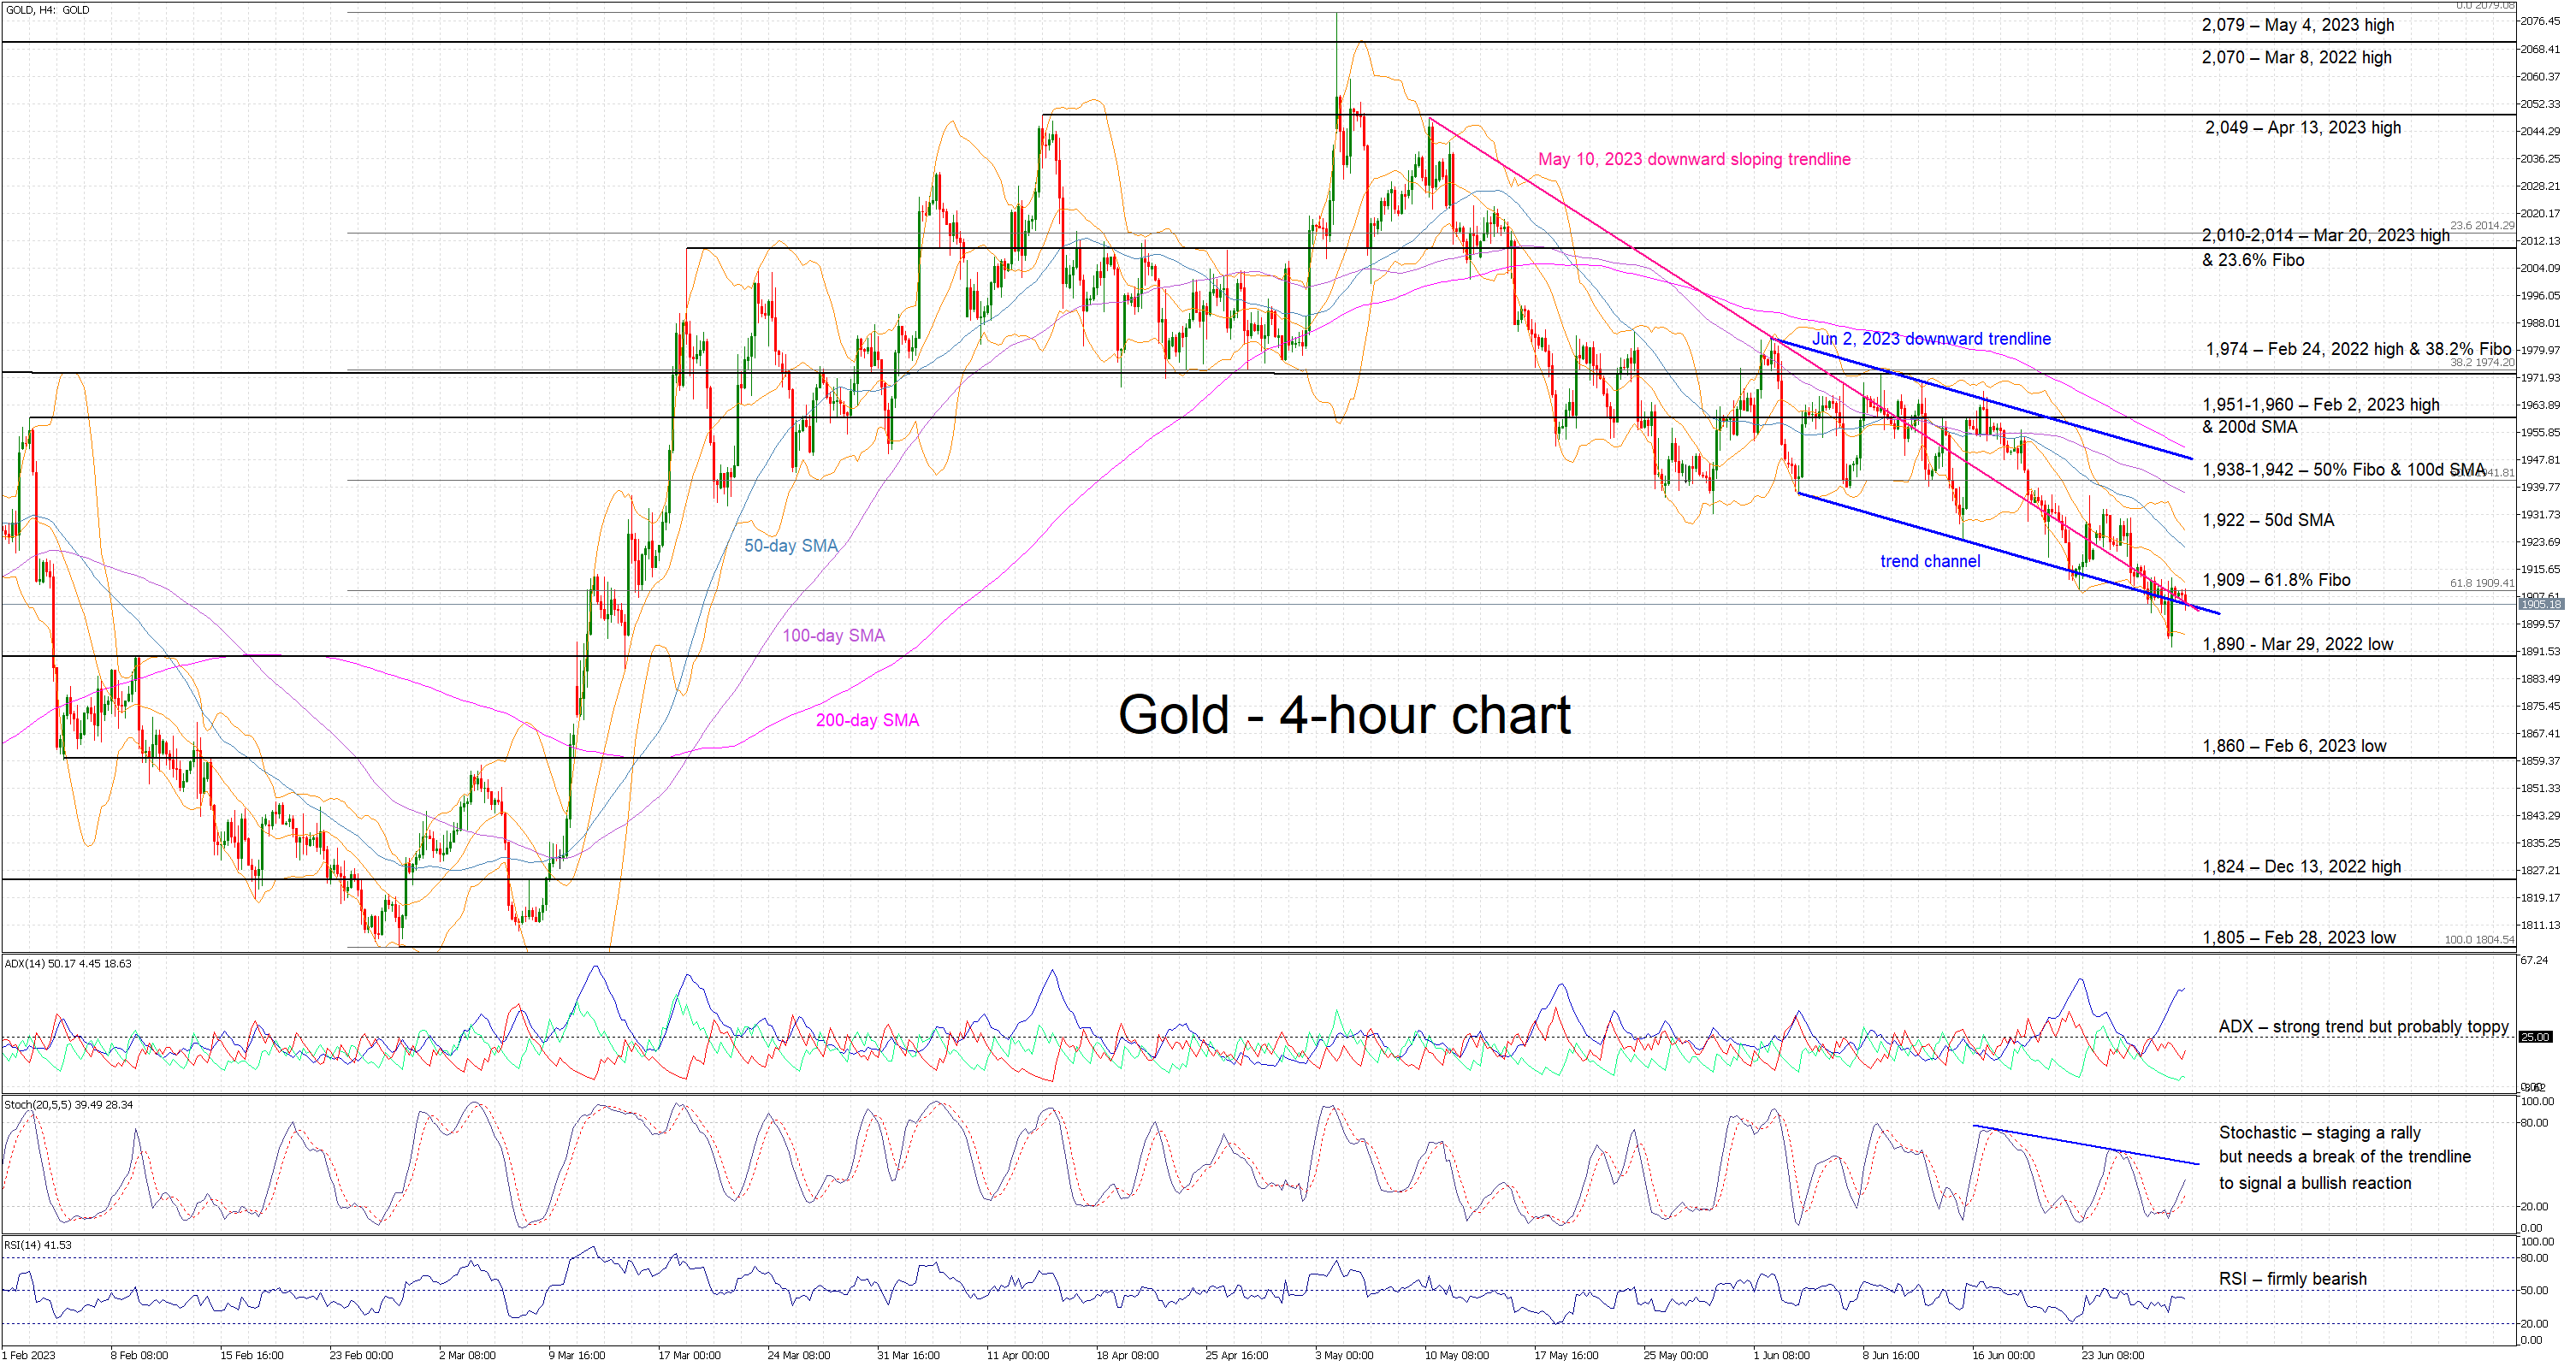
Gold is gliding lower today, trading close to its lowest level since March 2023 and carrying on the bearish trend that kicked off on June 2, 2023. It is currently battling with the lower boundary of the recent trend channel and the May 10, 2023 downward sloping trendline. Gold had a quick look at the sub-1,900 area yesterday but quickly bounced higher, revealing pockets of resistance in this area.
The momentum indicators are somewhat split at this stage. The RSI remains below its 50-midpoint, confirming the current bearish pressure. In addition, the Average Directional Movement Index (ADX) has jumped to an extremely high level, reflecting the underlying strength of the current downleg, but also showing some initial signs that it is probably close to its peak.
Should the bears believe that the current pullback has not run its course, they would love a move below the critical 1,900 threshold. This appears to be the ultimate test of the bears’ determination and, if they are successful, they could then test the support set March 29, 2022 low at 1,890. Even lower, the February 6, 2023 low at 1,860 awaits them.
On the other hand, the stochastic oscillator is staging a small rally. This is pointing to a bullish tendency in the market that is not yet enough to halt the short-term bearish trend. Should the stochastic break its formed downward trendline, it would allow the bulls to make an attempt to recover part of their recent losses. They would quickly try to push gold above the 61.8% Fibonacci retracement of February 28, 2023 – May 4, 2023 uptrend at 1,909, before looking higher, and more specifically, at the 50-day simple moving average (SMA) at 1,922.
To sum up, gold is firmly in a short-term bearish trend, but the biggest battle for the 1,900 threshold has just begun.
Has USDCAD Started a New Bullish Cycle?
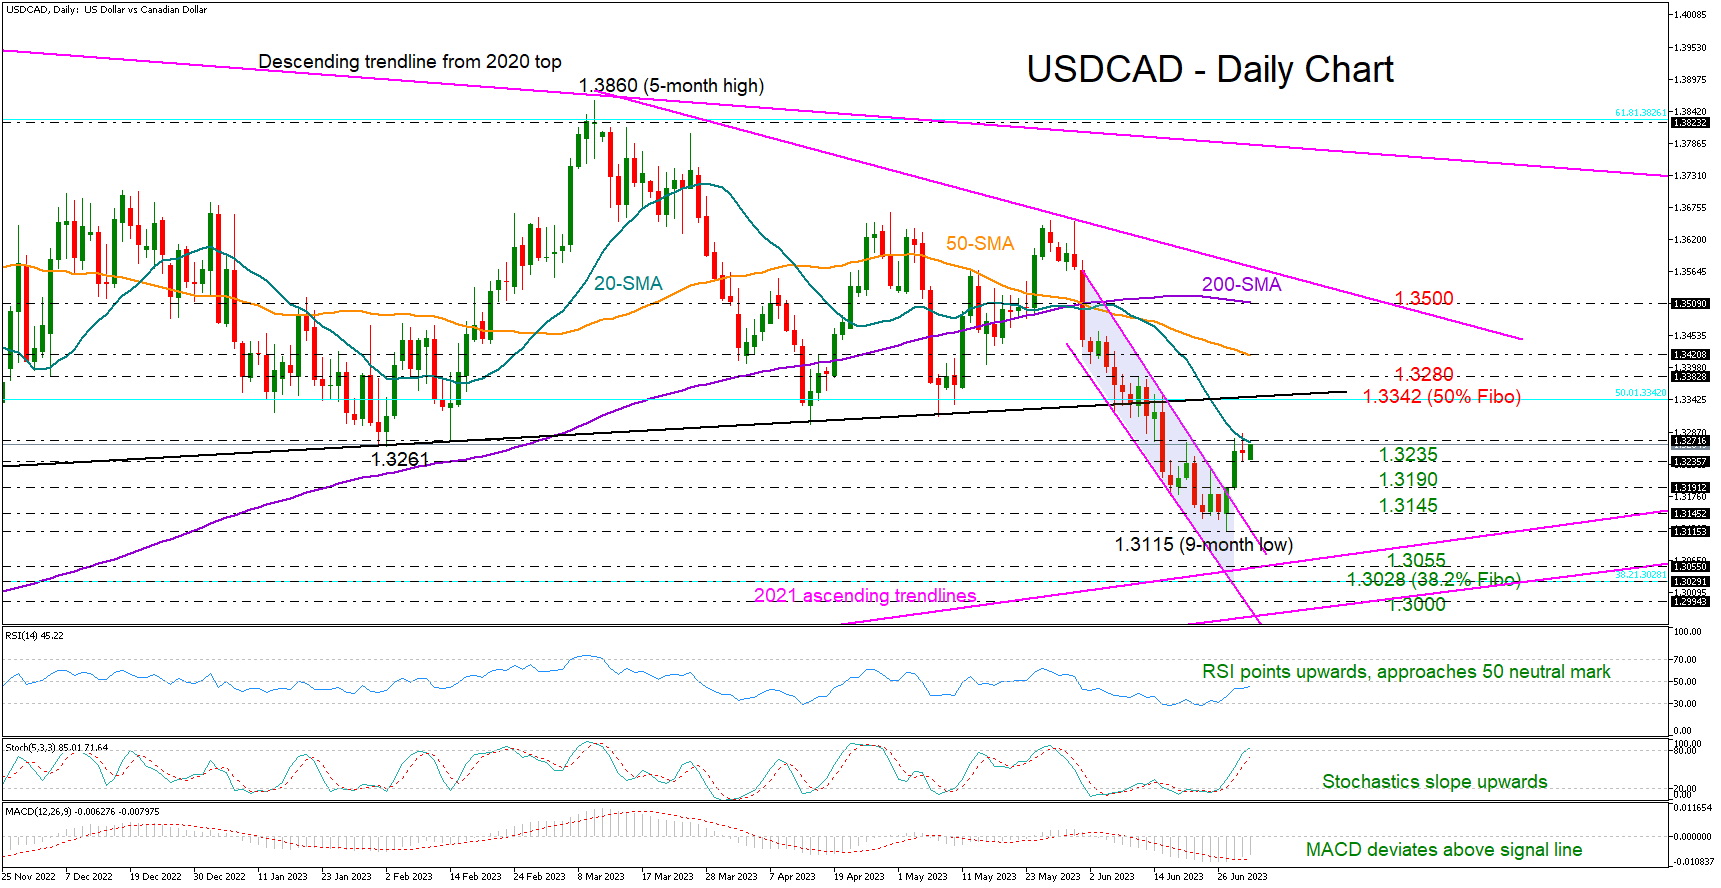
USDCAD rose quickly above the tight bearish channel, but soon stopped around February's lows and near its 20-day SMA on Thursday.
The pair is set to close the month down by 2.3%, marking its worst monthly performance since 2021. That said, the recent bullish channel breakout continues to look promising as both the RSI and MACD are showing a convincing improvement, indicating an encouraging start to July.
If the 20-day SMA at 1.3270 gives way, the price may advance straight to the broken, almost- flat support trendline from November 2022 seen at 1.3350. The 50% Fibonacci retracement of the 1.4667-1.2006 downtrend is adding extra importance to this region. Therefore, a successful move higher and above the nearby resistance of 1.3380 might add extra impetus to the price, bringing the 50-day SMA at 1.3420 next into view. Should the latter prove fragile, the recovery could pick up steam towards the 200-day SMA at 1.3500.
Alternatively, the price could slide to retest Thursday’s low of 1.3235. A continuation lower could examine the 1.3190 constraining zone ahead of June’s floor of 1.3145. Another failure here might threaten a downtrend extension towards the 1.3055-1.3000 zone, which encapsulates two key ascending trendlines from the 2021 lows and the 38.2% Fibonacci level.
In brief, USDCAD is expected to preserve its recovery mood, but traders might wisely wait for a close above the 20-day MA before they drive the pair higher.
EUR/USD Technical Analysis
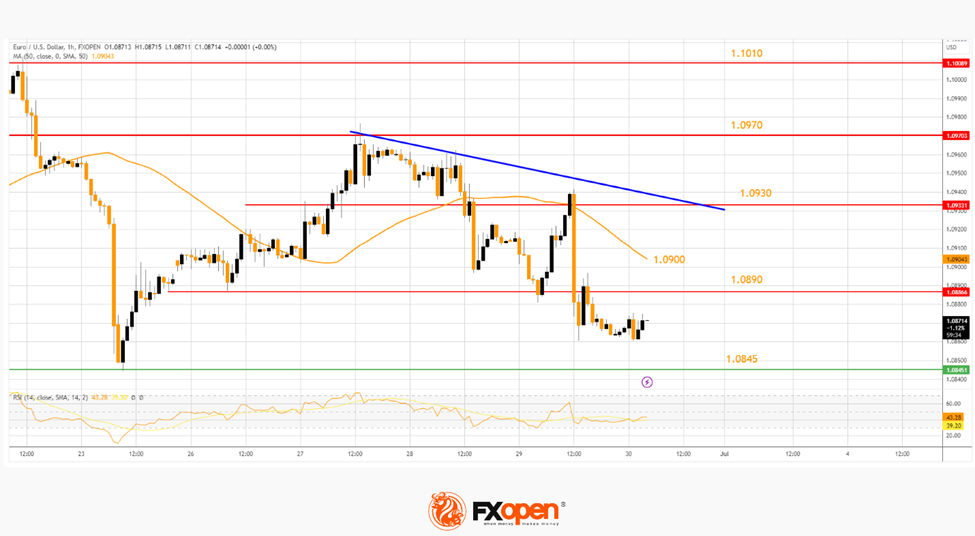
On the hourly chart of EUR/USD at FXOpen, the pair started a fresh decline from the 1.0970 zone. The Euro declined below the 1.0930 support against the US Dollar.
There was a break below the 50-hour simple moving average at 1.0900. It is now showing a few bearish signs below the 1.0890 resistance level. The next major resistance is near 1.0900. The main resistance is now forming near a connecting bearish trend line at 1.0930.
A break above 1.0930 could send EUR/USD toward 1.0970. Any more gains might send the pair toward the 1.1010 resistance.
Conversely, the pair might continue to move down toward 1.0845. The next major support is near 1.0820, below which EUR/USD could test the 1.0800 support. Any more losses could send the pair to 1.0765.
AUD/USD and NZD/USD At Risk of Additional Losses
Important Takeaways for AUD/USD and NZD/USD Analysis Today
- The Aussie Dollar started a fresh decline from well above the 0.6750 level against the US Dollar.
- There is a key bearish trend line forming with resistance near 0.6630 on the hourly chart of AUD/USD at FXOpen.
- NZD/USD declined heavily below the 0.6125 support zone and tested 0.6050.
- There was a break above a major bearish trend line with resistance near 0.6070 on the hourly chart of NZD/USD at FXOpen.
AUD/USD Technical Analysis
On the hourly chart of AUD/USD at FXOpen, the pair started a fresh decline from the 0.6720 zone. The Aussie Dollar traded below the 0.6670 support to enter a bearish zone against the US Dollar.
The pair even settled below the 50-hour simple moving average at 0.6630. A low is formed near 0.6595 and the pair is now consolidating losses. It is testing the 23.6% Fib retracement level of the downward move from the 0.6750 swing high to the 0.6595 low.
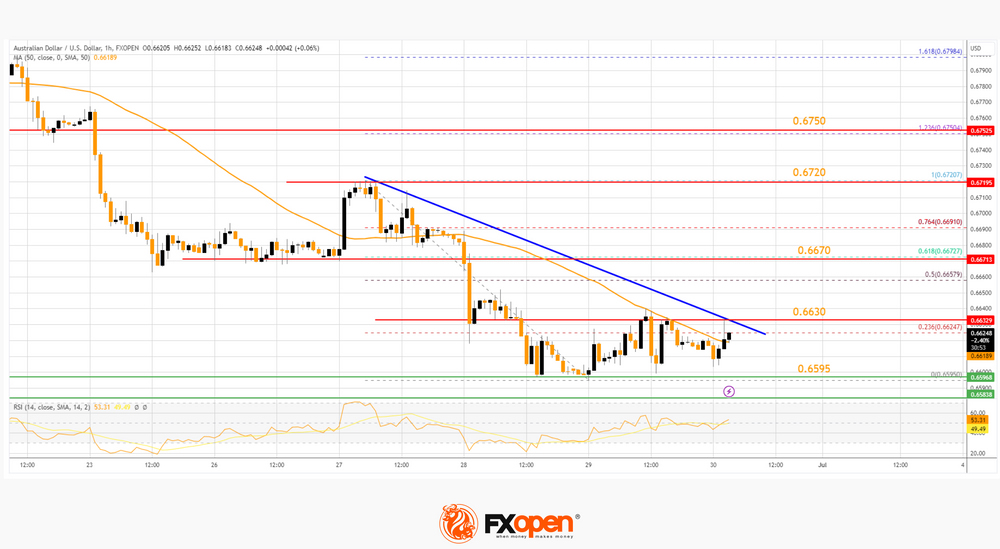
On the upside, the AUD/USD pair is facing resistance near a key bearish trend line at 0.6630. The next major resistance is near the 61.8% Fib retracement level of the downward move from the 0.6750 swing high to the 0.6595 low at 0.6670. A close above the 0.6670 level could start another steady increase in the near term. The next major resistance on the AUD/USD chart could be 0.6750.
On the downside, initial support is near the 0.6595 level. The next support could be the 0.6550 level. If there is a downside break below the 0.6550 support, the pair could extend its decline toward the 0.6500 level. Any more losses might send the pair toward the 0.6440 support.
NZD/USD Technical Analysis
On the hourly chart of NZD/USD at FXOpen, the pair also followed a similar pattern and declined below 0.6125. The New Zealand Dollar gained bearish momentum and traded below 0.6085 against the US Dollar.
A low is formed near 0.6050 and the pair is now attempting a recovery wave. It broke a major bearish trend line with resistance near 0.6070 and the 50-hour simple moving average.
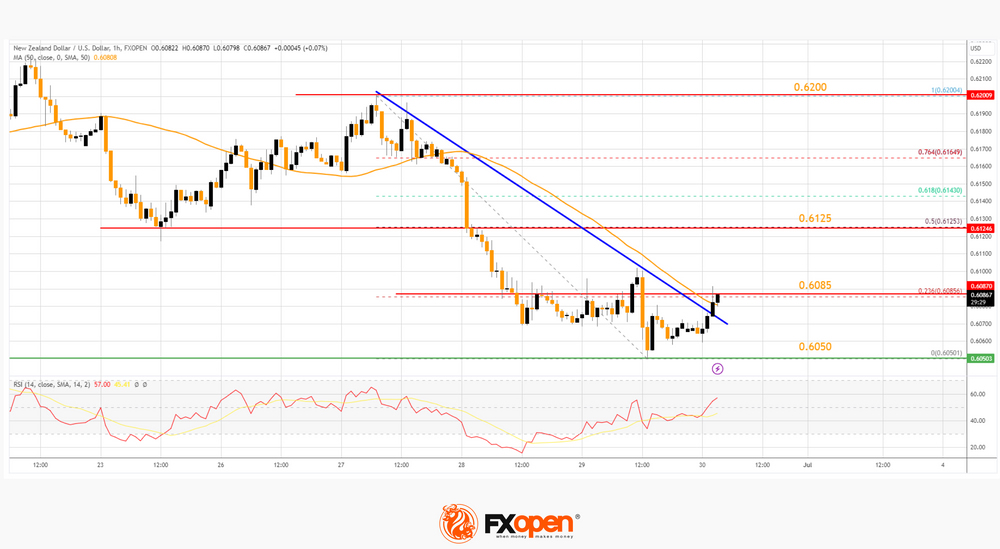
The pair is now testing the 23.6% Fib retracement level of the downward move from the 0.6200 swing high to the 0.6050 low. If there is a move above the 0.6085 resistance, the pair could rise toward 0.6125.
The 50% Fib retracement level of the downward move from the 0.6200 swing high to the 0.6050 low is also near 0.6125 to act as a barrier. Any more gains might open the doors for a move toward the 0.6200 resistance zone in the coming days.
On the downside, immediate support on the NZD/USD chart is near the 0.6050 level. The first major support is near the 0.6020 zone. The next support could be 0.6000. If there is a downside break below it, the pair could extend its decline toward the 0.5950 level.
EURUSD Analysis: Double Bearish Pattern
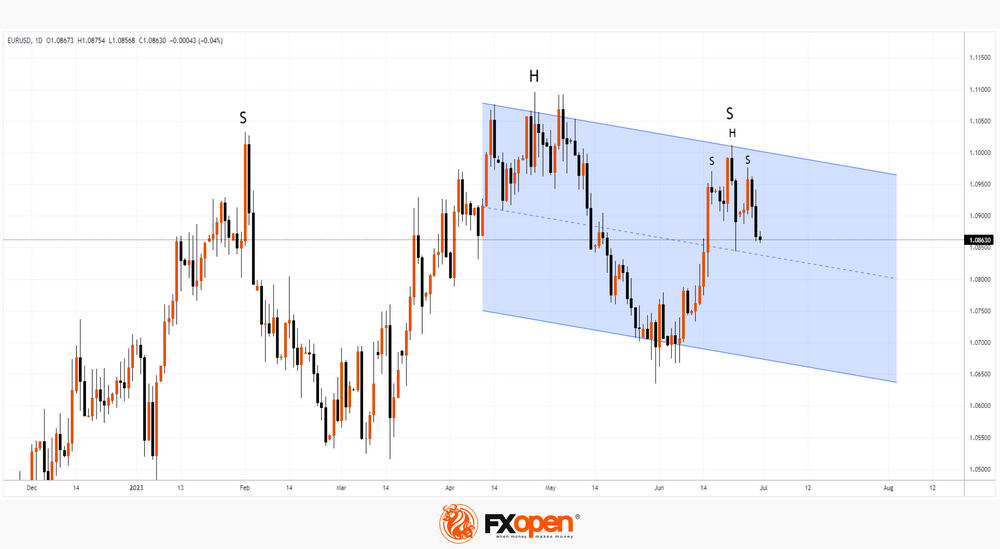
The EUR/USD chart indicates an interesting situation from the point of view of technical analysis, namely, a “nested” head-and-shoulders pattern.
- The global bearish SHS pattern is formed by the peaks of February, April, June.
- The local bearish SHS pattern is formed by three peaks formed in the second half of June. This should give confidence to the bears, who have statistics that indicate the effectiveness of the pattern.
Please note that inflation data will be published today:
- 12:00 GMT+3: Core CPI Flash Estimate.
- 12:00 GMT+3: US Core CPE is an indicator that the Fed pays special attention to.
Earlier this week, both Lagarde and Powell reaffirmed their resolve to fight inflation. The release of news today can provoke sharp movements in the market — for example, a breakdown of the neck line of the local SHS pattern. Get ready for bursts of volatility.
Bullish US Stocks and Bearish JPY at Risk of Pain Trade in H2
- Significant up move in G-20 2-year sovereign bond yields except for Japan & China.
- US 2-year Treasury yield may eye the next immediate resistance at 5.20%.
- Higher cost of funding in H2 may deflate current optimism in US stocks.
- Japan’s finance officials have ratcheted up verbal intervention to talk down USD/JPY strength.
Welcome to June month-end, Q2 2023-end, and H1 2023-end where three different periods of closing coincide at the same time which tends to lead to higher volatility in certain asset classes due to a confluence of activities among market participants, portfolio’s rebalancing, and window-dressing.
The moments of “higher volatility” have been captured in the bond market this time around as global sovereign bond yields among the G-20 nations (except for Japan & China) have spiked up significantly yesterday, 29 June; bond yields increase led to bond prices decrease.
Global 2-YR sovereign bond yields on an uptrend exception for Japan & China
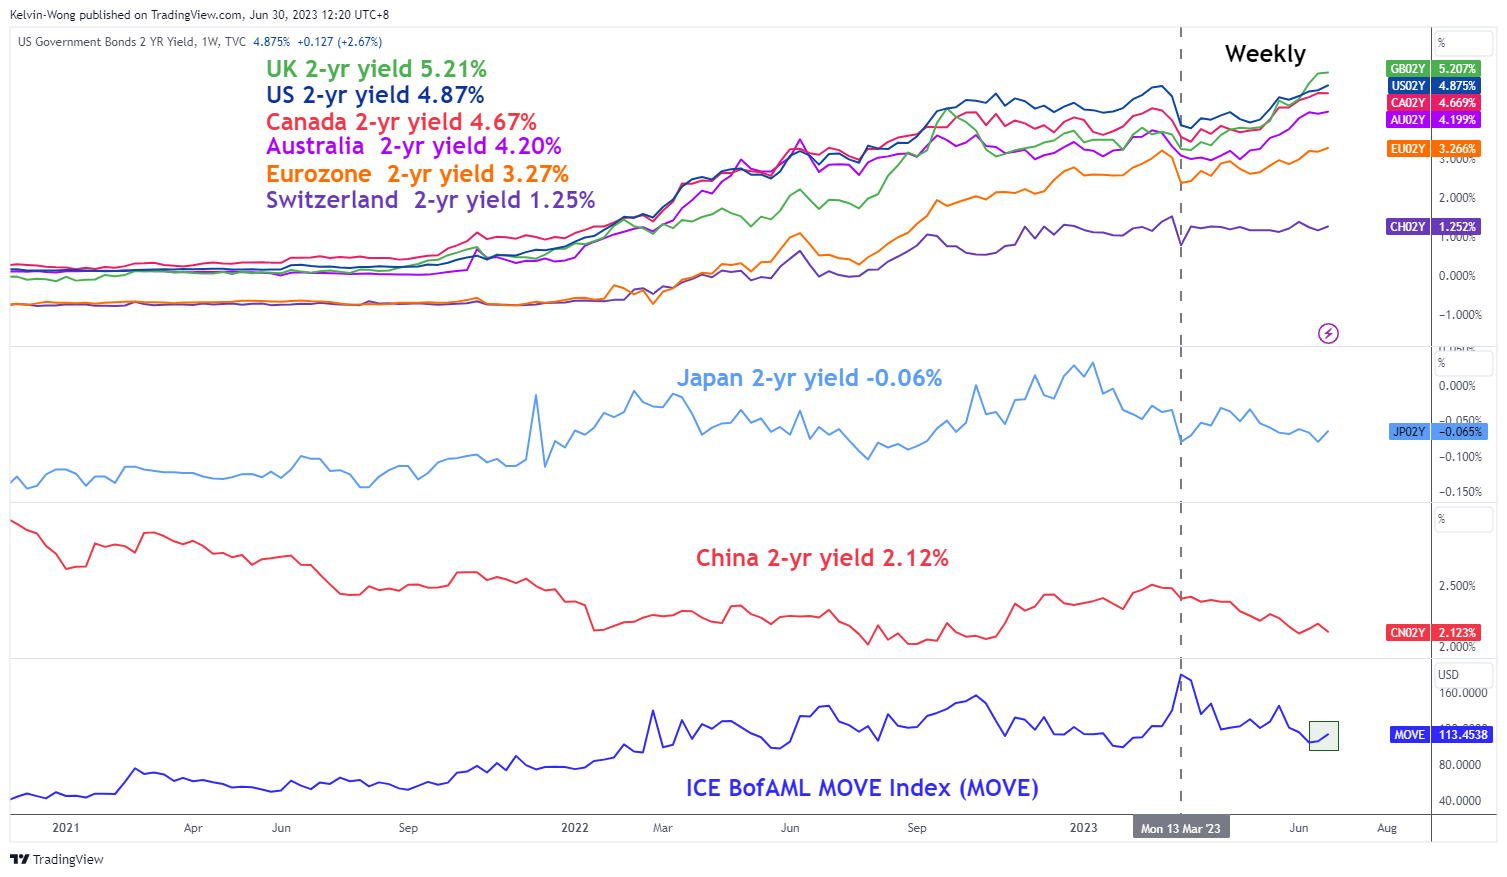
Fig 1: G-20 2-YR sovereign yields medium-term trend with MOVE Index as of 30 Jun 2023 (Source: TradingView, click to enlarge chart)
Even the implied volatility of bond yields that measures the future movement of volatility has jumped up as well, the ICE BofAML MOVE Index, a gauge that measures the implied volatility of the US Treasury markets via options recorded a daily gain of +4.8% to close at 113.45 yesterday and hit its highest level since 20 June 2023.
Technical analysis suggests further potential up move trajectories in US Treasury yields
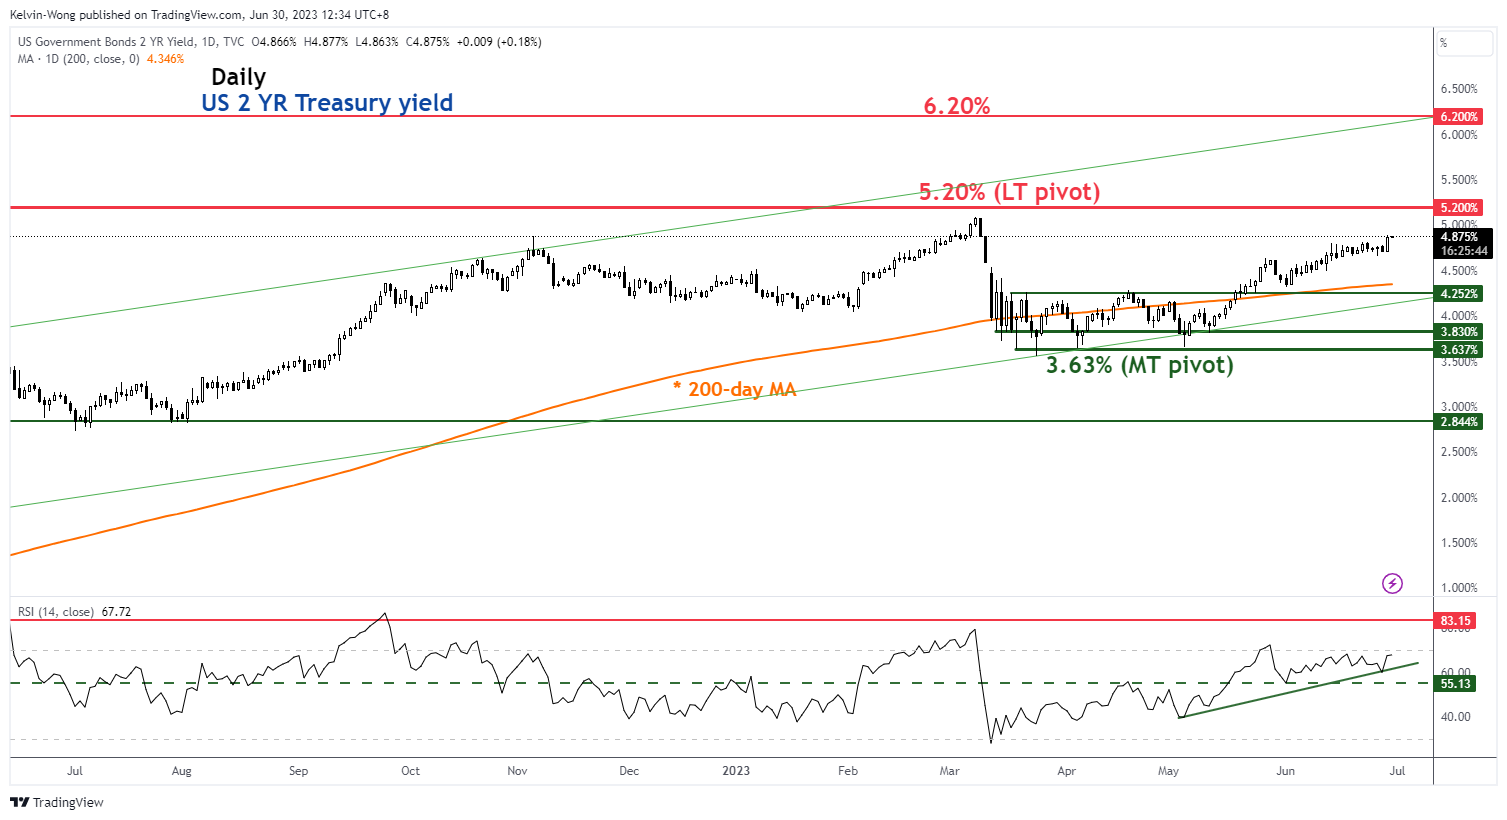
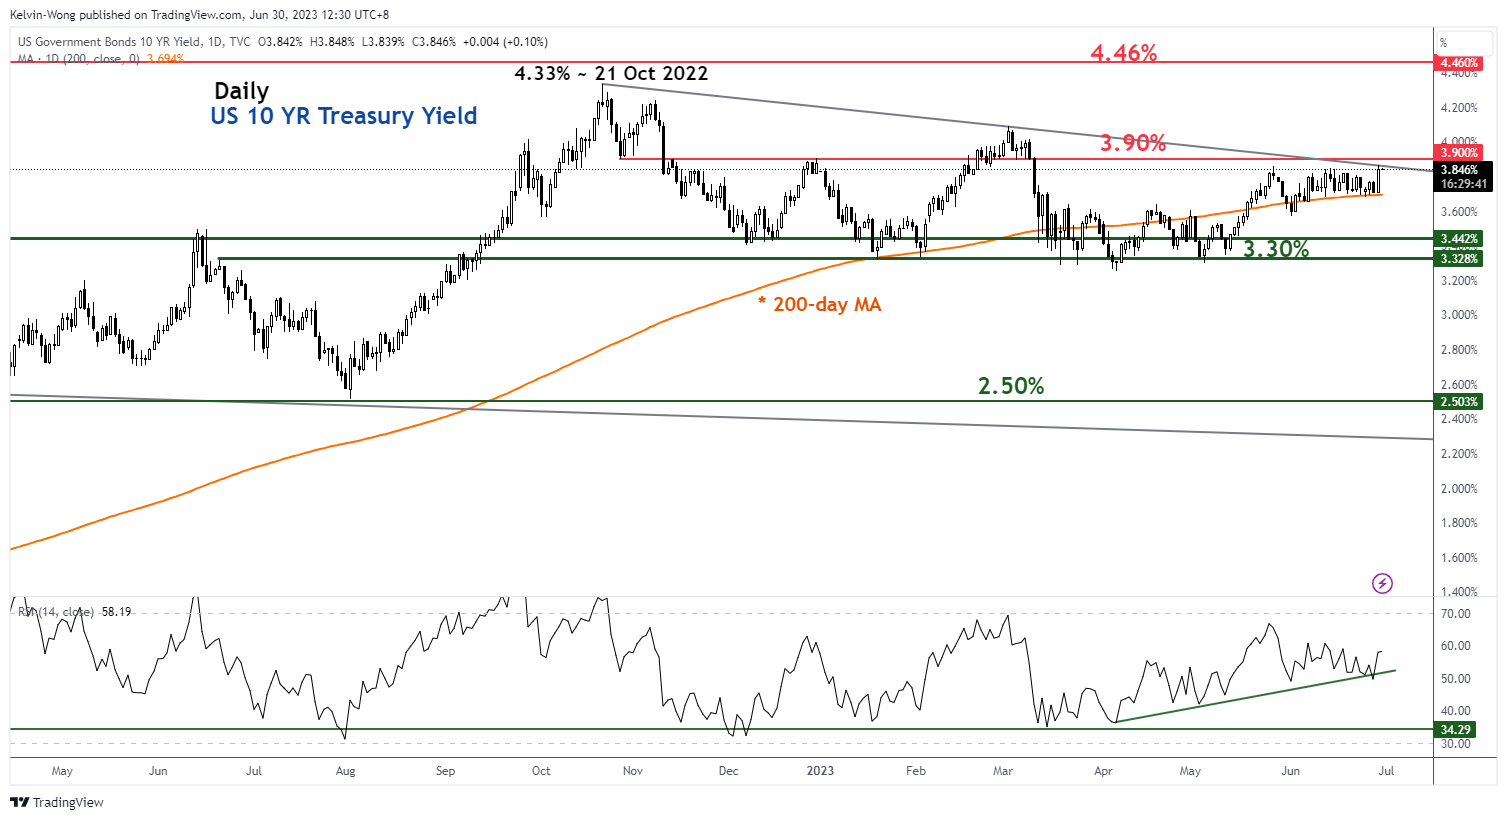
Fig 2: 10-YR & 10-YR US Treasury yield medium-term trends as of 30 Jun 2023 (Source: TradingView, click to enlarge chart)
The 2-year Treasury yield jumped by +15 basis points (bps) yesterday, the highest single-day gain since 25 May 2023 and it is now eying a key resistance at 5.20%. A clearance above it sees the next resistance coming in at 6.20% (the upper limit of a major ascending channel in place since the 1 March 2022 low).
The longer-term 10-year Treasury yield gained (+13 bps yesterday) as well but at a slower momentum pace versus the 2-year yield. Right now, it is approaching key intermediate resistance at 3.90% which has capped prior bullish movements since the 21 October 2022 high of 4.33%. A clearance above 3.90% sees the next resistance coming in at 4.46%.
Deeper yield curve inversion & tighter financial conditions may deflate optimism in US stocks
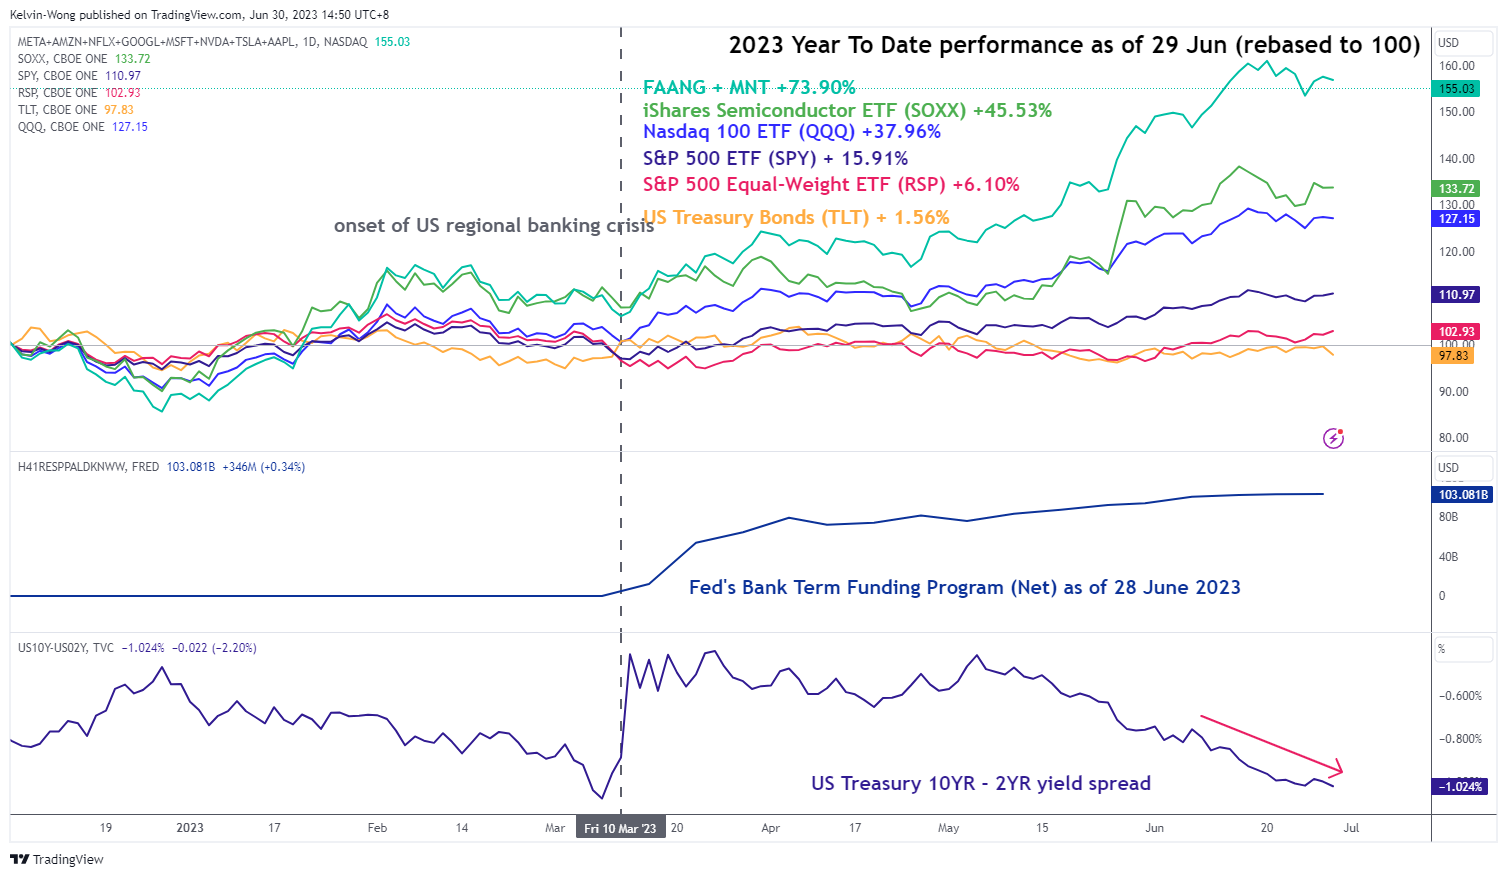
Fig 3: US key benchmark stock indices year-to-date performance with US Treasury 10-YR-2-YR yield spread as of 29 Jun 2023 (Source: TradingView, click to enlarge chart)
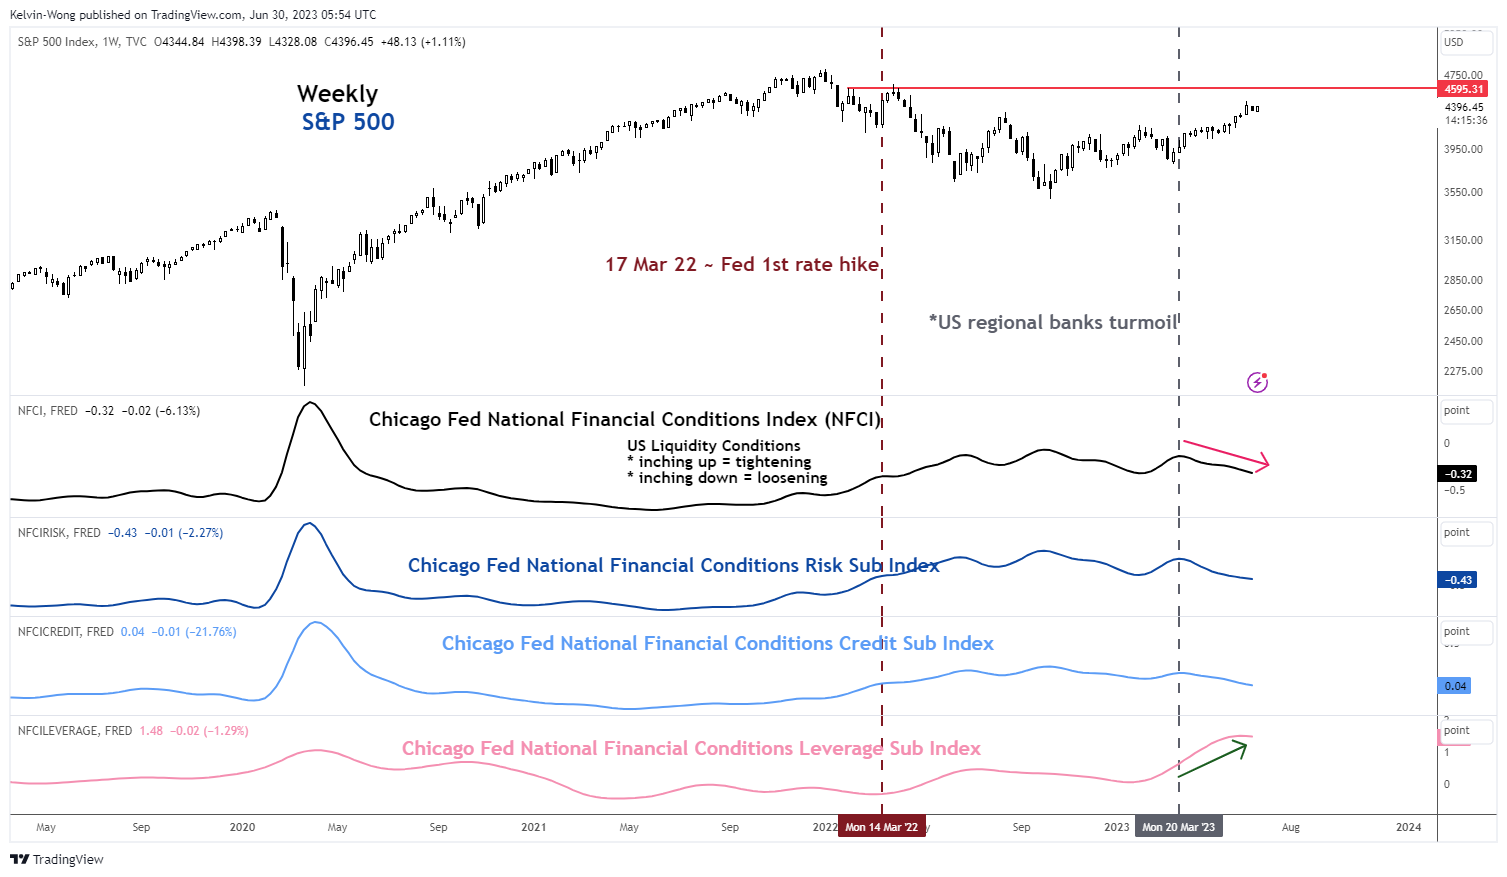
Fig 4: US S&P 500 major trend with Chicago Fed’s Financial Conditions Index as of 29 Jun 2023 (Source: TradingView, click to enlarge chart)
The US Nasdaq 100 has been the global outperformer in the first half of 2023 thanks to the stellar performances of the mega-cap technology stocks that rode on the emergence of the “high productivity optimism” wave driven by Artificial Intelligence (AI) technologies.
The six-month performance of the Nasdaq 100 as of 29 June 2023 stood at +36.57%, its best performance since the second half of 1999 before the Dot.com bubble burst.
The upbeat tone of the Nasdaq 100 has been supported by a looser financial condition in the US after the US regional banking turmoil in March, partly assisted by a liquidity backstop, the Fed’s Bank Term Funding Programme that has continued to increase but at a slower pace since early June 2023.
Meanwhile, the 10-year over 2-year US Treasury yield spread has continued its inversion path to -1.02%, its lowest level since early March 2023 which has signalled an increase odd of further economic weakness in H2.
The Chicago Fed’s National Financial Condition Index (NFCI) has been on a downward path since the US regional banking turmoil subsided in early April 2023 which indicates a loosening of financial/liquidity conditions in the US. Based on the latest data for the week ending 23 June, the composite NFCI ticked down further to -0.32.
However, the trend of its leading Leverage sub-component has remained upward since mid-March 2023, and if the US Treasury yields continued their expected upward trajectories, it may lead to an increase in funding costs which could see upside pressure on the Leverage sub-component. Thus, a series of future upticks in the composite NCFI that indicates a tighter financial condition cannot be ruled out.
USD/JPY rally is coming closer to the key resistance zone of 145.50/146.10 with risk of intervention
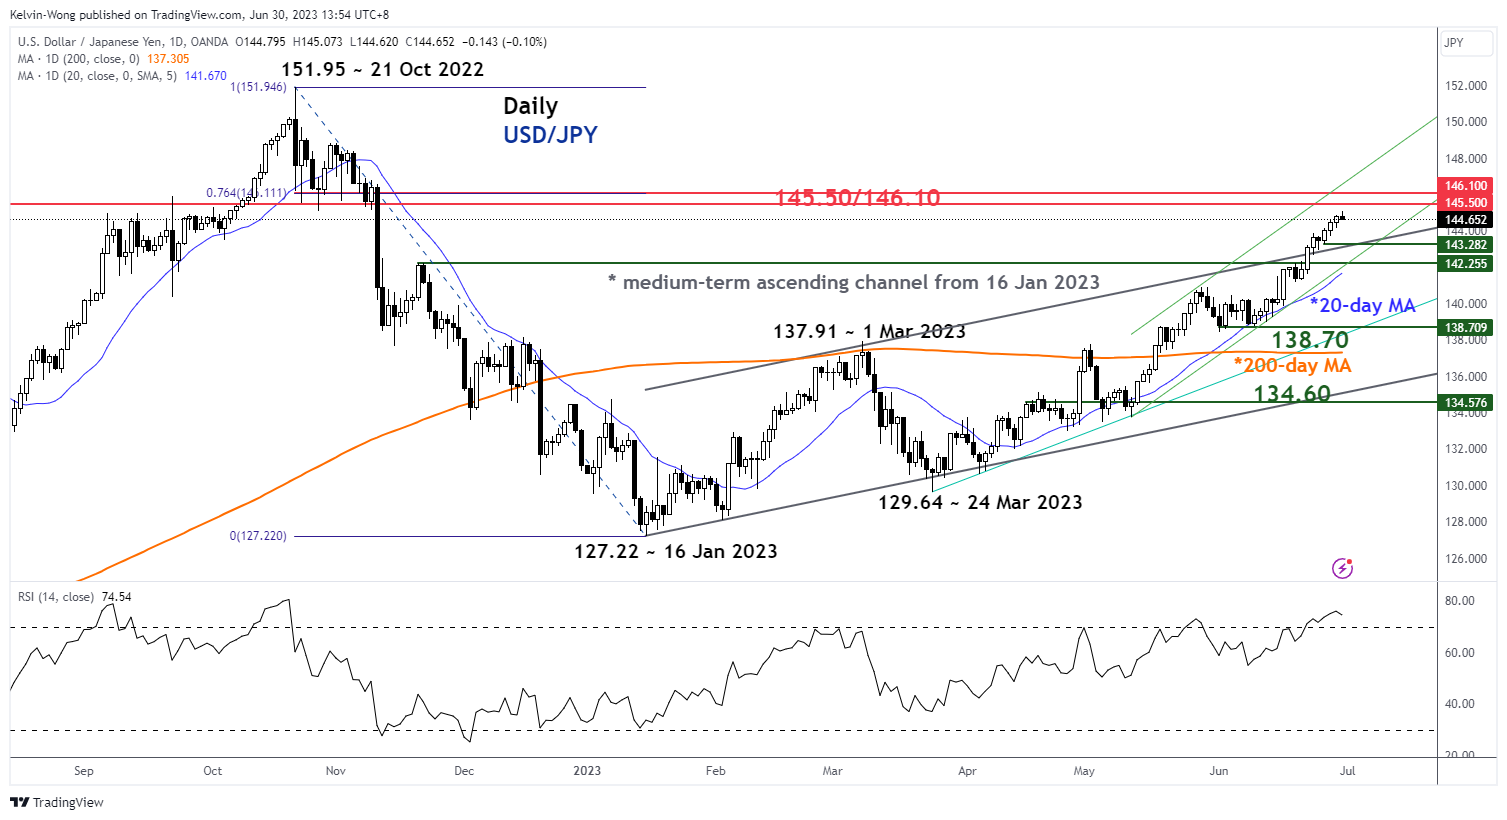
Fig 5: USD/JPY medium-term trend as of 30 Jun 2023 (Source: TradingView, click to enlarge chart)
The bulls of USD/JPY have started to get a bit cautious of the recent four-week weakness seen in the JPY as the 145.00 psychological level per US dollar seems to be a defence level where Japan’s Finance Ministry may intervene in the foreign exchange market.
The USD/JPY rallied to print an intraday high of 145.07 after the release of the leading Tokyo-area inflation data for June has indicated that sticky inflation remains elevated in Japan where the core-core rate (excluding food & energy) rose to 2.3% year-on-year, slightly below 2.4% recorded in May but still hovering close to a 30-year high. The USD/JPY has inched lower by -0.06% intraday to 144.73 at this time of the writing.
In another round of verbal intervention from Japanese officials this morning to talk down the USD/JPY’s strength, Finance Minister Suzuki commented that sharp, one-side movements had been seen in the foreign exchange (FX) market, closely watching FX market with a great sense of urgency, authorities will respond appropriately if FX moves become excessive, and current situation not positive to current policy issues.
These latest comments echoed a similar tone and rhetoric made earlier by Vice Finance Minister Kanda, a top currency official on Monday. Hence, it seems that Japanese officials are getting uneasy about the recent swift pace of the up move seen in the USD/JPY, watch the key near-term support zone of 142.50/25.
JPY Stays Under Pressure
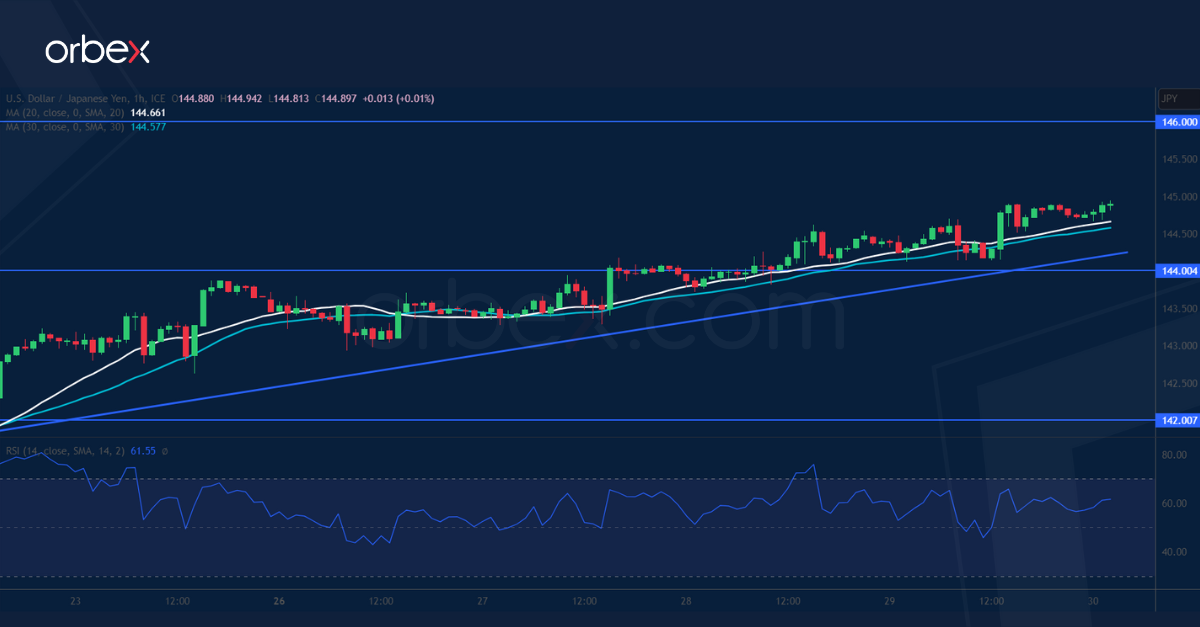
USD/JPY grinds rising trend line
The Japanese yen dipped after the CPI in the Tokyo area fell short of expectations in June. The pair has been climbing along a rising trend line from mid-June and the bullish mood means that pullbacks have been opportunities for the buy side to stake in. The greenback is testing the supply zone around 146.00 from last November’s sell-off. A bullish breakout would cement the dollar’s supremacy and pave the way for a rally towards 150.00. On the downside, 144.00 on the trend line is the first support.
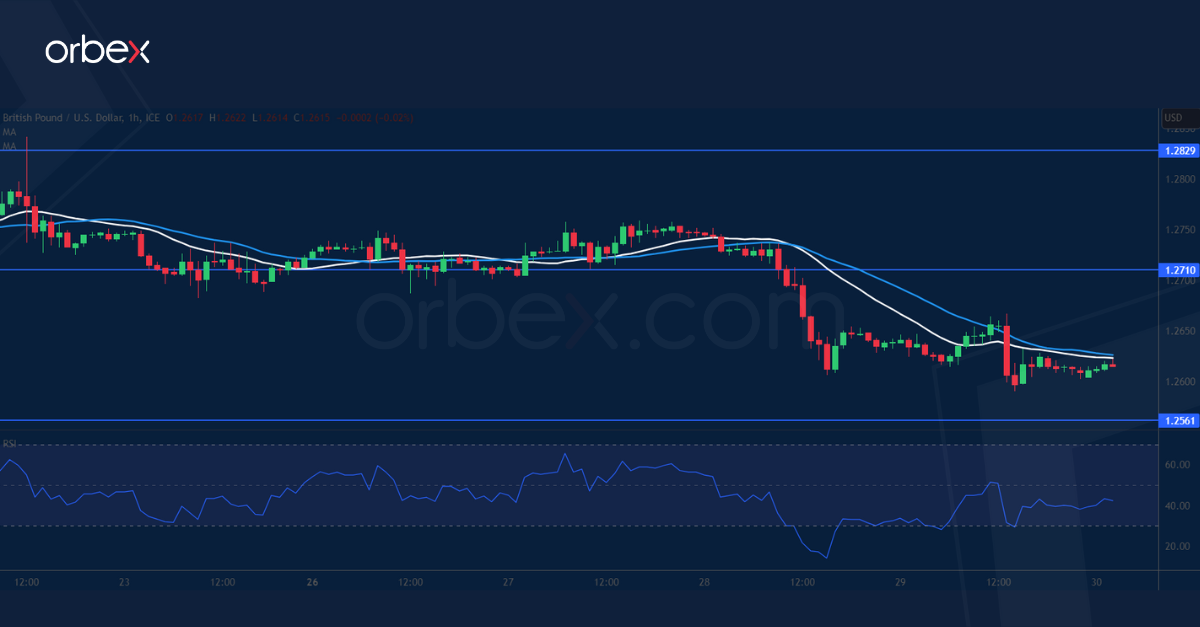
GBP/USD breaks lower
Cable slips as traders fear the UK economy is the weakest link in the global tightening campaign. A fall below 1.2650 was a sign of profit-taking after the bulls struggled to push back above 1.2830, putting a dent to the short-term mood. However, Sterling still has an edge from the daily chart’s perspective. 1.2650 at the confluence of the base of a mid-June breakout rally and the 30-day SMA is a key level to expect buying. The brief support-turned-resistance of 1.2710 is the level to lift before cable could resume its uptrend.
FTSE 100 struggles for bids
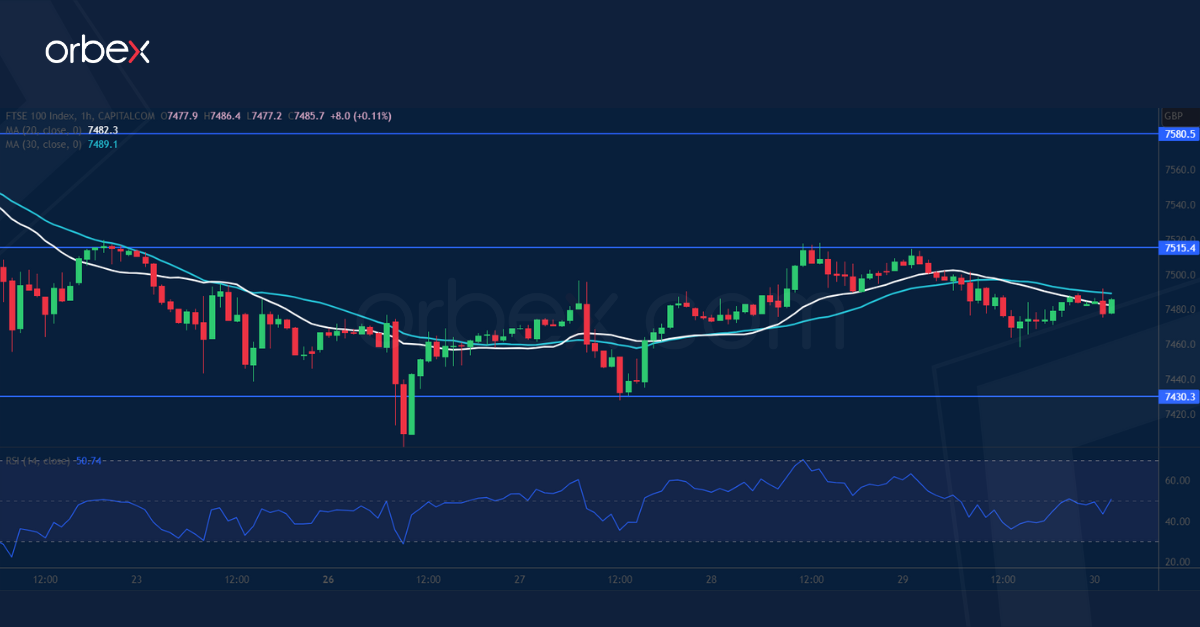
The FTSE 100 slides as the Thames Water crisis pulls utility stocks lower. A slip below the previous swing low of 7430 has put the bulls on the defensive, giving back most of the gains from the V-shaped bounce in May. The latest uptick came under pressure at 7515 as trapped bulls ran for the exit. However, its breach could extend the recovery to 7580 which coincides with dynamic resistance from the 30-day SMA. On the flip side, 7430 is the bulls’ last chance to prevent a correction all the way to this year’s lows near 7300.
Japanese Data Showed a Mixed Picture
Markets
US weekly jobless claims are notoriously volatile. Since a couple of weeks, markets took them as a pointer to find the turning point in the US labour market. The same happened the other way around in the early pandemic-days. Relying on a notoriously volatile weekly number implies you create a lot of additional weekly volatility. Especially when you get wrongfooted. Higher-than-expected weekly claims pushed US Treasuries higher the past weeks. Markets expected more of the same yesterday, but claims fell from 265k to 239k (vs 265k expected and lowest in a month) and triggered a sell-off in US Treasuries. Fed Chair Powell on Wednesday obviously created the setting by not ruling out back-to-back rate hikes in July and September, a scenario which wasn’t discounted in US money markets. US yields rose by 9.2 bps (30-yr) to 16.4 bps (5-yr) in a daily perspective, with real yields driving the move higher. The US 2-yr yield (4.86%) rose to its highest level since mid-March and keeps the 5.08% cycle top on the radar. The US 10-yr yield tested the May & June top at 3.86% before closing at 3.84%. A break would be technically significant with the March top at 4.09% as target. German Bunds and UK Gilts sold off in lockstep. German yields added 6.9 bps (30-yr) to 10.6 bps (5-yr). The real interest rate advantage helped the dollar, even as the single currency remains relatively strong on the international scene. EUR/USD closed at 1.0865 from an open at 1.0913. First support at 1.0845 was untested, but needs to be monitored. A break below paints a short term double top on the charts, suggesting a drop in the lower half of the broad sideways channel (roughly 1.05-1.10) in place since the beginning of the year. The mirror move already happened in the trade-weighted dollar index with DXY surpassing 103.17. (US) stock markets were the odd one out yesterday, gaining up to 0.8% for the Dow. The more a potential US recession gets pushed forward, the more equity markets remain bullish. With or without higher real yields. This stretch will crack one day, but we don’t fight the trend.
Today’s eco calendar contains EMU June CPI inflation and US May PCE deflators. National European inflation numbers suggests a close to consensus print (5.5% Y/Y for headline; 6.5% Y/Y for core). PCE deflators the past months deviated somewhat from the earlier released (US) CPI readings, so there’s room for market reaction there. Nearby technical resistance (both in US yields and the dollar) indicate that the surprise should be large enough to force breaks ahead of the weekend. June Chicago PMI’s are also on the agenda.
News & views
Japanese data showed a mixed picture this morning. Tokyo inflation ex fresh food prices, the BOJ’s preferred inflation measure, gained slightly from 3.1% Y/Y to 3.2% Y/Y in June. The increase was mainly due to higher electricity prices as authorities allowed utilities to raise prices this month. Headline inflation eased from 3.2% Y/Y to 3.1% Y/Y. The core measure, excluding fresh food and energy prices also slowed from 3.9% Y/Y to 3.8% Y/Y. All data were slightly softer than expected. Still the outcome keeps the debate open on how much the BoJ will have to raise its inflation forecasts at the July policy meeting and what effect it will have on the Yield Curve Control (YCC). In this respect, BoJ Deputy Governor Himino in an interview with Reuters indicated that price rises are stronger than previously expected. While most inflation is still cost-driven, he also sees factors of demand driven inflation. Other data published this morning showed a bigger than expected monthly decline in industrial production (-1.6% M/M; 4.7% Y/Y), after three consecutive months of positive production growth. The labour market remains tight with the unemployment rate unchanged at 2.6%. USD/JPY this morning briefly surpassed the 145 barrier as markets look out for signs from the Ministry of Finance on potential interventions.
Chinese economic momentum slowed further in June. The composite PMI declined from 52.9 to 52.3. The manufacturing index remains slightly in contraction territory (49 from 48.8). The services measure fell more than expected from 54.5 to 53.2. Subindices for employment and exports orders decreased further. New overall orders gained marginally (48.6) but stay in contraction territory. The data reinforce market speculation of further stimulus to support activity. The yuan remains in the defensive with USD/CNY trading near 7.25.