Sample Category Title
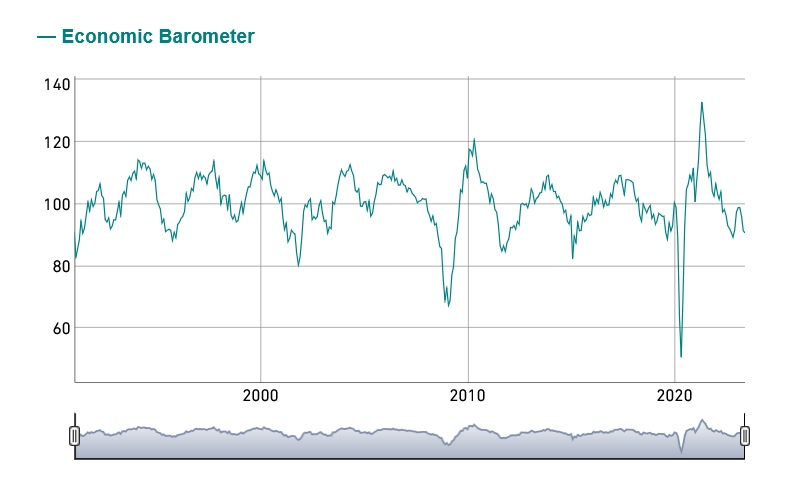
Swiss KOF fell to 90.8, third decline in a row
Swiss KOF Economic Barometer dropped slightly from 91.4 to 90.8 in June, above expectation of 89.2. That's the third consecutive monthly decline.
KOF said: " The downward movement in the Barometer is primarily caused by bundles of indicators that capture foreign demand. Here, the outlook continues to deteriorate.
"The indicators covering private consumption and the economic sector of other services also give a slightly negative signal. The indicators for manufacturing and construction, on the other hand, point slightly in a positive direction."
US Grows, China Slows
Economic data released in the US yesterday further fueled the hawkish Federal Reserve (Fed) bets. The US Q1 GDP was revised up from 1.3% to 2%, while analysts had penciled in an improvement to 1.4%. The surprise jump came from a quickened growth in exports and consumer spending, which jumped 4.2% in the Q1. 4.2%! Corporate profits fell, but they fell less than expected, as initial jobless claims fell by the most since 2021. The only good news for the Fed, and its inflation battle, was a slightly softer than expected core PCE figure, which extended to 4.9%, a bit less than 5% expected by analysts. But the rest of the data pointed in the same direction than in the past days and weeks: the US economy seems to be doing FINE! Combined with the Fed’s bank stress test results comforting that the big US lenders are in a position to shoulder further shocks, like recession and chaos in real estate, the US 2-year yield jumped more than 3% to 4.90% for the first time since the mini banking crisis. The probability of a 25bp hike from the Fed in the July meeting jumped to 87%, while the pricing in the market suggests that the Fed’s two rate hikes are now likelier than not.
And perhaps because the aggressive Fed tightening doesn’t impact economic strength as badly ass expected, stock investors saw no urgence in selling their stocks on rising hawkish Fed expectations. The S&P500 advanced 0.45%, Nasdaq was slightly lower, as the small caps of Russell 2000 outperformed with a 1.23% rise yesterday. The US dollar index rallied past its 100-DMA and broke above a one-month descending channel top. Trend and momentum indicators turned positive hinting that a further advance in the US dollar is likely against major currencies in the run up to next week’s all important jobs report, especially if today’s PCE data, the Fed’s gauge of inflation, shows further advance in inflation from 4.4% to 4.6%.
Yet, a further rise in US yields could weigh on stock appetite before the weekly closing bell.
In the Eurozone, investor mood was a bit tricky because inflation data released this week in the Eurozone revealed that inflation in Italy eased more than expected, inflation in Spain eased below the European Central Bank’s (ECB) 2% policy target, but inflation in Germany ticked higher this month, to 6.8%, because of an unfavourable base effect from last year, when Germany offered its citizens ultra-cheap rail tickets. French, and the eurozone’s aggregate preliminary inflation data for June is due today.
The EZ inflation is expected to have eased to 5.6%, and the divergence between Germany and the others may not be a long-term concern, but the ECB will certainly remain well alert, and well hawkish into this summer.
More importantly, the end of ECB’s cheap loans should increase the yield spread between the Eurozone’s core and periphery and weigh on the EURUSD. The pair is now testing the 50-DMA to the downside, and if the Fed hawks continue gaining field, which seems to be the most likely scenario before next week’s US jobs data, we could see the pair correct deeper toward the 1.08/1.0820 region.
In China, the latest economic data didn’t enchant investors. Chinese manufacturing PMI remained below 50, in the contraction zone, for the third consecutive month, despite recurrent policy easing from the People’s Bank of China (PBoC). Nothing seems to be boosting the Chinese recovery because consumer and investor confidence have been severely damaged as a result of government crackdowns and Covid.
The initial forecast for this year - US recession and Chinese rebound - is not happening. On the contrary, the US is growing, and China is slowing. At this point, the Chinese government has no choice but to regain people’s and investors’ confidence if it doesn’t want to become too old before becoming rich enough.
Focus on Flash HICP
Market movers today
Today, markets will look closely at flash euro area HICP figures. The country figures released on Wednesday and Thursday were on balance a bit higher than consensus, driven by Spain and Germany. Even so, headline inflation is falling and thus consumer headwinds are waning. We have seen early signs of momentum in core prices declining in Q2, and gauging the underlying price pressure will be key for markets. The country releases so far would point to a 5.7% headline print.
At the same time, the euro area unemployment rate is released. It was the lowest on record in April at 6.5% and we do not expect to see any weakening signals here
In the US, we get PCE data for May.
n Norway, we get unemployment figures and in Sweden we get wage data, see more in the Nordic section below.
The 60 second overview
China: Overnight, the official NBS PMIs continued to signal sluggish growth in June, with manufacturing PMI ticking up slightly to 49.0 (from 48.8) and non-manufacturing declining to 53.2 (from 54.5), driven by both construction (55.7; from 58.2) and services (52.8; from 53.8). The latter has already fallen below its pre-Covid average (53.2), suggesting that the boost from reopening has stalled faster than expected. We recently revised down our forecast for Chinese GDP growth to 5.8% in 2023 and 4.8% in 2024.
Japan: Tokyo Core CPI, which is often considered to lead nationwide developments, remained stable above Bank of Japan's target at 3.2% (consensus 3.3%) in June. We think the gradually rising underlying price pressures will push BoJ to eventually loosen the grip on the yield curve control, either at the next meeting on 28 July, or in September. BoJ's deputy governor Himino commented yesterday that he is seeing signs of demand-driven inflation picking up, although still not commenting on the outlook for making policy changes. JPY was little changed overnight.
US: The US Q1 GDP growth was revised up surprisingly sharply yesterday, from 1.3% q/q AR to 2.0%, reflecting stronger private consumption (+4.2% q/q AR). The release was accompanied by initial jobless claims falling against expectations (to 239k), which led to markets increasing bets on upcoming Fed hikes. The peak Fed Funds Rate is now priced at 34bp above the current level by November, implying around 40% probability of two more rate hikes. Atlanta Fed's Bostic appeared more dovish, saying that he expects inflation to cool without the need for further rate hikes. That said, he also added that he does not expect policy rate cuts even in 2024.
Riksbank: The Riksbank hiked by 25bp and increased QT volumes, in line with our expectations. The updated rate path was to the hawkish side, as it guides towards an additional 30bp worth of hikes during autumn (we keep 25bp in September and a peak at 4.0%). In a separate, but synchronized press release the Riksbank announced that they are considering to start hedging part of the FX reserves. While the news sparked speculations if this was a currency intervention (in disguise), the press release made clear and it was later confirmed by Thedéen that this is about 'sound' risk management, it is not a currency intervention and it does not have a monetary policy purpose. As a result, the knee-jerk drop in EUR/SEK was reversed and net-net the impact from the Riksbank was muted. Read more in our Flash comment Riksbank - 25bp hike and more QT, 29 June.
Equities: Global equities were higher yesterday with lift from the cyclical sectors and banks standing out as the big winners. As mentioned yesterday, stress tests are giving some relief to banks, but a further lift came from strong macro data (better demand and better job data) pushing up the long end of the yield curve. Despite banks sticking out yesterday it was yet another day when the bearish investor consensus had to acknowledge that recession is not imminent and a soft landing seems more plausible. Hence, the pain trade higher in equities continued; and being underweight equities and cyclicals in H1 has been a very costly strategy. In US yesterday Dow +0.8%, S&P 500 +0.5%, Nasdaq 0.00% and Russell 2000 +1.2%. Asian markets are mixed again this morning. However, China is for a change leading the advance while Japan is lower. Chinese NBS PMIs were in no way impressive but apparently solid enough to satisfy investors. Futures in Europe and US are marginally higher.
FI: Global yields rose across the board initiated by the surge in German and Spanish inflation data, which was later followed by strong US data released at 14:30 CET. Jobless claims fell over the past week, and Q1 GDP was clearly revised higher where stronger private consumption is part of the driver. The sell-off was recorded primarily in the sub10y point with 10bp higher 10y German yield to stand at 2.41%. Wednesday's settlement of the TLTRO left excess liquidity EUR 493bn lower to EUR 3.6trn, however this did not leave a mark on the €STR fixings that continue to fix 10bp below the deposit rate. Markets still price a 4% peak in ECB policy rate.
FX: USD rallied together with AUD and CAD yesterday. The former aided by stronger-than-expected US key figures. SEK and EUR lost. The former was largely unaffected by the 25bp rate hike by the Riksbank.
Credit: Yesterday CDS indices grinded tighter for another day with iTraxx Main closing at 76bp (-1bp) and Xover at 411bp (-5bp). Primary issuance was rather limited but did see the French banking group BPCE place a five-year EUR500m senior preferred in social format. The social format was likely a factor that helped boost demand with books reported at EUR2.3bn despite a modest concession for the deal.
Nordic macro
Norway: The Norwegian labour market remains tight but is showing some signs of weakening. New job openings are down, and the number of jobless has begun to edge up. Short-term unemployment too has begun to climb, which is often a harbinger of rising unemployment further ahead. We expect this trend to have continued in June, but with the seasonally adjusted jobless rate still unchanged at 1.8%.
Technical Outlook and Review
DXY:
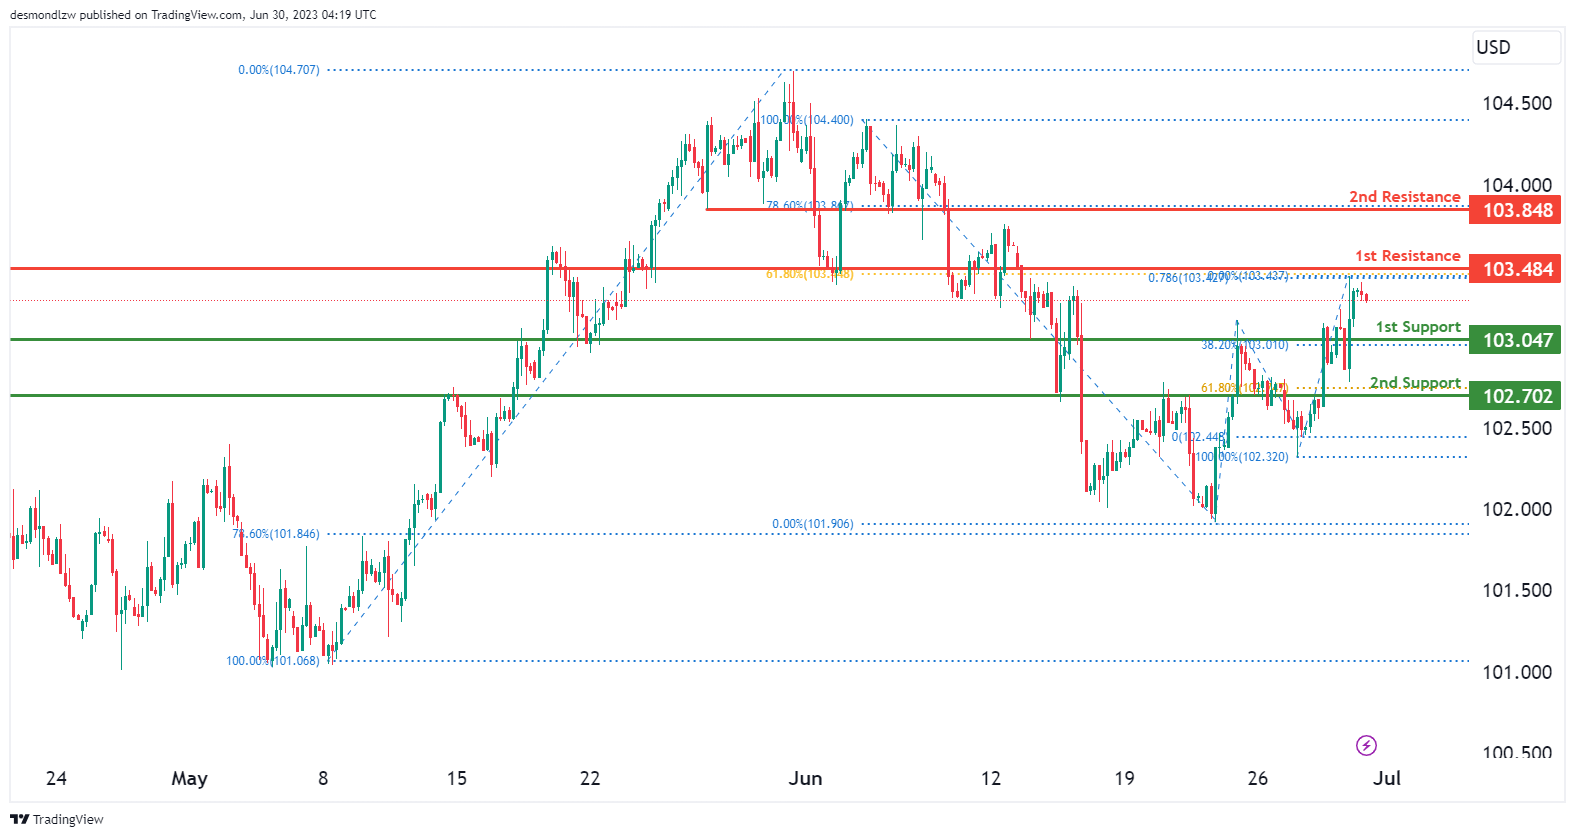
The DXY (US Dollar Index) chart currently exhibits a neutral momentum, suggesting a lack of clear direction. There is a possibility for the price to fluctuate between the 1st support level at 103.047, which is an overlap support and coincides with the 38.2% Fibonacci Retracement. The 2nd support level at 102.702 is an overlap support and coincides with the 61.8% Fibonacci Retracement. The 1st resistance level at 103.484, which represents an overlap resistance, conincides with the 61.8% Fibonacci Retracement and 78.6% Fibonacci Projection, resulting in a Fibonacci confluence.. An additional level to consider is the 2nd resistance at 103.848, an overlap resistance aligning with the 78.6% Fibonacci Retracement.
EUR/USD:
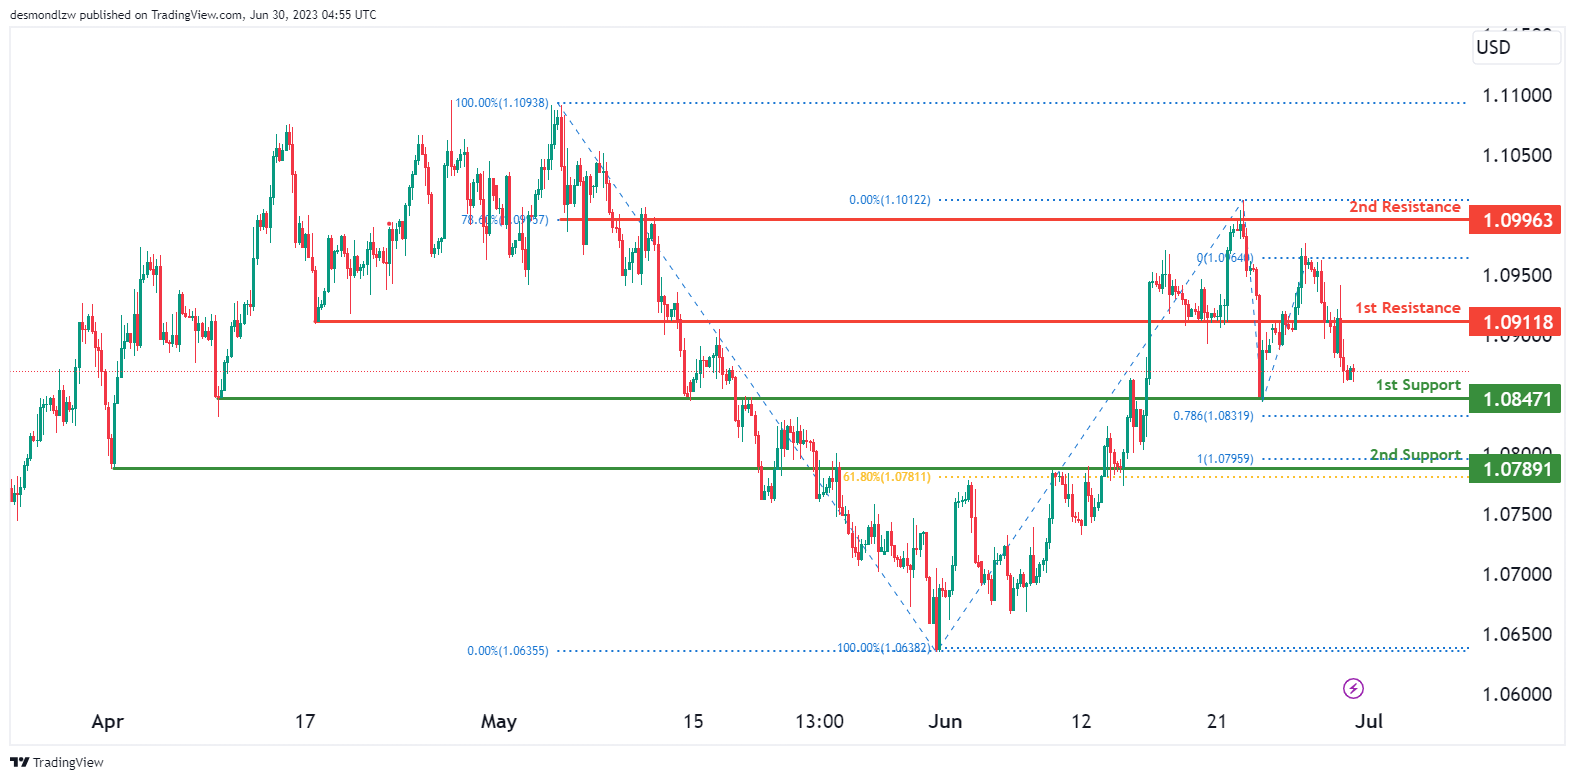
The EUR/USD chart currently shows a bearish momentum, indicating a downward bias in the market. There is a possibility for the price to continue its bearish movement towards the 1st support level at 1.08471, which is considered an overlap support.
Additional support is found at the 2nd support level at 1.07891, identified as an overlap support that aligns with the 61.8% Fibonacci Retracement. On the upside, the 1st resistance level at 1.09118 acts as an overlap resistance, potentially impeding upward price advancement. Furthermore, the 2nd resistance level at 1.109963 represents another overlap resistance that aligns withe 78.6% Fibonacci Retracement.
GBP/USD:
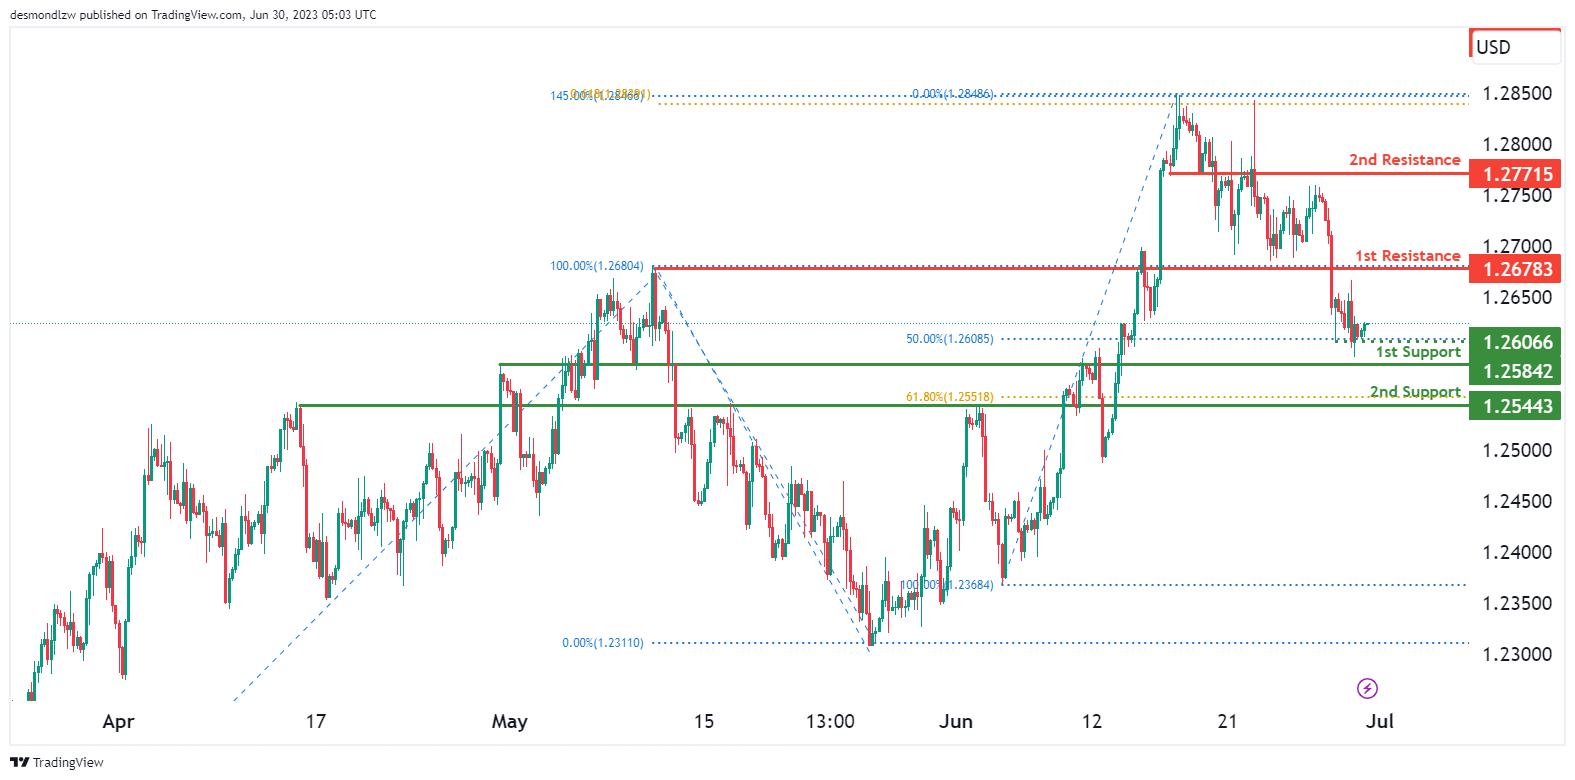
The GBP/USD chart currently indicates a bearish momentum, suggesting a downward trend in the market. There is a potential for the price to continue its bearish movement towards the 1st support level at 1.25842, which is identified as an overlap support, if price breaks below the intermediate support first at 1.26066..
Additional support is found at the 2nd support level at 1.25443, characterized as an overlap support and coincides with the 61.80% Fibonacci Retracement.
On the upside, the 1st resistance level at 1.26783 acts as an overlap resistance, potentially impeding upward price advancement. Furthermore, the 2nd resistance level at 1.27715 represents an overlap resistance.
USD/CHF:
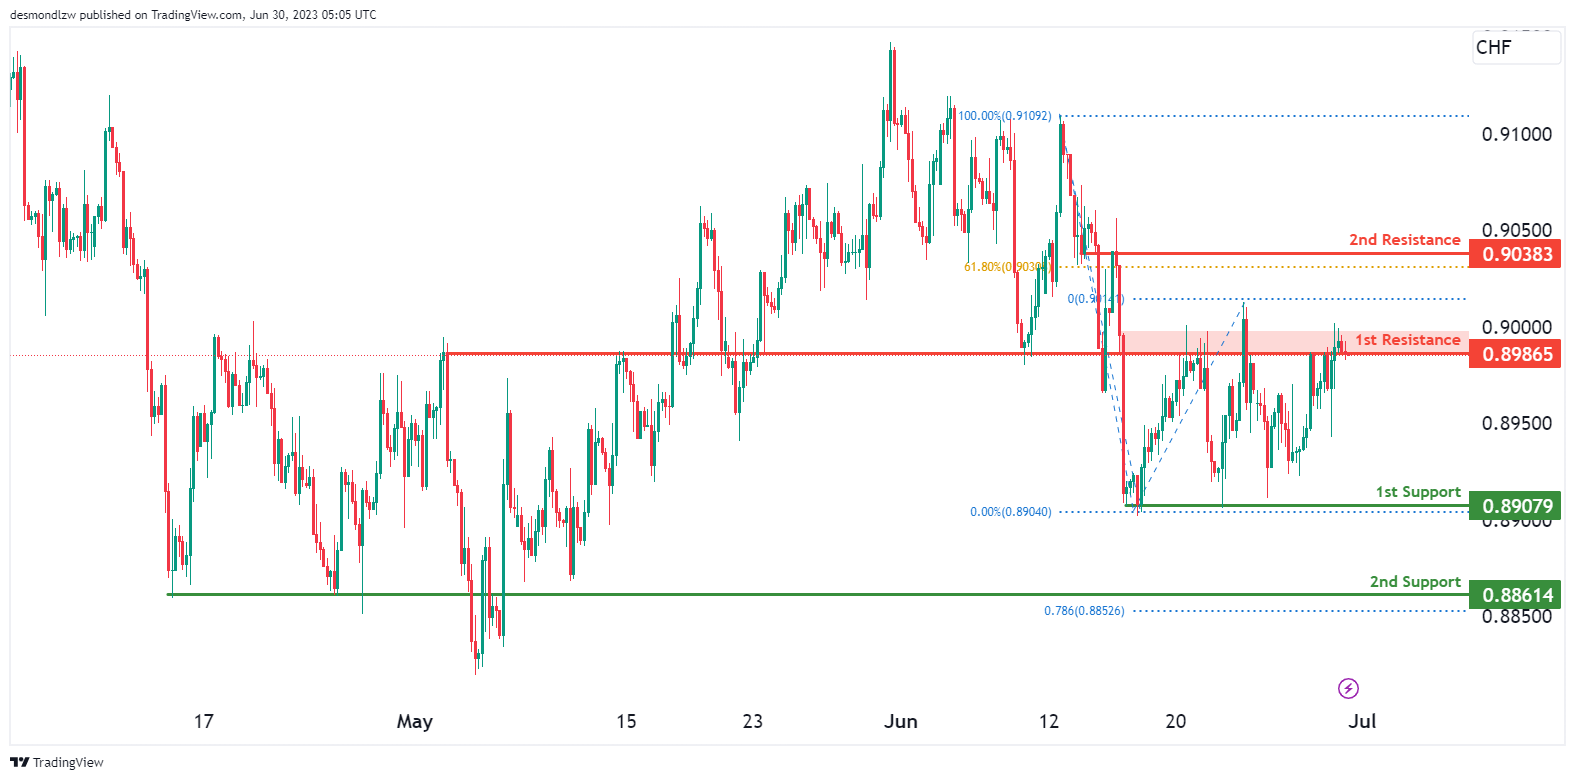
The USD/CHF chart currently demonstrates a weak bearish momentum. There is a potential for the price to reverse from the 1st resistance level at 0.89865, which is identified as an overlap resistance, and drop lower.
The 1st support level at 0.89079 is a multi-swing low overlap support while the 2nd support at 0.88614 is an overlap support that aligns close to the 78.6% Fibonacci Projection.
Additionally, the 2nd resistance level at 0.9038 is considered an overlap resistance that aligns with close to the 61.8% Fibonacci Retracement.
USD/JPY:
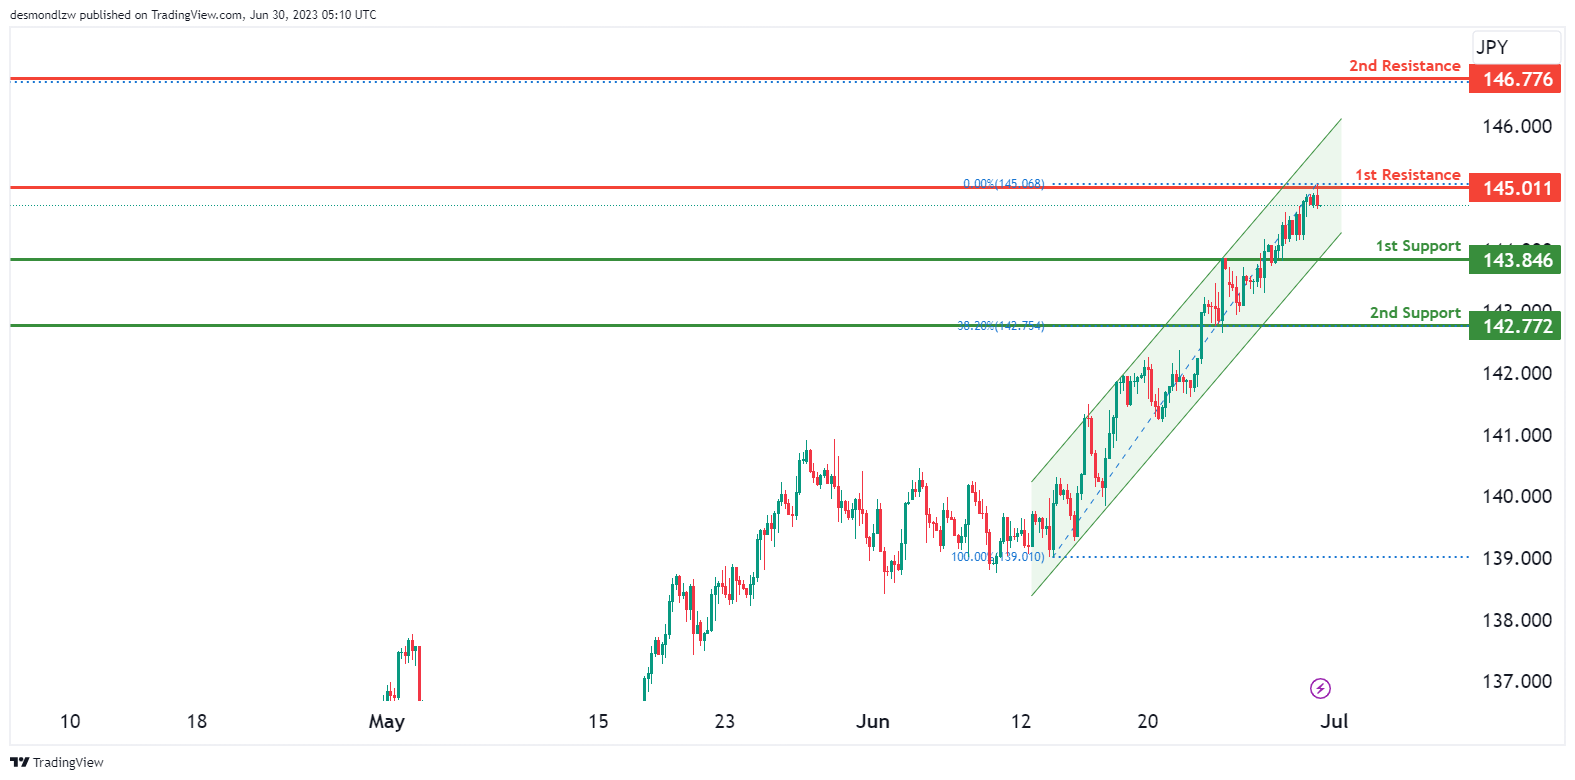
The USD/JPY chart currently exhibits a bullish momentum, characterized by the price movement within a bullish ascending channel, suggesting a potential for further upward movement.
There is a possibility of a bullish continuation towards the 1st resistance level at 145.011. Additionally, the 2nd resistance level at 146.776 acts as another resistance level which coincides with the 78.60% Fibonacci Retracement.
On the downside, the 1st support level at 143.846 is identified as an overlap support, providing potential strength to the support zone. Furthermore, the 2nd support level at 142.772 is an overlap support and also aligns with the 38.2% Fibonacci Projection.
USD/CAD:
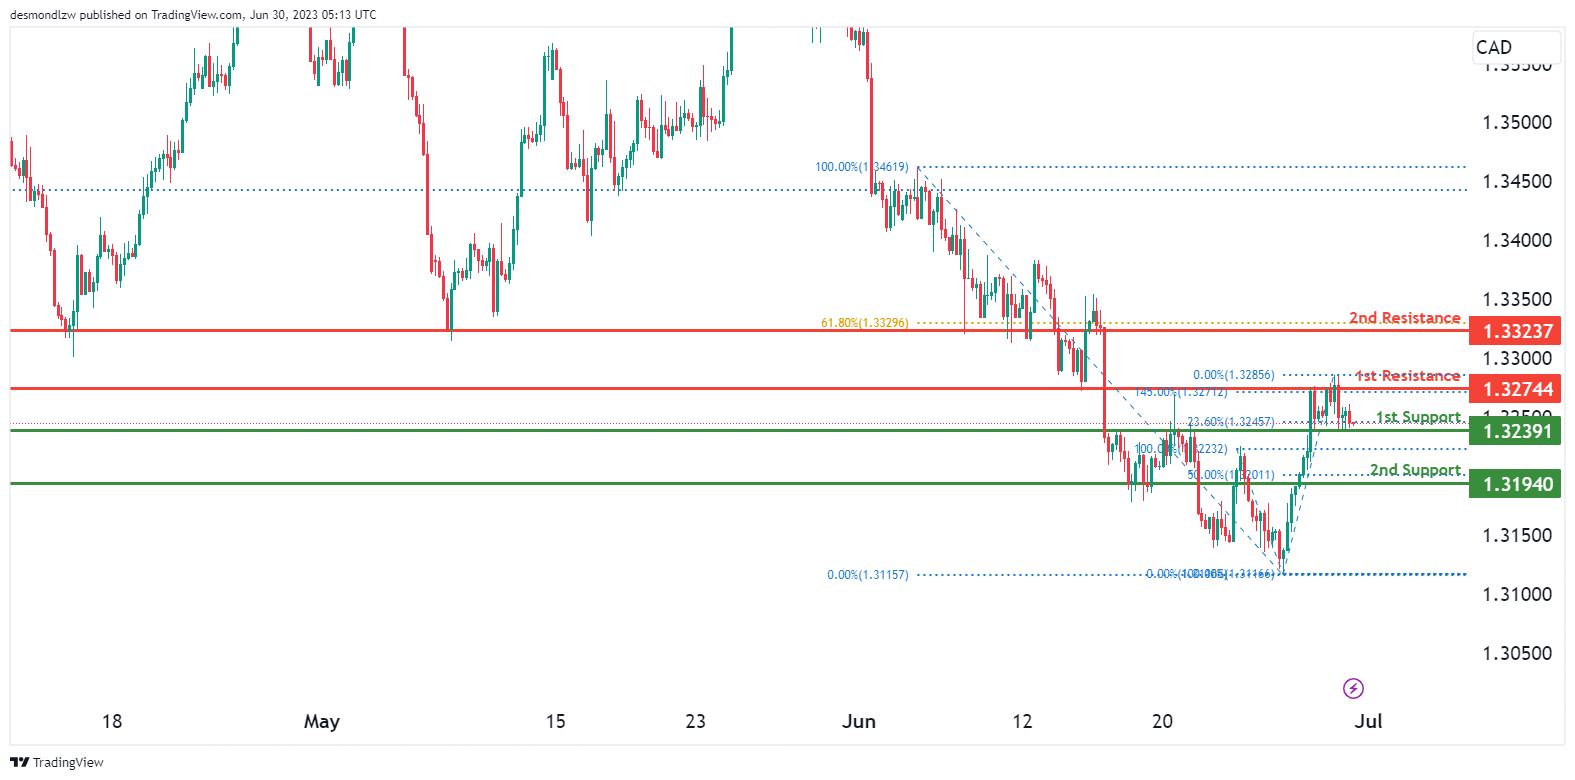
USD/CAD currently exhibits a weak bullish momentum on the chart. Several factors contribute to this momentum, indicating that the price could potentially continue its bullish movement if it bounces from the 1st support level.
The 1st support level is located at 1.32391 and is considered good due to its overlap support characteristics and also aligns with the 23.6% Fibonacci Retracement. Additionally, there is a 2nd support level at 1.31940, which is significant as it represents an overlap support.
On the resistance side, the 1st resistance is positioned at 1.32744 and is considered good because it represents overlap resistance. Furthermore, there is a 2nd resistance level at 1.33237, which is significant as it represents overlap resistance and aligns with a 61.8% Fibonacci Retracement.
AUD/USD:
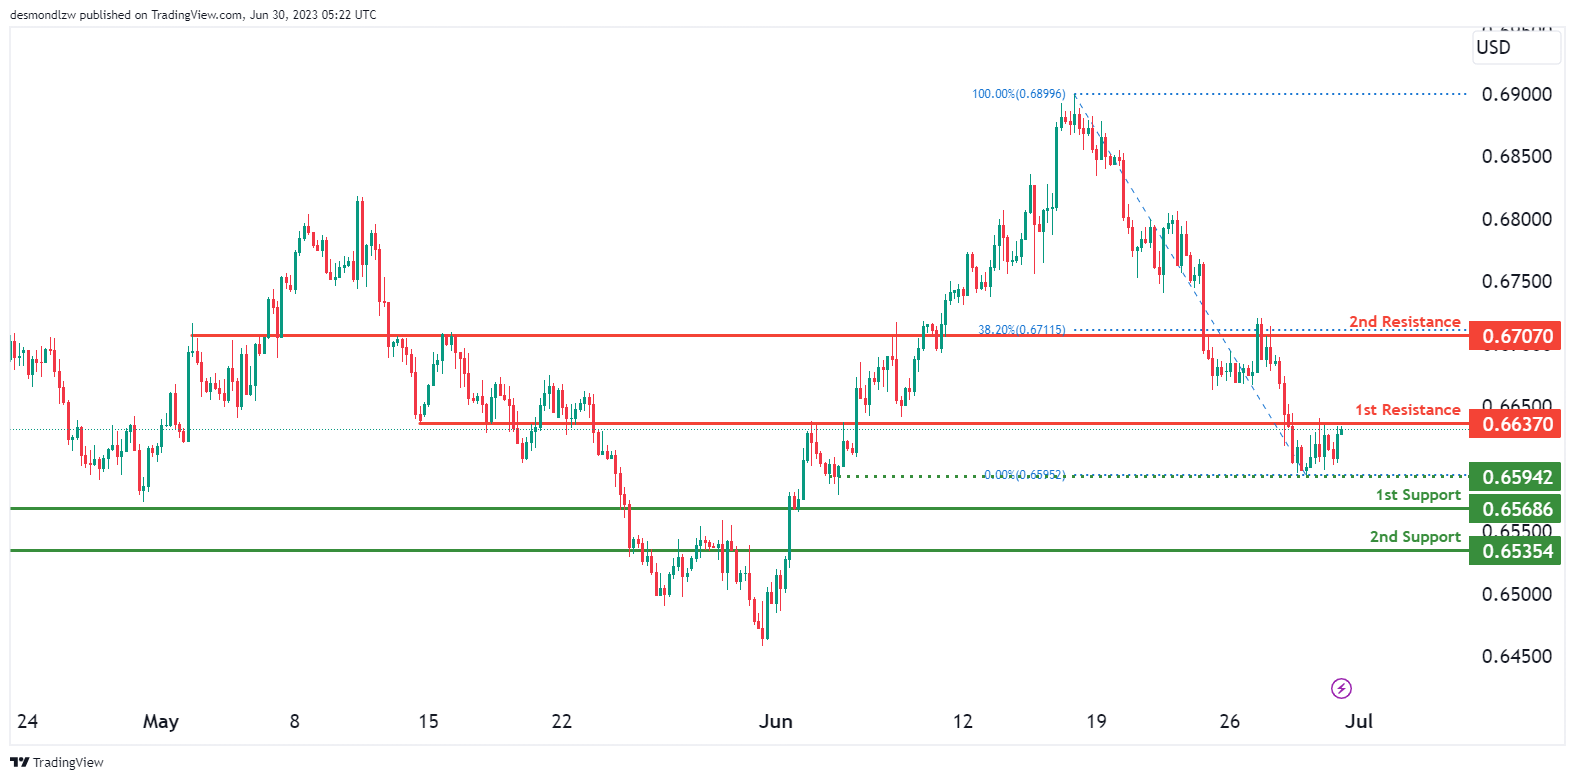
AUD/USD currently exhibits bullish momentum on the chart. Several factors contribute to this momentum, indicating that the price could potentially continue its bearish movement towards the 1st resistance level.
The 1st support level is located at 0.65686 and is considered good due to its overlap support characteristics. Additionally, there is a 2nd support level at 0.65354, which is significant as it represents an overlap support.
On the resistance side, the 1st resistance is positioned at 0.66370 and is considered good because it represents overlap resistance. Furthermore, there is a 2nd resistance level at 0.67070, which is significant as it also represents overlap resistance that aligns with the 38.2% Fibonacci Retracement.
NZD/USD
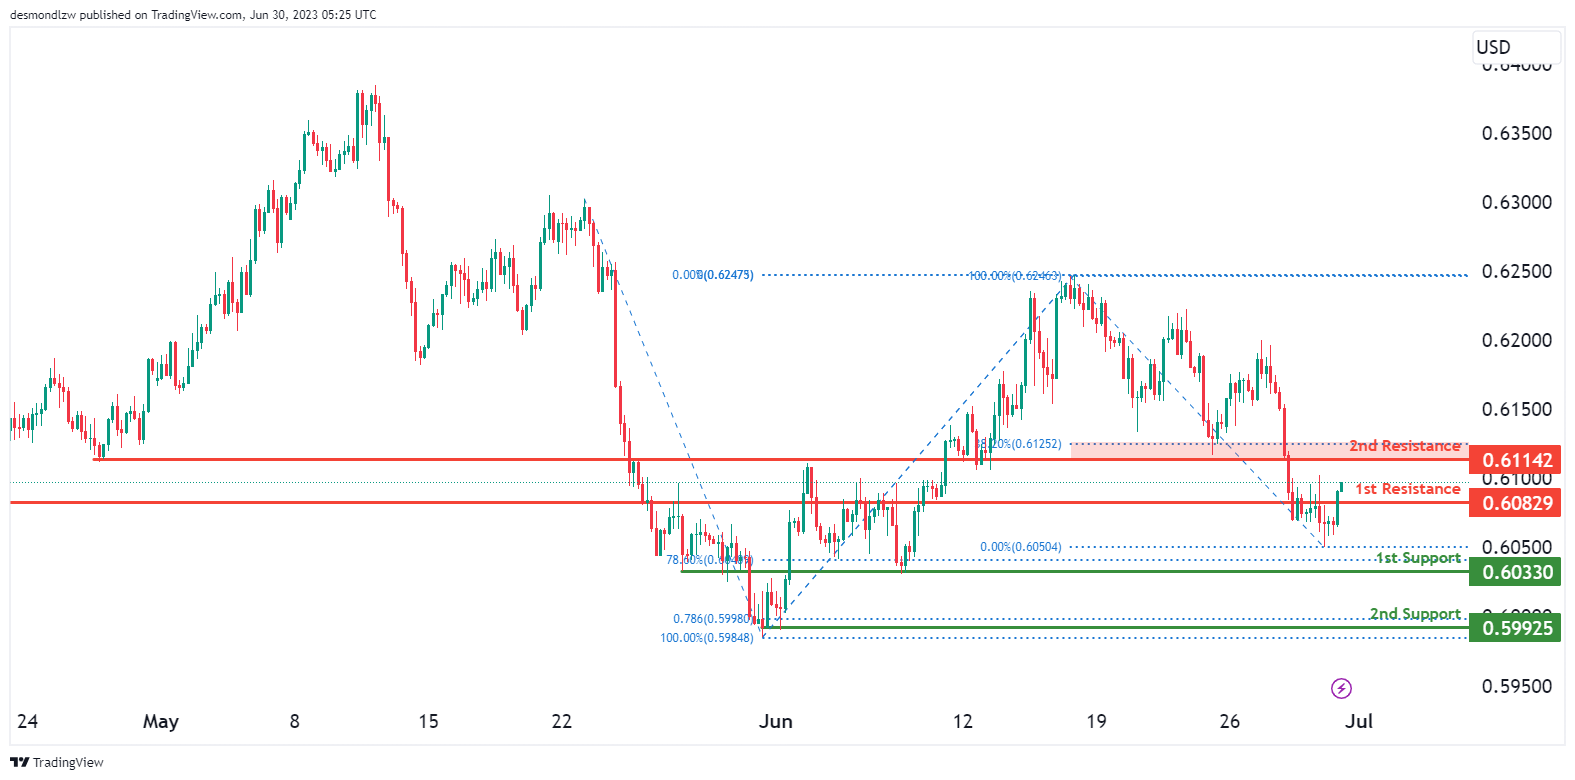
NZD/USD currently shows bullish momentum on the chart. Several factors contribute to this momentum, indicating that the price could potentially continue its bullish movement towards the 1st resistance level.
The 1st support level is located at 0.60330 and is considered good due to its overlap support characteristics and also aligns with the 78.6% Fibonacci Retracement. Additionally, there is a 2nd support level at 0.59925, which is is a swing-low support..
On the resistance side, the 1st resistance is positioned at 0.60829 and is considered good because it represents an overlap resistance. Furthermore, there is a 2nd resistance level at 0.61142, which is significant as it represents an overlap resistance that aligns close to the 38.2% Fibonacci retracement level.
DJ30:
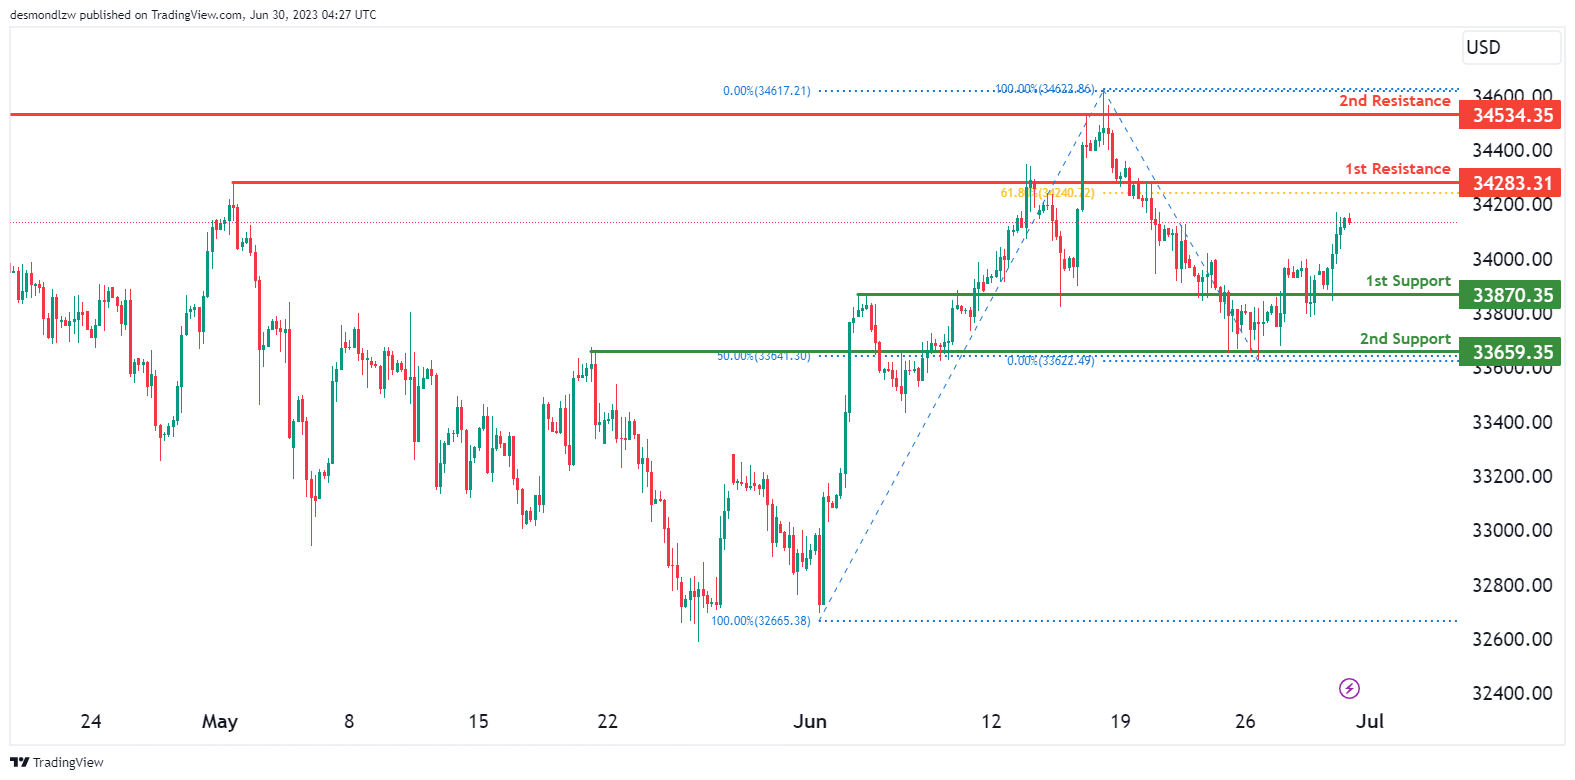
DJ30 (Dow Jones Industrial Average) currently exhibits a bullish overall momentum on the chart. Several factors contribute to this momentum, indicating that the price could potentially continue its bullish movement towards the 1st resistance at 34283.31.
The 1st support level is located at 33870.35 and is considered good due to its overlap support characteristics. Additionally, there is a 2nd support level at 33659.35, which is significant as it represents multi-swing low support and aligns with a 50% Fibonacci Retracement.
On the resistance side, the 1st resistance is positioned at 342283.31 and is considered good because it represents an overlap resistance that aligns with a 61.8% Fibonacci Retracement.. Furthermore, there is a 2nd resistance level at 34534.35, which is significant as it represents swing high resistance.
GER30:
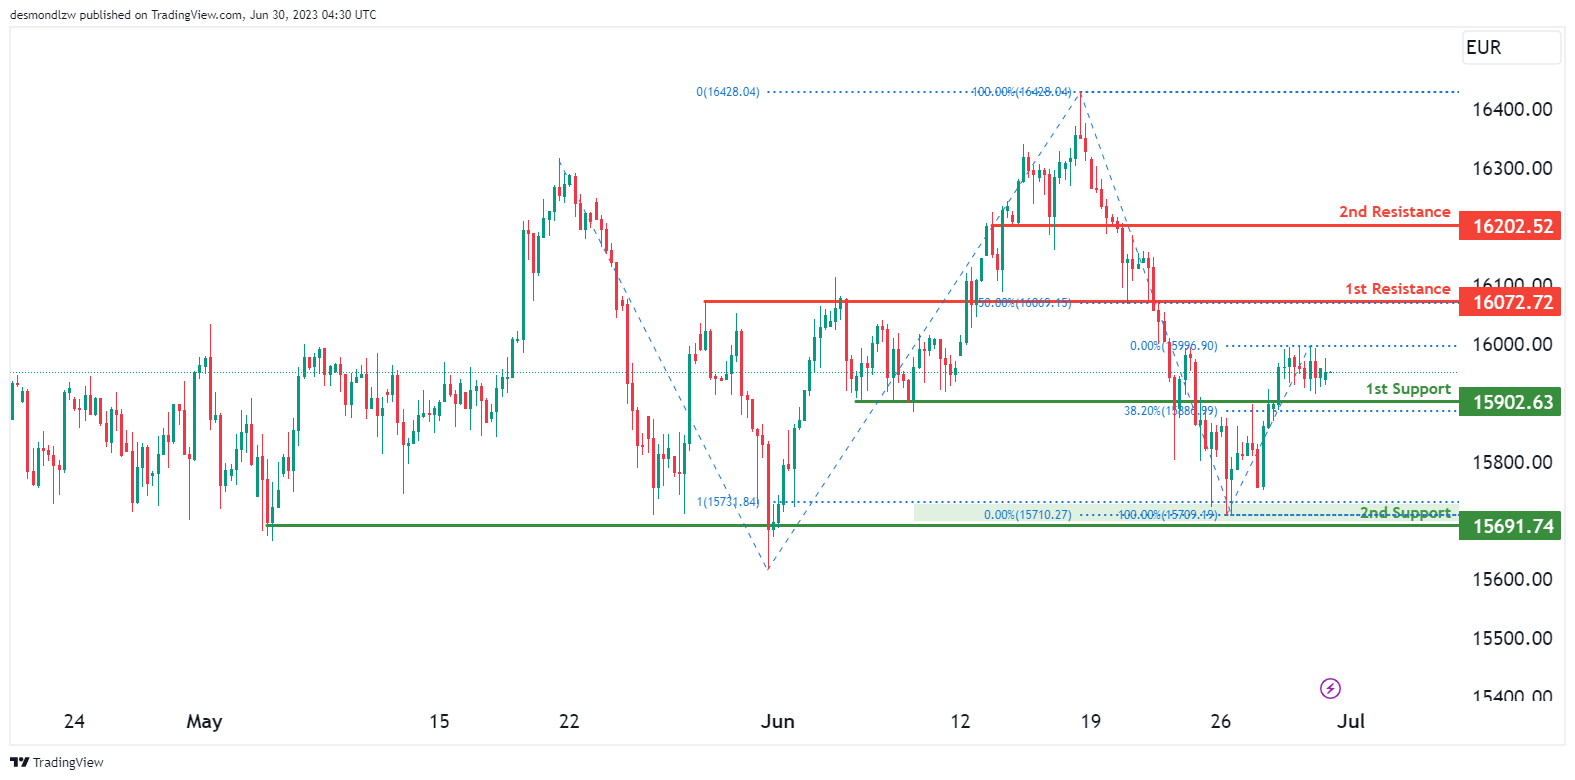
GER30 (German DAX) currently exhibits a bullish overall momentum on the chart. Several factors contribute to this momentum, indicating that the price could potentially continue its bullish movement towards the 1st resistance at 16072.72.
The 1st support level at 15902.63 is considered good due to its overlap support characteristics and aligns with the 38.2% Fibonacci Retracement. Additionally, there is a 2nd support level at 15691.74, which is significant as it represents a multi-swing low overlap support.
On the resistance side, the 1st resistance is positioned at 16072.72 and is considered good because it represents an overlap resistance that aligns with the 50% Fibonacci Retracement while the 2nd resistance is positioned at 16202.52 which is an overlap resistance.
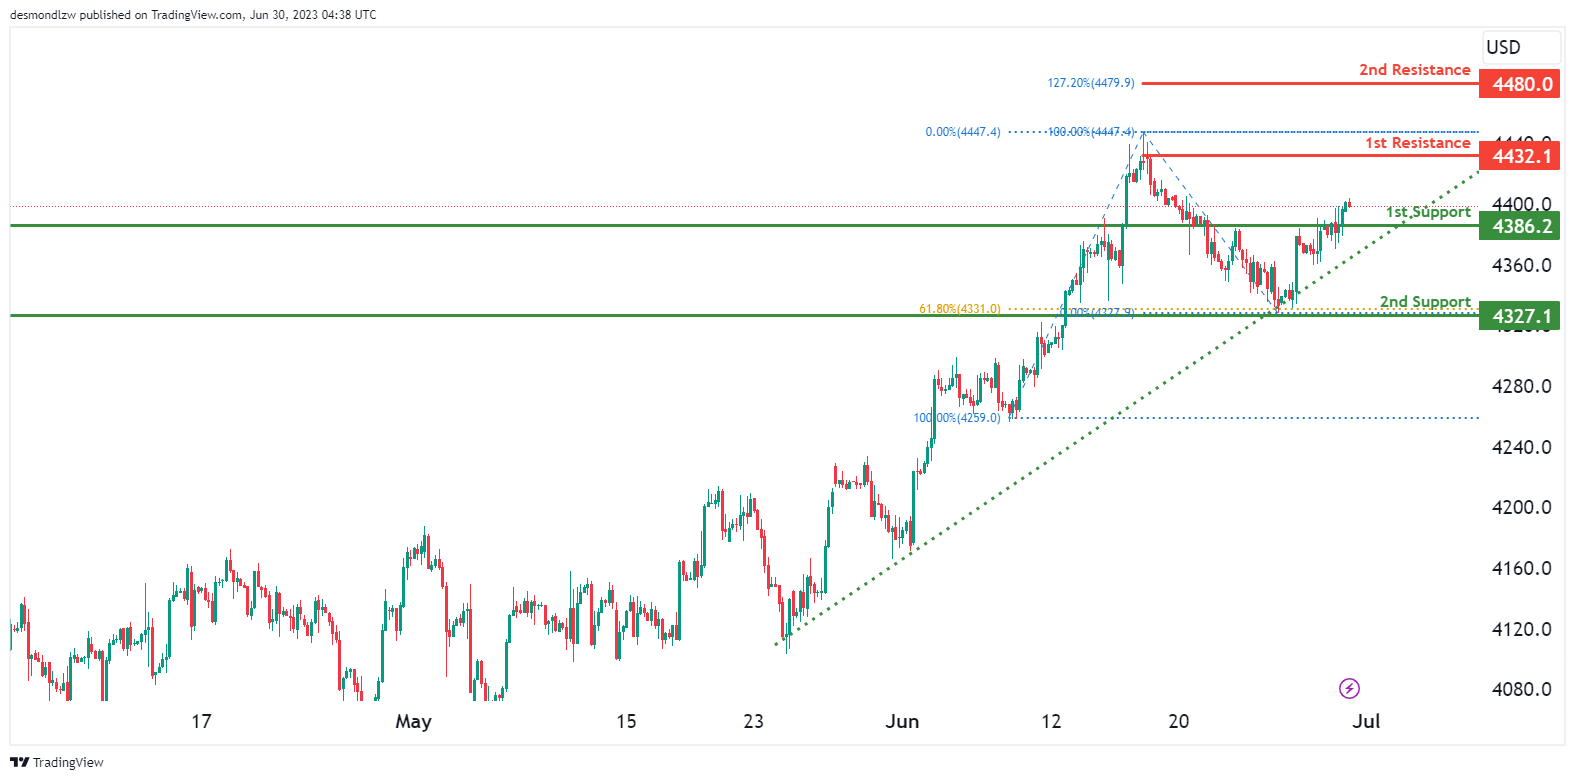
US500
US500 (S&P 500) currently exhibits a bullish momentum on the chart with high confidence. Several factors contribute to this momentum, suggesting that the price could potentially continue its bullish movement towards the 1st resistance level.
The 1st support level is located at 4386.20 and is considered as an overlap support. Additionally, there is a 2nd support level at 4327.10, which is significant as it represents overlap support and aligns with the 61.8% Fibonacci Retracement.
On the resistance side, the 1st resistance is positioned at 4432.10 and is considered good because it represents swing high resistance. Furthermore, there is a 2nd resistance level at 4480.00, which aligns with the 127.2% Fibonacci Extension..
BTC/USD:
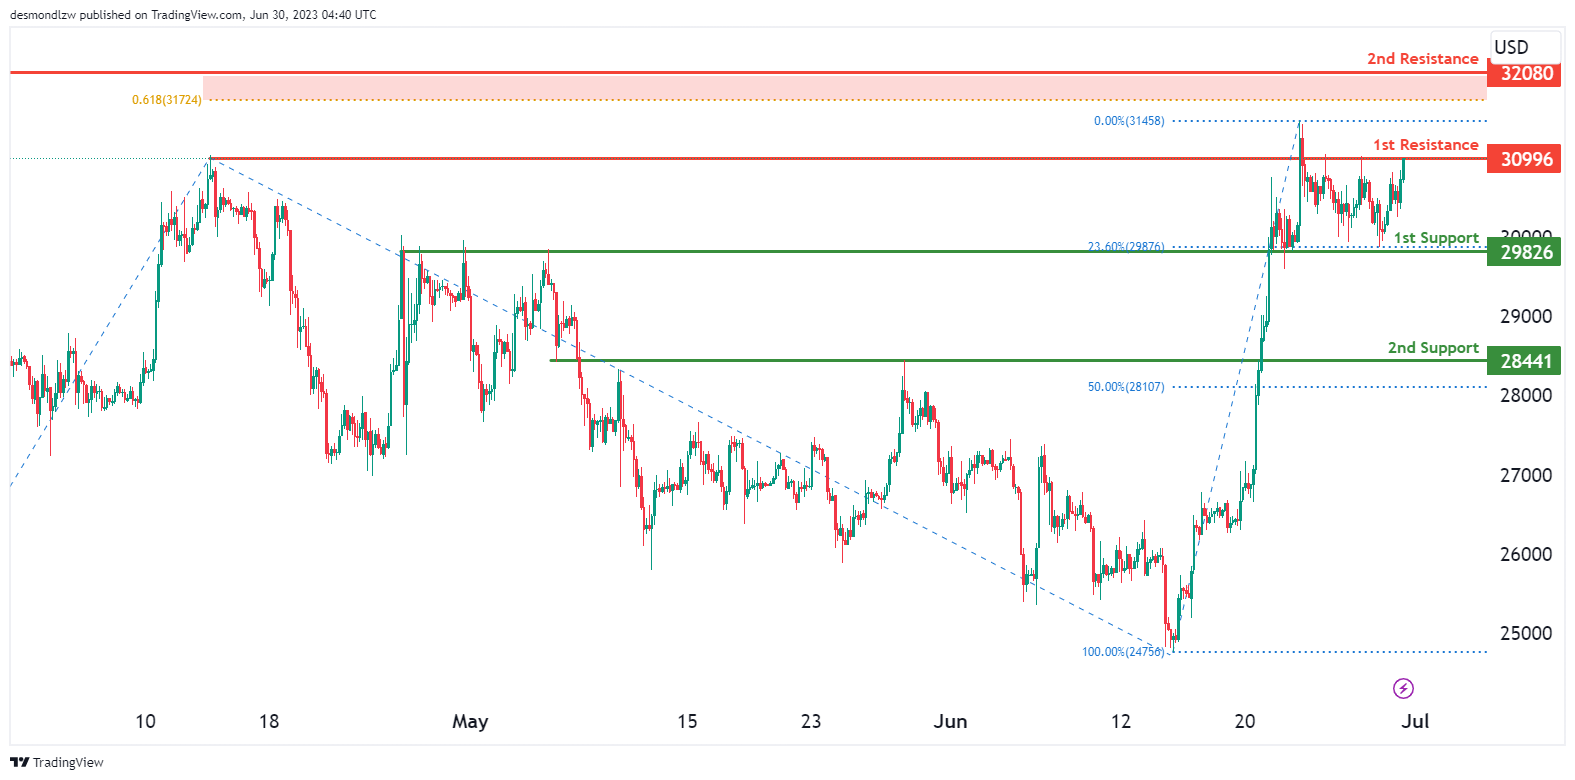
BTC/USD currently exhibits a bullish overall momentum on the chart. Several factors contribute to this momentum, indicating that the price could potentially continue its bullish movement towards the 1st resistance level at 30996.00. The 1st support level at 29826.00 is considered good due to its pullback support and also aligns with the 23.6% Fibonacci Retracement..
On the resistance side, the 1st resistance at 30996.00 is significant because it represents an overlap resistance. The 2nd resistance at 32080.00 is also noteworthy as it is an overlap resistance and aligns close to a 61.8% Fibonacci Projection.
ETH/USD:
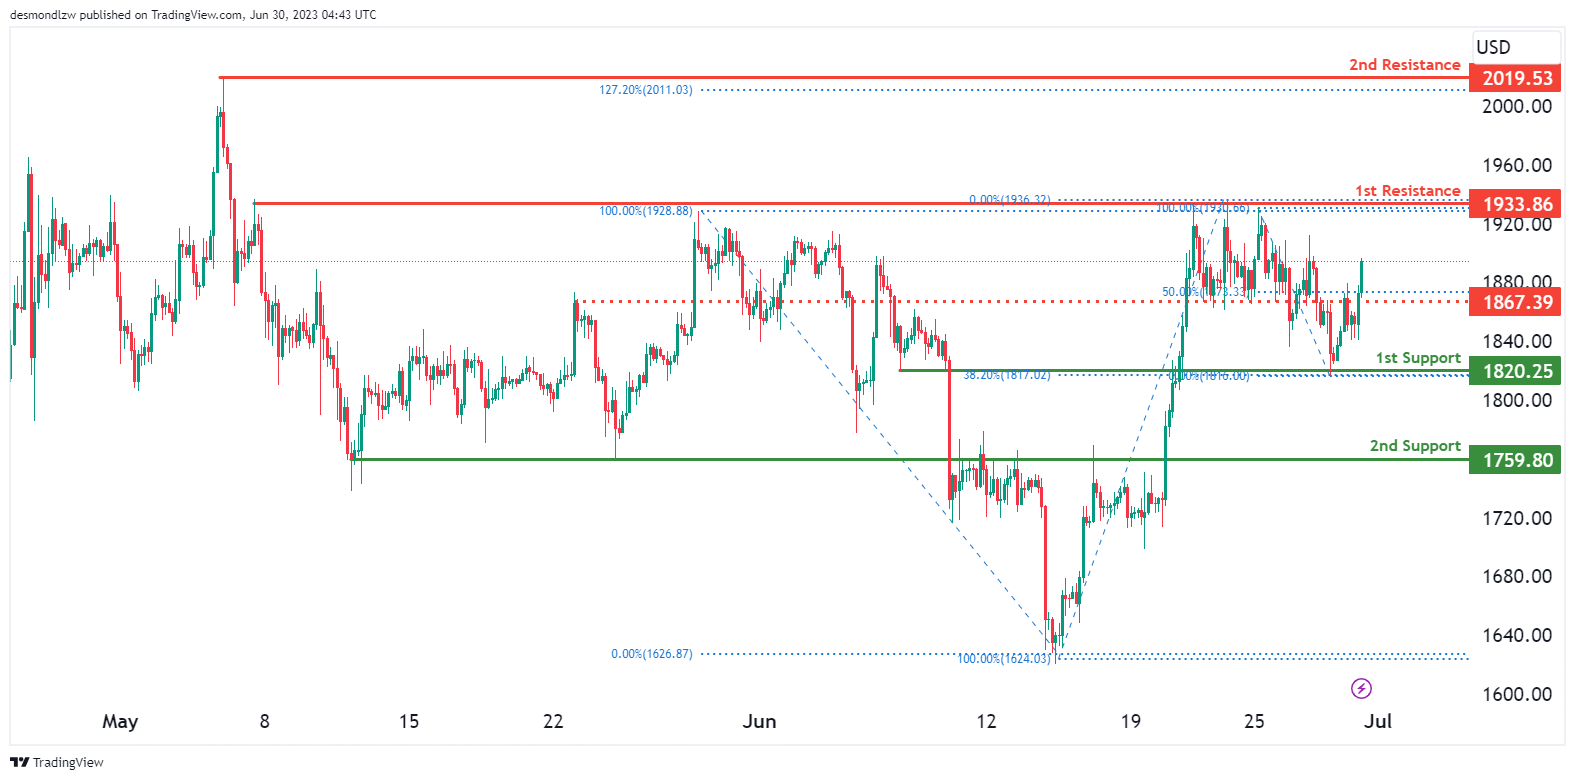
ETH/USD currently exhibits a strong bullish momentum on the chart with high confidence.Based on the bullish momentum, the price could potentially continue its upward movement towards the 1st resistance level.
The 1st support level is located at 1820.25 and is considered good due to its overlap support characteristics, as well as aligning with a 38.2% Fibonacci Retracement. Additionally, there is a 2nd support level at 1759.80, which is an overlap support.
On the resistance side, the 1st resistance is positioned at 1933.86 and is considered good because it represents multi-swing high resistance. Furthermore, there is a 2nd resistance level at 2019.53, which is significant as it represents swing high resistance and aligns with a 127.20% Fibonacci Extension.
WTI/USD:
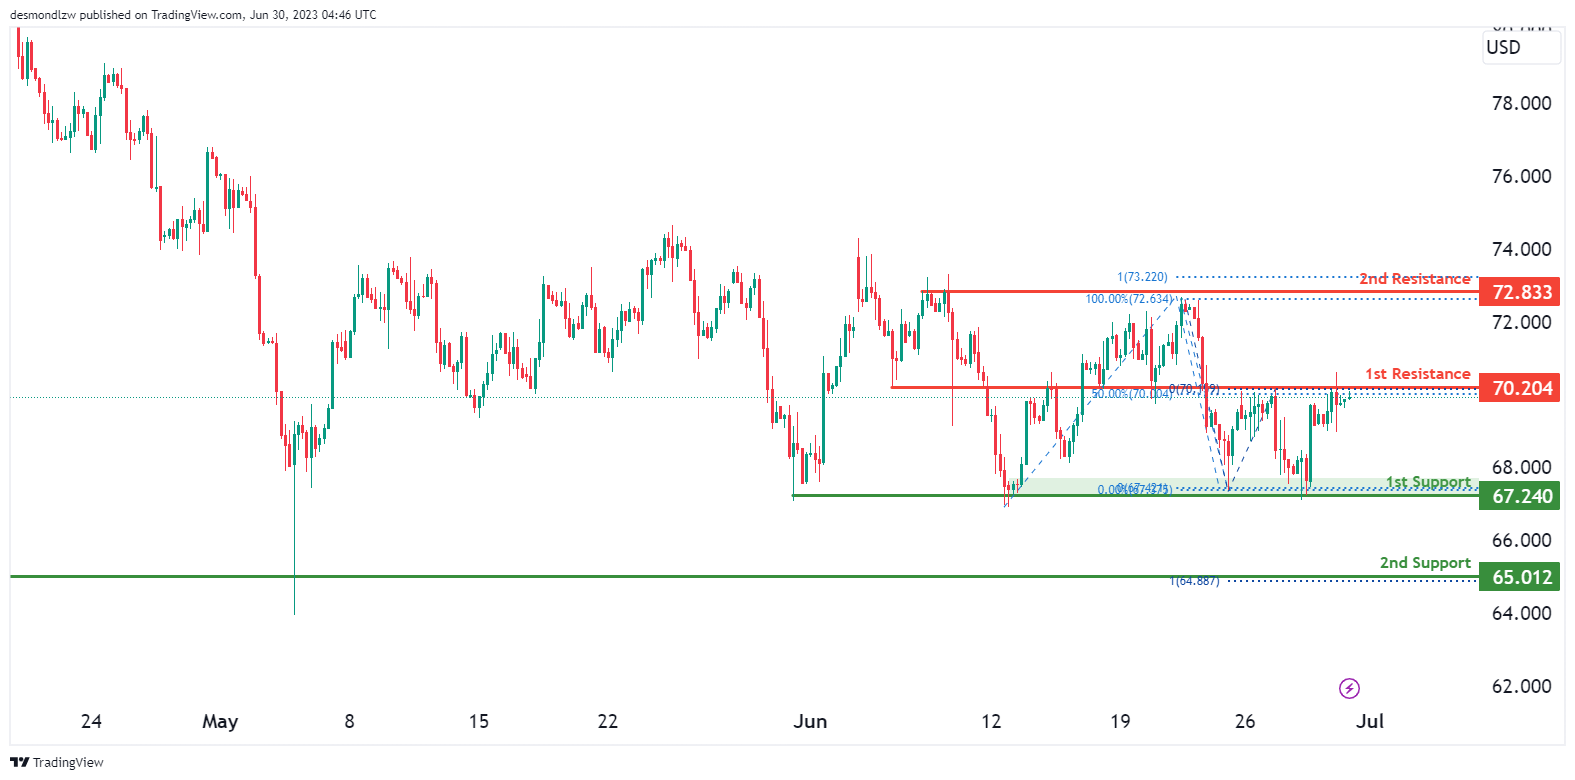
WTI (West Texas Intermediate) currently shows a wek bullish momentum on the chart. Several factors contribute to this momentum, indicating that the price could potentially move above the 1st resistance at 70.204 before reversing from this level. The 1st support level is considered good as it represents multi-swing low support. The 2nd support level at 65.012 is an overlap support that aligns with the 100% Fibonacci Projection.
On the resistance side, the 1st resistance at 70.204 is significant as it represents multi-swing high resistance. Similarly, the 2nd resistance at 72.833 is noteworthy as it also represents multi-swing high resistance.
XAU/USD (GOLD):
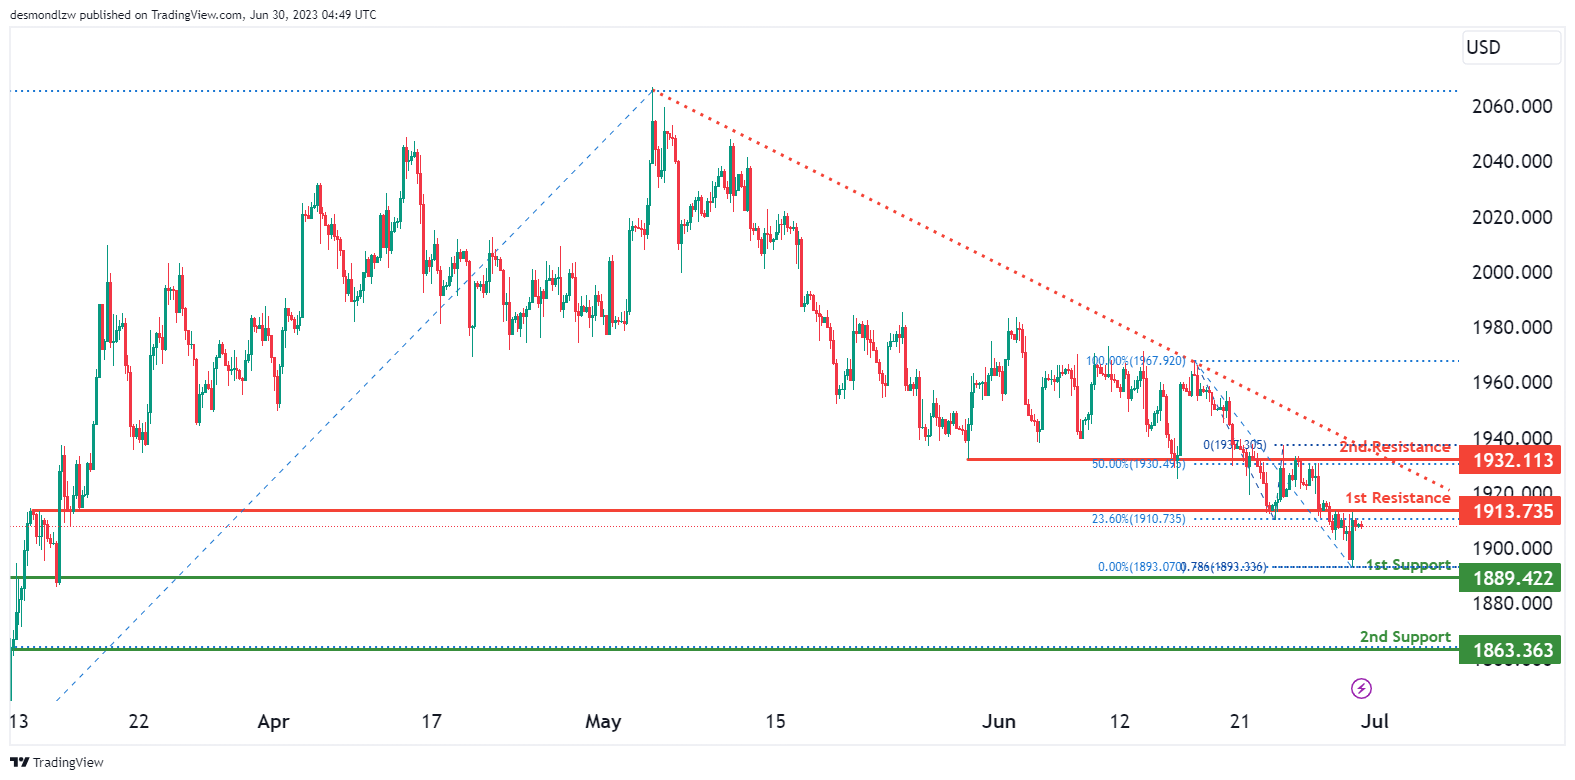
The XAU/USD (Gold) chart displays a bearish momentum, indicating a negative outlook for the market. Factors contributing to this momentum include the potential for a bearish reversal off the 1st resistance level and a move towards the 1st support level.
The 1st support level at 1889.422 is identified as an overlap support, suggesting its significance in providing potential price stability. The 2nd support level at 1863.363 also acts as an overlap support that aligns with the 78.6% Fibonacci Retracement.
On the upside, the 1st resistance level at 1913.735 represents an overlap resistance that aligns with the 23.6% Fibonacci Retracement. Furthermore, the 2nd resistance level at 1932.113 is classified as an overla resistance that aligns with the 50.0% Fibonacci Retracement.
USD/CAD Daily Outlook
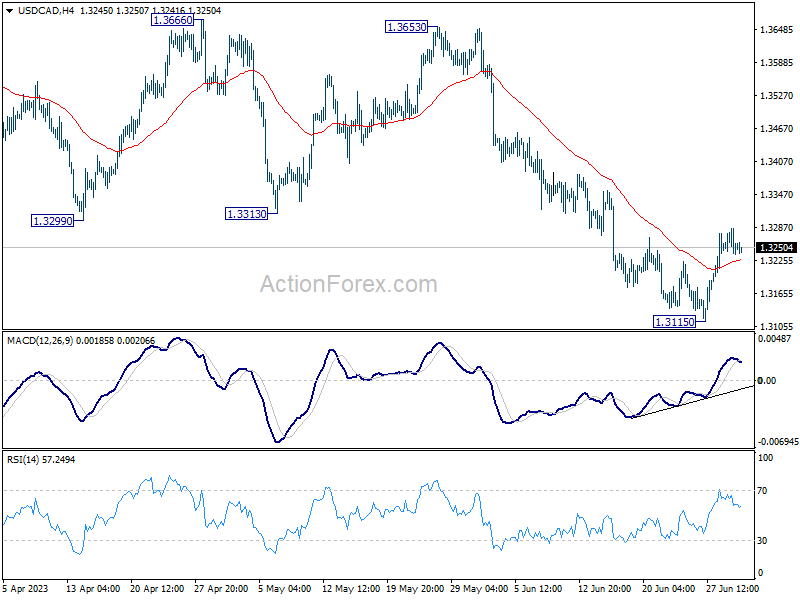
Daily Pivots: (S1) 1.3233; (P) 1.3259; (R1) 1.3280; More....
Intraday bias in USD/CAD remains mildly on the upside for the moment. Rebound from 1.3115 short term bottom would target 1.3229 support turned resistance. Firm break there will extend the rebound to 55 D EMA (now at 1.3384). On the downside, break of 1.3115 is needed to confirm resumption of recent decline. Otherwise, more consolidative trading should be seen first, in case of retreat.
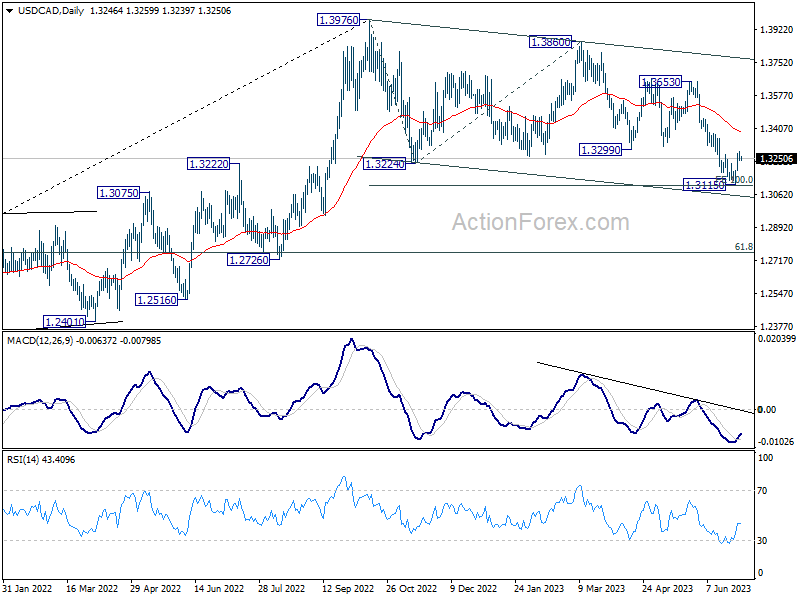
In the bigger picture, price actions from 1.3976 are still viewed as a correction to up trend from 1.2005 (2021 low), but chance of trend reversal is increasing with current decline. In either case, risk will stay on the downside as long as 1.3299 support turned resistance holds, even in case of strong rebound. Next target is 61.8% retracement of 1.2005 to 1.3976 at 1.2758. Sustained trading above 1.3229 will raise the chance that the correction has completed and turn focus back to 1.3653 resistance.
AUD/USD Daily Report
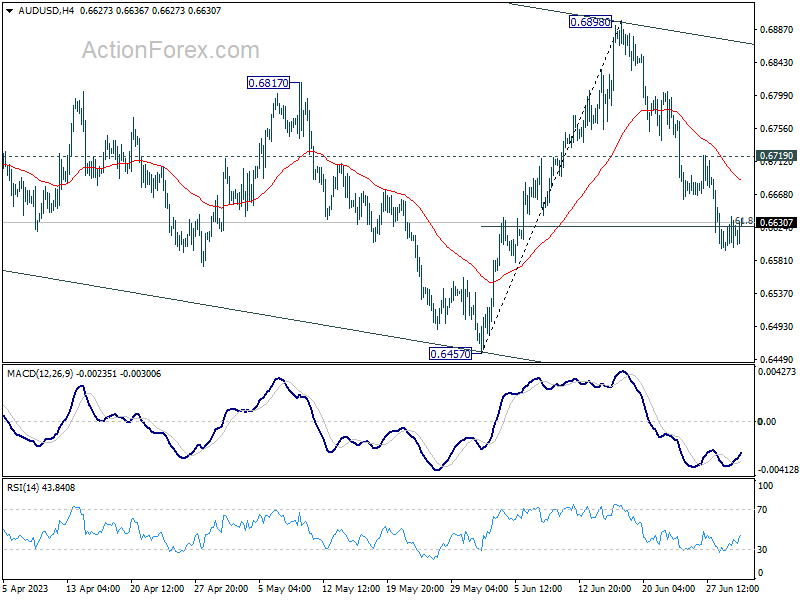
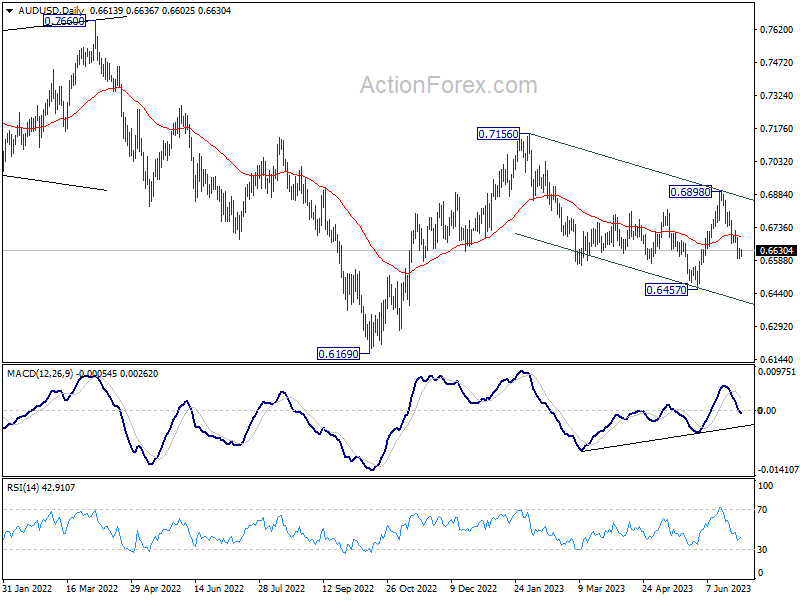
Daily Pivots: (S1) 0.6595; (P) 0.6618; (R1) 0.6639; More...
AUD/USD continues to gyrate around 61.8% retracement of 0.6457 to 0.6898 at 0.6625 and intraday bias is turned neutral first. Further decline will remain in favor as long as 0.6719 resistance holds. Sustained trading below 0.6625 will pave the way to 0.6457 key support level.
In the bigger picture, outlook is mixed up by the deeper than expected pull back from 0.6898. Still, price actions from 0.7156 are seen as a correction to rebound from 0.6169. Break of 0.6457 will resume the fall towards 0.6169 low. On the upside, though, break of 0.6898 resistance will argue that rise from 0.6169 is ready to resume through 0.7156.
USD/JPY Daily Outlook
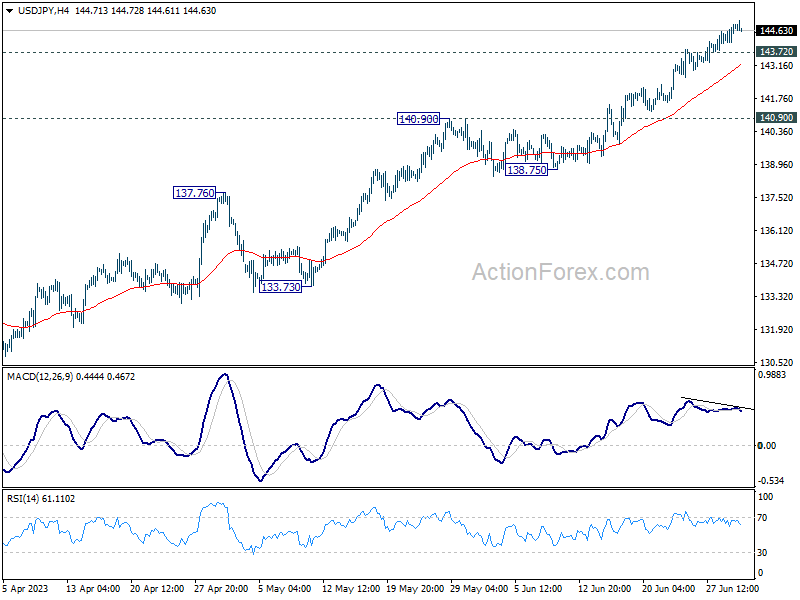
Daily Pivots: (S1) 144.31; (P) 144.61; (R1) 145.08; More...
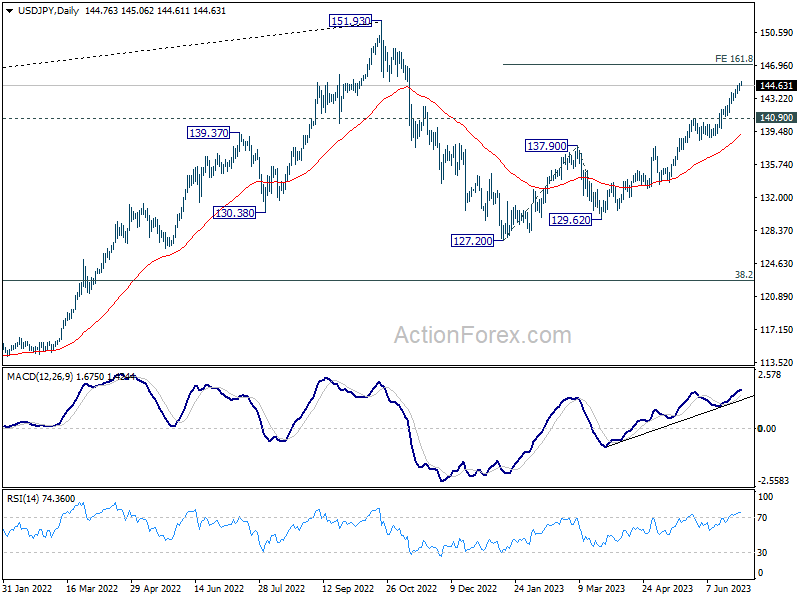
While USD/JPY continues to lose upside momentum as seen in 4H MACD, there is no sign of topping yet. Intraday bias stays on the upside for 161.8% projection of 127.20 to 137.90 from 129.62 at 146.93. On the downside, below 143.72 minor support will turn bias again and bring consolidations. But further rally will remain in favor as long as 140.90 resistance turned support holds.
In the bigger picture, rise from 127.20 is currently seen as the second leg of the corrective pattern from 151.93 high. Further rally is expected as long as 137.90 resistance turned support holds, to retest 151.93. But strong resistance could be seen there to limit upside. Break of 137.90 will indicate the the third leg has started back towards 127.20.
USD/CHF Daily Outlook
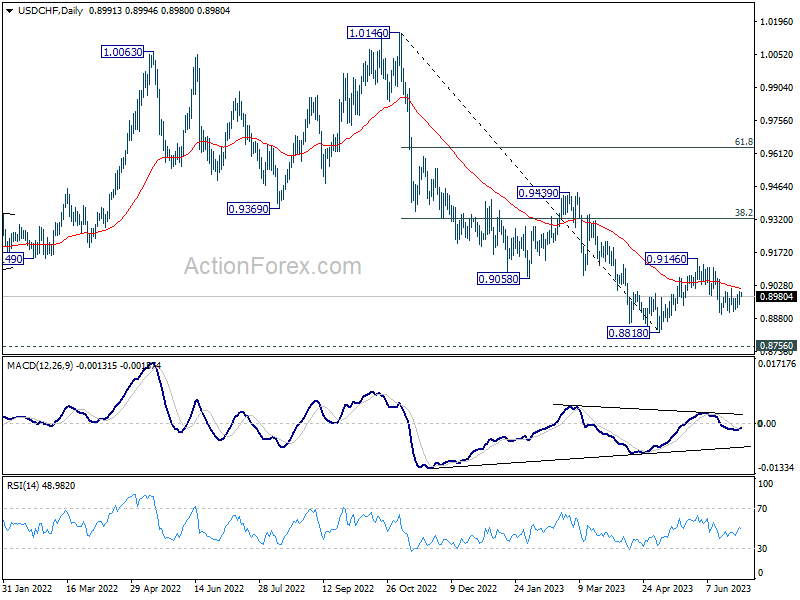
Daily Pivots: (S1) 0.8959; (P) 0.8980; (R1) 0.9018; More...
Intraday bias in USD/CHF stays neutral as range trading continues and outlook is unchanged. On the downside, break of 0.8900 will resume the fall from 0.9146 to 0.8818 low or below. But for now, strong support is still expected from 0.8756 long term support to bring rebound. On the upside, above 0.9011 will bring stronger rise towards 0.9146 resistance.
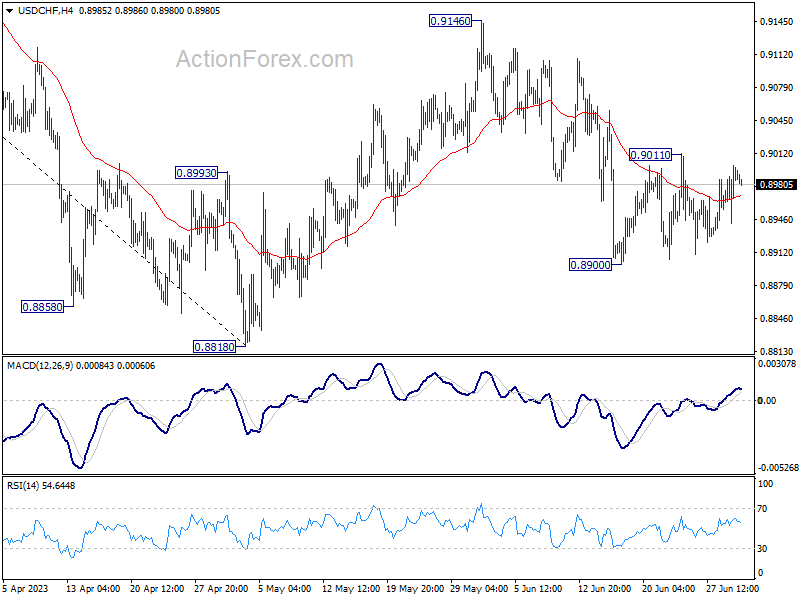
In the bigger picture, fall from 1.1046 (2022 high) is seen as a leg in the long term range pattern from 1.0342 (2016 high), which might have completed at 0.8818 already, just ahead of 0.8756 long term support. Sustained trading above 0.9058 support turned resistance should confirm medium term bottoming.
GBP/USD Daily Outlook
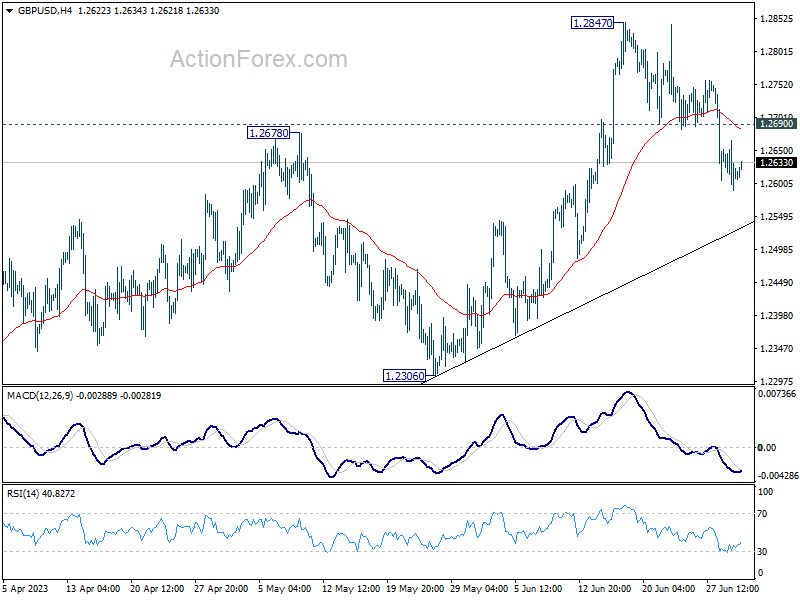
Daily Pivots: (S1) 1.2580; (P) 1.2623; (R1) 1.2656; More...
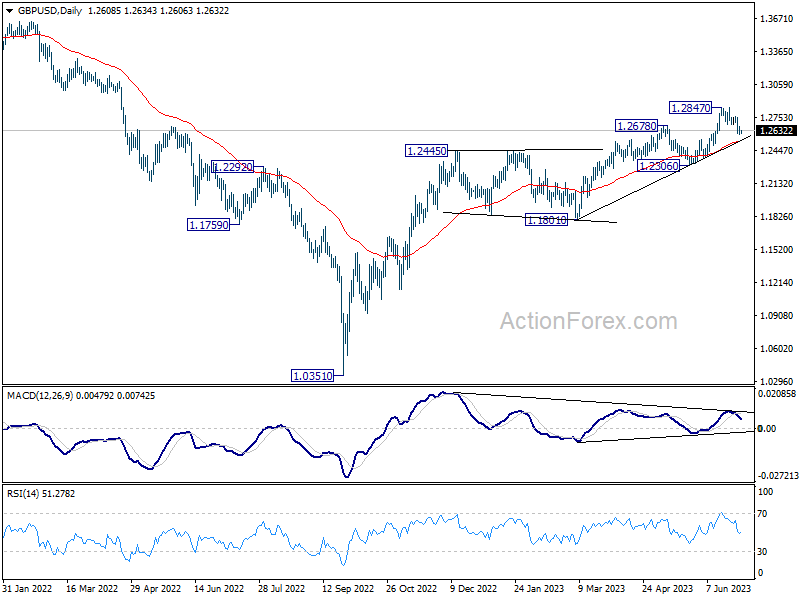
Intraday bias in GBP/USD remains mildly on the downside as fall from 1.2847 short term top is in progress. Considering bearish divergence condition in D MACD, sustained break of 55 D EMA (now at 1.2529) will argue that it's already in correction to larger up trend and target 1.2306 support. On the upside, though, break of 1.2690 minor resistance will bring retest of 1.2847 instead.
In the bigger picture, the strong support from 55 W EMA (now at 1.2341) is a medium term bullish sign. Outlook will stay bullish as long as 1.2306 support holds. Rise from 1.0351 medium term bottom (2022 low) is expected to extend further to retest 1.4248 key resistance (2021 high).
EUR/USD Daily Outlook
Daily Pivots: (S1) 1.0836; (P) 1.0888; (R1) 1.0917; More...
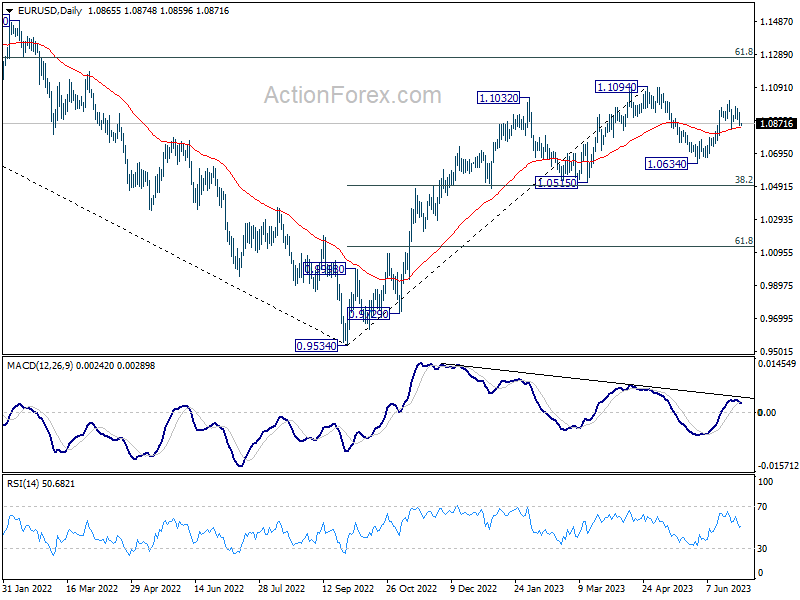
Intraday bias in EUR/USD remains neutral at this point as sideway trading continues. Further rally is mildly in favor with 1.0843 support intact. On the upside, break of 1.1011 will resume the rise from 1.0634 and target 1.1094 resistance. Decisive break there will resume larger up trend from 0.9534. However, break of 1.0843 will turn bias to the downside for 1.0634 support instead.
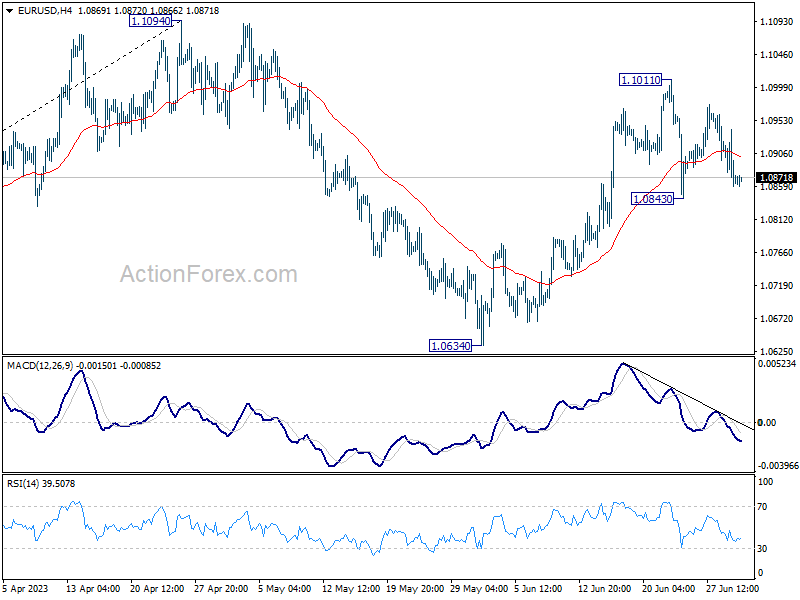
In the bigger picture, as long as 1.0515 support holds, rise from 0.9534 (2022 low) would still extend higher. Sustained break of 61.8% retracement of 1.2348 (2021 high) to 0.9534 at 1.1273 will solidify the case of bullish trend reversal and target 1.2348 resistance next (2021 high).