Sample Category Title
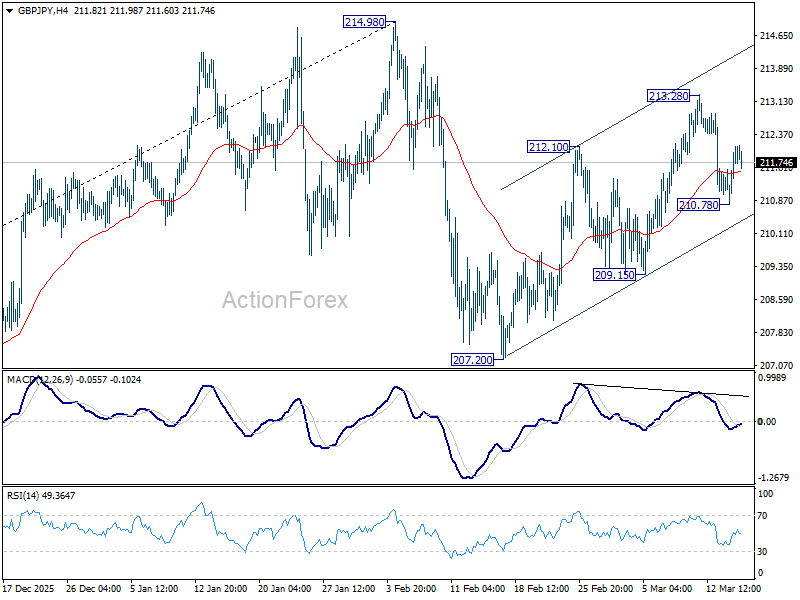
GBP/JPY Daily Outlook
Daily Pivots: (S1) 211.06; (P) 211.60; (R1) 212.38; More...
Intraday bias in GBP/JPY is turned neutral first with current recovery. Outlook is unchanged that rebound from 207.20 could have completed with three waves up to 213.28. Below 210.78 will target 209.15 support first. Firm break there will solidify this case and target 207.20 next. On the upside, however, above 213.28 will target a retest on 214.98 high instead.
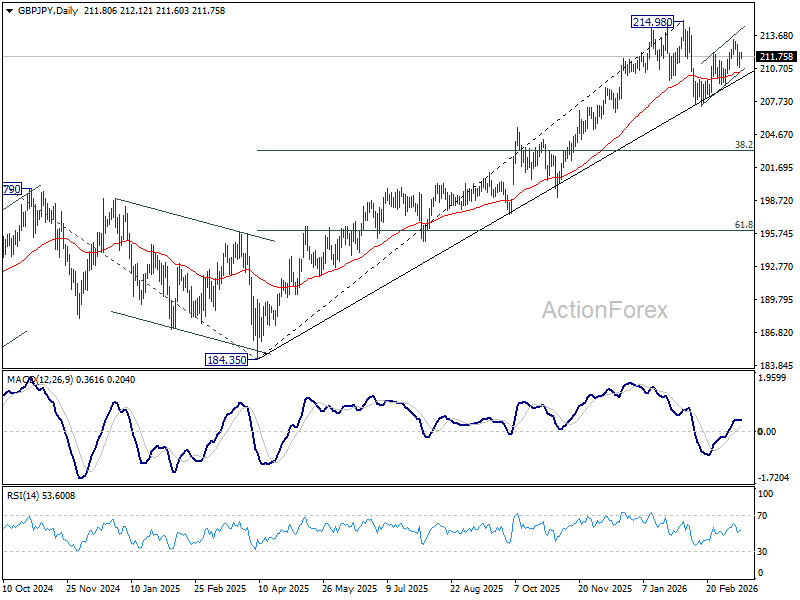
In the bigger picture, up trend from 123.94 (2020 low) is still in progress. Firm break of 214.98 will target 61.8% projection of 148.93 (2022 low) to 208.09 (2024 high) from 184.35 at 220.90. This will remain the favored case as long as 55 W EMA (now at 203.08) holds, even in case of another deep pullback.
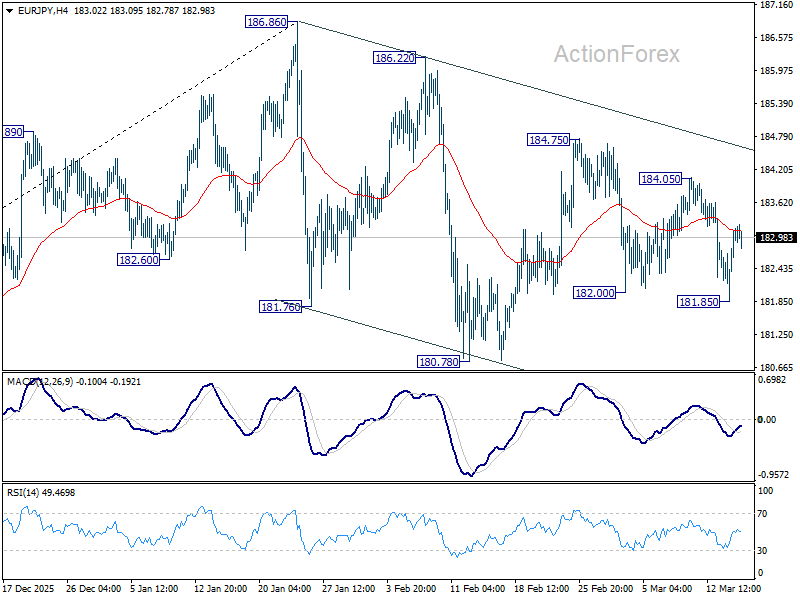
EUR/JPY Daily Outlook
Daily Pivots: (S1) 182.16; (P) 182.69; (R1) 183.51; More...
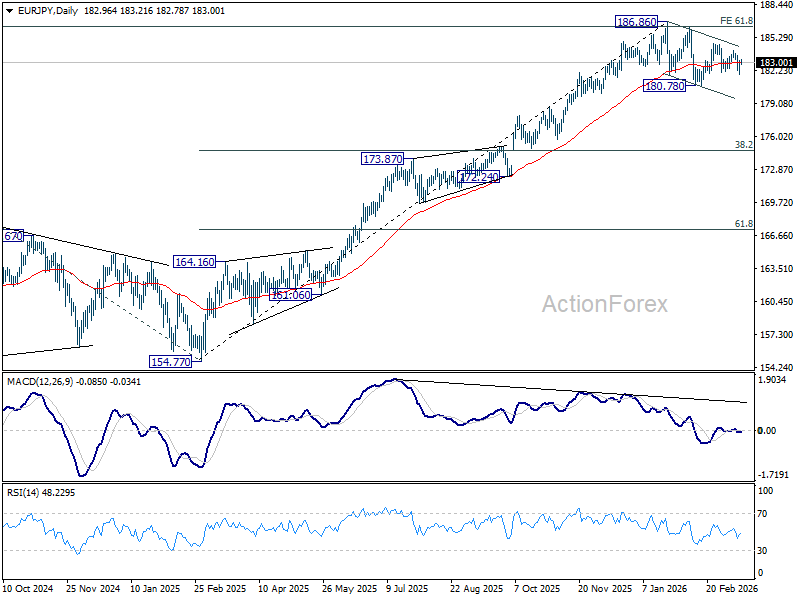
EUR/JPY edged lower to 181.85 but quickly recovered. Intraday bias stays neutral first. On the downside, below 181.85 will target 180.78 support. Decisive break there will indicate that fall from 186.86 is already correcting whole up rise from 154.77, and solidify the near term bearish outlook. On the upside, above 184.75 will resume the rebound from 180.78 to retest 186.86 high.
In the bigger picture, a medium term top could be in place at 186.86 and some more consolidations would be seen. Nevertheless, as long as 55 W EMA (now at 175.29) holds, the larger up trend from 114.42 (2020 low) remains intact. Firm break of 186.86 will pave the way to 78.6% projection of 124.37 (2022 low) to 175.41 (2025 high) from 154.77 at 194.88 next.
EUR/GBP Daily Outlook
Daily Pivots: (S1) 0.8621; (P) 0.8636; (R1) 0.8653; More…
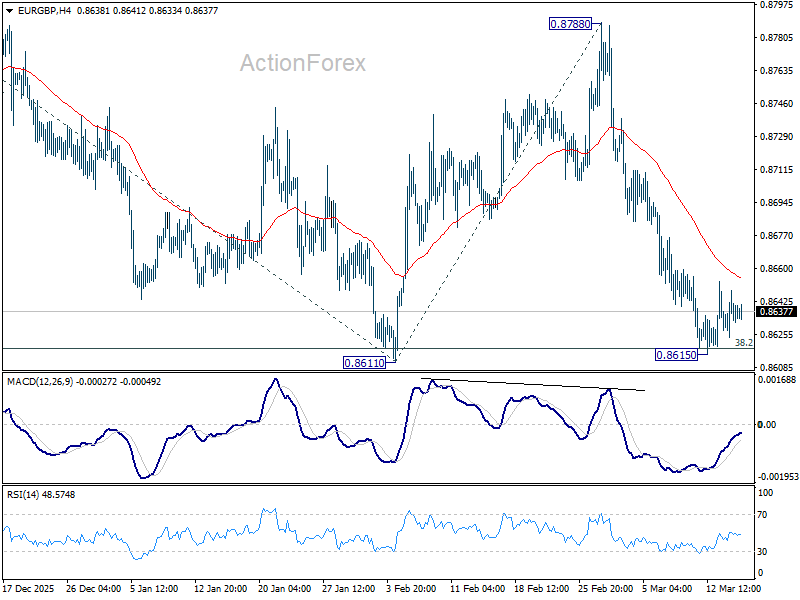
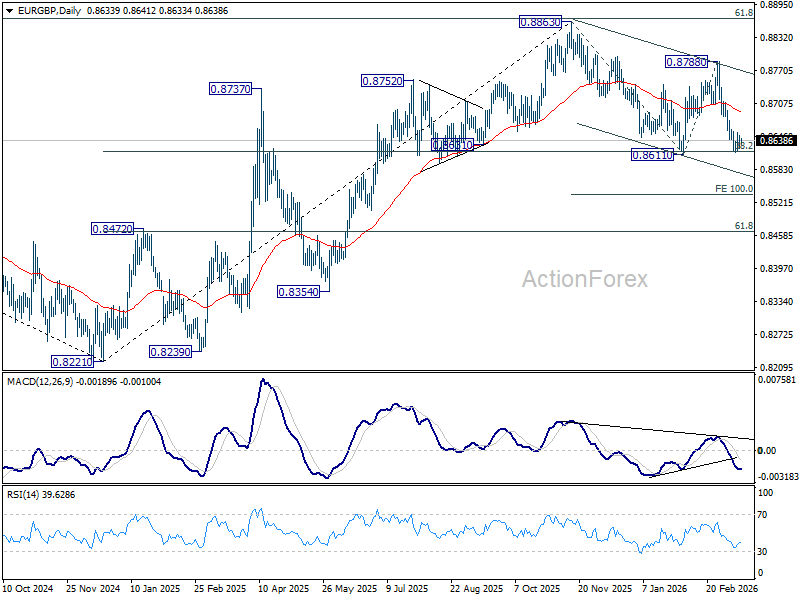
EUR/GBP is staying in consolidations above 0.8615 and intraday bias remains neutral. Further decline is expected as long as 55 D EMA (now at 0.8691) holds. Firm break of 0.8611 will resume the whole fall from 0.8863 to 100% projection of 0.8863 to 0.8611 from 0.8788 at 0.8536.
In the bigger picture, current development revived the case that whole rise from 0.8221 (2024 low) has completed at 0.8863, after rejection by 61.8% retracement of 0.9267 (2022 high) to 0.8221 at 0.8867. Sustained trading below 38.2% retracement of 0.8821 to 0.8863 at 0.8618 will confirm this case, and bring deeper fall to 61.8% retracement at 0.8466 at least. For now, medium term outlook is neutral at best as long as 0.8863 resistance holds.
EUR/AUD Daily Outlook
Daily Pivots: (S1) 1.6227; (P) 1.6292; (R1) 1.6334; More...
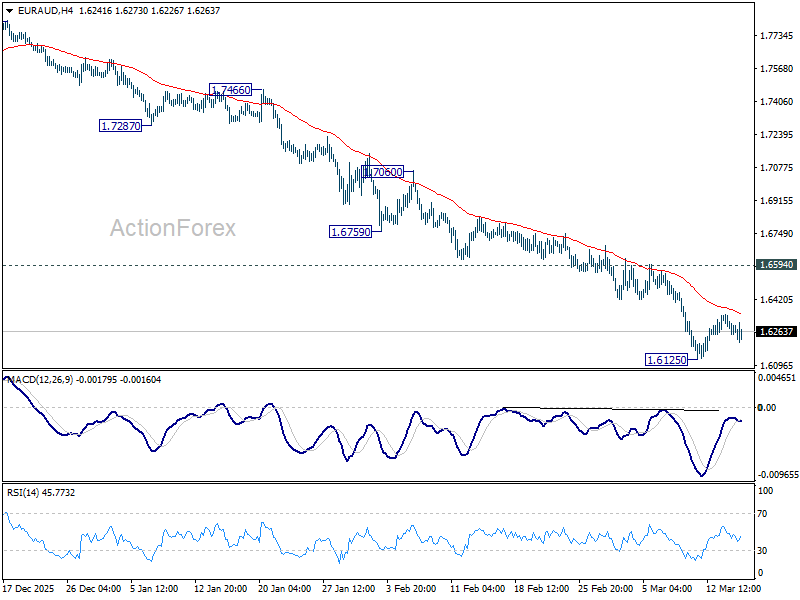
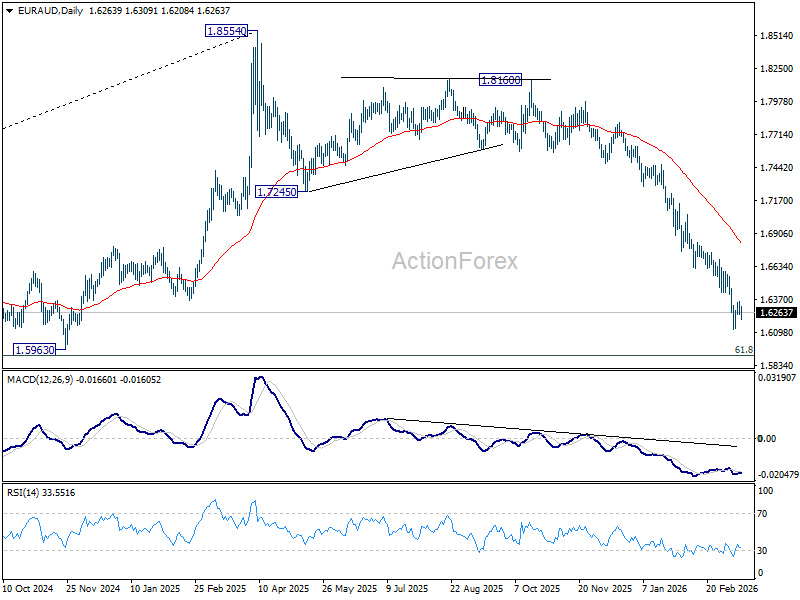
EUR/AUD is extending consolidations above 1.6125 and intraday bias remains neutral. Further decline is expected with 1.6594 resistance intact. Firm break of 1.6125 will resume the fall from 1.8554 to 1.5913 fibonacci level next. Nevertheless, break of 1.6594 will indicate short term bottoming, and bring stronger rebound.
In the bigger picture, fall from 1.8554 medium term top is seen as reversing the whole up trend from 1.4281 (2022 low). Deeper decline should be seen to 61.8% retracement of 1.4281 to 1.8554 at 1.5913, which is slightly below 1.5963 structural support. Decisive break there will pave the way back to 1.4281. For now, risk will stay on the downside as long as 55 W EMA (now at 1.7238) holds, even in case of strong rebound.
EUR/CHF Daily Outlook
Daily Pivots: (S1) 0.9030; (P) 0.9051; (R1) 0.9083; More....
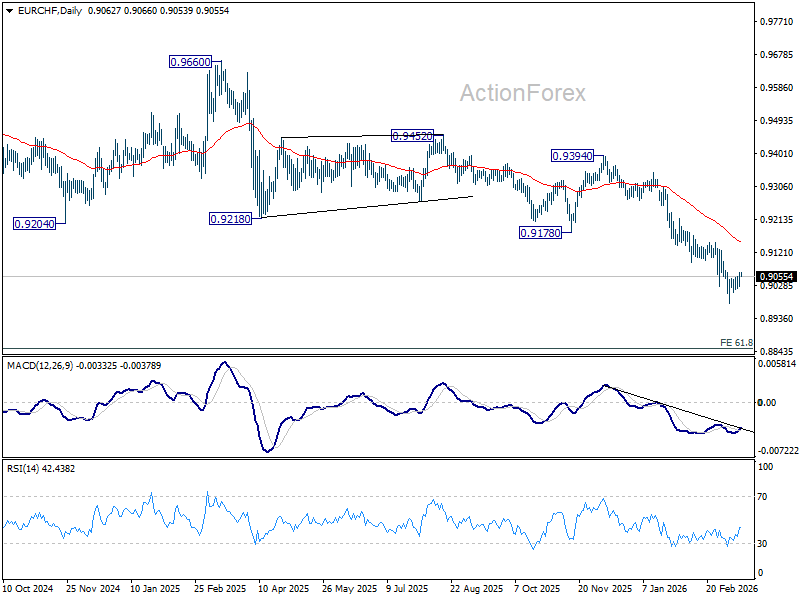
EUR/CHF's corrective recovery from 0.8979 extends higher today and outlook is unchanged. Intraday bias remains neutral and further decline is expected with 0.9092 support turned resistance intact. On the downside, firm break of 0.8979 will resume larger down trend. However, break of 0.9092 will bring stronger rebound to 0.9149 resistance instead.
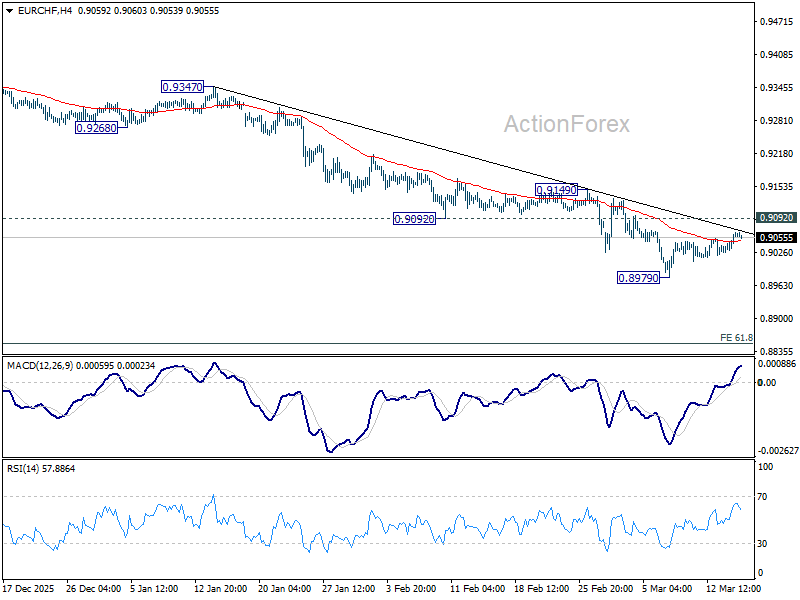
In the bigger picture, down trend from 0.9928 (2024 high) is still in progress. Next target is 61.8% projection of 1.1149 to 0.9407 from 0.9928 at 0.8851. Outlook will stay bearish as long as 0.9394 resistance holds, in case of rebound.
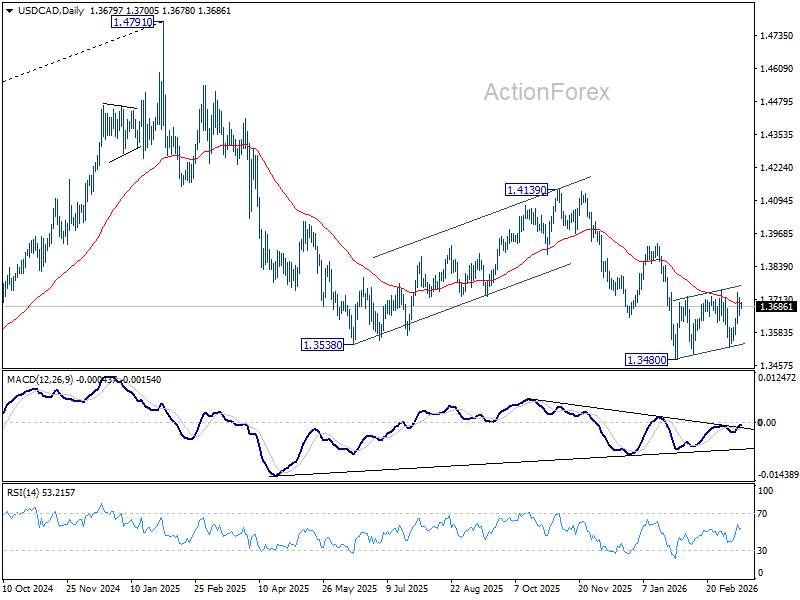
USD/CAD Daily Outlook
Daily Pivots: (S1) 1.3650; (P) 1.3690; (R1) 1.3728; More...
Range trading continues in USD/CAD and intraday bias stays neutral. On the upside, firm break of 1.3751 resistance will suggest that stronger rebound is underway, and target 1.3927 resistance first. Meanwhile, break of 1.3524 support will bring resumption of whole down trend from 1.4791.
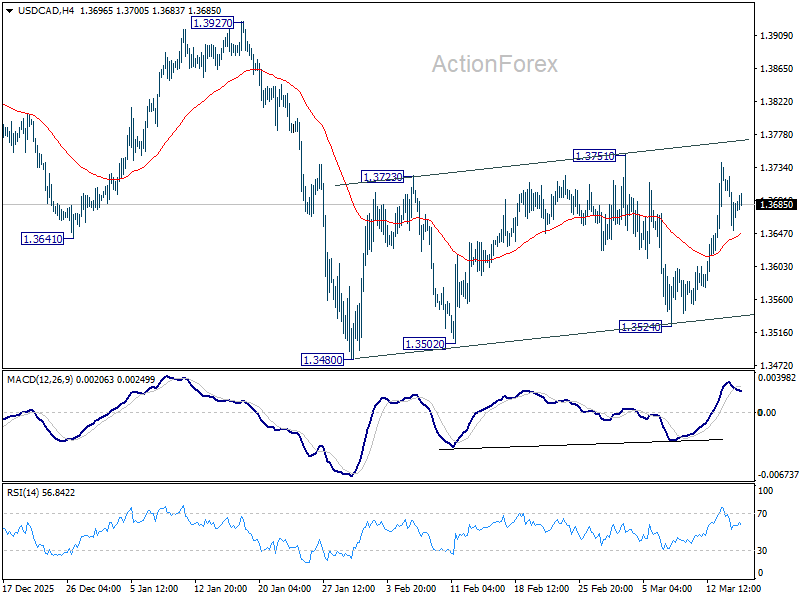
In the bigger picture, price actions from 1.4791 are seen as a corrective pattern to the whole up trend from 1.2005 (2021 low). Deeper fall could be seen, as the pattern extends, to 61.8% retracement of 1.2005 to 1.4791 at 1.3069. However, break of 1.3927 resistance will argue that the correction has completed with three waves down to 1.3480 already.
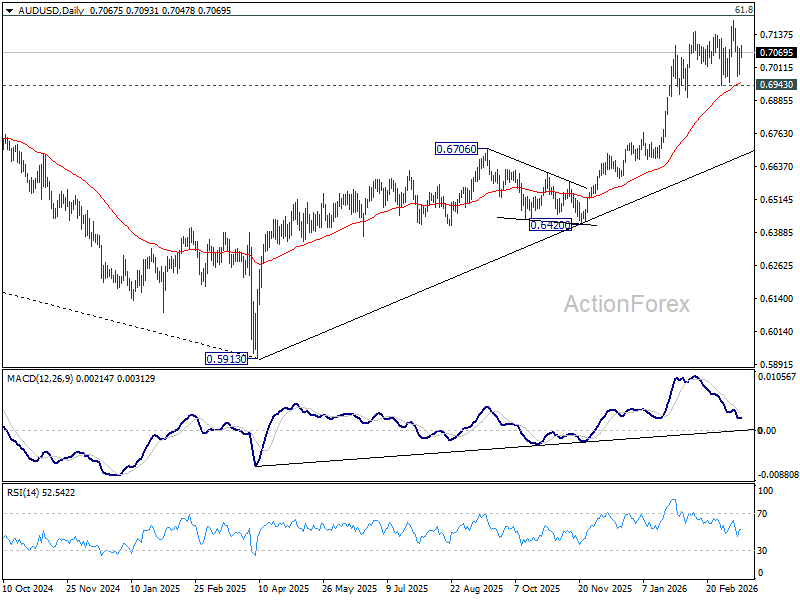
AUD/USD Daily Report
Daily Pivots: (S1) 0.7010; (P) 0.7047; (R1) 0.7107; More...
Range trading continues in AUD/USD and intraday bias remains neutral. With 0.6943 support intact, further rally is still expected. On the upside, firm break of 100% projection of 0.5913 to 0.6706 from 0.6420 at 0.7213 could prompt upside acceleration to 161.8% projection at 0.7703. However, firm break of 0.6943 will indicate that a larger scale correction is already underway.
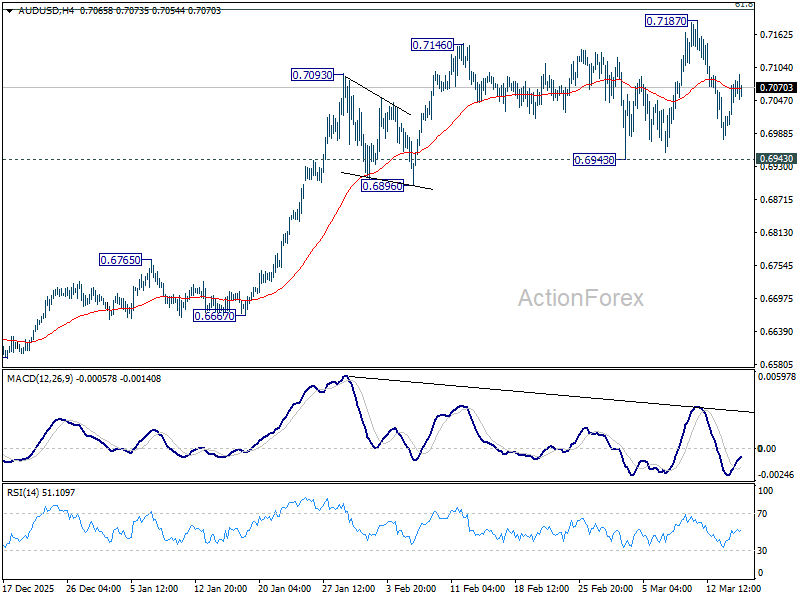
In the bigger picture, current development argues that rise from 0.5913 (2024 low) is reversing whole down trend from 0.8006 (2021 high). Decisive break of 61.8% retracement of 0.8006 to 0.5913 at 0.7206 will pave the way back to 0.8006. This will remain the favored case as long as 0.6706 resistance turned support holds, even in case of deep pullback.
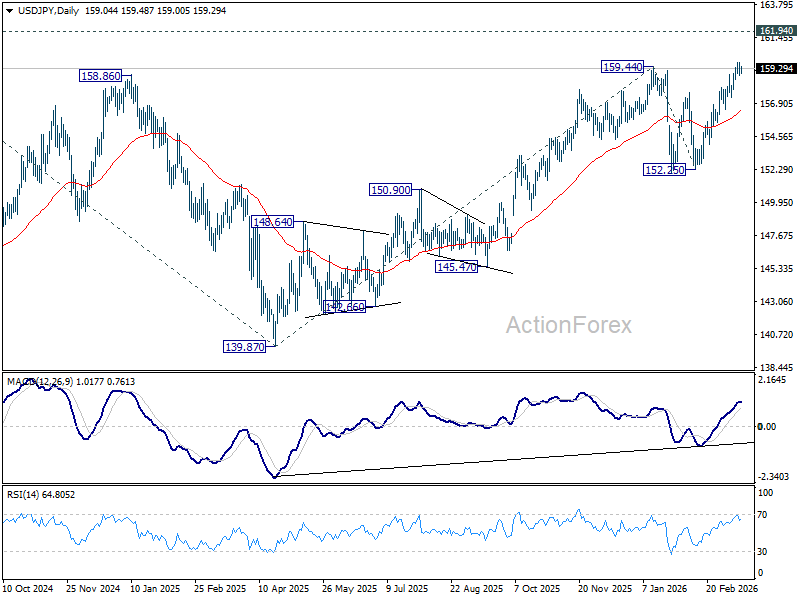
USD/JPY Daily Outlook
Daily Pivots: (S1) 158.68; (P) 159.21; (R1) 159.58; More...
Intraday bias in USD/JPY remains neutral at this point. On the upside, above 159.74 will target a retest of 161.94. Firm break there will confirm larger up trend resumption and target 61.8% projection of 139.87 to 159.44 from 152.25 at 164.34. However, considering bearish divergence condition in 4H MACD, break of 158.55 should indicate short term topping, and turn bias back to the downside for deeper pullback.
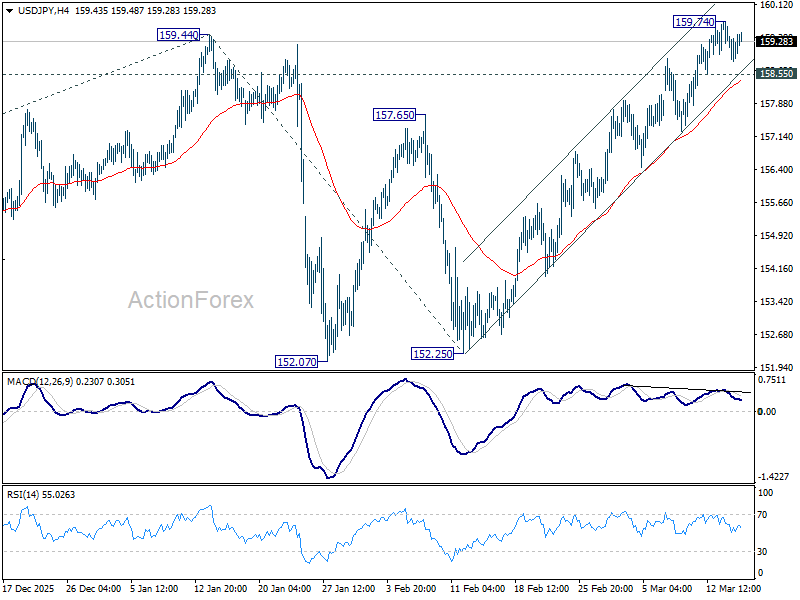
In the bigger picture, outlook is unchanged that corrective pattern from 161.94 (2024 high) should have completed with three waves at 139.87. Larger up trend from 102.58 (2021 low) could be ready to resume through 161.94. This will remain the favored case as long as 55 W EMA (now at 152.70) holds. Firm break of 161.94 will pave the way to 61.8% projection of 102.58 to 161.94 from 139.87 at 176.75.
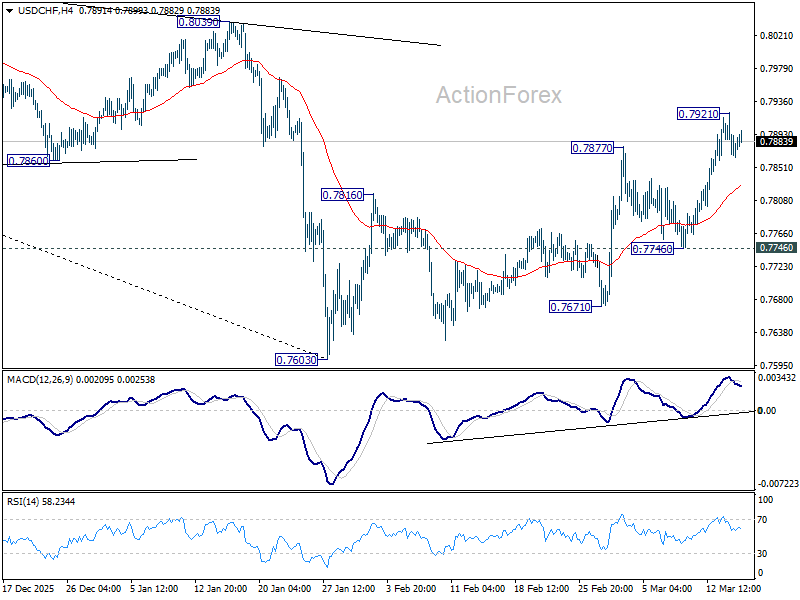
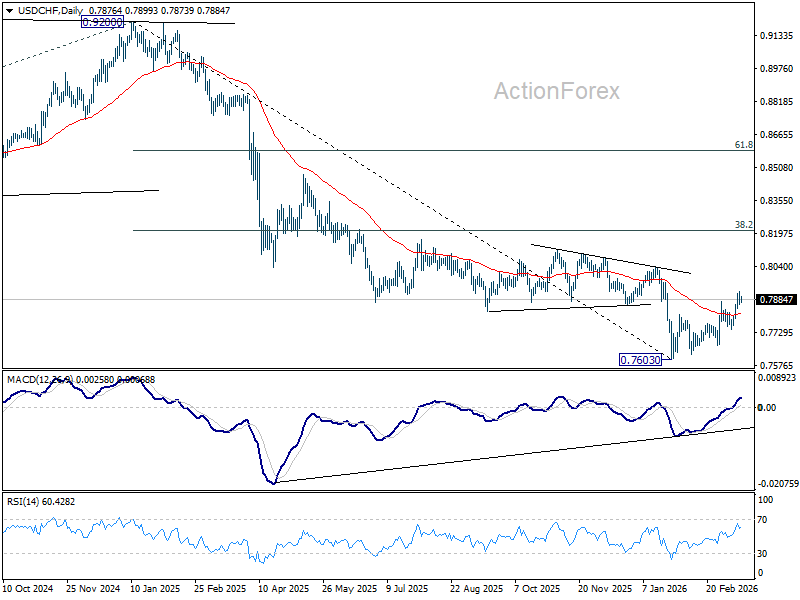
USD/CHF Daily Outlook
Daily Pivots: (S1) 0.7853; (P) 0.7888; (R1) 0.7913; More….
Intraday bias in USD/CHF remains neutral for consolidations below 0.7921 temporary top. Further rally is still expected as long as 0.7746 support holds. Rise from 0.7603 is seen as correcting whole down trend from 0.9200. Break of 0.7921 will target 38.2% retracement of 0.9200 to 0.7603 at 0.8213.
In the bigger picture, a medium term bottom should be in place at 0.7603 on bullish convergence condition in D MACD. Rebound from there is seen as correcting the fall from 0.9200 only. However, decisive break of 55 W EMA (now at 0.8091) will suggest that it's probably correcting the larger scale down trend from 1.0146 (2022 high). On the other hand, rejection by the 55 W EMA will setup down trend resumption to 100% projection of 1.0146 (2022 high) to 0.8332 from 0.9200 at 0.7382 at a later stage.
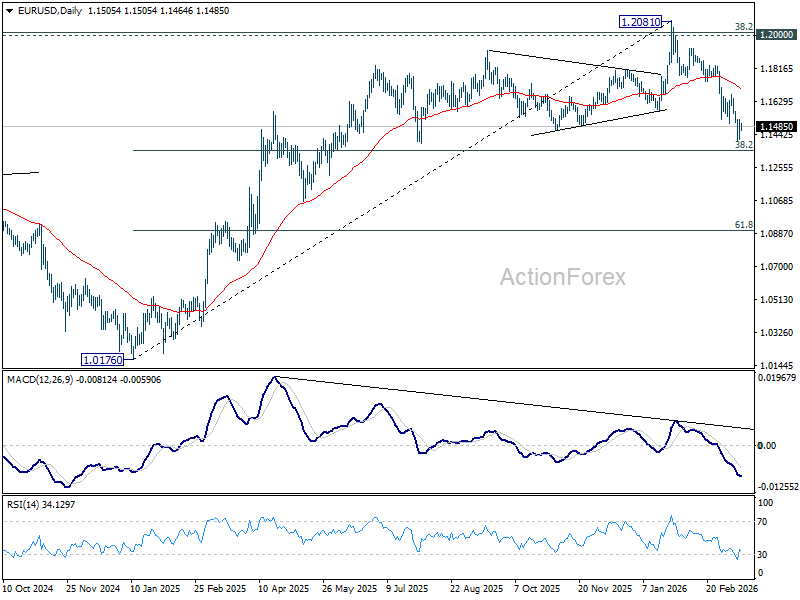
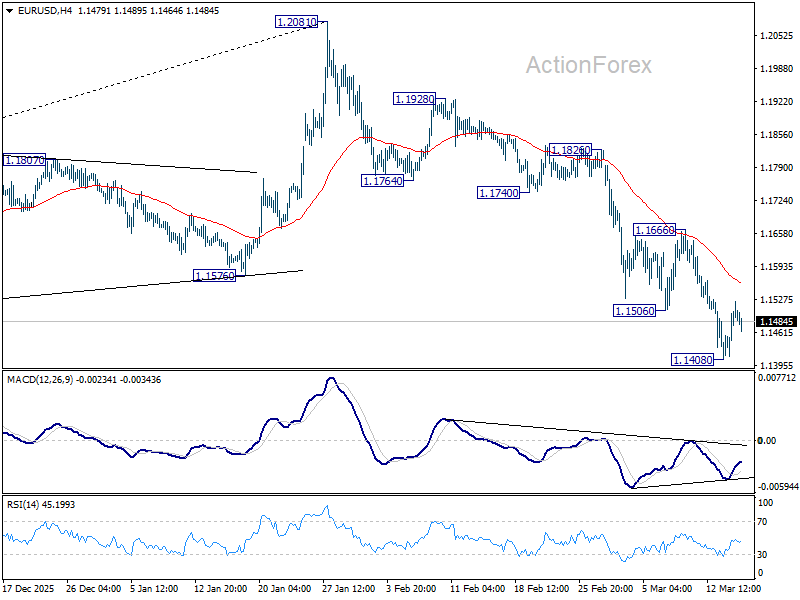
EUR/USD Daily Outlook
Daily Pivots: (S1) 1.1436; (P) 1.1482; (R1) 1.1549; More….
Intraday bias in EUR/USD remains neutral for the moment, and more consolidations could be seen above 1.1408 temporary low. But further decline is expected as long as 1.1666 resistance holds. Below 1.1408 will resume the fall from 1.2081 to 38.2% retracement of 1.0176 to 1.2081 at 1.1353. Firm break there will target 61.8% projection at 1.0904 next.
In the bigger picture, the break of 55 W EMA (now at 1.1495) confirms rejection by 1.2 key cluster resistance level. The whole up trend from 0.9534 (2022 low) might have completed as a three wave corrective rise too. In either case, deeper fall is now expected to long term channel support (now at 1.0528. Risk will stay on the downside as long as 1.2081 holds, in case of recovery.