
Sample Category Title
Crypto Market Tests Breakout Above Key Resistance
Market Picture
Crypto market capitalisation increased by a further 2.7% in the last 24 hours, reaching $2.54 trillion. At its peak earlier in the day, the market climbed to $2.58 trillion, its highest since early February. This indicates a period of consolidation above the 50-day moving average, an attempt to break free from the correction pattern following the decline, and a move above the 61.8% retracement level of the initial movement.
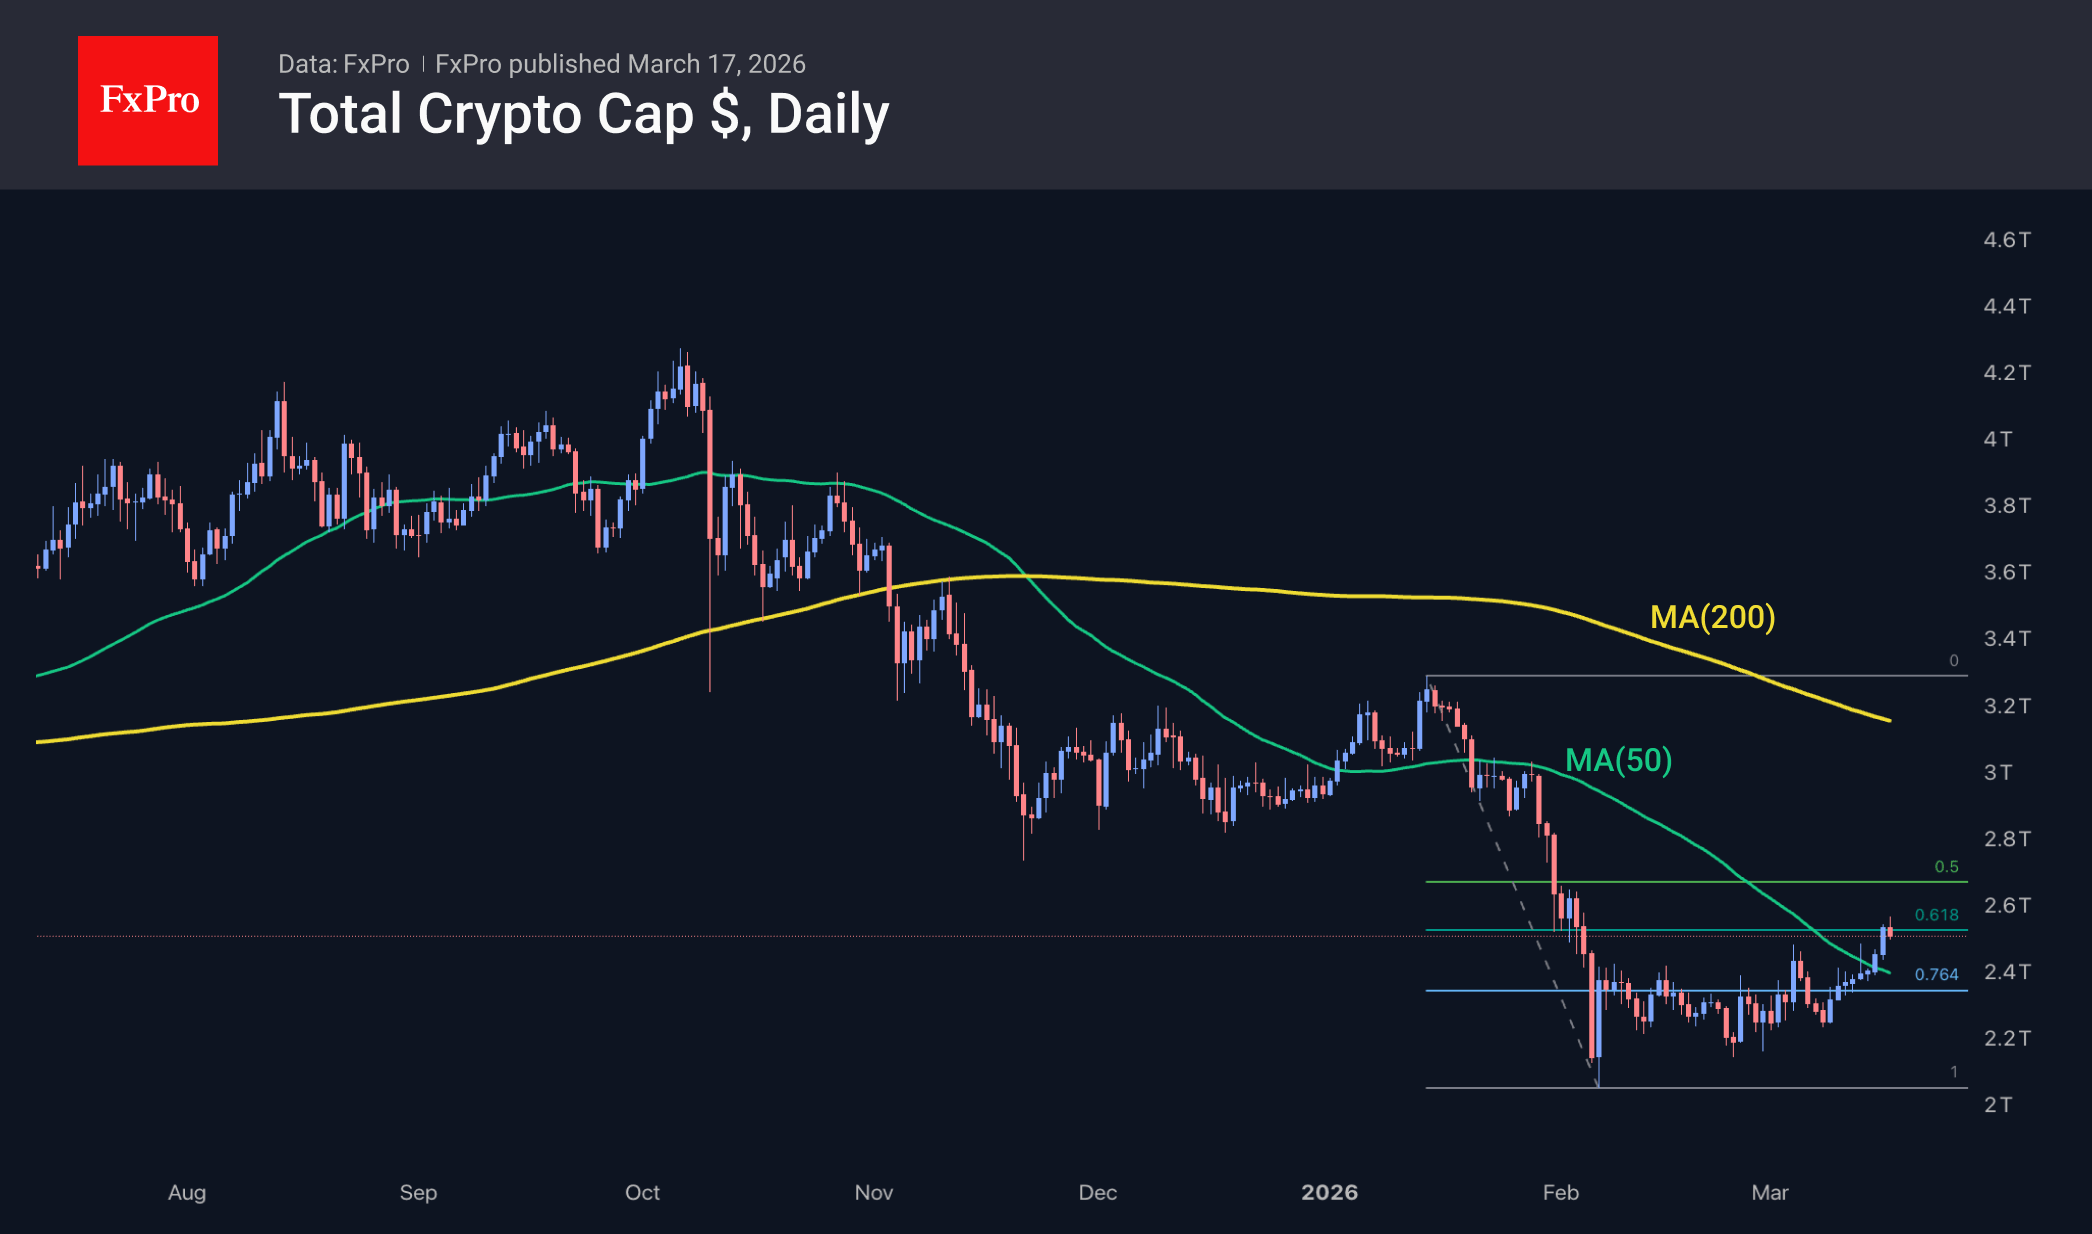
The sentiment index gained 5 points to reach 28 for the day, breaking out of the extreme fear zone and hitting its highest level since late January. This indicator’s positive signal complements the favourable technical picture.
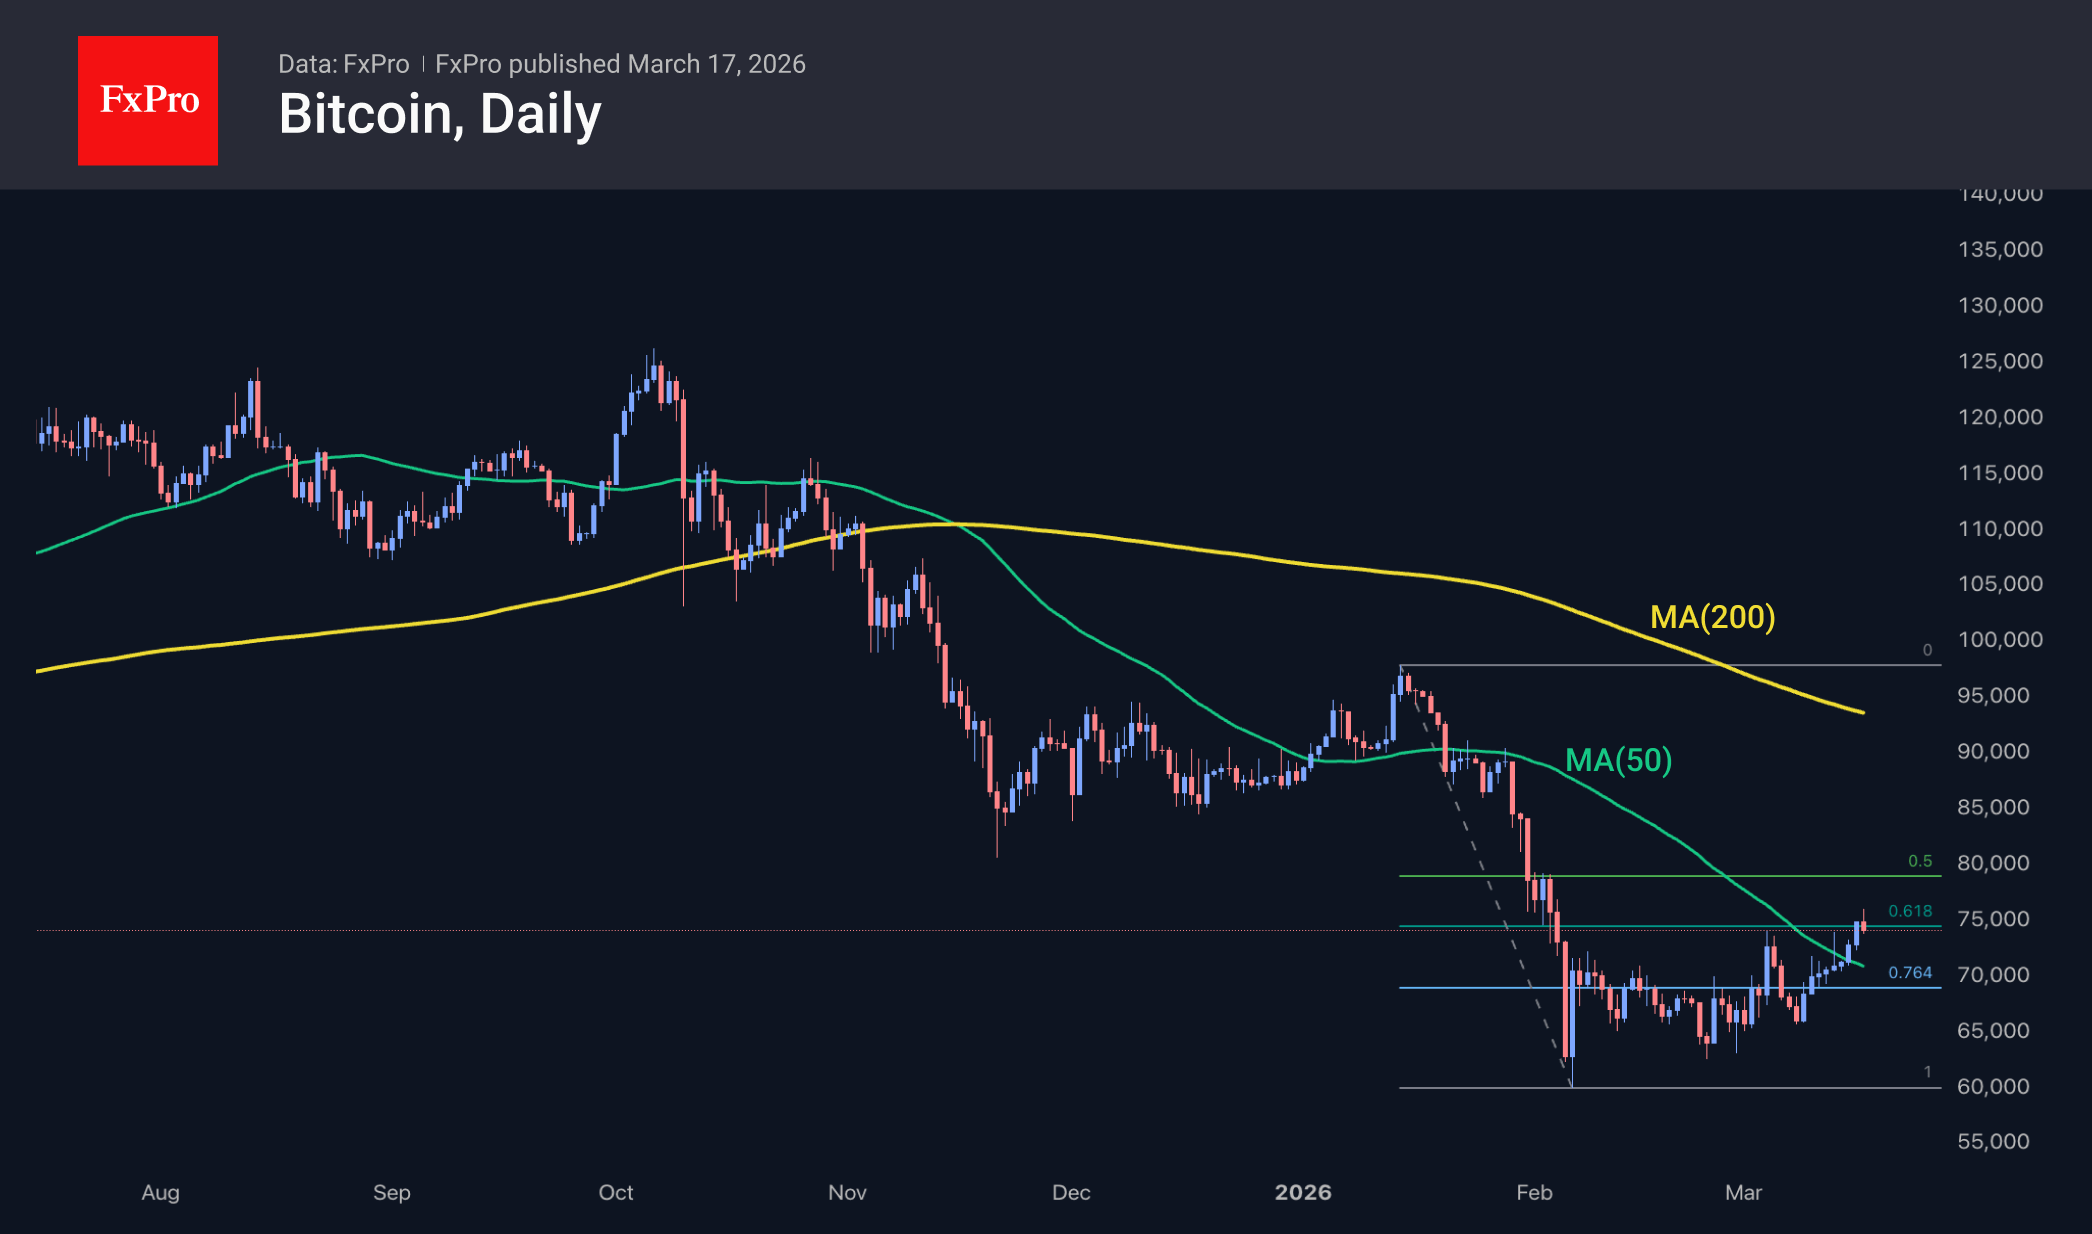
Bitcoin rose to $76K, later retreating to $74K, where it is trading as the European session begins. The market is currently testing the rally’s stability. Meanwhile, sentiment in traditional markets has shifted: gold and stock indices closed higher on Monday, while the dollar index dived back below 100.
News background
According to CoinShares, global investment in crypto funds rose by $1.1 billion last week, marking the third week of inflows after five weeks of outflows. Investments in Bitcoin increased by $793 million, in Ethereum by $315 million, in Solana by $9 million, and in Chainlink by $3 million.
Since the beginning of the Iranian crisis, the total assets under management (AuM) in global crypto ETFs have grown by 9.4% to $140 billion, according to CoinShares.
Over the past 30 days, users have withdrawn more than 32,060 BTC from crypto exchanges. Only 2.44 million BTC remain on the balance sheets of trading platforms, the lowest figure in recent years, according to Crypto Patel.
Ethereum has outpaced Bitcoin in growth rates amid the return of institutional investors. According to Arkham, Erik Voorhees, the former CEO of the ShapeShift crypto exchange, purchased 24,968 ETH worth $56.5 million after a one-year hiatus.
Strategy bought a further 22,337 BTC ($1.57 billion) last week at an average price of $70,946 per coin. This is the largest bitcoin purchase since November 2024. Strategy now owns 761,068 BTC, bought for $57.61 billion at an average price of $75,696 per bitcoin.
BitMine acquired approximately 60,000 ETH over the past week. The company’s reserves now total 4.59 million ETH, representing 3.81% of the Ethereum market supply. BitMine aims to accumulate 5% of all ether.
EUR/USD Mid-Day Outlook
Daily Pivots: (S1) 1.1436; (P) 1.1482; (R1) 1.1549; More….
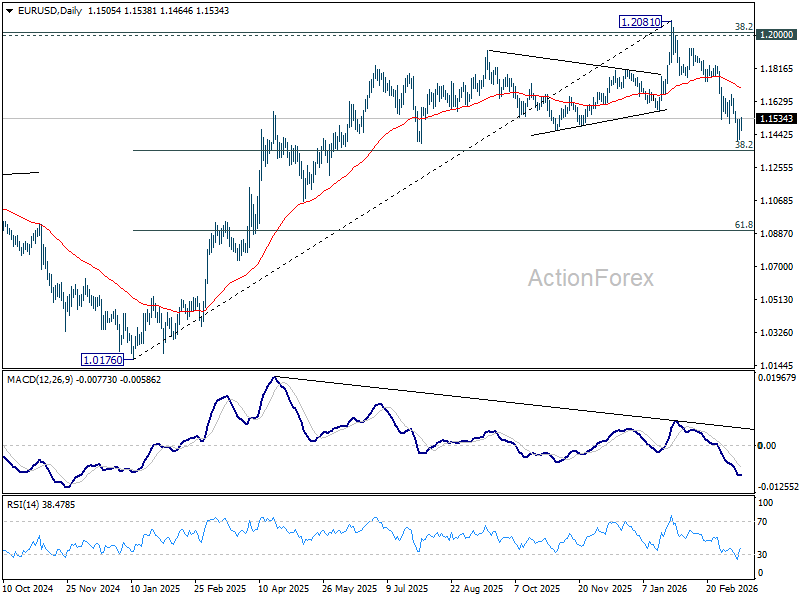
Intraday bias in EUR/USD stays neutral at this point, and consolidation from 1.1408 could extend for a while. But further decline is expected as long as 1.1666 resistance holds. Below 1.1408 will resume the fall from 1.2081 to 38.2% retracement of 1.0176 to 1.2081 at 1.1353. Firm break there will target 61.8% projection at 1.0904 next.
In the bigger picture, the break of 55 W EMA (now at 1.1495) confirms rejection by 1.2 key cluster resistance level. The whole up trend from 0.9534 (2022 low) might have completed as a three wave corrective rise too. In either case, deeper fall is now expected to long term channel support (now at 1.0528. Risk will stay on the downside as long as 1.2081 holds, in case of recovery.
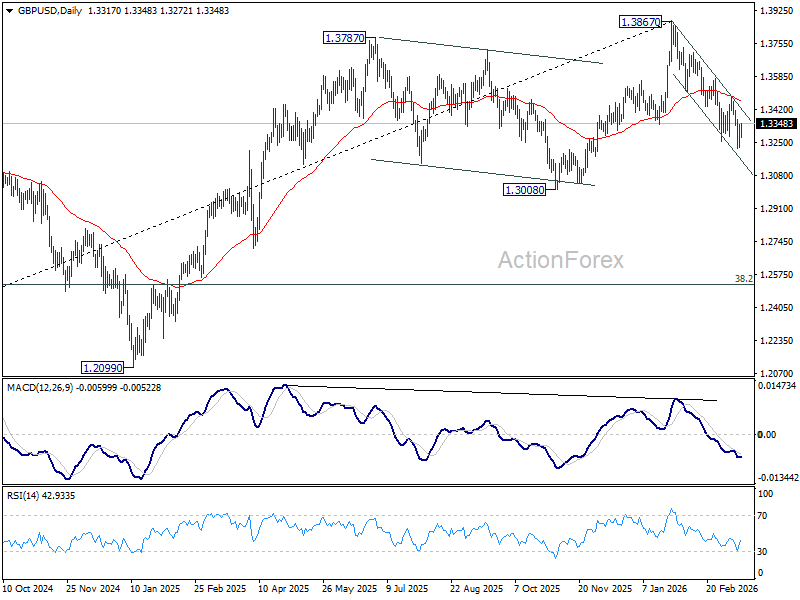
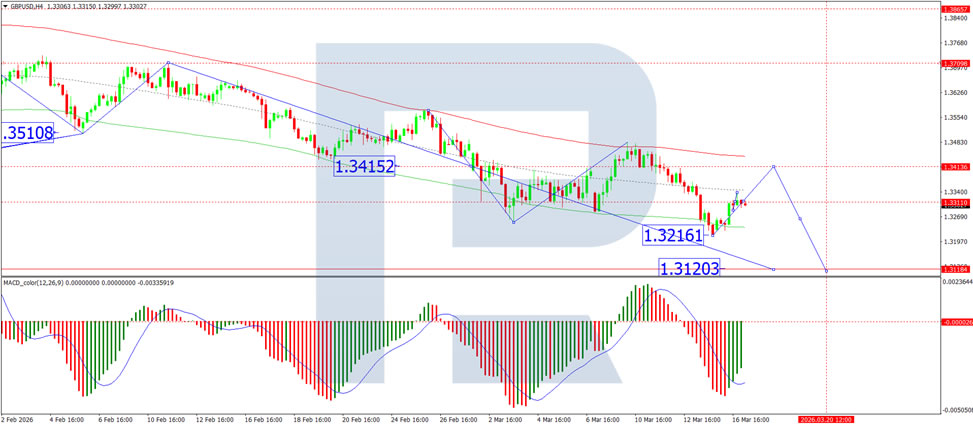
GBP/USD Mid-Day Outlook
Daily Pivots: (S1) 1.3249; (P) 1.3295; (R1) 1.3365; More...
Intraday bias in GBP/USD remains neutral for the moment, and more consolidations could be seen above 1.3216. Risk will stay on the downside as long as 1.3482 resistance holds. Below 1.3216 will resume the fall from 1.3867 to 1.3008 structural support. Firm break there will carry larger bearish implication and target 1.2524 fibonacci level.
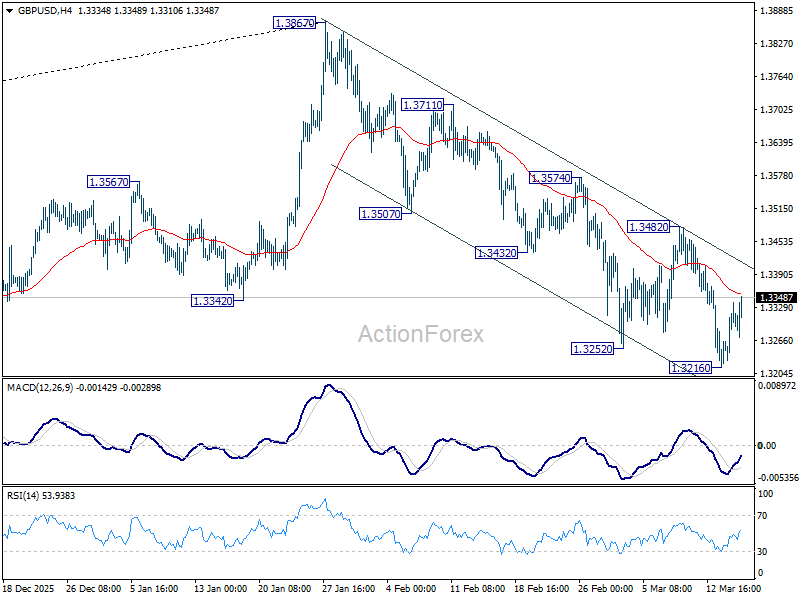
In the bigger picture, considering bearish divergence condition in both D and W MACD, a medium term top should be in place from 1.3867. Firm break of 1.3008 support will argue that fall from 1.3867 is at least correcting the rise from 1.0351 (2022 low) with risk of bearish reversal. That would open up further decline to 38.2% retracement of 1.0351 to 1.3867 at 1.2524. For now, medium term outlook will be neutral at best as long as 1.3867 resistance holds, or under further development.
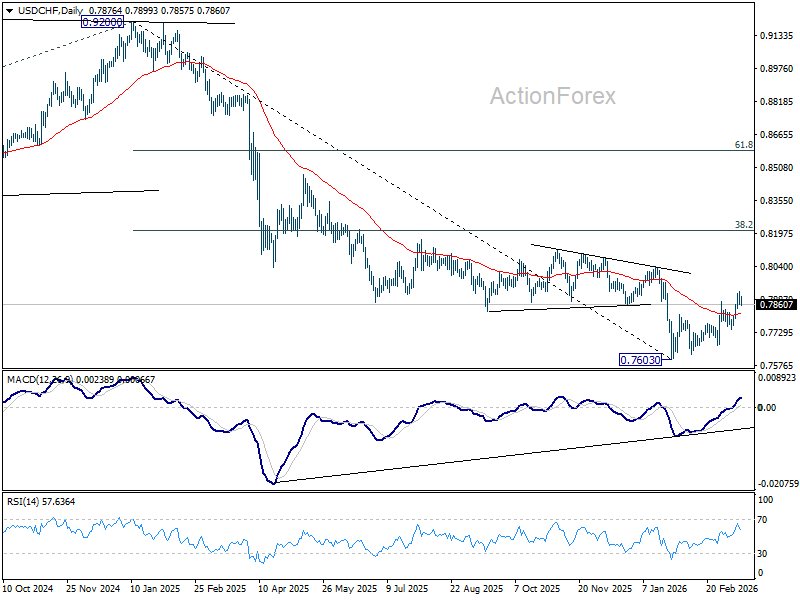
USD/CHF Mid-Day Outlook
Daily Pivots: (S1) 0.7853; (P) 0.7888; (R1) 0.7913; More….
USD/CHF is extending consolidations below 0.7921 and intraday bias remains neutral. Further rally is still expected as long as 0.7746 support holds. Rise from 0.7603 is seen as correcting whole down trend from 0.9200. Break of 0.7921 will target 38.2% retracement of 0.9200 to 0.7603 at 0.8213.
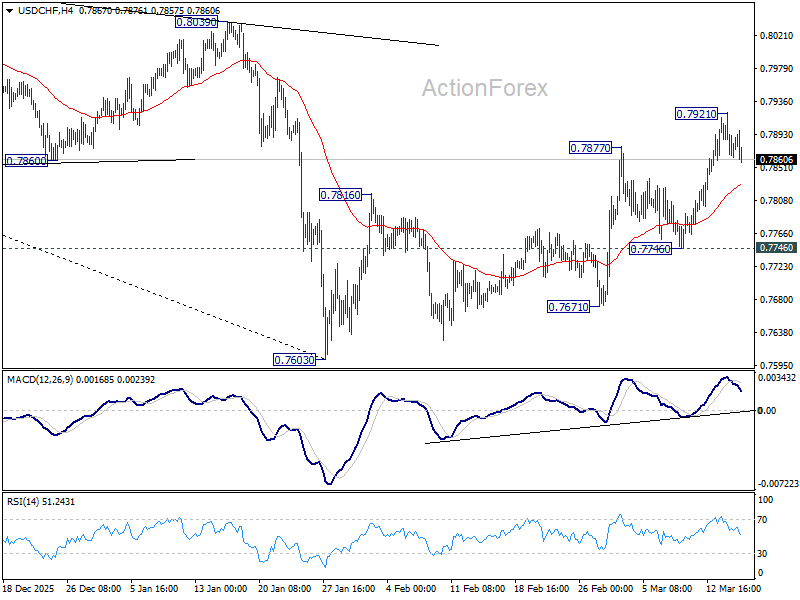
In the bigger picture, a medium term bottom should be in place at 0.7603 on bullish convergence condition in D MACD. Rebound from there is seen as correcting the fall from 0.9200 only. However, decisive break of 55 W EMA (now at 0.8091) will suggest that it's probably correcting the larger scale down trend from 1.0146 (2022 high). On the other hand, rejection by the 55 W EMA will setup down trend resumption to 100% projection of 1.0146 (2022 high) to 0.8332 from 0.9200 at 0.7382 at a later stage.
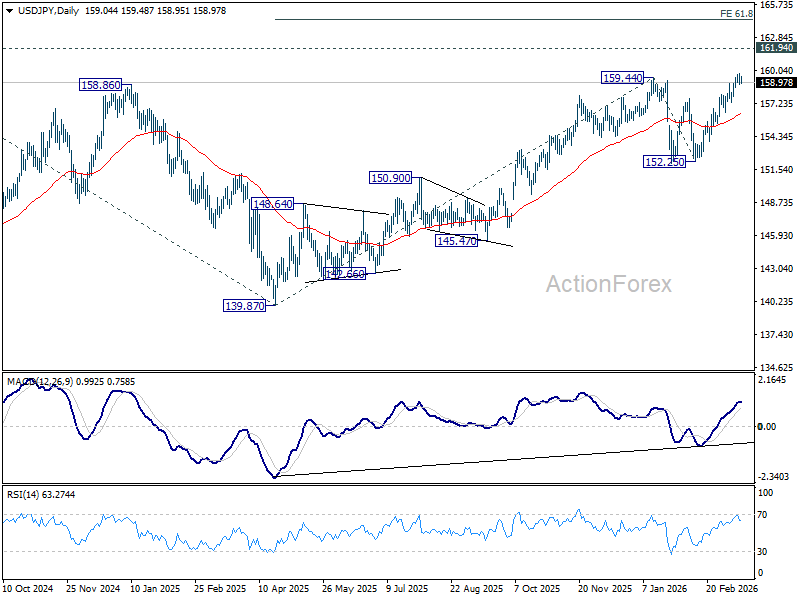
USD/JPY Mid-Day Outlook
Daily Pivots: (S1) 158.68; (P) 159.21; (R1) 159.58; More...
USD/JPY is extending consolidations below 159.74 and intraday bias remains neutral. On the upside, above 159.74 will target a retest of 161.94. Firm break there will confirm larger up trend resumption and target 61.8% projection of 139.87 to 159.44 from 152.25 at 164.34. However, considering bearish divergence condition in 4H MACD, break of 158.55 should indicate short term topping, and turn bias back to the downside for deeper pullback.
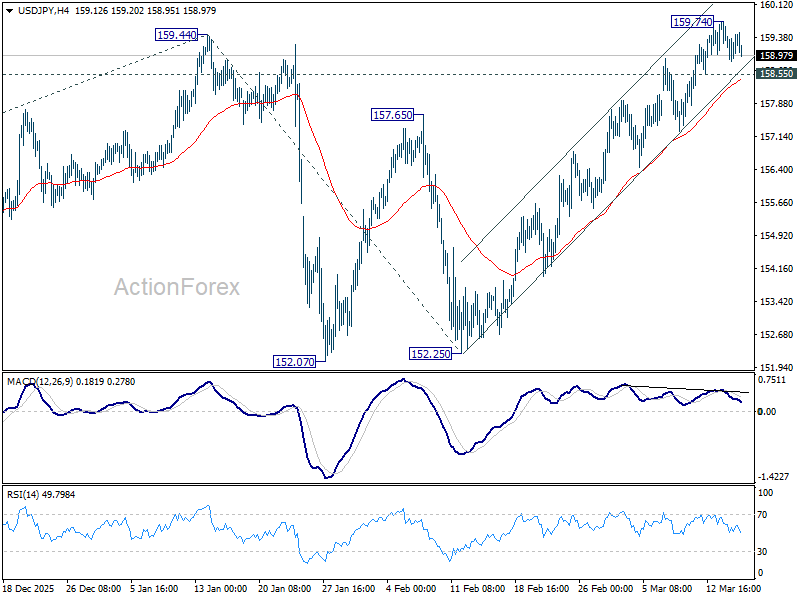
In the bigger picture, outlook is unchanged that corrective pattern from 161.94 (2024 high) should have completed with three waves at 139.87. Larger up trend from 102.58 (2021 low) could be ready to resume through 161.94. This will remain the favored case as long as 55 W EMA (now at 152.70) holds. Firm break of 161.94 will pave the way to 61.8% projection of 102.58 to 161.94 from 139.87 at 176.75.
Dollar Stalls as Oil Spike Fades, Markets Await Fed Guidance
The global markets are holding in limbo today as the initial surge in geopolitical risk faded and attention shifted back toward the upcoming Fed decision tomorrow. While tensions in the Middle East remain elevated, price action across assets suggests that much of the shock has already been absorbed, leaving traders reluctant to take strong directional bets.
Oil prices briefly spiked earlier after renewed Iranian attacks on UAE energy infrastructure, pushing Brent toward the 104 level, but the move quickly reversed. The key shift in narrative is that the Strait of Hormuz, while heavily disrupted, is not fully blocked. Reports of selective tanker transits, including vessels linked to Pakistan and Turkey, suggest that the situation resembles a bottleneck rather than a complete shutdown. This distinction has been crucial in preventing a more aggressive repricing in energy markets.
At the same time, oil prices above 100 already reflect a significant geopolitical premium. Without a direct and sustained hit to major producers such as Saudi Arabia or Iraq, markets appear reluctant to push prices materially higher. As a result, the energy shock is now seen as elevated but contained, at least in the near term.
This stabilization in oil has removed a key pillar of support for Dollar. While the greenback initially attempted to rally on renewed risk aversion, gains quickly faded as energy markets failed to extend higher. The result is a sluggish Dollar, unable to capitalize on geopolitical tensions in the way it did earlier in the conflict.
Compounding this dynamic is the Fed’s blackout period, which has left markets without guidance on how policymakers are interpreting the recent oil-driven inflation shock. Since the surge in energy prices began in late February, there has been no official commentary, creating what can best be described as a valuation vacuum.
This uncertainty has become a central driver of current market behavior. With a rate hold fully priced for the upcoming FOMC meeting tomorrow, the real question is how hawkish that hold will be. Without clarity, traders are unwilling to commit, leading to muted price action across currencies and rates.
Against this backdrop, Australian Dollar has emerged as the standout performer. Initial volatility following the RBA’s split decision quickly gave way to renewed strength after Governor Michele Bullock clarified that the board remains united on the need for further tightening, with disagreement centered only on timing.
Market expectations have since stabilized, with April seen as a likely pause ahead of key inflation data, but another rate hike broadly anticipated in May. This clarity has allowed Aussie to outperform in an otherwise directionless FX landscape.
Overall, currency markets reflect a broader theme of consolidation. With oil risks capped for now and Fed policy uncertainty unresolved, major pairs remain trapped within last week’s ranges. Until either energy markets break higher again or the Fed provides clearer guidance, markets are likely to remain stuck in ranges.
In Europe, at the time of writing, FTSE is up 0.82%. DAX is up 0.47%. CAC is up 0.73%. UK 10-year yield is down -0.059 at 4.653. Germany 10-year yield is down -0.029 at 2.920. Earlier in Asia, Nikkei fell -0.09%. Hong Kong HSI rose 0.13%. China Shanghai SSE fell -0.85%. Singapore Strait Times rose 1.38%. Japan 10-year JGB yield fell -0.017 to 2.263.
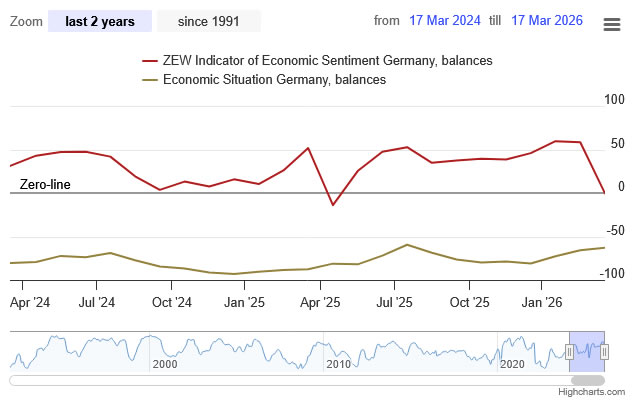
German ZEW collapses to -0.5 on rising stagflation risks
German ZEW Economic Sentiment plunged into negative territory in March, with Eurozone sentiment also dropping sharply as rising energy prices dent confidence. The collapse reflects growing concern that Middle East tensions and inflation risks could derail Europe’s fragile recovery. Read more.
RBA rate hike to 4.10% lacks conviction as board splits 5–4
RBA raised the cash rate to 4.10%, but the narrow 5–4 vote revealed a divided board and limited conviction behind the move. While policymakers cited rising fuel costs and inflation risks, the split highlights growing uncertainty over the outlook as energy shocks threaten both inflation and growth. Read more.
RBA united on further tightening despite split vote, Bullock says
RBA Governor Michele Bullock said the board remains united on further tightening despite the 5–4 split, with disagreement centered on timing rather than direction. She emphasized that inflation remains too high and driven by excess demand, while warning that policy may need to stay restrictive to prevent more persistent price pressures. Read more.
USD/JPY Mid-Day Outlook
Daily Pivots: (S1) 158.68; (P) 159.21; (R1) 159.58; More...
USD/JPY is extending consolidations below 159.74 and intraday bias remains neutral. On the upside, above 159.74 will target a retest of 161.94. Firm break there will confirm larger up trend resumption and target 61.8% projection of 139.87 to 159.44 from 152.25 at 164.34. However, considering bearish divergence condition in 4H MACD, break of 158.55 should indicate short term topping, and turn bias back to the downside for deeper pullback.
In the bigger picture, outlook is unchanged that corrective pattern from 161.94 (2024 high) should have completed with three waves at 139.87. Larger up trend from 102.58 (2021 low) could be ready to resume through 161.94. This will remain the favored case as long as 55 W EMA (now at 152.70) holds. Firm break of 161.94 will pave the way to 61.8% projection of 102.58 to 161.94 from 139.87 at 176.75.
German ZEW collapses to -0.5 on rising stagflation risks
Germany’s ZEW Economic Sentiment plunged sharply in March, highlighting how rapidly confidence is deteriorating under the weight of the global energy shock. The expectations index collapsed from 58.3 to -0.5, far below market forecasts of 39.0, while Eurozone sentiment followed suit, dropping from 39.4 to -8.5.
The primary driver is the escalation in Middle East conflict, which has pushed energy prices sharply higher and revived inflation concerns across Europe. ZEW President Achim Wambach warned that the surge in energy costs is increasing inflationary pressure and raising the risk that Germany’s nascent recovery could stall. "The financial market experts are sceptical that a quick resolution of the conflict will take place,” he added.
In contrast, the current situation index showed modest improvement, rising from -65.9 to -62.9 in Germany, suggesting that present conditions are stabilizing slightly even as the outlook darkens. On the other hand, current situation in Eurozone also rose fell -16.3 pts to -29.9.
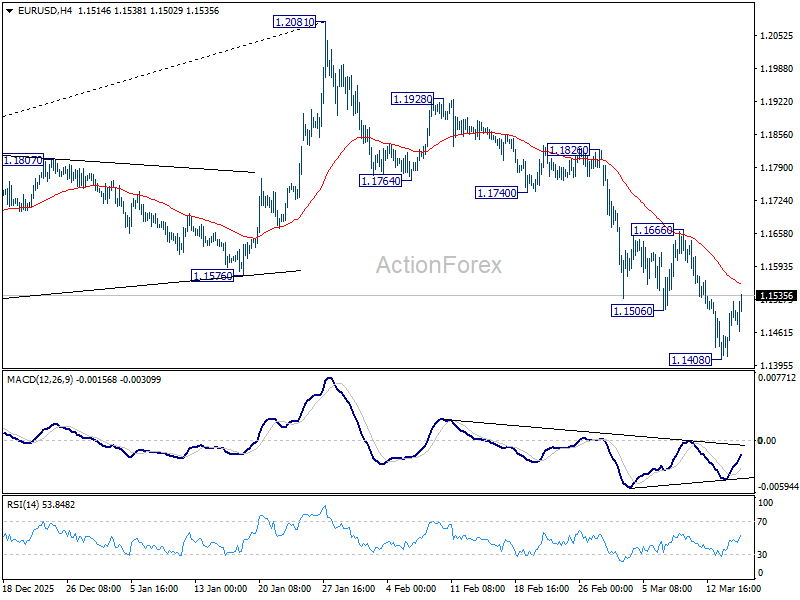
EUR/USD Chart Analysis: Pair Recovers Ahead of Fed News
On 10 March, analysing the EUR/USD chart, we:
- → considered the long-term descending channel, which remains relevant;
- → noted that the sequence of lower lows A–H was broken with the appearance of a higher peak I, with 1.1680 potentially acting as resistance.
At peak I, bulls exhausted their strength: after forming a consolidation zone near the channel’s median, bears regained control and pushed the price to a new yearly low, driven by a bearish fundamental backdrop.
Tomorrow, the Fed is expected to release its interest rate decision, while the ECB will issue comments the day after. These events could significantly shift market sentiment regarding EUR/USD, and current price behaviour suggests that bulls may attempt a comeback.
Technical Analysis of EUR/USD
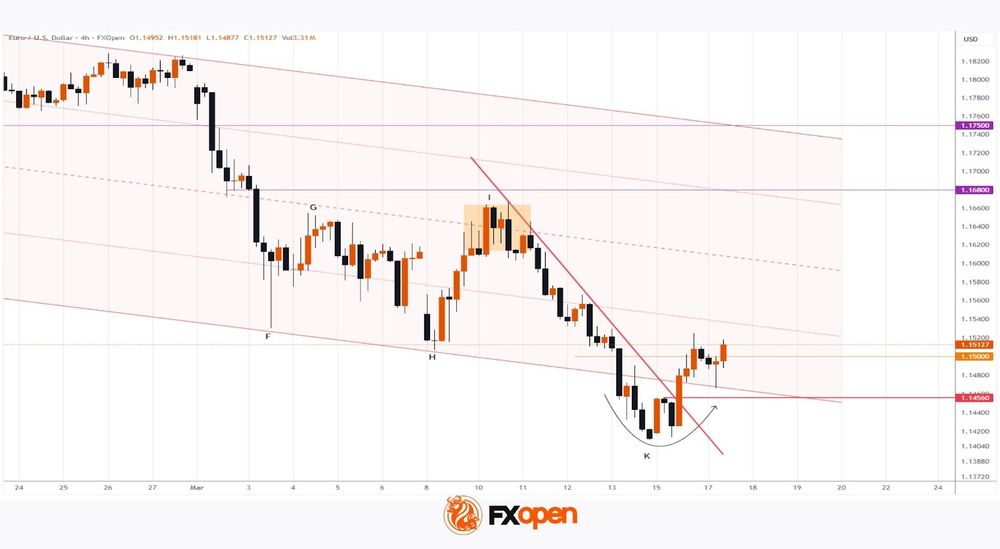
Note the following:
- → The descending trendline from last week has been breached; the market is holding above the breakout level around 1.14560.
- → The pair is recovering from oversold territory just below the lower boundary of the channel. The psychological level 1.1500 may provide support.
Thus, traders should consider the scenario in which EUR/USD’s strong movement on Monday–Tuesday is confirmed by upcoming central bank news.
Trade over 50 forex markets 24 hours a day with FXOpen. Take advantage of low commissions, deep liquidity, and spreads from 0.0 pips (additional fees may apply). Open your FXOpen account now or learn more about trading forex with FXOpen.
This article represents the opinion of the Companies operating under the FXOpen brand only. It is not to be construed as an offer, solicitation, or recommendation with respect to products and services provided by the Companies operating under the FXOpen brand, nor is it to be considered financial advice.
GBP/USD Pauses Ahead of Bank of England Rate Decision
GBP/USD is holding near 1.3315 on Tuesday. The pound posted a modest gain the previous day but remains close to three-month lows amid ongoing uncertainty over the impact of the Middle East conflict on the global economy and inflation. Investors continue to favour the US dollar as a key safe-haven asset.
Since the onset of the conflict involving Iran, the dollar has been the primary beneficiary of safe-haven demand, outperforming gold, government bonds, and currencies such as the Swiss franc. Meanwhile, the pound has shown relative resilience compared with several other currencies: over the past three weeks, it has declined by approximately 1.7%, while the yen and euro have lost around 2.0% and 3.0%, respectively. This relative strength is partly due to the UK’s lower dependence on energy imports and its higher interest rate environment.
The key event of the week is the Bank of England’s meeting on Thursday, where the rate is expected to remain unchanged at 3.75%. Markets are currently pricing in just one rate cut before year-end, marking a notable shift from the two cuts anticipated prior to the conflict’s escalation.
Attention will also turn to UK labour market data, which points to a gradual cooling in employment and a slowdown in wage growth. Against this backdrop, with persistent inflationary pressure and rising energy prices, the pound may face further headwinds if macroeconomic conditions continue to deteriorate.
Technical Analysis
On the H4 GBP/USD chart, the market is forming a broad consolidation range around 1.3283, currently extending to 1.3333. A decline to 1.3260 is expected in the near term, after which a new consolidation range is likely to form. An upside breakout would pave the way for a continuation wave towards 1.3360, while a downside breakout would suggest further movement towards 1.3133. Technically, this scenario is confirmed by the MACD indicator, whose signal line is below the zero level and pointing sharply upwards.
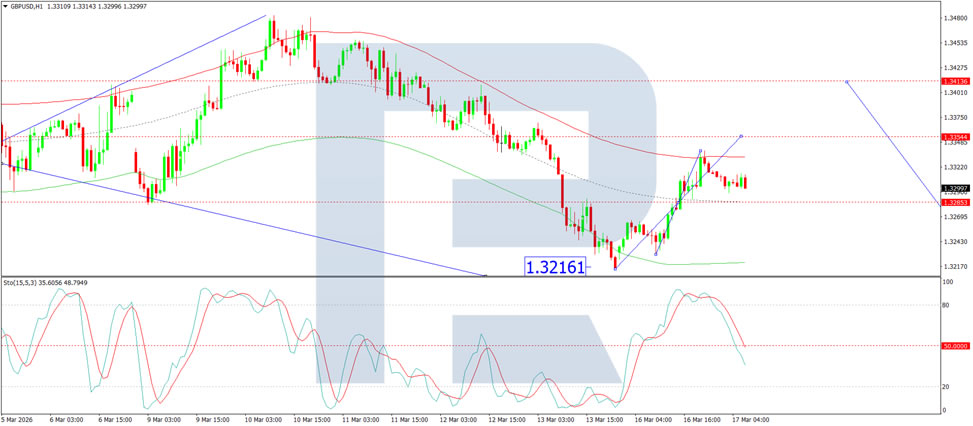
On the H1 chart, the market has formed a compact consolidation range around 1.3315. A downside breakout has initiated a wave structure extending to 1.3260. Should this level be breached, further downside towards 1.3125 is likely. Conversely, an upside breakout from the range could trigger a growth wave towards 1.3350. Technically, this scenario is confirmed by the Stochastic oscillator, with its signal line above the 80 level and pointing sharply downwards.
Conclusion
GBP/USD remains in a holding pattern ahead of Thursday’s Bank of England decision, with the pound showing relative resilience compared with other major currencies despite lingering near three-month lows. The dollar continues to dominate as the preferred safe-haven asset amid ongoing Middle East tensions, while shifting rate expectations – from two cuts to just one – reflect the complex inflation dynamics facing policymakers. With UK labour data showing signs of cooling and energy prices remaining elevated, the BoE’s tone on Thursday will be crucial in determining whether sterling can break out of its current consolidation range or extend its recent losses.
Markets Tentatively Show “a Correction on Yesterday’s Correction”
Markets
More than two weeks after the start of the military action of the US and Israel against Iran, markets yesterday apparently reached a Short term evaluation point. After adapting towards stagflationary risk due to higher energy prices at least some bad news should now be discounted. At the same time it’s almost impossible also for investors to do a more in dept economic benchmarking as visibility on the (political) outcome of this conflict and on its longer term economic impact remains very low. In this context, markets might have entered a phase where they are pushed back and forth by multiple, conflicting headlines. Yesterday, this process resulted in a brief ‘corrective’ risk-on interludium. Equites rebounded (S&P +1.01%, Eurostoxx +0.39%). Yields eased of the peak levels since the start of the war touched end last week. In this market set-up the dollar also was poised to return some of its recent gains. Especially the repricing on interest rate markets over the previous two weeks at least showed that markets understood that central banks reaction function will be different compared to Covid and to the what happened after the start of the war Ukraine. CB’s in a first reaction are expected to give more weight to trying to prevent second round inflation effects rather than focus on the fall-out on growth. However, also here markets yesterday apparently reached a first evaluation point, with long-term yields both in the US and EMU reaching important technical, psychological barriers (e.g;3% level 10-y EMU, YTD top 10-y US). In this process yields yesterday eased a few bps as markets are now look forward to some more concrete info on CB’s reaction function at the policy meetings later this week. US yields eased between 3.75 bps (30-y) and 6.2 bps (5-y). German yields in a similar move ceded between 4 bps (2-y) and -1.6 bps (30-y). On this temporary/corrective risk-on, the dollar also fell prey to modest profit taking. DXY eased off the 100.5 resistance area to close at 99.71. EUR/USD rebound from the 1.142 area to close just north of 1.15.
In the above-mentioned back-and forth process, markets this morning apparently see the glass again a bit more half empty rather than half full, with headlines this morning focusing on Iran targeting oil production facilities in the region while the US also threatens to attack key Irian Kharg oil infrastructure. At the same time, there is also little indication that political efforts (from the US) to set-up coalition to secure a passage through the Strait of Hormuz will yield results anytime soon. Markets tentatively show ‘a correction on yesterday’s correction’ with yields, oil and the dollar regaining some ground. This, rather erratic process’ might continue for some time to come. The eco calendar is thin today. We keep an eye at investors’ interest in a US Treasury $13 bln 20-y bond auction.
News & Views
The Reserve Bank of Australia raised its cash rate for a second consecutive meeting by 25 bps, from 3.85% to 4.1%. Australian inflation picked up materially in the H2 2025 with information this year suggesting that some of the increase reflects greater domestic capacity pressures. The labour market is also somewhat tighter than expected. In addition, the conflict in the Middle East has resulted in sharply higher fuel prices, which, if sustained, will add to inflation. Short-term measures of inflation expectations have already risen to a degree that that the board is judging there is a material risk inflation will remain above target for longer than previously anticipated. Uncertainty remains on the outlook with new growth/inflation forecasts available in May (56% market implied probability of 25 bps rate hike). RBA governor Bullock didn’t rule anything in or out for that meeting with the extent to which monetary policy is restrictive also being uncertain. Today’s vote was a close one (5-4) with Bullock explaining that dissenters also projected higher rates but from a timing-perspective wanted to play by the “old” rulebook of gathering more evidence before deciding on action. The 5-4 vote caused a pullback in AUD yields and AUD/USD which was later reversed during Bullock’s hawkish press conference. When asked if the board would push the economy into recession to tame prices, Bullock for example said “if it’s hard to bring inflation down then we’re going to have to deal with that.”
Japanese Finance Minister Katayama reiterated yesterday’s warning that recent currency moves have not been aligned with fundamentals. The deviation appears particularly significant at present. “Considering the impact exchange rates have on people’s daily lives, we are fully prepared to respond at any time”. She added willingness to take bold action in the strongest possible (verbal) intervention threat. USD/JPY keeps hovering around the 160-level which prompted such action in 2024. Apart from oil prices and global dollar moves, Japanese markets will also take note from the Bank of Japan which meets on Thursday. Lack of a hawkish message might spell more trouble for JPY.