Sample Category Title
Bitcoin Breakout Attempt Builds — Bulls Aim for Trend Shift
Key Highlights
- Bitcoin started a steady increase above $72,000 and $75,000.
- A bullish trend line is forming with support at $71,500 on the 4-hour chart of BTC/USD.
- Ethereum also climbed over 10% and surpassed $2,350.
- Gold failed to settle above the $5,200 resistance and trimmed gains.
Bitcoin Price Technical Analysis
Bitcoin price remained supported above $68,500 against the US Dollar. BTC climbed above $72,000 and $73,200 to enter a positive zone.
Looking at the 4-hour chart, the price settled above the $72,000 pivot level, the 100 simple moving average (red, 4-hour), and the 200 simple moving average (green, 4-hour). The upward move was such that the price cleared the 1.236 Fib extension level of the downside correction from the $73,926 swing high to the $70,279 low.
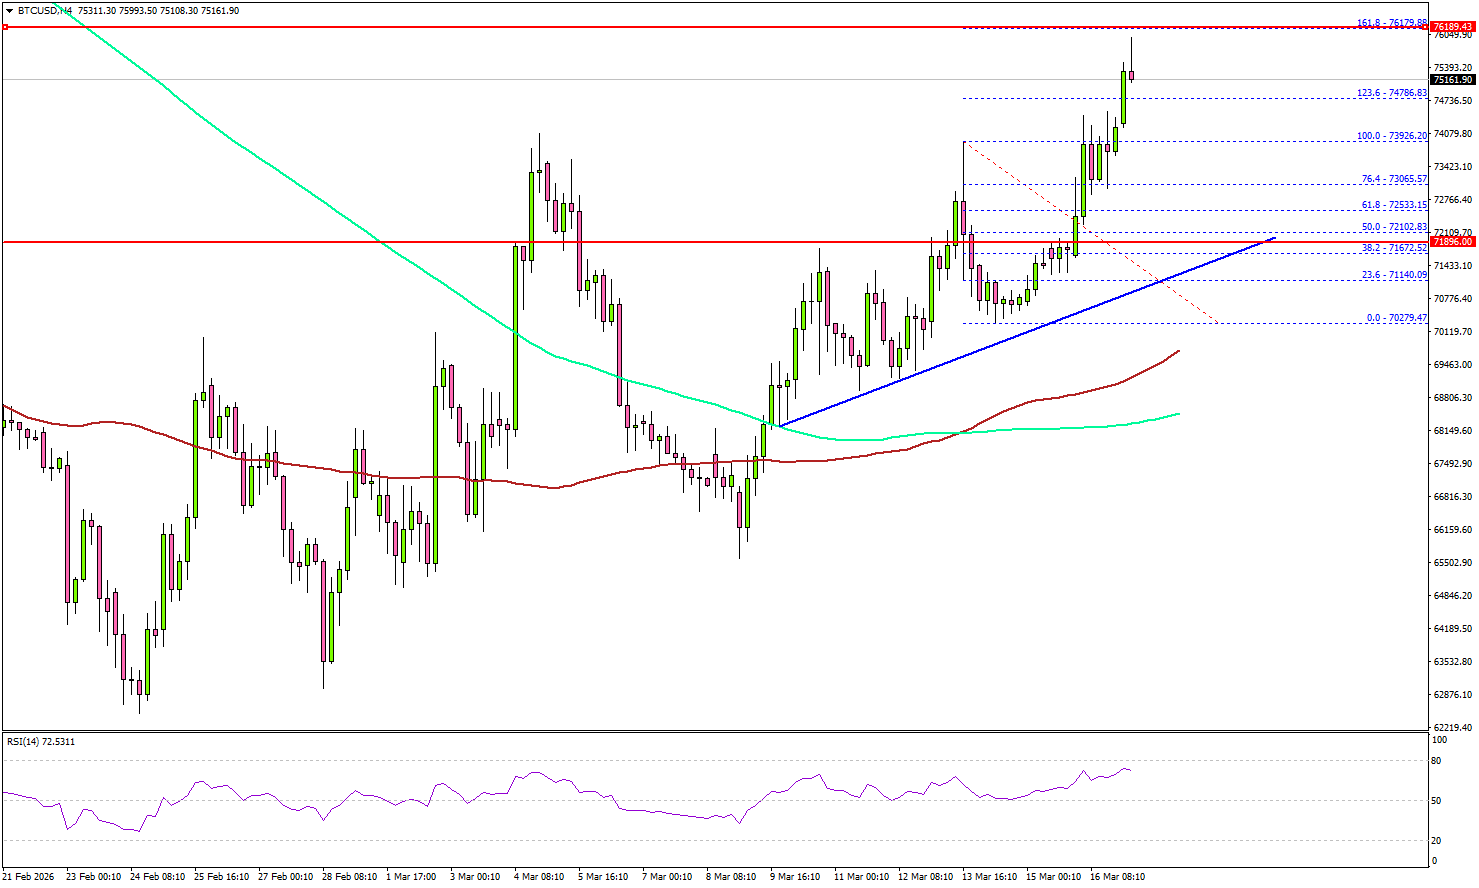
It opened the doors for a move above $75,000. On the upside, the price now faces resistance near $76,000 and the 1.618 Fib extension level of the downside correction from the $73,926 swing high to the $70,279 low.
The first key hurdle is $77,000. A close above $77,000 could send the price toward $78,800. Any more gains might call for a test of $80,000.
Immediate support sits at $74,000. The first key support could be $72,500. The main breakdown support could be near a bullish trend line at $71,500. A downside break below the trend line might start another decline. The next major support is $70,000, below which BTC could decline toward $68,500.
Looking at Ethereum, the price also gained bullish momentum above $2,250, and the bulls could now aim for a move toward $2,500.
Today’s Key Economic Releases
- US Pending Home Sales for Feb 2026 (YoY) - Forecast -0.5%, versus -0.8% previous.
Metals Fake-Out to the Downside; Opportunity? – Gold (XAU/USD) & Silver (XAG/USD) Update
Metals have been responding very unusually to the latest and ongoing US-Iran-Israel conflict, initially spiking higher but failing to withstand the pressure that followed.
What is bothering Metals, as with virtually all other assets on the Market except for Crude and its beloved Petrodollar, is that supply tensions in Energy are known for their long-lasting effects on inflation.
And while inflation helps metals shine bright over the long run, when rate expectations are repriced higher, non-yielding assets face trouble.
This morning was yet another example of this, with Oil gapping higher at the Globex open and Gold, Silver, and other precious metals turning lower.
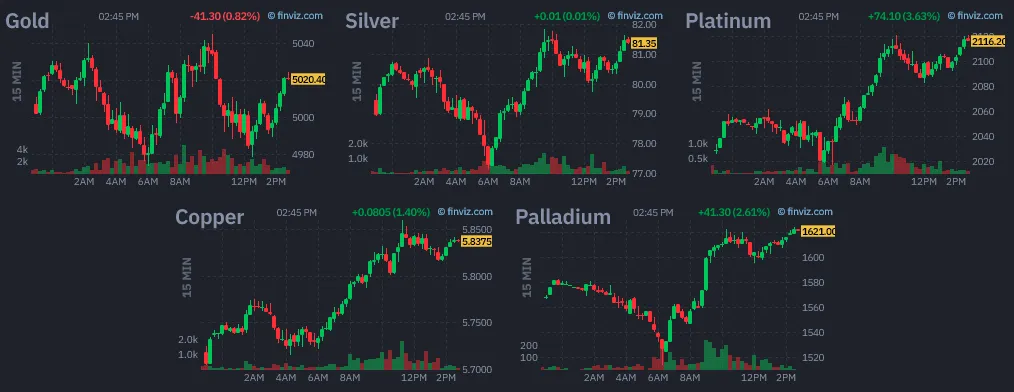
Current Session in Metals (15:05 ET) – Courtesy of Finviz. March 16, 2026
The weird price action now gets even weirder when you see that a progressive easing in Oil and the US Dollar only briefly helped metals rebound.
Gold now fragilely holds around $5,000 (after briefly crossing below the key level), and Silver is doing the same, this time around $80.
A few alternatives that have held well are Copper and Platinum, both of which remain strong despite the broader context in the Commodity Market.
We will explore their technical levels during tomorrow's Metals update.
The million-dollar question remains the same:
Are such corrections in the midst of a rough conflict opportunities to buy-dips or not?
One risk of being long metals is that if the "fact" of war brings in some profit-taking, players who bought them as Safe-Havens won't have many reasons to hold such positions; that is, as long as the conflict doesn't escalate to something much worse.
The broader de-dollarization context remains, but this could already be a trend of the past, given recent reactions to the new Fed Chair, Kevin Warsh (who has yet to be officially nominated) in end-January.
Let's tackle the intraday charts and levels for both Silver (XAG/USD) and Gold (XAU/USD) to see if today's downside fakeout could help the case for some dip-buying or if technical red flags have emerged.
Gold 4H Chart and Intraday Levels
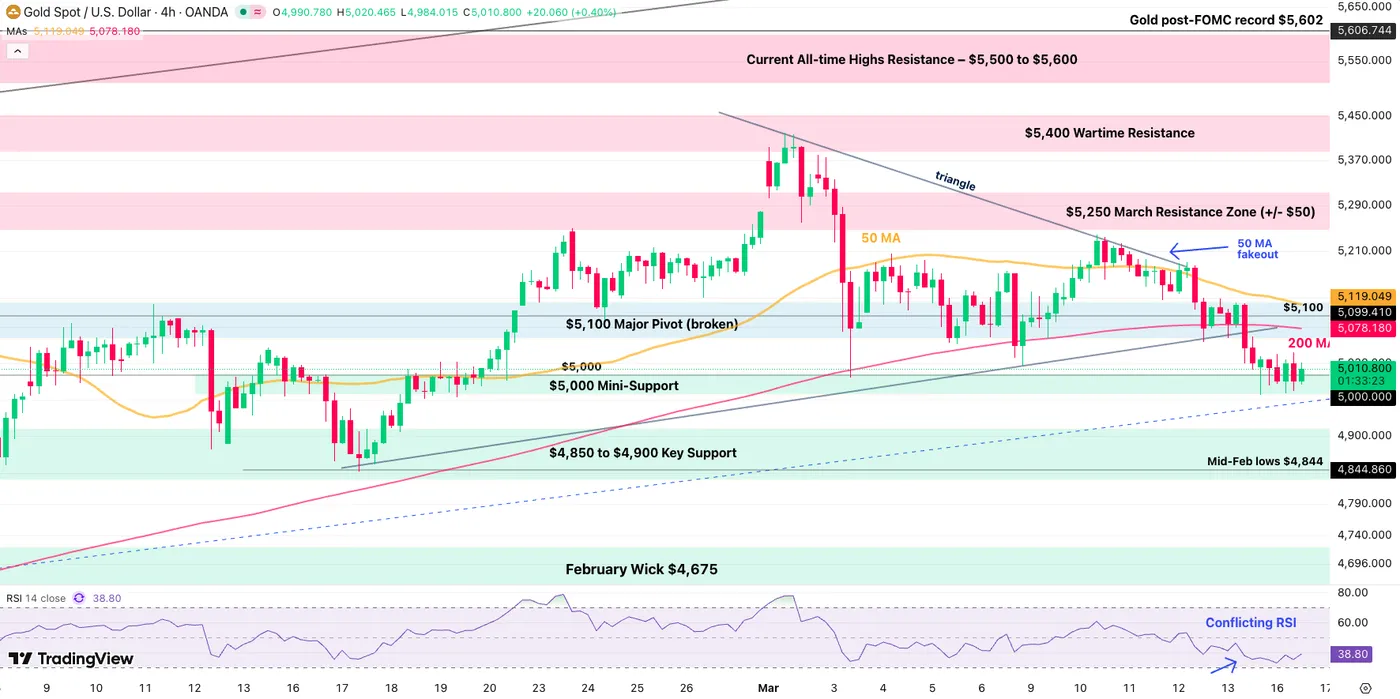
Gold 4H Chart. March 16, 2026. Source: TradingView
Pre-FOMC flows can be tricky and this is exactly what is arising from this price action.
Having broken the key $5,100 Pivot, technicals for the metal are now increasingly more mixed, but are still further from bearish territory.
This provides decent scenarios for breakout plays:
- Rebounding from here would maintain the $5,000 to $5,200 range
- Some bullish plays above the 200-period MA ($5,080) would be sensical
- Any break below $5,000 however could quickly open the door towards the Mid-Feb lows around $4,850
Levels of interest for Gold trading:
Support Levels:
- $5,000 Mini-Support
- $4,850 to $4,900 Support (Mid-Feb Lows)
- Pivotal Support and December record $4,400 to $4,500 (Bearish below)
- Channel lows $4,200
Resistance Levels:
- $5,100 Major Pivot (broken, Bullish above)
- $5,250 March Resistance Zone (+/- $25)
- $5,400 Wartime Resistance
- Current All-time Highs Resistance – $5,500 to $5,600
Silver (XAG/USD) 4H Chart and Intraday Levels
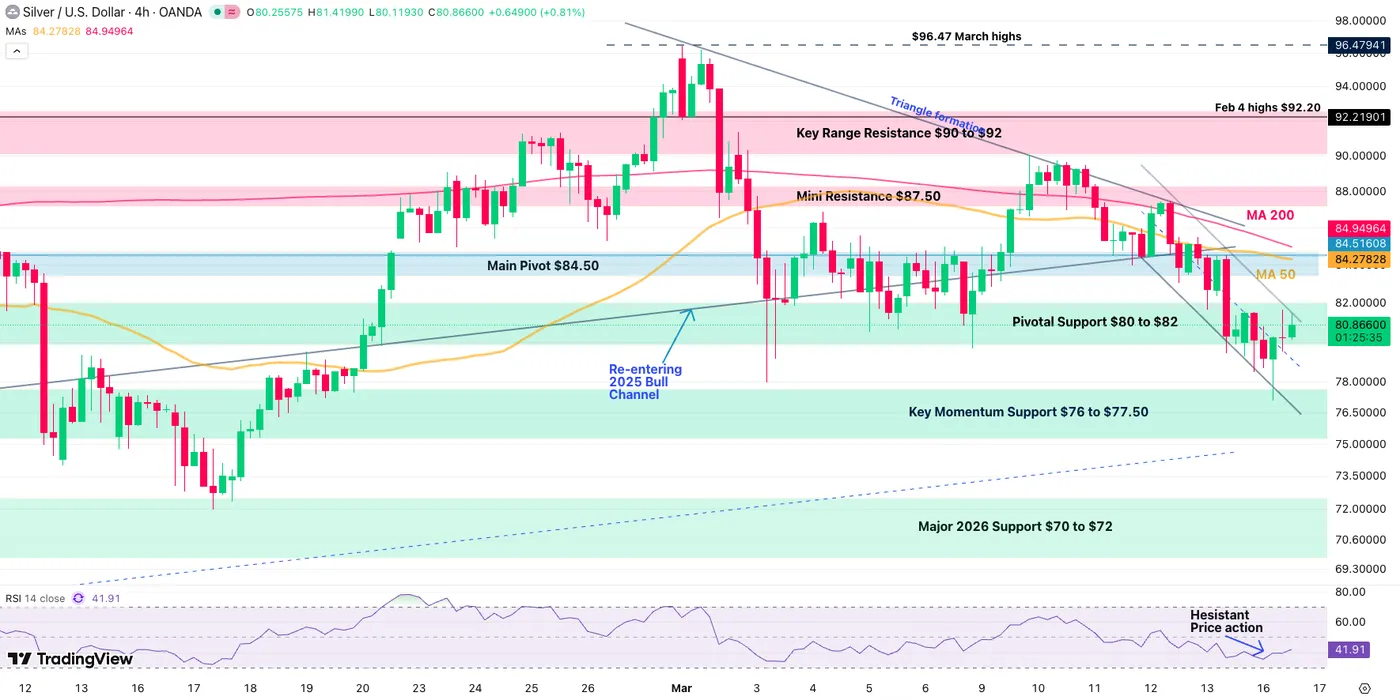
Silver 4H Chart. March 16, 2026. Source: TradingView
Silver is now looking more grim than its Yellow-counterpart.
Having failed to hold the upper bound of its 2025 bull channel, the precious metal is now well into a mid-term bearish momentum – It's lower bound is at $66 for now, close to the February lows.
For short-term traders, keep a close eye on the intraday bear channel that has recently arisen.
- Breaking $80 on the session could bring more downside ahead.
Levels of interest for Silver trading:
Support Levels:
- Pivotal Support $80 to $82 (testing)
- February Momentum Support $76 to $77.50
- Major 2026 Support $70 to $72
- 2025 Channel lows $66
Resistance Levels:
- Intraday Channel highs $81.50
- Main Pivot $84.50
- Mini Resistance $87.50
- $96.47 March highs
- Key psychological resistance $100 to $104
Safe Trades and keep a close eye on the US-Iran developments!
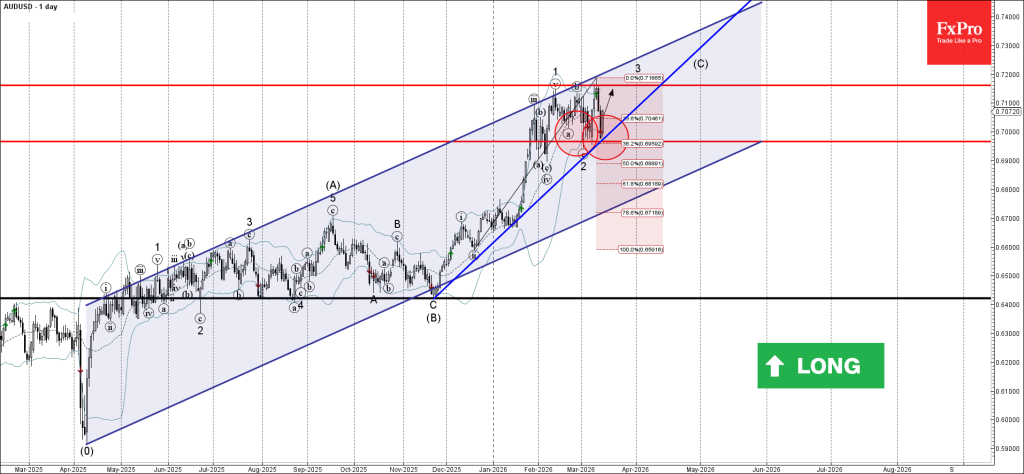
AUDUSD Wave Analysis
AUDUSD: ⬆️ Buy
- AUDUSD reversed from support zone
- Likely to rise to resistance level 0.7160
AUDUSD currency pair recently reversed from the support area between the key support level 0.6965 (low of the eagerly wave 2), support trendline from November, lower daily Bollinger Band and the 38.2% Fibonacci correction of the upward impulse from December.
The upward reversal from this support zone continues the active short-term impulse wave 3 – which belongs to the intermediate impulse wave (C) from November.
Given the overriding daily uptrend, AUDUSD currency pair can be expected to rise to the next resistance level 0.7160 (which stopped previous wave 1).
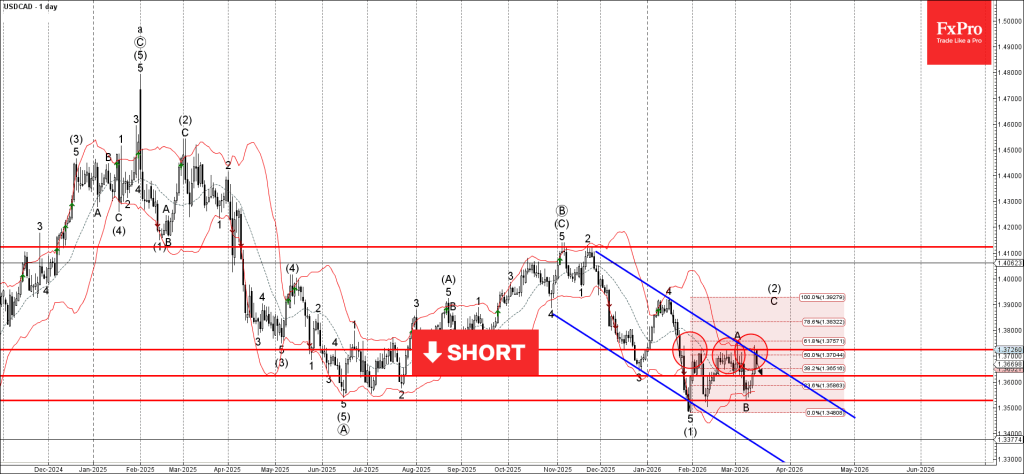
USDCAD Wave Analysis
USDCAD: ⬇️ Sell
- USDCAD reversed from resistance zone
- Likely to fall to support level 1.3625
USDCAD currency pair recently reversed from the resistance zone between the key resistance level 1.3725 (which stopped wave A), upper daily Bollinger Band and the 50% Fibonacci correction of the downward impulse from January.
The downward reversal from this resistance zone stopped the earlier short-term impulse wave C – which belongs to the ABC correction (2) from January.
Given the clear downtrend on the daily and weekly charts, USDCAD currency pair can be expected to fall to the next support level 1.3625.
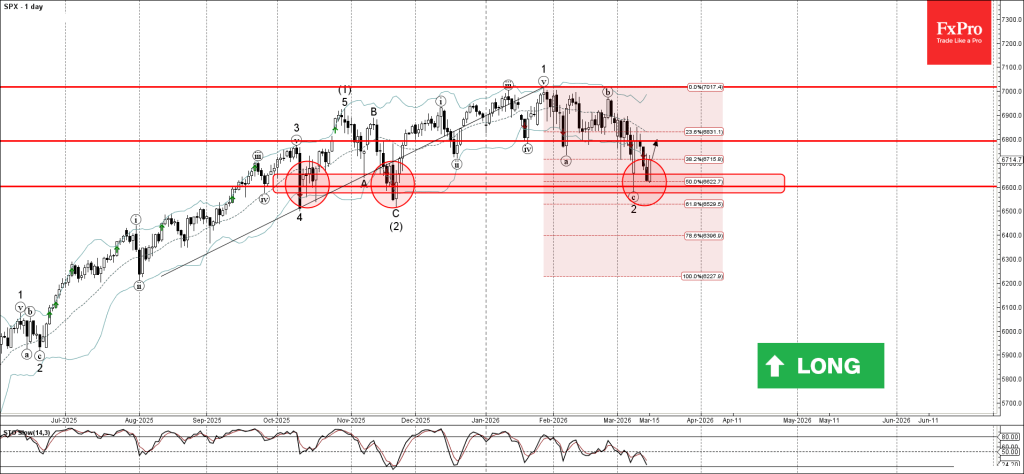
S&P 500 Wave Analysis
S&P 500: ⬆️ Buy
- S&P 500 reversed from strong support level 6600.00
- Likely to rise to resistance level 6800.00
S&P 500 index recently reversed from the support area between the multi-month support level 6600.00 (which has been reversing the index from September), lower daily Bollinger Band and the 50% Fibonacci correction of the upward impulse from December.
The upward reversal from this support zone is likely to form the daily Japanese candlesticks reversal pattern Bullish Engulfing.
Given the strong daily uptrend, S&P 500 index can be expected to rise to the next resistance level 6800.00 (former strong support from January and February).
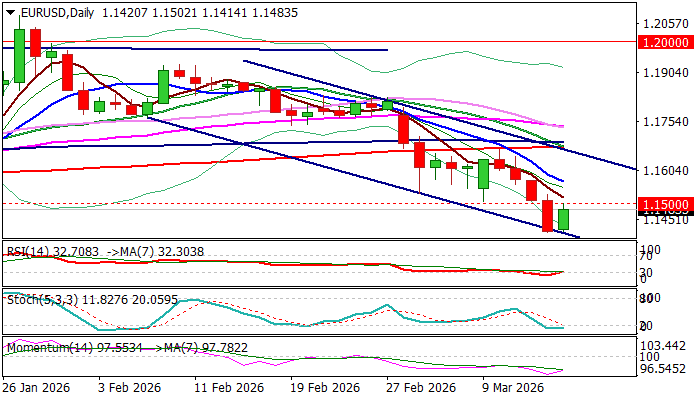
EURUSD: Bears Take a Breather After Cracking Important 1.1500 Support Zone
The Euro bounced from new multi-month low (1.1410) on Monday as traders collect profits from strong fall in past two weeks (the pair was down 3%).
Slight optimism over the Middle East crisis contributed to technical signals on oversold daily studies, which paused broader downtrend.
Violation of significant supports at 1.1500 zone (former base / psychological / top of ascending weekly Ichimoku cloud) generated negative signal (Friday’s close well below 1.1500 zone).
This warns of continuation of downtrend from 1.2082 (2026 high) after consolidation / limited correction.
Markets await policy decisions of many major central banks this week, with the ECB and Fed being on the list and both expected to keep rates unchanged this time.
The dollar is likely to benefit from Fed/ ECB rate divergence, as well as being top safe-haven demand lately that supports scenario of EURUSD bearish continuation after a pause.
Broken 1.1500 barrier so far limits bounce with stronger upticks to face barriers at 1.1575 (former low of Jan 19 / falling 10DMA) which should ideally cap and offer better opportunities to re-enter bearish market for acceleration towards 1.1354 (Fibo 38.2% of 1.0177/1.2082.
Only break above 1.1670 (200DMA / upper boundary of larger bear channel) would sideline bears.
Res: 1.1500; 1.1575; 1.1633; 1.1670
Sup: 1.1410; 1.1391; 1.1354; 1.1300
Eco Data 3/17/26
| GMT | Ccy | Events | Act | Cons | Prev | Rev |
|---|---|---|---|---|---|---|
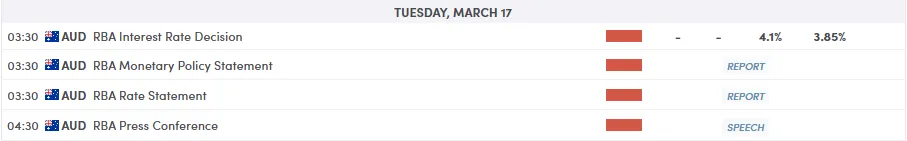
| 03:30 | AUD | RBA Interest Rate Decision | 4.10% | 4.10% | 3.85% | |
| 04:30 | AUD | RBA Press Conference | ||||
| 04:30 | JPY | Tertiary Industry Index M/M Jan | 1.70% | 0.70% | -0.50% | -0.80% |
| 07:30 | CHF | Producer and Import Prices M/M Feb | -0.30% | 0.00% | -0.20% | |
| 07:30 | CHF | Producer and Import Prices Y/Y Feb | -2.70% | -2.20% | ||
| 10:00 | EUR | Germany ZEW Economic Sentiment Mar | -0.5 | 39 | 58.3 | |
| 10:00 | EUR | Germany ZEW Current Situation Mar | -62.9 | -67.1 | -65.9 | |
| 10:00 | EUR | Eurozone ZEW Economic Sentiment Mar | -8.5 | 24.3 | 39.4 | |
| 14:00 | USD | Pending Home Sales M/M Feb | 1.80% | -1.00% | -0.80% | -1.00% |
| 03:30 | AUD |
| RBA Interest Rate Decision | |
| Actual | 4.10% |
| Consensus | 4.10% |
| Previous | 3.85% |
| 04:30 | AUD |
| RBA Press Conference | |
| Actual | |
| Consensus | |
| Previous | |
| 04:30 | JPY |
| Tertiary Industry Index M/M Jan | |
| Actual | 1.70% |
| Consensus | 0.70% |
| Previous | -0.50% |
| Revised | -0.80% |
| 07:30 | CHF |
| Producer and Import Prices M/M Feb | |
| Actual | -0.30% |
| Consensus | 0.00% |
| Previous | -0.20% |
| 07:30 | CHF |
| Producer and Import Prices Y/Y Feb | |
| Actual | -2.70% |
| Consensus | |
| Previous | -2.20% |
| 10:00 | EUR |
| Germany ZEW Economic Sentiment Mar | |
| Actual | -0.5 |
| Consensus | 39 |
| Previous | 58.3 |
| 10:00 | EUR |
| Germany ZEW Current Situation Mar | |
| Actual | -62.9 |
| Consensus | -67.1 |
| Previous | -65.9 |
| 10:00 | EUR |
| Eurozone ZEW Economic Sentiment Mar | |
| Actual | -8.5 |
| Consensus | 24.3 |
| Previous | 39.4 |
| 14:00 | USD |
| Pending Home Sales M/M Feb | |
| Actual | 1.80% |
| Consensus | -1.00% |
| Previous | -0.80% |
| Revised | -1.00% |
Sunset Market Commentary
Markets
Markets are in some kind of wait-and-see stance today after the energy-repositioning of the previous two weeks. Bond yields drop a few bps. The dollar eases off recent top levels and equities avoid a further decline. It is unclear what label/explanation is appropriate. Is it markets hoping that a solution on the passage of energy through the Strait of Hormuz might be possible in a not that distant future? It doesn’t seem that evident. The call of US president Trump to countries including China and Nato allies to join US action to keep the Strait open, if any, only received lukewarm response. Other political comments this weekend neither suggest a profound de-escalation. Probably, today’s price action is only a reflection point with investors pondering what might already be priced in, moving to a more agnostic approach. This reasoning especially might apply to interest rate markets with the likes of the Fed, the ECB, the Bank of England, the Bank of Japan and several other central banks deciding on policy later this week. For those still in the process of normalizing policy toward a more neutral level (Fed, BoE), easing expectations have been reduced sharply. For the Fed only one 25 bps step is still discounted by eoy (to be compared to 2+ steps before the start of the war). For the Bank of England two 25 bps cuts priced in end-February now even have turned into tentative speculation that Bailey and the MPC might be forced to hike late this year. Similar narrative for the ECB (from 50% anticipation of a rate cut in H2 before to war to 1+ hike priced in H2 2026). Long term yields in the US and Europe on Friday tested key levels last Friday (US 10-y nearing YTD top at 4.30%; EMU 10-y swap at 3% testing the highest levels since Nov 2023, German 10 & 30-y testing/only a whisker away from the highest levels since 2011 !!). That battle might continue in case of more signs that the conflict lasts longer and with risks of second round inflation impact. US yields today are easing by 3 bps (2-y) to 5 bps (10-y). German yields are correcting between 5 bps (2-y) and 3 bps (30-y). UK yields eases 6-7 bps across the curve. Despite today’s move, markets will scrutinize central bank’s decisiveness and commitments to avoid a 2022 scenario. On other markets, oil eases off the intraday peak levels, but Brent still holds near $100/b. Equities in the US and Europe try to beak last week’s downward spiral (Eurostoxx 50 + 0.85%, S&P 500 + 1.25%). However its too early to draw any conclusions, even from a technical point of view. The dollar rally takes a breather, with important resistance levels nearby. DXY (99.85) this morning tested the 100.5 area (top end May last year and top of MT sideways consolidation range). USD/JPY holds near 159 after setting a new YTD top on Friday and with the key 160 reference still within reach. EUR/USD (1.149) rebounds off the 1.1411 area with the August low at 1.1392 still the main technical reference.
News & Views
Canadian inflation rose by 0.5% M/M in February, a slower pace than consensus expected (+0.7%). Annual inflation fell from 2.3% to 1.8% (vs 1.9% consensus), back below the Bank of Canada’s 2% inflation target for the first time since August of last year. Base effects were in play because of the end to the goods services and harmonized sales tax break halfway into February of last year. Gasoline prices moderated the slowdown in CPI (-14.2% Y/Y vs -16.7% Y/Y in January-. A 3.6% M/M increase in gasoline prices was already the result from higher crude oil prices in the lead-up to the conflict in the Middle East, as well as oil supply disruptions in some producer countries. Measures of core inflation, including the central bank’s preferred trimmed mean remain sticky above 2% (2.3% Y/Y from 2.4%). Goods prices increased 0.5% M/M to be up 0.5% Y/Y while services prices rose by 0.6% M/M and 2.7% Y/Y. Canadian markets are unnerved by the outdate numbers and follow today’s global market moves.
The Bank of International Settlements released its quarterly review. It focuses on market recalibration amid shifting currents. Inflation expectations edged up, leading investors to revise expectations of policy rates upwards and push back the expected timing of US rate cuts. Hyun Song Shin, head of the Monetary and Economic Department warned that “if the conflict persists or widens beyond current expectations, that could trigger sharper adjustments in inflation expectations and financial conditions. A spike in interest rates could put pressure on rich asset price valuations and rising financial costs for governments and the need to issue more debt could undermine fiscal sustainability.”
RBA Preview: Why a 25bps hike to 4.1% is the most likely outcome
- Markets are pricing in a 68% probability for a 25-basis-point (bps) rate hike, lifting the cash rate to 4.1%.
- The board needs to move policy past the current "neutral" rate (where interest rate ≈ inflation) to cool the "very hot" economy and suppress climbing prices.
- A hawkish statement pointing to further hikes could propel AUD/USD toward 0.7200, while a non-committal tone could trigger a drop to 0.6940.
- An escalating Iran conflict and the potential closure of the Strait of Hormuz complicates the path forward beyond this weeks meeting.
The meeting of the Reserve Bank of Australia is scheduled for Tuesday March 17, 2026 at 03:30am GMT. The transition from a period of disinflationary hopes in 2025 to a "live" hiking cycle in early 2026 represents one of the most abrupt pivots in recent Australian central banking history.
At the center of this volatility is the escalation of the US-Israeli conflict with Iran, which has transformed from a regional skirmish into a systemic threat to global energy security and maritime trade.
The closure of the Strait of Hormuz, a critical artery for roughly 20% of the world's liquid energy supplies, has introduced a "nightmare scenario" for policymakers: a classic supply-side shock that threatens to unanchor inflation expectations while simultaneously suppressing economic activity.
Prior to the conflict in the Middle East though, markets were already leaning toward an RBA rate hike at Tuesday's meeting.
What are markets expecting?
As things stand market participants and economists are still leaning toward a 25-basis-point (bps) rate hike, which would take the cash rate to 4.1%.
Market Pricing: Overnight index swaps (OIS) currently imply a 68% probability of a hike, a significant jump from early March expectations.
Analyst Consensus: A Bloomberg survey shows 24 out of 33 analysts now forecast a 25bps increase this month.
Hawkish Signaling: Recent comments from Governor Michele Bullock and Deputy Governor Andrew Hauser have labeled the March meeting as "live". Hauser specifically warned that keeping rates too low could fuel a "damaging rise" in inflation expectations.
This seems like the most likely outcome for tomorrow as the RBA remains concerned about inflationary pressure.
The board are worried that their current strategy isn't doing enough to slow things down. Right now, the interest rate is 3.85%, but since prices are rising by 3.8%, the "real" cost of borrowing is basically nothing.
For all market-moving economic releases and events, see the MarketPulse Economic Calendar. (click to enlarge)
In simple terms, when the interest rate and the inflation rate are almost the same, the policy is "neutral", it isn't really helping or hurting. Because almost everyone who wants a job has one (full employment), the economy is running very hot.
To actually cool things down and stop prices from climbing, the bank believes they need to move past this neutral point and make borrowing expensive enough to discourage extra spending.
Outlook moving forward
The March decision may be the start of a renewed tightening phase rather than a one-off move.
- Further Hikes: Several major banks (ANZ, CBA, NAB, Westpac) now expect a follow-up 25bps hike in May, potentially bringing the terminal rate to 4.35%.
- Prolonged Target Horizon: In February, the RBA forecast that trimmed mean inflation would not return to the target band until H1 2027 and wouldn't reach the 2.5% midpoint until H1 2028.
- Economic Slowdown: Tighter policy and energy price headwinds are expected to lower 2026 GDP growth to roughly 1.9%, with unemployment potentially rising toward 4.5% by year-end.
Now of course, if the war in the Middle East persists and oil prices remain high the entire outlook may change and inflation may surge.
A lot to consider not just for the RBA but global central banks if the Middle East conflict drags on at the current pace.
Market reactions and AUD/USD technical dynamics
The Australian dollar (AUD) has been highly sensitive to the shifting RBA outlook. Throughout mid-March, the AUD/USD pair has experienced a "tug-of-war" between domestic hawkishness and global risk aversion.
While the US dollar (USD) has strengthened as a safe-haven asset due to the Iran conflict, the AUD has been supported by the rising probability of a 4.10% cash rate.
Technically, the AUD/USD reached a 45-month high of 0.7189 in the middle of the week prior to the meeting, but has since pulled back to test the 0.7000 handle.
If the RBA hikes as expected but adopts a more patient or "wait-and-see" tone for the future, the AUD could see a "sell the fact" reaction, potentially dropping toward the 0.6940 support level.
Conversely, a hawkish statement that explicitly points toward a May hike and a 4.35% terminal rate could propel the AUD/USD back toward the 0.7200 mark.
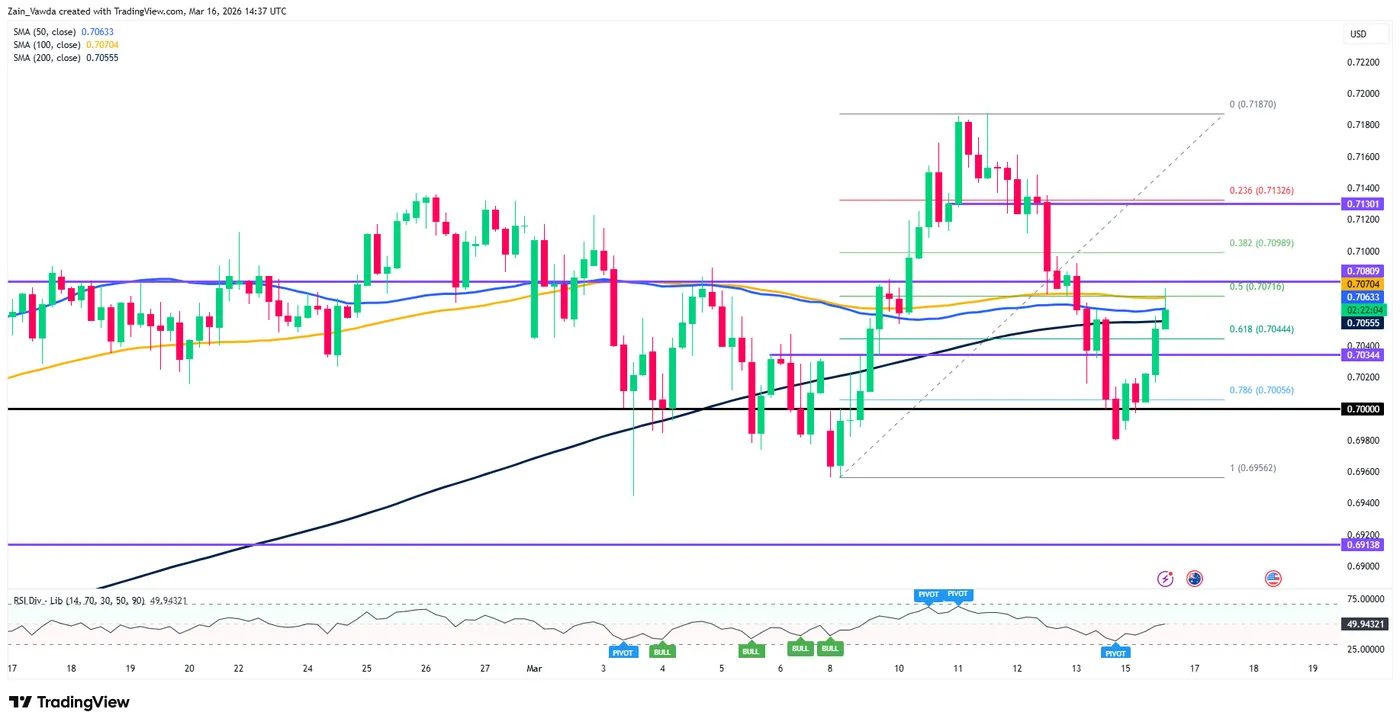
Source: TradingView.Com (click image to enlarge).
Conclusion
The March decision will be a signal of the RBA’s resolve. By choosing to act pre-emptively, the Bank is attempting to avoid the systemic failures of 2022 and 2025, hoping that a firm hand now will prevent the need for a much more destructive tightening cycle later in the year.
The path forward remains fraught with geopolitical peril, and uncertainty. Either way volatility appears inevitable.
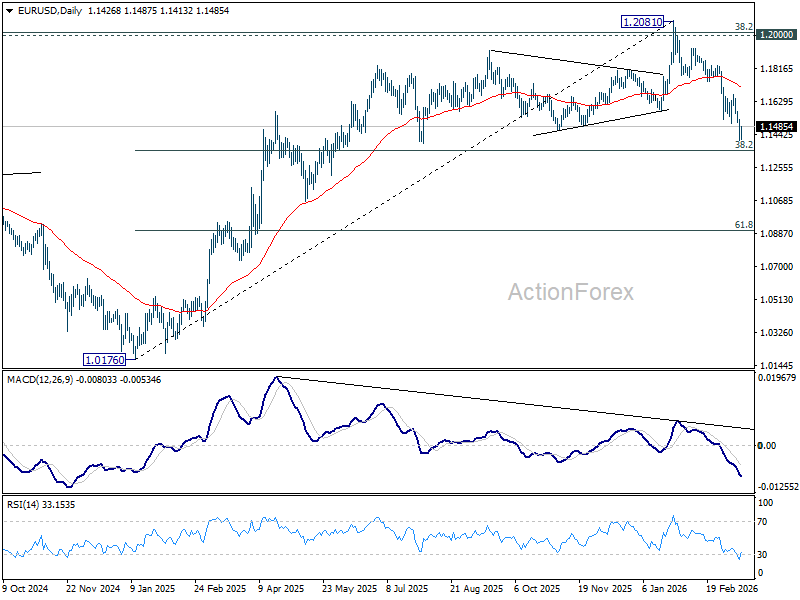
EUR/USD Mid-Day Outlook
Daily Pivots: (S1) 1.1373; (P) 1.1452; (R1) 1.1494; More….
Intraday bias in EUR/USD is turned neutral with current recovery and some consolidations could be seen. But further decline is expected as long as 1.1666 resistance holds. Below 1.1408 will resume the fall from 1.2081 to 38.2% retracement of 1.0176 to 1.2081 at 1.1353. Firm break there will target 61.8% projection at 1.0904 next.
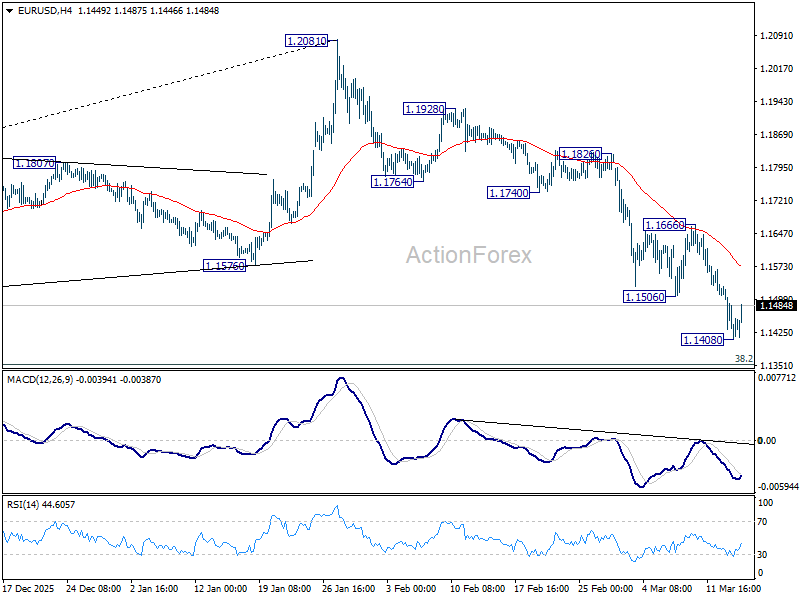
In the bigger picture, the break of 55 W EMA (now at 1.1495) confirms rejection by 1.2 key cluster resistance level. The whole up trend from 0.9534 (2022 low) might have completed as a three wave corrective rise too. In either case, deeper fall is now expected to long term channel support (now at 1.0528. Risk will stay on the downside as long as 1.2081 holds, in case of recovery.