Sample Category Title
XTI/USD Chart Analysis: WTI Oil Price Fluctuates Near $100
For the third Monday in a row, trading in the oil market has opened with a bullish gap, although this time it is not as wide as the gap seen, for example, on 9 March. The reason for the volatility is clear — the ongoing military conflict in the Middle East, with no visible signs of de-escalation so far.
According to the latest media reports:
- → the Strait of Hormuz remains effectively closed;
- → over the weekend the United States struck Iran’s Kharg Island, a key hub for the country’s oil export infrastructure;
- → Iran launched an attack on the oil port of Fujairah in the UAE.
Technical Analysis of XTI/USD
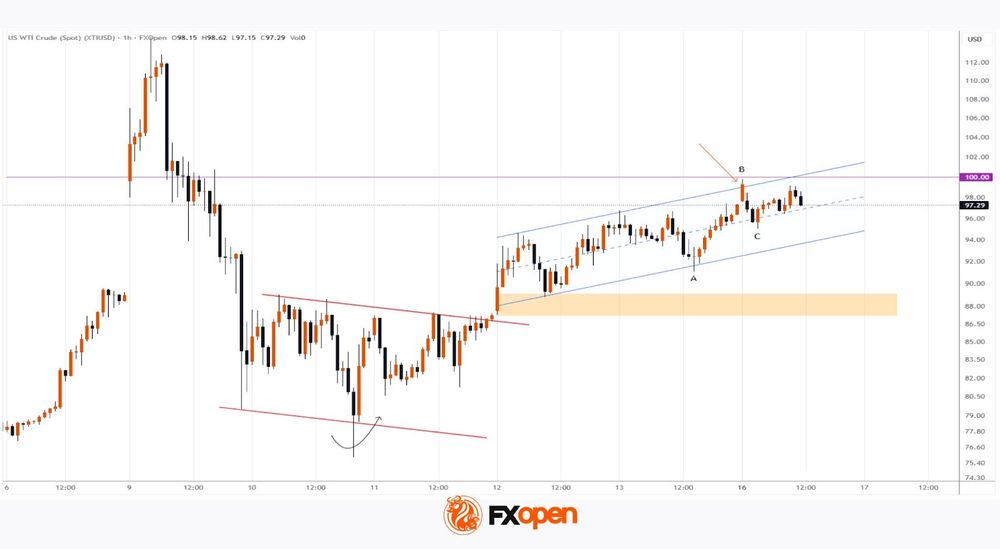
While analysing WTI price movements on 11 March, we:
- → identified a local descending channel (shown with red lines);
- → highlighted a sharp reversal on 10 March (marked with an arrow).
Since then, buying pressure has continued to strengthen, largely driven by developments in the Middle East. As a result:
- → the local descending channel was broken to the upside;
- → the breakout zone later acted as support;
- → the XTI/USD chart formed the structure for an ascending channel (shown in blue).
At present, the market retains a bullish bias. For instance, the pullback from B to C represents roughly a 50% retracement of the A–B impulse, while WTI prices remain close to the psychological level of $100 per barrel.
However, the candlestick structure at the market open (marked with an arrow) suggests that sellers were able to push prices lower. Therefore, even if we see an attempt to break above the $100 level in the near term, it may struggle to gain strong momentum.
Start trading commodity CFDs with tight spreads (additional fees may apply). Open your trading account now or learn more about trading commodity CFDs with FXOpen.
This article represents the opinion of the Companies operating under the FXOpen brand only. It is not to be construed as an offer, solicitation, or recommendation with respect to products and services provided by the Companies operating under the FXOpen brand, nor is it to be considered financial advice.
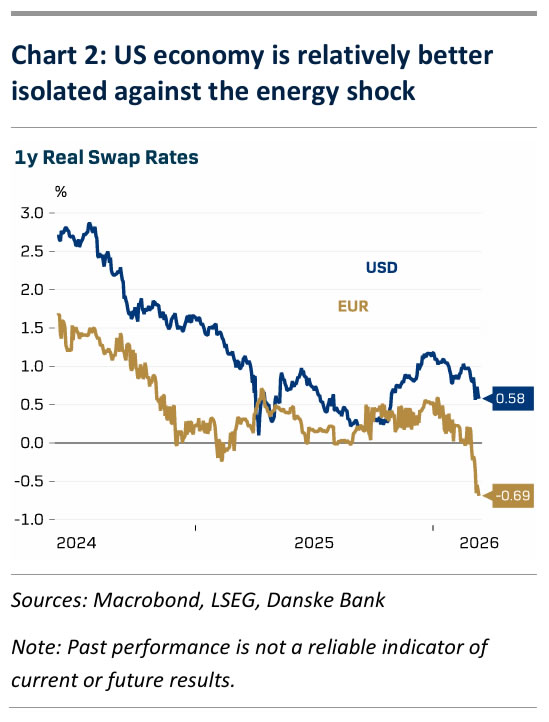
Fed Preview: Holding a Steady Hand
- We expect the Federal Reserve to keep its monetary policy unchanged at the March meeting, in line with consensus and market pricing.
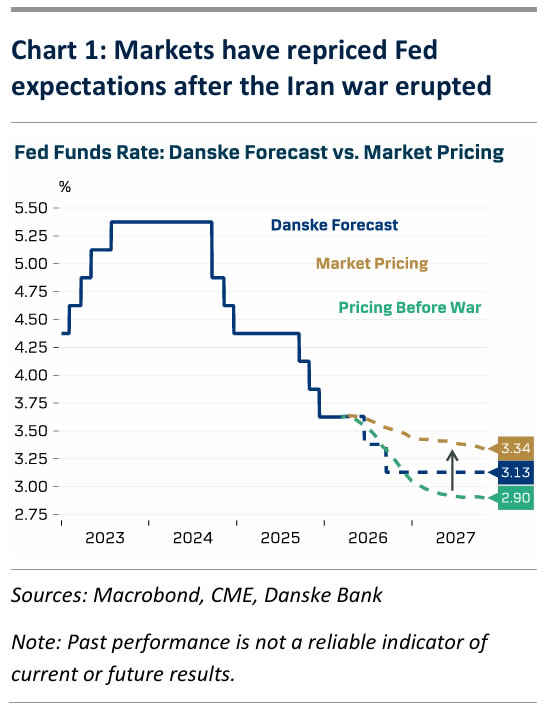
- Powell will avoid giving firm forward guidance regarding the Fed's reaction to the war in Iran. Stronger USD and tighter financial conditions are partially compensating for the inflationary effect from higher energy prices.
- Solid macro allows the Fed to hold a steady hand for as long as the energy supply uncertainty persists. Further out, we still expect the Fed to cut rates twice this year. We expect only a muted market reaction to this week's meeting.
FOMC participants had a few days to discuss the war in Iran before the March blackout begun, and the message heard from both hawks and doves was noticeably uniform. Hammack, Miran and Kashkari said it is 'too early' to judge the impact on the economy, while Williams, Barkin, Waller and Daly all underscored that they need more time to evaluate the implications for monetary policy.
And we would agree. The Fed is not under pressure to make quick policy changes, as the US economy remains relatively well insulated against the energy shock. US Henry Hub natural gas prices have hardly moved during the war whilst European natural gas and global LNG benchmarks are up almost 50% m/m. A stronger USD has partially shielded the American consumer against rising oil prices, while tighter financial conditions constrain demand. US short-end inflation expectations have risen and real rates are down, but relatively much less so than the EUR equivalents.
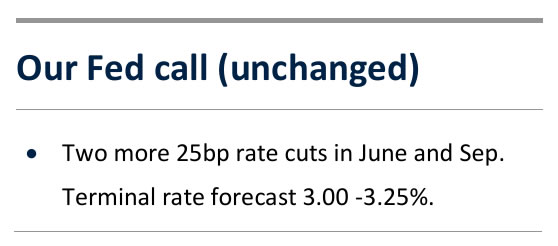
Powell will carefully avoid giving any strong forward-looking signals and emphasize the two-sided nature of the risks stemming from the energy supply shock. Most FOMC participants still see the current policy rate level somewhat above neutral, and once the energy uncertainty eases, we expect the Fed to eventually deliver two more rate cuts in June and September. Extending uncertainty could push the expected cuts further out into the future but not erase them completely, which we expect to be reflected also in the updated dots.
Rising energy costs will weigh on households' disposable income, which is already under pressure amid cooling labour markets. But for now, the relatively solid labour market data should assure the Fed that downside risks to growth remain contained. 2026 GDP forecasts will likely be revised marginally lower from December after the weak Q4 reading. Inflation forecasts could be revised higher, but we would not put too much emphasis on them at this stage given the sensitivity to the assumptions made about the persistence of the energy shock.
We expect no changes to the Fed's balance sheet operations either. The reserve management purchases of T-bills are likely to continue until the April tax date in line with earlier guidance. After mid-April, normalizing tax revenue inflow and the likely beginning of tariff refunds will ease USD liquidity conditions, allowing the Fed to decrease the T-bill purchase amounts substantially.
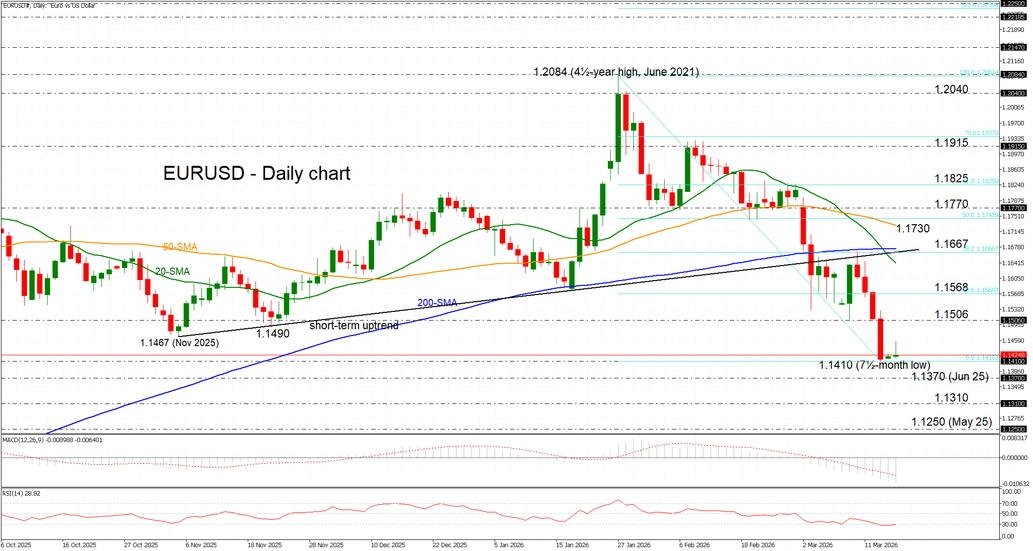
EUR/USD Pares Losses at a Seven-and-a-Half-Month Low Near 1.1450
- EUR/USD halts sharp pullback, rebounding from July lows.
- But momentum signals and ‘death cross’ keep bearish bias intact.
- EUR/USD pares losses at a seven-and-a-half-month low near 1.1450
EUR/USD is attempting to recover some lost ground after a sharp four‑session pullback from the strong cluster of converging simple moving averages (SMAs) and the short‑term uptrend that had pushed the pair toward the 1.1410 region, to levels last seen in July 2025. That said, the scope for meaningful upside may be limited. Both the MACD and RSI continue to flash bearish signals, with the MACD deeply below both zero and its red signal line, and the RSI flattening at the oversold threshold. A death cross between the 20‑ and 200‑day SMAs further reinforces downside pressure.
The moves come amid heightened Middle East concerns, while upcoming Fed and ECB policy meetings this week are likely to keep traders cautious given the current geopolitical uncertainties.
Initial resistance sits above the March 9 trough of 1.1506, at the 23.6% Fibonacci retracement of the January-March downleg at 1.1568, with stronger resistance at 1.1667 – the zone that triggered the recent pullback and which aligns with the SMA ‘death cross’ and the short‑term ascending trendline.
Support below the recent closing low of 1.1410 appears at the June 10, 2025 swing low of 1.1370, followed by the May lows within the broader 1.1310-1.1250 band.
Summing up, EUR/USD is seeing a modest bounce, but price action remains defensive and lacks strong upside momentum for now. Further, as long as the pair trades below the short‑term uptrend line, any relief rallies are likely to attract renewed selling interest, keeping the focus on lower support levels.
EUR/USD Reclaims Ground While USD/JPY Momentum Fades
EUR/USD is recovering losses from 1.1500. USD/JPY is correcting gains from 159.00 and might decline further if it stays below 158.30.
Important Takeaways for EUR/USD and USD/JPY Analysis Today
- The Euro struggled to stay in a positive zone and declined below 1.1700 before finding support.
- There was a break above a connecting bearish trend line with resistance at 1.1580 on the hourly chart of EUR/USD at FXOpen.
- USD/JPY started a decent increase above 157.00 before the bears appeared near 158.90.
- There is a key contracting triangle forming with resistance near 158.30 on the hourly chart at FXOpen.
EUR/USD Technical Analysis
On the hourly chart of EUR/USD at FXOpen, the pair started a fresh decline from 1.1825. The Euro declined below 1.1750 and 1.1700 against the US Dollar.
The pair even declined below 1.1665 and the 50-hour simple moving average. Finally, it tested the 1.1500 zone. A low was formed at 1.1507, and the pair is now recovering losses. There was a move above 1.1550 and a connecting bearish trend line at 1.1580.
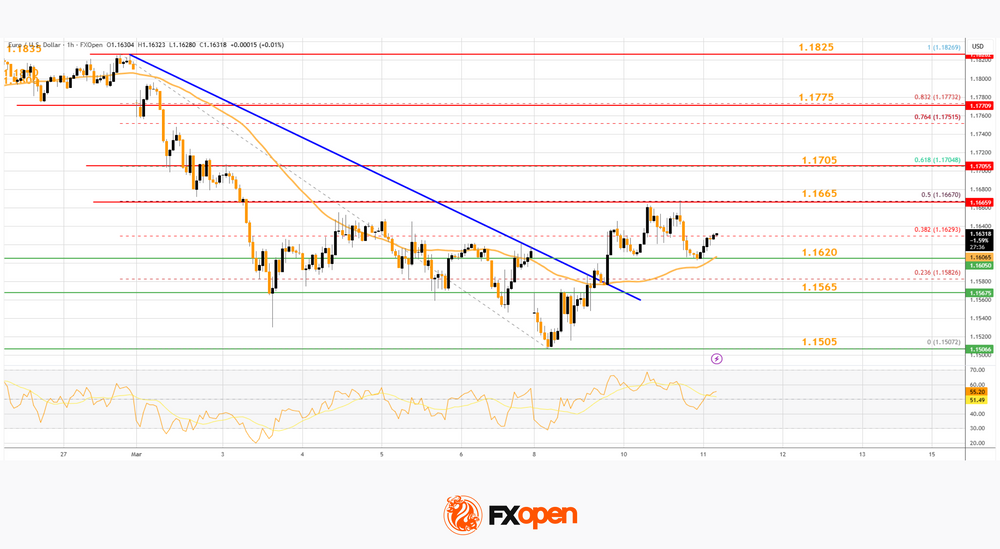
The pair surpassed the 38.2% Fib retracement level of the downward move from the 1.1826 swing high to the 1.1507 low. On the upside, the pair is now facing resistance near the 50% Fib retracement at 1.1665.
The first major hurdle for the bulls could be 1.1705. An upside break above 1.1705 could set the pace for another increase. In the stated case, the pair might rise toward 1.1775.
If not, the pair might drop again. Immediate support is near the 50-hour simple moving average and 1.1620. The next key area of interest might be 1.1565. If there is a downside break below 1.1565, the pair could drop toward 1.1505. The main target for the bears on the EUR/USD chart could be 1.1440, below which the pair could start a major decline.
USD/JPY Technical Analysis
On the hourly chart of USD/JPY at FXOpen, the pair gained pace for a move above 157.00 and 158.00. The US Dollar even traded close to 159.00 against the Japanese Yen before the bears emerged.
A high was formed at 158.90 before there was a downside correction. The pair dipped below 158.00 and the 50% Fib retracement level of the upward move from the 156.45 swing low to the 158.90 high. However, the bulls were active above 157.00 and they protected the 61.8% Fib retracement.
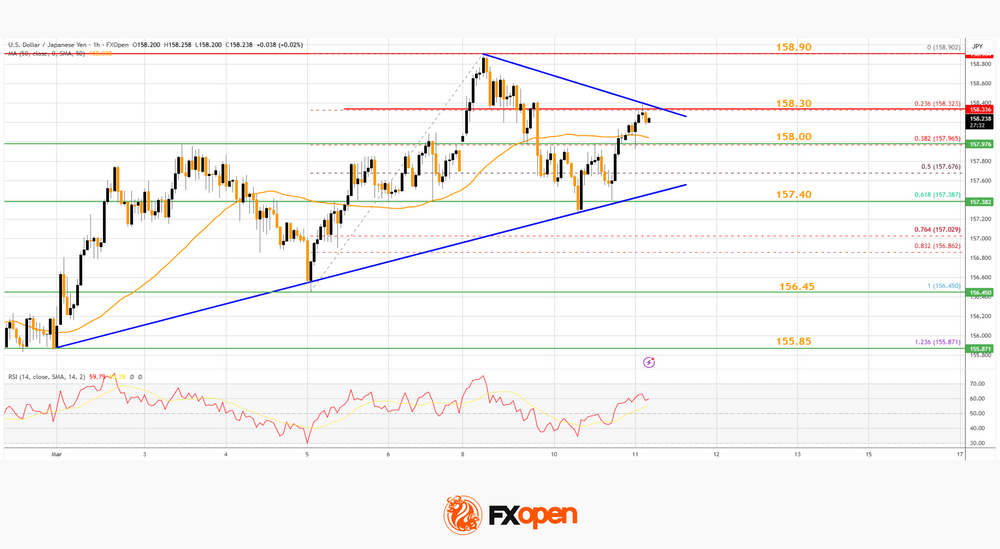
The pair is back above the 50-hour simple moving average and 158.00. Immediate resistance on the USD/JPY chart is near 158.30. There is also a key contracting triangle at 158.30.
If there is a close above the triangle and the hourly RSI moves above 65, the pair could rise toward 158.90. The next major barrier for the bulls could be 159.25, above which the pair could test 160.00 in the near term.
On the downside, the first major support is near 158.00. The next key region for the bulls might be 157.40. If there is a close below 157.40, the pair could decline steadily. In the stated case, the pair might drop toward 156.45. Any more losses might send the pair toward 155.85.
Trade over 50 forex markets 24 hours a day with FXOpen. Take advantage of low commissions, deep liquidity, and spreads from 0.0 pips (additional fees may apply). Open your FXOpen account now or learn more about trading forex with FXOpen.
This article represents the opinion of the Companies operating under the FXOpen brand only. It is not to be construed as an offer, solicitation, or recommendation with respect to products and services provided by the Companies operating under the FXOpen brand, nor is it to be considered financial advice.
Internation Energy Agency Said Oil from Emergency Reserves Will Soon Start Flowing
Markets
Markets on Friday (and this morning) tried to assess impact of ongoing elevated oil prices (Brent near $100 p/b) and other energy prices on the economy and central banks’ reaction function as visibility on the end game of the war in Iran remains very low. On Interest rate markets, the pressure of potentially higher, lasting inflation and fears for de-anchoring of inflation expectations, now ever more also filters through toward the long and of the curve. The US curve on Friday even slightly steepened. The rise in yields at the short-end of the curve slowed (at least temporarily) with the 2-y easing/correcting 2.3 bps. The long end, however, extended the rise with the 30-y adding 2.2 bps. The US 10-y yield is nearing the 4.3% YTD top levels. In Europe, yields maintained their upward trend. German yields rose between 2.7 bps (5-y) and 1.5 bps (30-y). The 10-y EMU swap yield closed above the 3% barrier for the first time since end November 2023. The UK yield curve also was testament that inflation fears/expectations ever more affecting the long end of the curve with the 30-y gilt yield closing in on the 5.5% level. Equities in the meantime continue to struggle (S&P -0.61%; Eurostoxx 50 -0.56%). On FX, the dollar remains the by default gainer with the US seen as best equipped to cope with energy-related uncertainty. The DXY index (close 100.36) is challenging the range top that guided trading since end May of last year. EUR/USD (close 1.1417) is nearing the early August low (1.1392).
At the start of the third week of the conflict between the US, Israel and Iran, uncertainty on the outcome military, (geo)politically and with respect to passage (of oil) through the Strait of Hormuz remains as elevated that it was before the weekend. US President Trump this weekend called upon (Nato) allies and even China to contribute to the defense of the Strait of Hormuz. However, for now visibility on the topic remains zero. Brent oil still holds well north of $100 p/b (104). Asian equities indices show a mixed picture trading mostly lower. US future show tentative gains. The dollar trades marginally softer but holds within reach of key resistance levels in the likes of DXY, EUR/USD and USD/JPY. Today’s eco calendar is thin. The US Empire manufacturing and production data are no game-changers. Later this week, the focus turns to a long parade central bank meetings. Markets see about a 60% + chance of the Reserve Bank of Australia tomorrow raising the policy rate for the second consecutive meeting (to 4.10%). The move was already debated before the war in the Middle East, but it added to the inflationary risks. Later this week the Fed and the Bank of Cananda (Wednesday), the BoE, ECB, Riksbank, SNB and the Czech national Bank (CNB) on Thursday and the BoJ on Friday decide on policy. For now, markets still expect them to hold policy unchanged and assess the impact of recent developments. In the current (rapidly evolving context) central banks will be cautious to make any strong commitments. Even so, with pressure also rising at the longer end of the curve, they will have to convince markets on their determination not to allow a de-anchoring of inflation expectations, if the energy prices stay higher for longer and are at risk of filtering through into second round effects. In this context, yields probably will hold recent gains, with the focus now also further turning to the long end of the curve.
News & Views
China released a batch of stronger-than-expected economic data this morning. They traditionally combine January and February numbers to smooth out distortions caused by the timing of Lunar New Year. Retail sales growth was 2.8% YTD YoY in February, vs 2.5% consensus. Also industrial production (6.3% YTD YoY) and investments (1.8% YTD YoY) managed to get over the bar. Infrastructure investments (11.4% YTD YoY) increased at the fastest pace since 2021. Data suggest that China’s economy started the year on a stromer footing than expected, but external shocks obviously pose short-term threats to that momentum. Earlier this year, China lowered its annual growth target to 4.5%-5%, the slowest pace since 1991. USD/CNY hovers around 6.9 since the start of the war in the Middle East, ending almost over a year of gradual CNY-appreciation which brought USD/CNY to lowest levels since mid-2023.
The Internation Energy Agency said that oil from the emergency reserves will soon start flowing. Last week, IEA member countries announced to make 400mn barrels of oil available to the market. Individual implementation plans indicate that stocks will be made available in Asia/Oceania immediately while stocks in the Americas and Europe will be made available starting from the end of March. Other oil-related news flow remains mixed with Iranian FM Araghchi for example stating that the Strait is operational for international shipping apart from any vessel linked to the US and Israel. On the other hand, the Houthi movement in Yemen aligned with Iran in threatening a total blockade of that other crucial strait (Bab el-Mandeb) in the Red Sea.
EUR/USD Daily Outlook
Daily Pivots: (S1) 1.1373; (P) 1.1452; (R1) 1.1494; More….
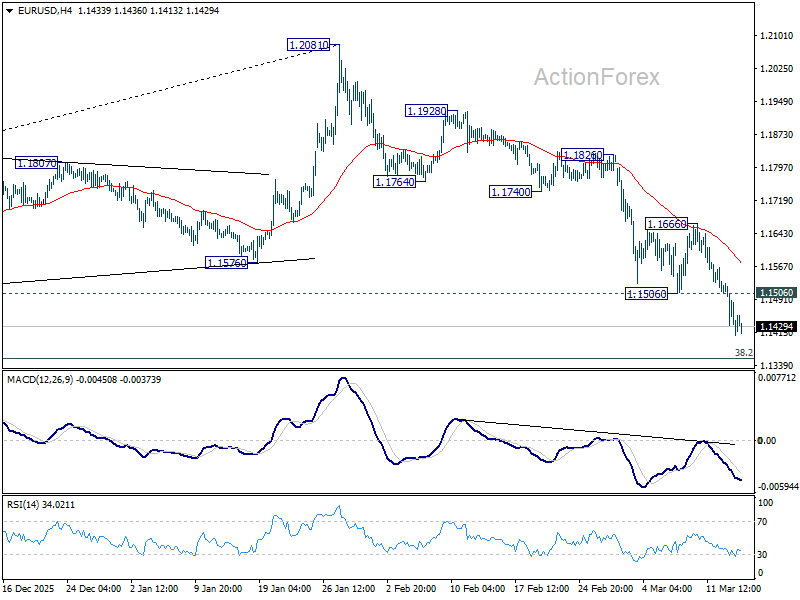
Intraday bias in EUR/USD stays on the downside as fall from 1.2081 is in progress. Deeper decline should be seen to 38.2% retracement of 1.0176 to 1.2081 at 1.1353 next. Firm break there will target 61.8% projection at 1.0904 next. On the upside, above 1.1506 support turned resistance will turn intraday bias neutral first. But near term outlook will stay cautiously bearish as long as 1.1666 resistance holds, in case of another recovery.
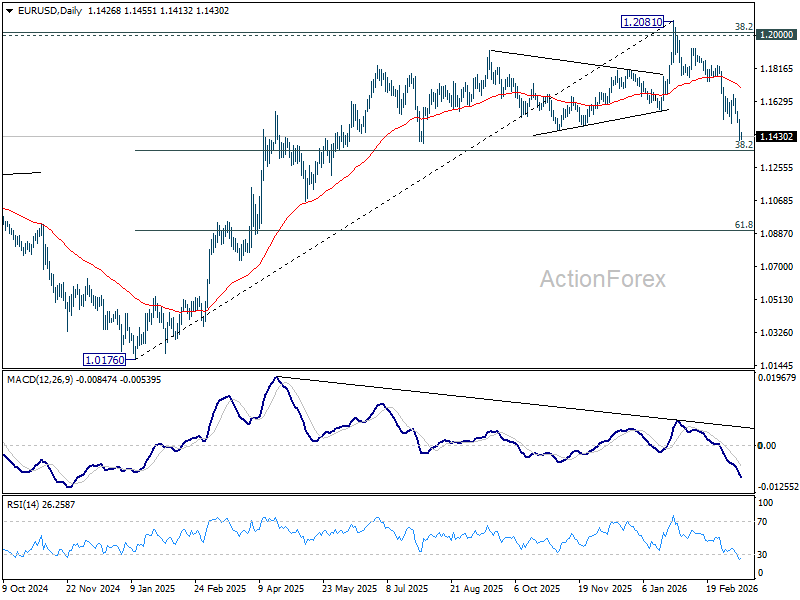
In the bigger picture, the break of 55 W EMA (now at 1.1495) confirms rejection by 1.2 key cluster resistance level. The whole up trend from 0.9534 (2022 low) might have completed as a three wave corrective rise too. In either case, deeper fall is now expected to long term channel support (now at 1.0528. Risk will stay on the downside as long as 1.2081 holds, in case of recovery.
USD/JPY Daily Outlook
Daily Pivots: (S1) 159.23; (P) 159.49; (R1) 160.00; More...
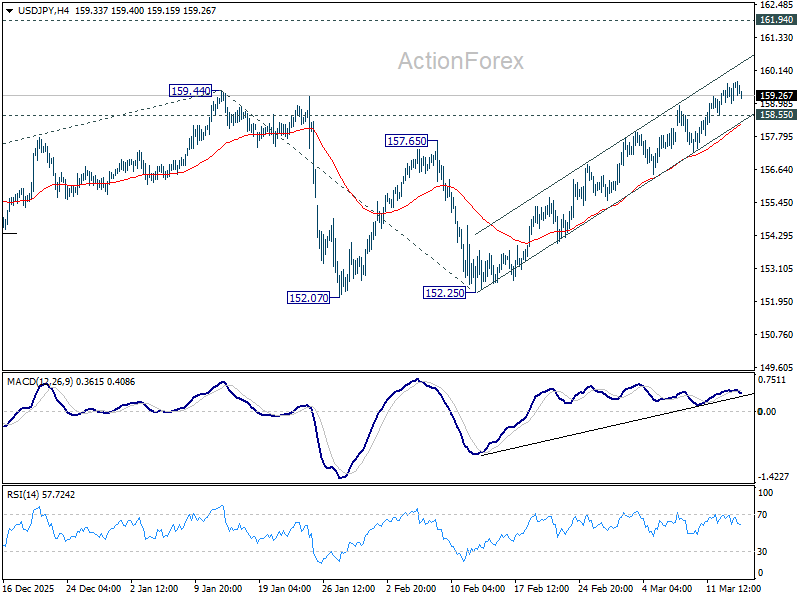
USD/JPY is losing some momentum but further rise is in favor as long as 158.55 minor support holds. Rally 152.25 would target a retest on 161.94 high. Firm break there will confirm larger up trend resumption and target 61.8% projection of 139.87 to 159.44 from 152.25 at 164.34. Nevertheless, break of 158.55 should indicate short term topping, and turn bias back to the downside for deeper pullback.
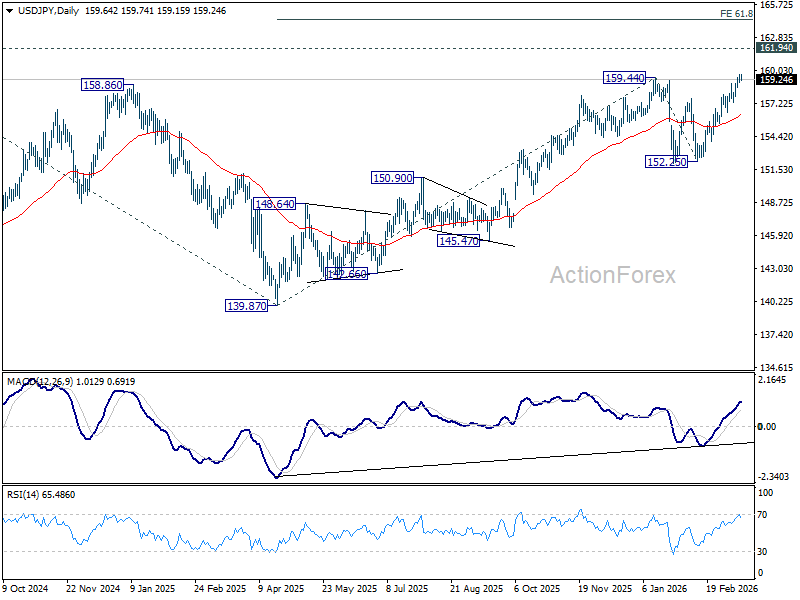
In the bigger picture, outlook is unchanged that corrective pattern from 161.94 (2024 high) should have completed with three waves at 139.87. Larger up trend from 102.58 (2021 low) could be ready to resume through 161.94. This will remain the favored case as long as 55 W EMA (now at 152.70) holds. Firm break of 161.94 will pave the way to 61.8% projection of 102.58 to 161.94 from 139.87 at 176.75.
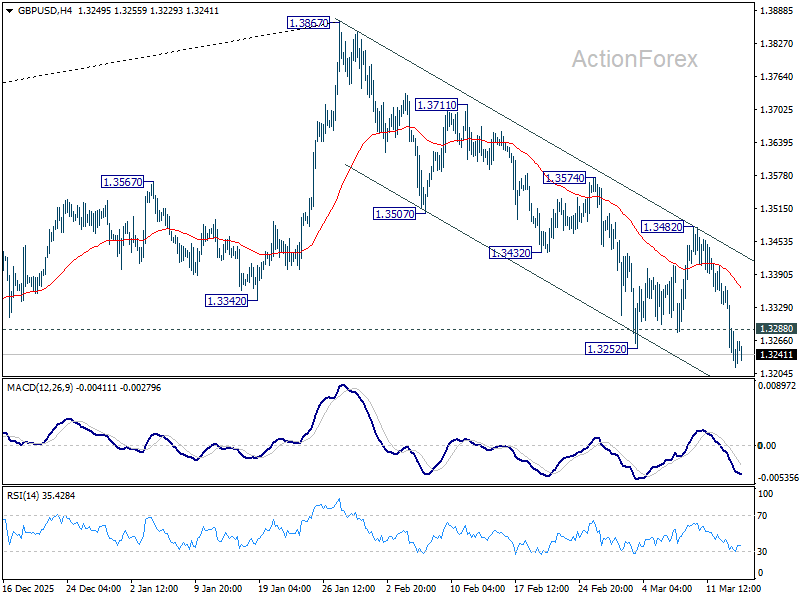
GBP/USD Daily Outlook
Daily Pivots: (S1) 1.3171; (P) 1.3271; (R1) 1.3323; More...
Intraday bias in GBP/USD remains on the downside as fall from 1.3867 is in progress for 1.3008 structural support. Firm break there will carry larger bearish implication and target 1.2524 fibonacci level. On the upside, above 1.3288 minor resistance will turn intraday bias neutral first. But risk will stay on the downside as long as 1.3482 resistance holds, in case of recovery.
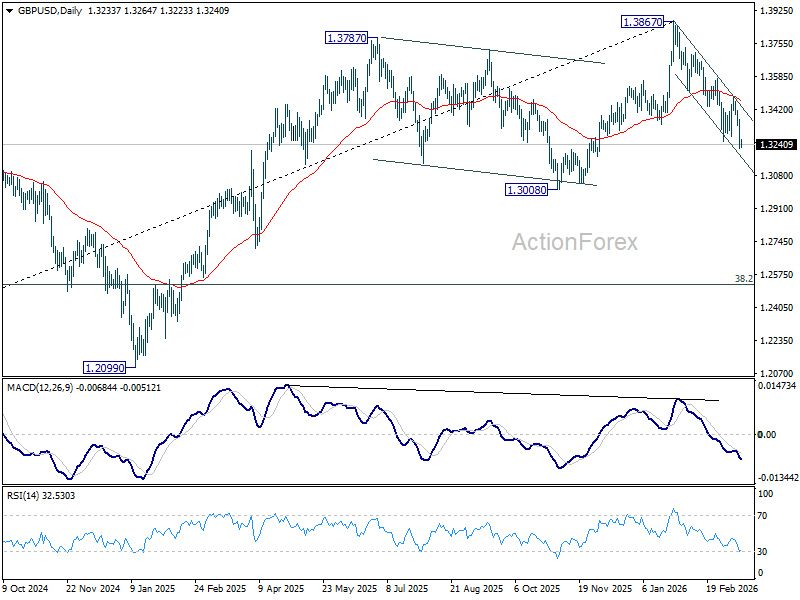
In the bigger picture, considering bearish divergence condition in both D and W MACD, a medium term top should be in place from 1.3867. Firm break of 1.3008 support will argue that fall from 1.3867 is at least correcting the rise from 1.0351 (2022 low) with risk of bearish reversal. That would open up further decline to 38.2% retracement of 1.0351 to 1.3867 at 1.2524. For now, medium term outlook will be neutral at best as long as 1.3867 resistance holds, or under further development.
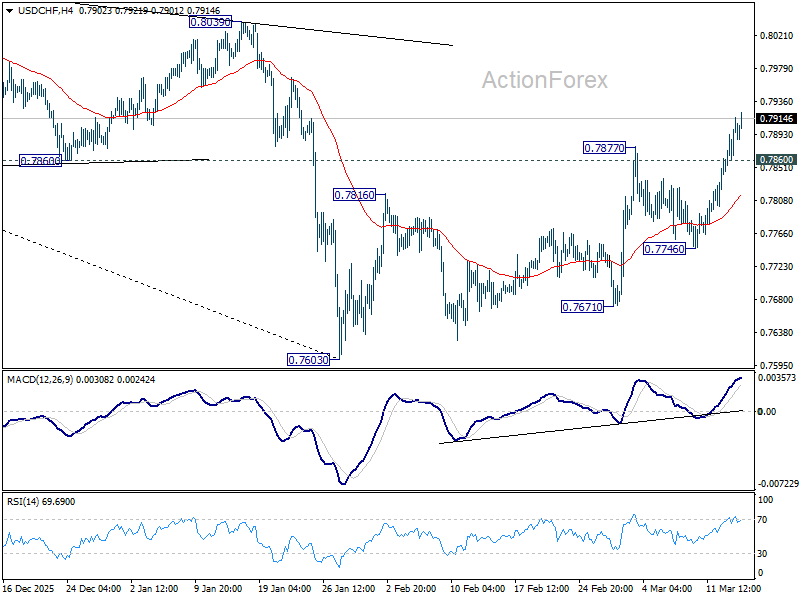
USD/CHF Daily Outlook
Daily Pivots: (S1) 0.7866; (P) 0.7893; (R1) 0.7939; More….
Intraday bias in USD/CHF remains on the upside for the moment. Rise from 0.7603 is seen as correcting whole down trend from 0.9200. Further rally would be seen to 38.2% retracement of 0.9200 to 0.7603 at 0.8213. On the downside, below 0.7860 minor support will turn intraday bias neutral first. But risk will stay on the upside as long as 0.7746 support holds, in case of retreat.
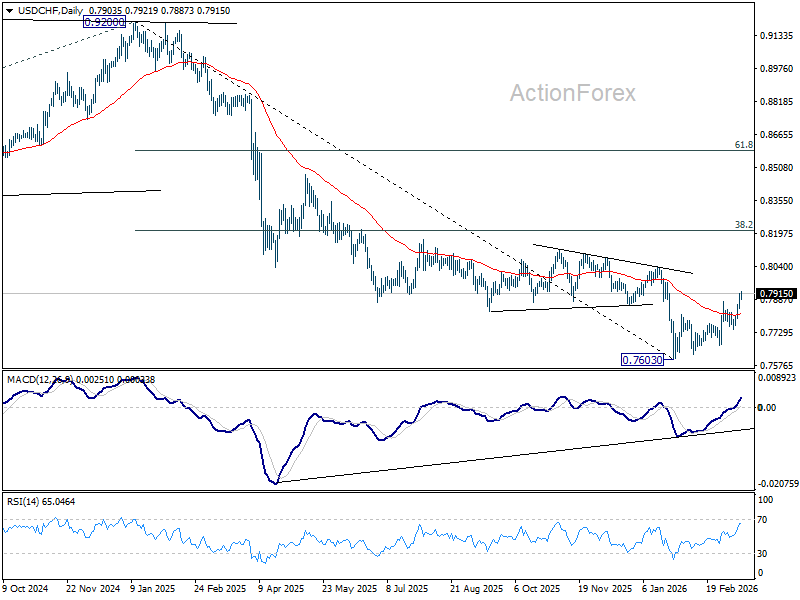
In the bigger picture, a medium term bottom should be in place at 0.7603 on bullish convergence condition in D MACD. Rebound from there is seen as correcting the fall from 0.9200 only. However, decisive break of 55 W EMA (now at 0.8100) will suggest that it's probably correcting the larger scale down trend from 1.0146 (2022 high). On the other hand, rejection by the 55 W EMA will setup down trend resumption to 100% projection of 1.0146 (2022 high) to 0.8332 from 0.9200 at 0.7382 at a later stage.
AUD/USD Daily Report
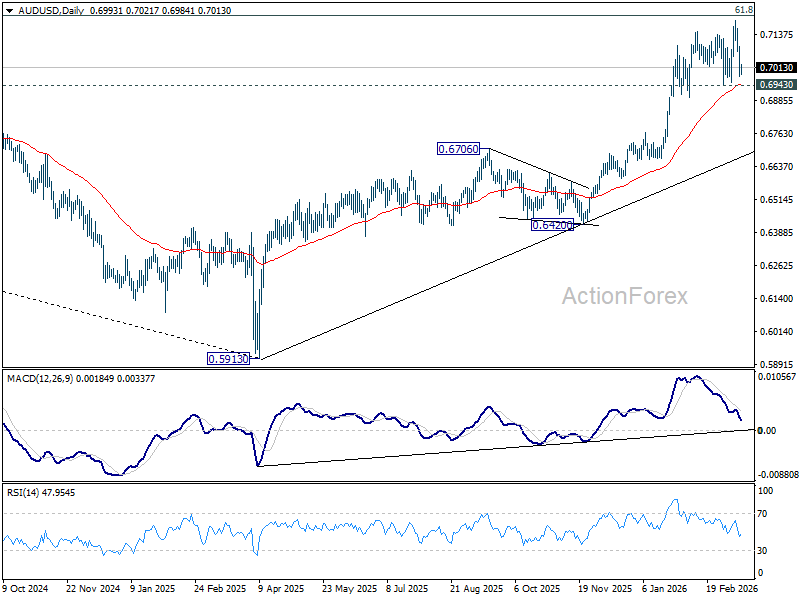
Daily Pivots: (S1) 0.6944; (P) 0.7018; (R1) 0.7057; More...
Intraday bias in AUD/USD stays neutral for the moment. With 0.6943 support intact, further rally is still expected. On the upside, firm break of 100% projection of 0.5913 to 0.6706 from 0.6420 at 0.7213 could prompt upside acceleration to 161.8% projection at 0.7703. However, firm break of 0.6943 will indicate that a larger scale correction is already underway.
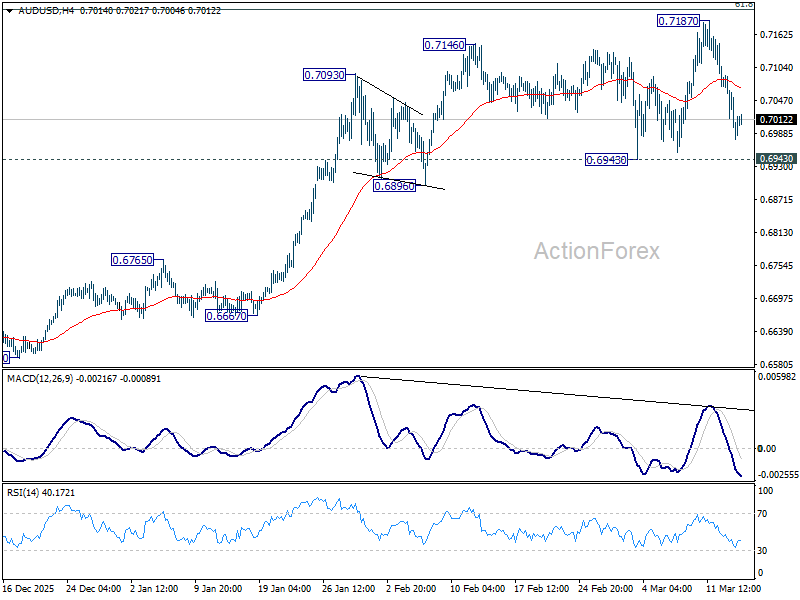
In the bigger picture, current development argues that rise from 0.5913 (2024 low) is reversing whole down trend from 0.8006 (2021 high). Decisive break of 61.8% retracement of 0.8006 to 0.5913 at 0.7206 will pave the way back to 0.8006. This will remain the favored case as long as 0.6706 resistance turned support holds, even in case of deep pullback.