
Sample Category Title
GBP/USD Mid-Day Outlook
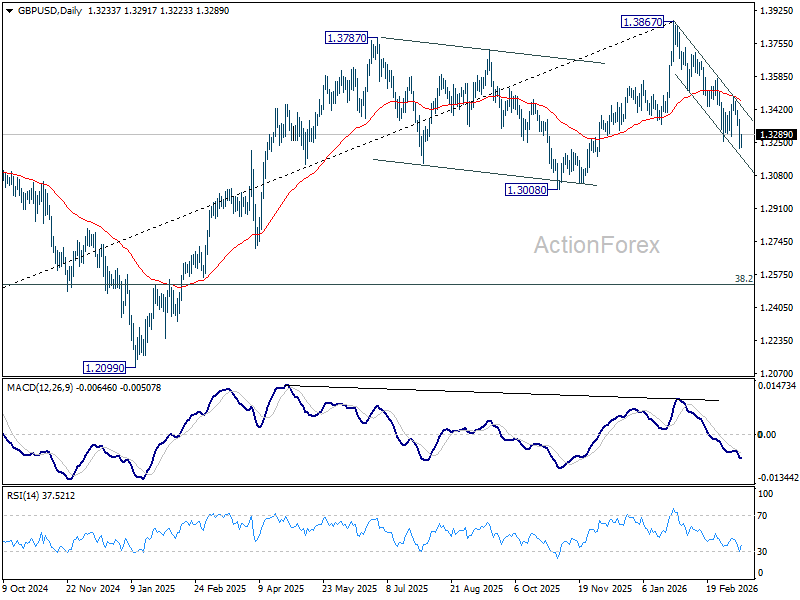
Daily Pivots: (S1) 1.3171; (P) 1.3271; (R1) 1.3323; More...
Intraday bias in GBP/USD is turned neutral with current recovery and some consolidations would be seen. But risk will stay on the downside as long as 1.3482 resistance holds. Below 1.3216 will resume the fall from 1.3867 to 1.3008 structural support. Firm break there will carry larger bearish implication and target 1.2524 fibonacci level.
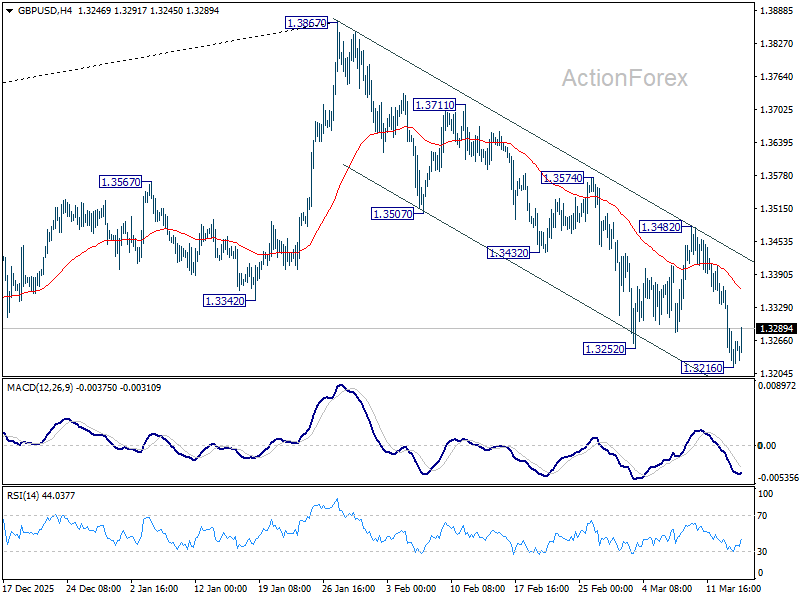
In the bigger picture, considering bearish divergence condition in both D and W MACD, a medium term top should be in place from 1.3867. Firm break of 1.3008 support will argue that fall from 1.3867 is at least correcting the rise from 1.0351 (2022 low) with risk of bearish reversal. That would open up further decline to 38.2% retracement of 1.0351 to 1.3867 at 1.2524. For now, medium term outlook will be neutral at best as long as 1.3867 resistance holds, or under further development.
USD/JPY Mid-Day Outlook
Daily Pivots: (S1) 159.23; (P) 159.49; (R1) 160.00; More...
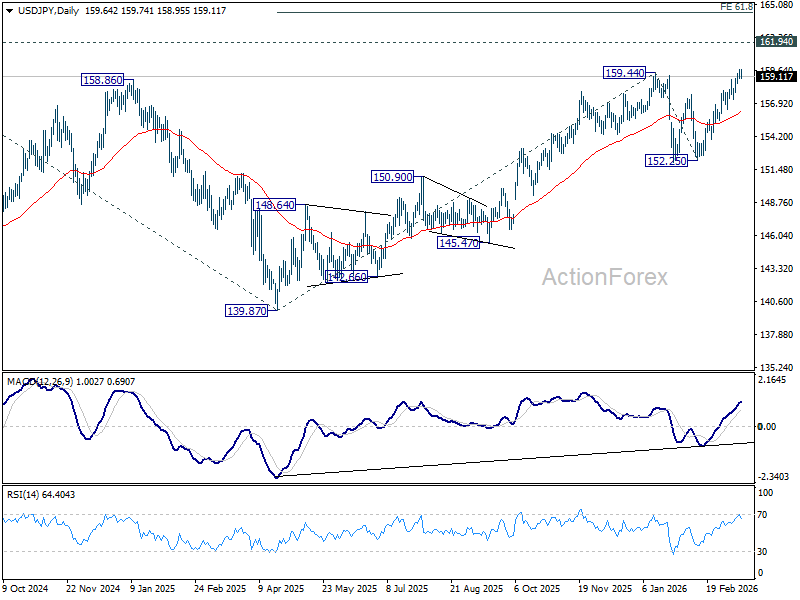
Intraday bias in USD/JPY is turned neutral with current retreat. On the upside, above 159.74 will target a retest of 161.94. Firm break there will confirm larger up trend resumption and target 61.8% projection of 139.87 to 159.44 from 152.25 at 164.34. However, considering bearish divergence condition in 4H MACD, break of 158.55 should indicate short term topping, and turn bias back to the downside for deeper pullback.
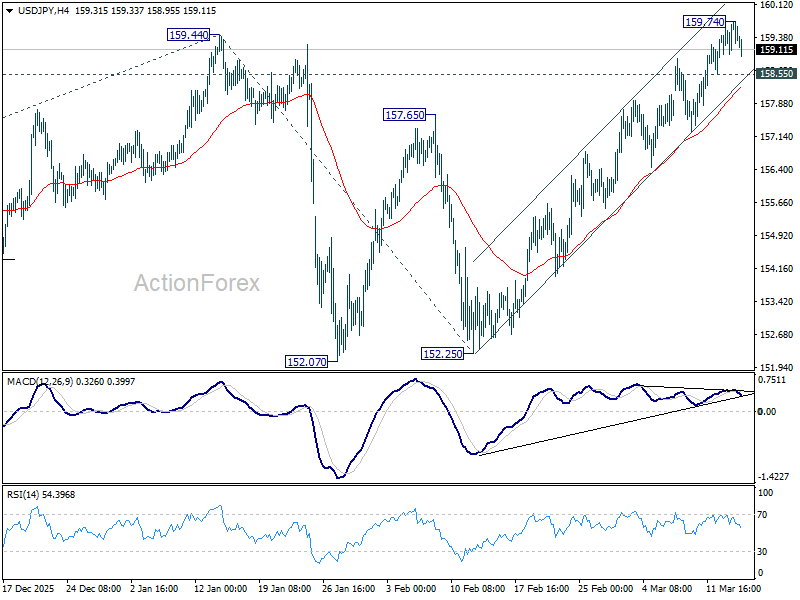
In the bigger picture, outlook is unchanged that corrective pattern from 161.94 (2024 high) should have completed with three waves at 139.87. Larger up trend from 102.58 (2021 low) could be ready to resume through 161.94. This will remain the favored case as long as 55 W EMA (now at 152.70) holds. Firm break of 161.94 will pave the way to 61.8% projection of 102.58 to 161.94 from 139.87 at 176.75.
Canada’s Inflation Pressures Cooled Further in February
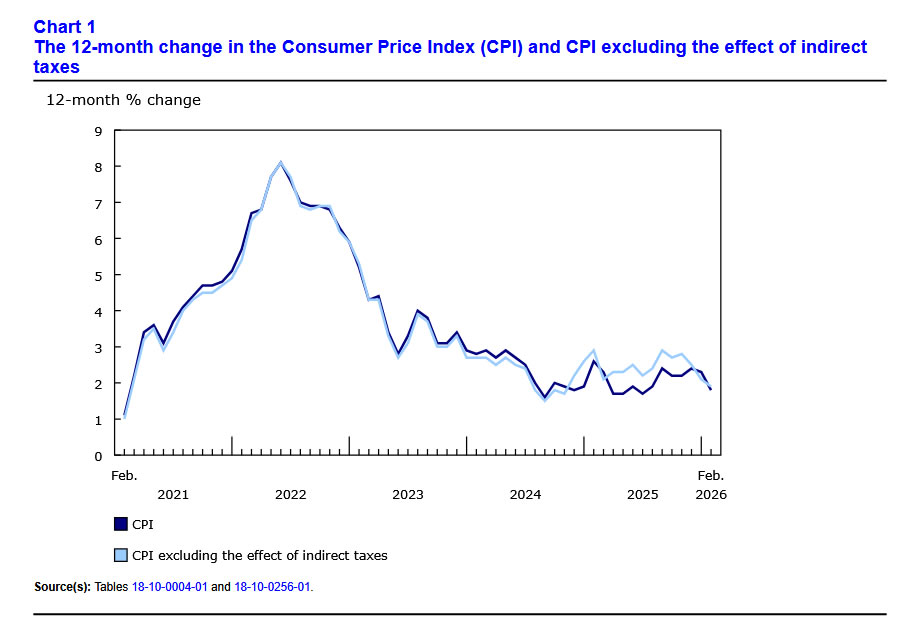
Headline CPI inflation cooled in February to 1.8% year-on-year (y/y) slightly below consensus expectations. The GST/HST break ended partway through February 2025, which lead to large price increases in that month, but puts downward pressure on the year-on-year price change in February 2026.
Energy prices were a source of downward pressure on inflation including gasoline (-14.2% y/y) and natural gas (-17.1% y/y).
There was good news on grocery prices, where inflation cooled to 4.1% y/y in February, down from 4.8% in January. Overall food inflation remained the highest of Statistics Canada's major categories, up 5.4% y/y.
Shelter inflation continued to cool (1.5% y/y). Inflation eased for rent (+3.9% y/y) and homeowners' replacement costs (-2.1%y/y) among other subcomponents.
Overall services inflation cooled to 2.7% y/y – the slowest pace since 2021. Another source of downward pressure on services inflation was cellular services, where prices were up only 1.5% y/y after being up 4.9% in January.
The Bank of Canada has focused on broader "underlying inflation" recently, but the official core inflation metrics (median and trim), both cooled further in February to 2.3% y/y. Zeroing in on trends over the past three months, trim and median inflation continued to run well below the Bank of Canada's 2% target.
Key Implications
Canada's inflation cooled in February, but that is backward looking now that prices at the pump have skyrocketed in the wake of the U.S./Israeli war with Iran. We expect higher energy costs will lift headline inflation close to 3% in the months ahead, but the effect on the Bank of Canada's core measures should be more modest. Core inflation is expected to stay reasonably close to the 2% target on a year-on-year basis this year.
The Bank of Canada's interest rate decision is coming up on Wednesday, and the Bank is universally expected to remain on pause. We will be listening closely for the Bank's assessment of the impact of the oil shock on Canada's economy.
USD/CHF Mid-Day Outlook
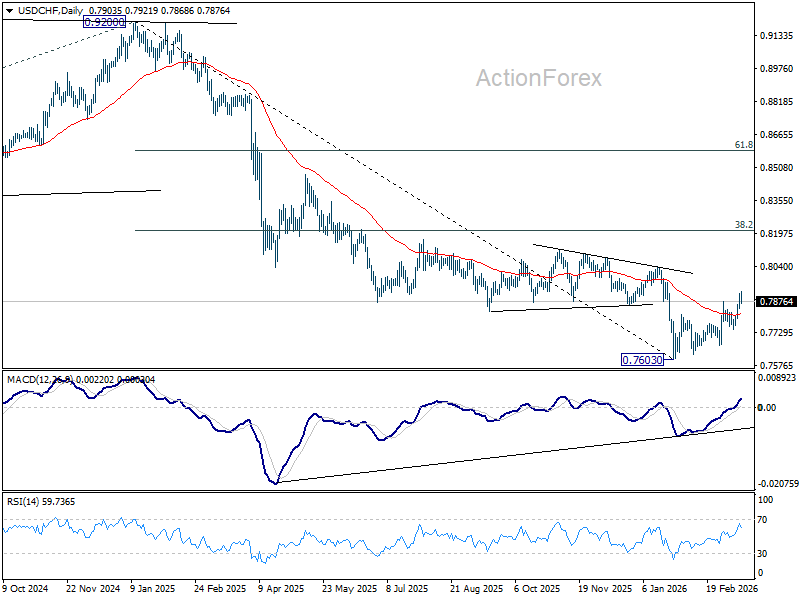
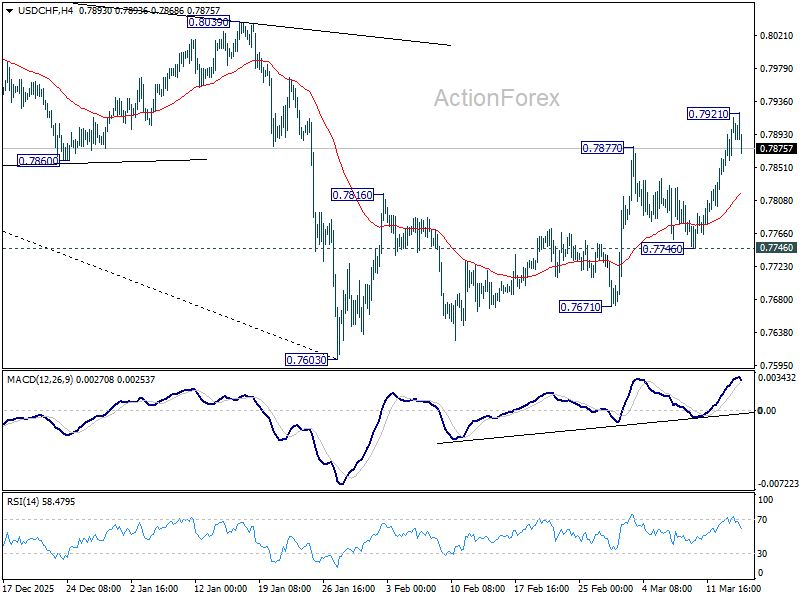
Daily Pivots: (S1) 0.7866; (P) 0.7893; (R1) 0.7939; More….
A temporary top is in place at 0.7921 in USD/CHF and intraday bias is turned neutral first. Some consolidations would be seen but further rally is in favor as long as 0.7746 support holds. Rise from 0.7603 is seen as correcting whole down trend from 0.9200. Break of 0.7921 will target 38.2% retracement of 0.9200 to 0.7603 at 0.8213.

In the bigger picture, a medium term bottom should be in place at 0.7603 on bullish convergence condition in D MACD. Rebound from there is seen as correcting the fall from 0.9200 only. However, decisive break of 55 W EMA (now at 0.8091) will suggest that it's probably correcting the larger scale down trend from 1.0146 (2022 high). On the other hand, rejection by the 55 W EMA will setup down trend resumption to 100% projection of 1.0146 (2022 high) to 0.8332 from 0.9200 at 0.7382 at a later stage.
Dollar Falls and Oil Slips Below $100 as Hormuz Remains Navigable
Oil slipped back below $100 today as signs emerged that the Strait of Hormuz remains navigable, easing fears of a full disruption to global energy supply. Dollar weakened broadly as traders scaled back the most extreme oil shock scenarios tied to the US-Israel conflict with Iran. Overall market sentiment also improved with major European indexes trading mildly higher, along with US futures.
Comments from US Treasury Secretary Scott Bessent helped trigger the shift in sentiment. Speaking to CNBC, Bessent said Iranian ships had already been leaving the Strait of Hormuz. He suggested the movement reflects a decision to allow oil flows to continue, stating that “we’ve let that happen to supply the rest of the world.”
For markets, the key takeaway is that Iran has not mined the Strait. A mined waterway would make the passage impassable for all vessels and would take significant time to clear, potentially causing a prolonged global energy crisis. The continued movement of tankers therefore signals that the worst-case scenario has not materialized.
Iranian Foreign Minister Abbas Araghchi also confirmed that the Strait remains open from Tehran’s perspective. Speaking at a press conference, he said the route is only closed to vessels belonging to the US, Israel and their allies, while other shipping traffic can still pass.
At the same time, governments are preparing to release strategic oil reserves to stabilize markets. The International Energy Agency said a coordinated release among its 32 member countries will soon begin in response to the supply concerns triggered by the conflict.
Japan has already started to release reserves, including 15 days of private-sector stocks and 30 days of government-held supplies. The US plans to contribute 172.2 million barrels, with oil expected to reach markets toward the end of March. European contributions are scheduled to follow the same timeline.
These additional supplies should act as a temporary bridge for global markets, limiting the immediate upside risk to crude prices while policymakers monitor developments in the Middle East.
In currency markets, Dollar is currently the weakest major currency on the day, followed by Loonie and Yen. Kiwi leads gains, with Aussie and Euro also strengthening, while Sterling and Swiss Franc are near the middle of the performance rankings.
In Europe, at the time of writing, FTSE is up 0.66%. DAX is up 0.63%. CAC is up 0.29%. UK 10-year yield is down -0.078 at 4.693. Germany 10-year yield is down -0.035 at 2.950. Earlier in Asia, Nikkei fell -0.13%. Hong Kong HSI rose 1.45%. China Shanghai SSE fell -0.26%. Singapore Strait Times rose 0.55%. Japan 10-year JGB Yield rose 0.035 to 2.280.
Canada CPI slows to 1.8% in February, inflation pressure eases before oil shock
Canada’s inflation slowed more than expected in February, with headline CPI easing to 1.8% yoy while core measures including CPI median, trimmed and common all softened. The slowdown was driven partly by declines in energy prices such as gasoline and natural gas, suggesting underlying price pressures are gradually moderating.
China industrial production, retail sales, investment beat expectations in Jan–Feb
China’s economic activity showed a stronger-than-expected start to 2026, with industrial production, retail sales and fixed-asset investment all beating forecasts. However, the property sector remains a key drag on the broader recovery.
New Zealand BNZ services falls back Into contraction, weak demand hits
New Zealand’s services sector slipped back into contraction in February, with the BusinessNZ Performance of Services Index dropping to 48.0. Weak demand, high living costs and elevated interest rates continue to weigh on activity.
USD/CHF Mid-Day Outlook
Daily Pivots: (S1) 0.7866; (P) 0.7893; (R1) 0.7939; More….
A temporary top is in place at 0.7921 in USD/CHF and intraday bias is turned neutral first. Some consolidations would be seen but further rally is in favor as long as 0.7746 support holds. Rise from 0.7603 is seen as correcting whole down trend from 0.9200. Break of 0.7921 will target 38.2% retracement of 0.9200 to 0.7603 at 0.8213.
In the bigger picture, a medium term bottom should be in place at 0.7603 on bullish convergence condition in D MACD. Rebound from there is seen as correcting the fall from 0.9200 only. However, decisive break of 55 W EMA (now at 0.8091) will suggest that it's probably correcting the larger scale down trend from 1.0146 (2022 high). On the other hand, rejection by the 55 W EMA will setup down trend resumption to 100% projection of 1.0146 (2022 high) to 0.8332 from 0.9200 at 0.7382 at a later stage.

Canada CPI slows to 1.8% in February, inflation pressure eases before oil shock
Canada’s inflation slowed more than expected in February, with headline CPI easing from 2.3% yoy to 1.8% yoy, below market expectations of 1.9%. On a monthly basis, prices rose 0.5% mom, also slightly below forecasts of 0.6%, suggesting price pressures continued to moderate.
The slowdown was driven by declines across several components. Energy prices as a key drag, with gasoline falling -14.2% yoy and natural gas down -17.1% yoy. Other categories that exerted downward pressure included homeowners’ replacement cost (-2.1%), other owned accommodation expenses (-2.6%), and travel tours (-3.1%).
Core inflation measures also softened. CPI median and CPI trimmed both eased to 2.3% yoy, while CPI common slowed from 2.7% yoy to 2.4% yoy, all coming in below expectations. The broad-based cooling in underlying inflation suggests price pressures were easing gradually before the oil shock.
Bitcoin: See No Evil
Market Overview
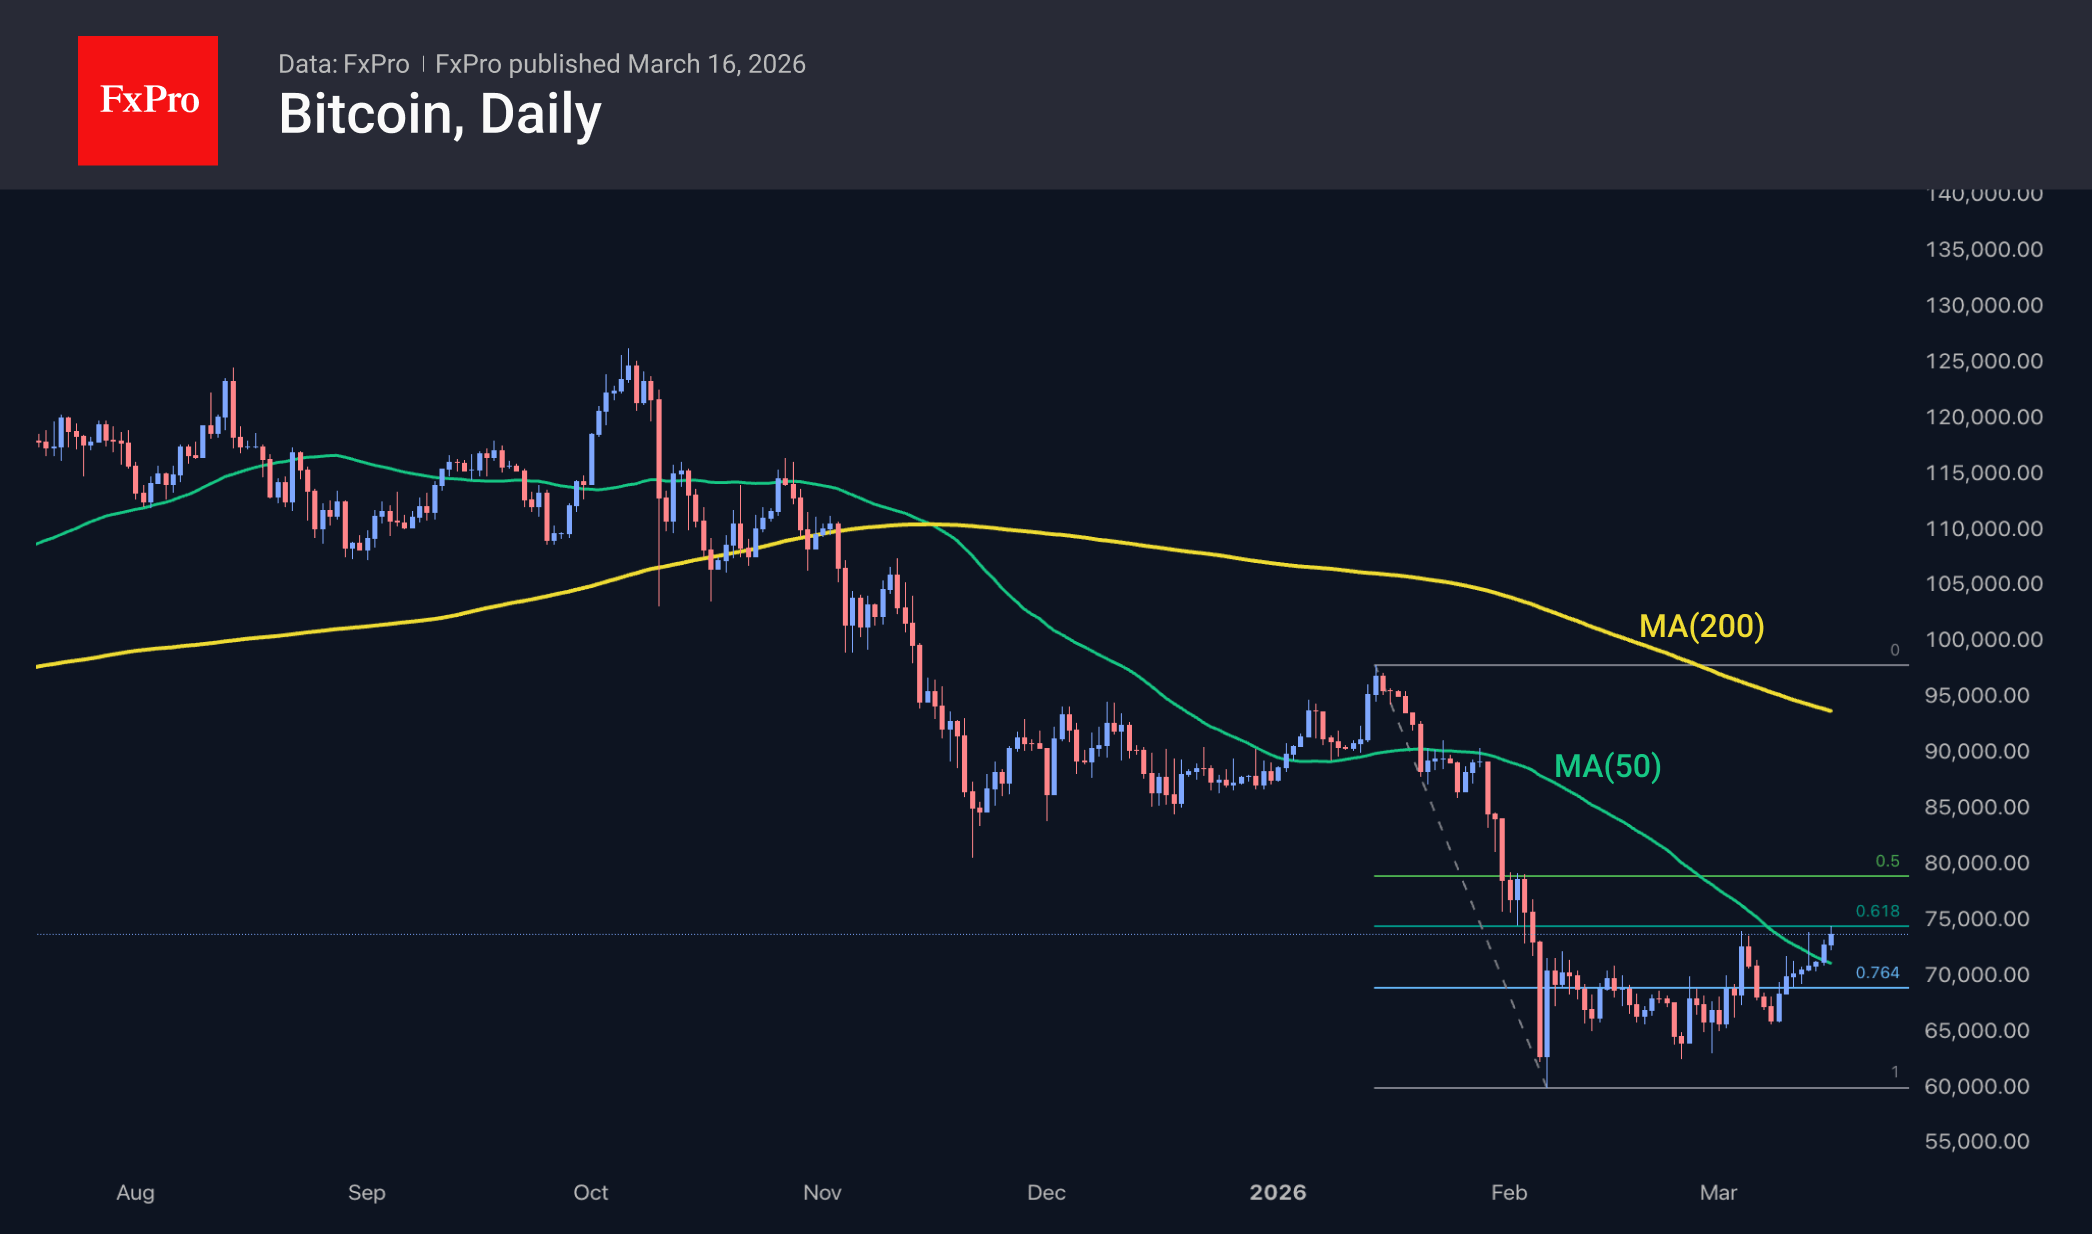
The crypto market cap is on an upward trend, having surpassed the $2.5 trillion mark, the region of previous local highs and the 50-day moving average. Consequently, the technical picture is becoming more favourable for the bulls, who are steadily reclaiming one high after another.
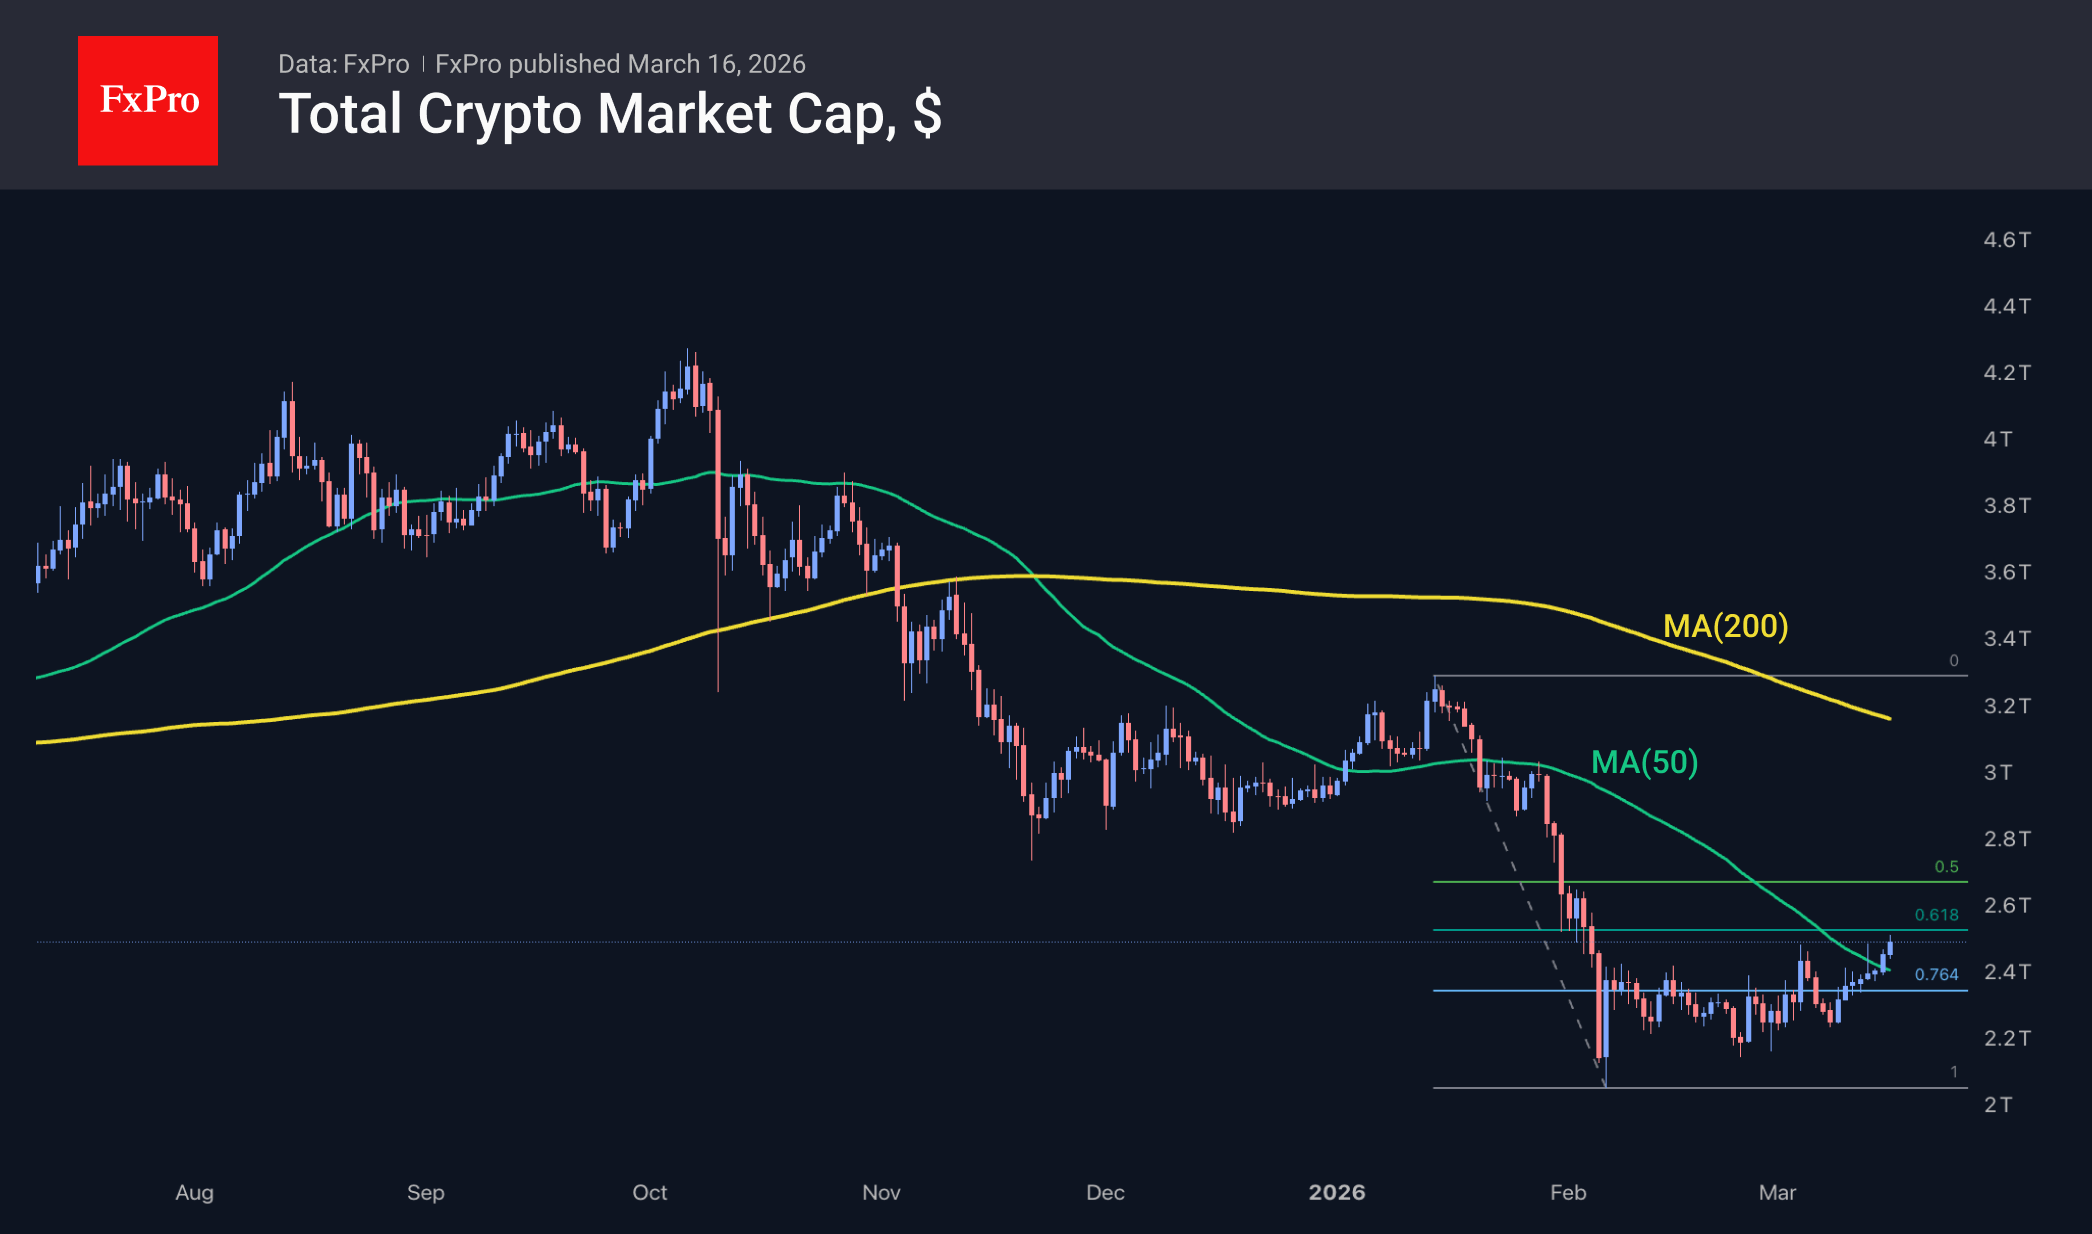
This gradual growth appears to be a further sign of the recovery’s robustness. At current levels, the crypto market cap is approaching the 61.8% retracement of the latest downtrend, and all eyes are on whether the recovery momentum will fade. The consolidation may simply become broader but lack the strength to turn into an uptrend.
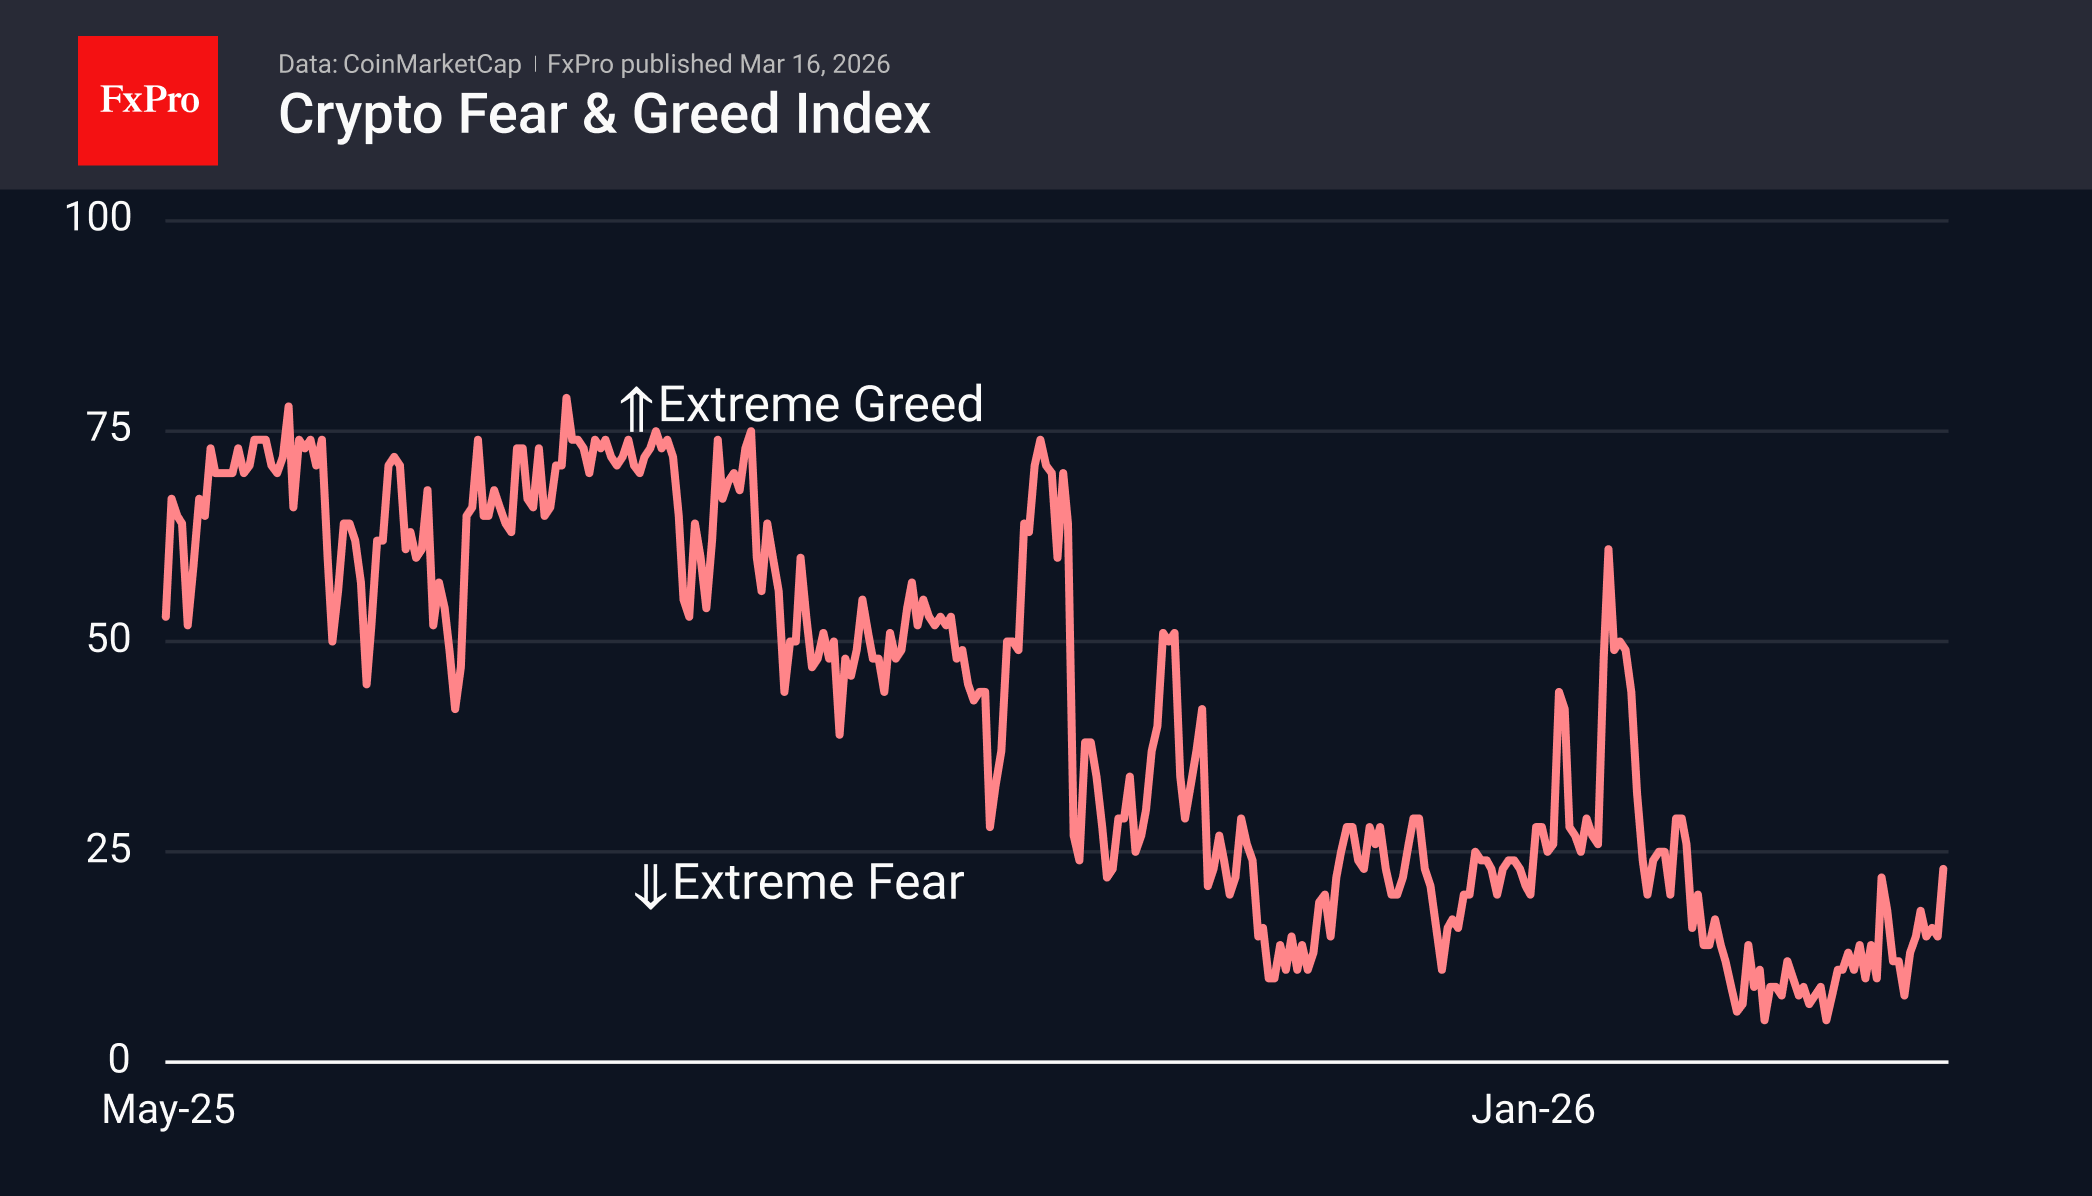
The sentiment index stands at 23, on the verge of exiting the extreme fear zone and at its highest level since 29 January. This could be a new trap, just as it was in the second half of January, when the index’s recovery was followed by a fresh wave of selling and new lows.
Bitcoin is looking on the bright side, approaching the $74K level and already hitting seven-week highs. The leading cryptocurrency closed Sunday above the 50-day moving average and began Monday with a further upward move. This could well prove to be a prelude to a rise towards $85K – the region of recent significant lows. However, it is quite possible that near the $75K mark, the bears will take control, leaving BTC within a corrective rebound pattern following a decline. From a cross-market analysis perspective, the bears have more arguments on their side, but Bitcoin has often moved ahead of the market, reflecting its underlying shifts in sentiment.
News Background
Bitcoin has passed the ‘stress test’ of geopolitical tensions in the Middle East. However, on-chain metrics indicate a lack of strength among the bulls for a medium-term breakout, according to Glassnode.
Ethereum risks continuing its decline due to the ‘adoption paradox’ — the widening gap between network activity and the asset’s price dynamics, CryptoQuant notes. An exit from the bearish phase should be facilitated by capital inflows into the ecosystem and a reduction in cryptocurrency inflows to exchanges.
BlackRock has launched an Ethereum ETF with staking. At launch, assets under management reached $100 million. Around 82% of the staking rewards received will be paid out to investors on a monthly basis — like dividend-paying ETFs.
According to Mizuho Bank, Circle’s USDC stablecoin has overtaken Tether’s USDT in terms of adjusted transaction volume since the start of 2026. The total stablecoin market has recovered to $311 billion amid an influx of retail capital.
Stablecoins could form the basis of a global payment system within the next 10–15 years, billionaire Stanley Druckenmiller has stated. According to him, such assets offer clear advantages over traditional banking infrastructure.
Gold Continues to Decline Amid Fed Expectations
Gold prices fell to 5,023 USD per ounce on Monday, extending losses after two consecutive weeks of decline. Pressure on the market persists amid rising oil prices, with the situation becoming more problematic following a US strike on Iran's Kharg Island oil terminal – one of the country's key export hubs.
The attack prompted retaliation from Tehran, with Iran striking Israel and energy infrastructure in several Arab nations. These developments have intensified concerns about global supply stability.
The military confrontation between the US, Israel, and Iran has entered its third week with no signs of resolution. Volatility across financial markets remains elevated.
Rising energy prices are increasing inflation risks and reducing the likelihood of imminent monetary policy easing. Against this backdrop, gold faces pressure, as higher interest rates diminish the appeal of non-yielding assets.
The Federal Reserve is expected to maintain its interest rate this week. Monetary policy decisions are also anticipated from numerous other central banks, including those in the Eurozone, the UK, Japan, Switzerland, Australia, Canada, China, Brazil, and Russia.
Technical Analysis
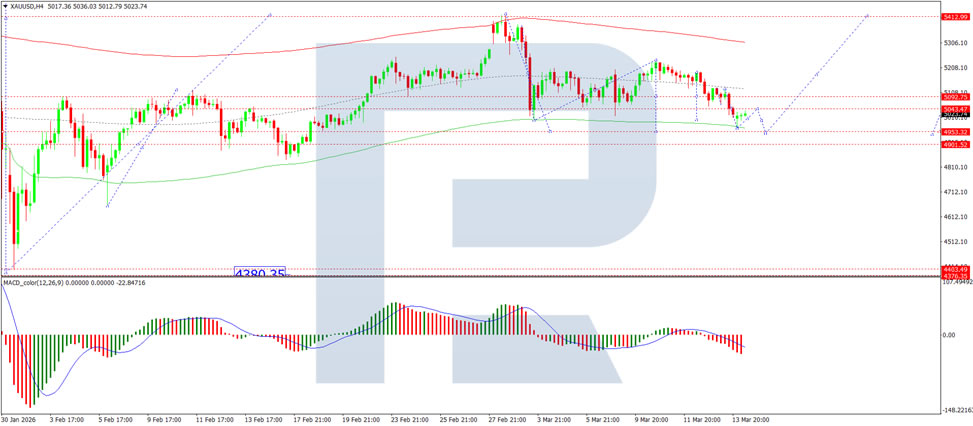
On the H4 XAU/USD chart, the market formed a consolidation range around the 5,092 USD level. It has now broken downwards, likely continuing the correction towards 4,953 USD. The MACD indicator confirms the current momentum, with its signal line below the centre line and pointing sharply downwards.
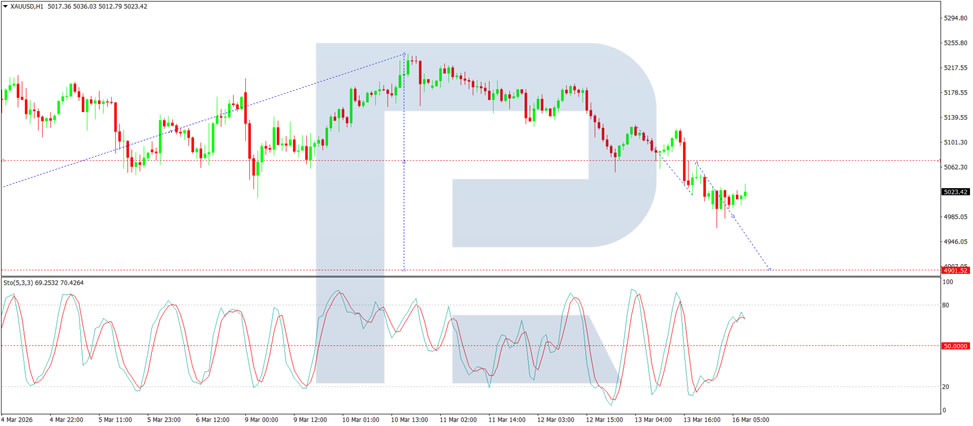
On the H1 chart, the market has broken below the 5,035 USD level and is forming a wave towards 4,953 USD. Looking ahead, a corrective growth wave towards 5,200 USD is possible, with potential for the trend to extend to 5,412 USD. The Stochastic oscillator supports the short-term bearish scenario, with its signal line remaining above the 50 level and under pressure to decline towards level 20.
Conclusion
Gold continues to face headwinds as escalating geopolitical tensions in the Middle East drive oil prices higher, reinforcing inflation concerns and delaying expectations for Fed rate cuts. The third week of military confrontation shows no signs of abating, keeping markets on edge. With the Federal Reserve widely expected to hold rates steady this week, and technical indicators pointing to further downside, gold's immediate trajectory appears vulnerable. A break below key support could accelerate losses towards 4,953 USD, though dovish surprises from central bank meetings this week might offer temporary relief.
Chart Alert: WTI Crude Oil Rally Almost Reached $102.25, Risk of Minor Setback Towards $88.36
Key takeaways
- Oil rebound driven by ongoing conflict risks: West Texas Intermediate crude oil has rebounded 32% to around $101 after a sharp prior correction, as the US–Iran war 2026, now in its 17th day, continues to fuel concerns over supply disruptions around the Strait of Hormuz.
- Medium-term bullish bias remains intact: Prediction market data from Polymarket suggests the highest probability of a ceasefire only by June, implying geopolitical risk premiums may persist and support oil’s broader uptrend in the coming months.
- Short-term pullback risk near resistance: Technically, WTI is approaching $105.85 key resistance, where momentum appears to be fading. Failure to break higher could trigger a minor corrective pullback toward $92.60–$88.36, while a breakout above $105.85 would reopen upside toward $116–$119.
The price actions of the West Texas (WTI) crude oil have staged an expected bullish reversal after the two-day decline of around 35% from its four-year high printed on last Monday, 9 March 2026, to the 11 March 2026 low.
So far, it has gained by 32% to hit an intraday high of $101.19/barrel in today’s Asia session, 16 March 2026, as the US-Iran war enters the 17th day.
Before we dive into the technical analysis and relevant macro elements of WTI crude oil, here are the latest headlines surrounding the US-Iran conflict in the last 24 hours.
- The key port of Fujairah in the United Arab Emirates was hit again on Monday, the latest in a series of strikes on the site that’s the only outlet for the country that bypasses the Strait of Hormuz.
- Dubai resumes flights after a temporary suspension due to a drone incident.
- US President Donald Trump is “demanding” that other countries help secure transit through the Strait of Hormuz; Australia and Japan said they don’t have plans to send warships to the region now.
- Trump again claimed the US and Iran are in talks and said any deal must include Tehran’s nuclear program. Iran has said it hasn’t asked for negotiations or a ceasefire.
Prediction market’s highest probability of a ceasefire is in June
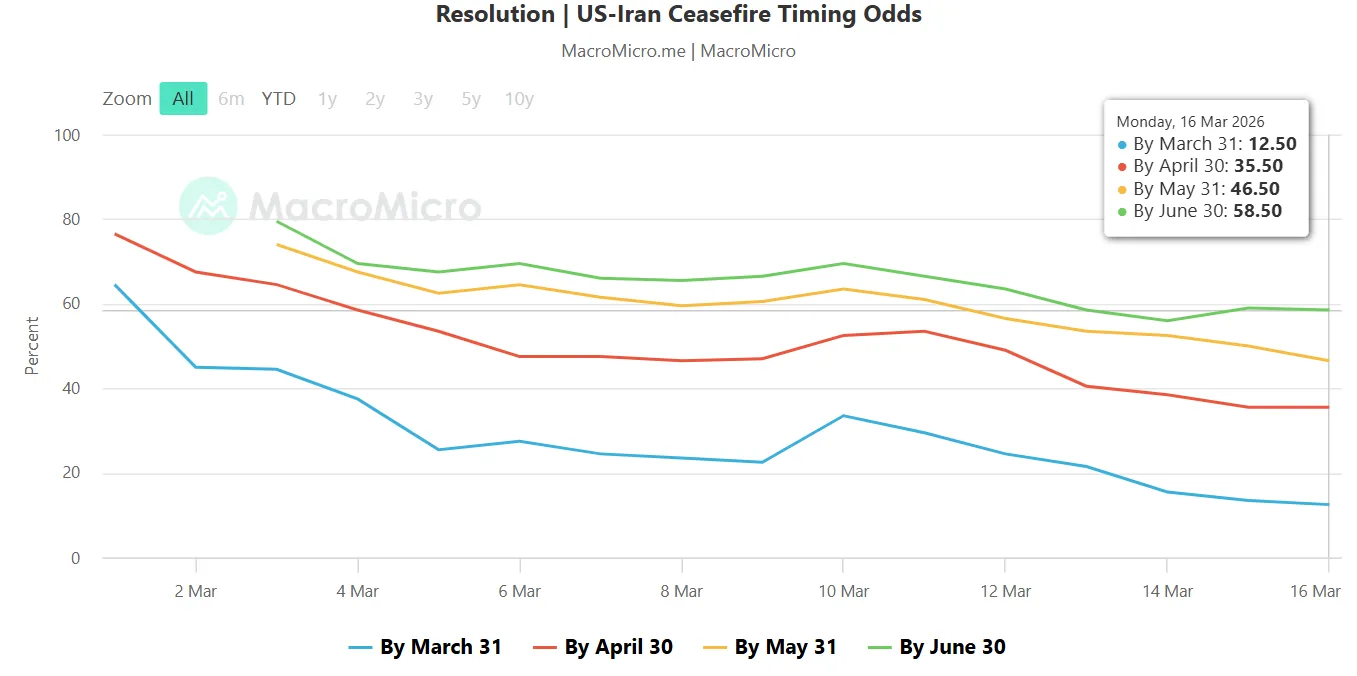
Fig. 1: Polymarket US-Iran ceasefire timing odds as of 16 Mar 2026 (Source: MacroMicro)
Data from the prediction market platform, Polymarket, where participants trade contracts based on the probability of future events.
The above chart reflects the market-implied probability of an official ceasefire agreement between the US and Iran on various specific dates.
Based on data as of Monday, 16 March 2026, at the time of writing, the lowest odds of 12.5% is being priced by 31 March, with the highest odds of 58.5% by 30 June (see Fig. 1).
Hence, in the next two months, WTI crude oil is likely to maintain its medium-term uptrend phase in place from the 16 December 2025 low.
Let's now focus on the potential short-term trajectory (1 to 3 days) of WTI crude oil.
WTI Crude Oil – Near-term bullish momentum has eased
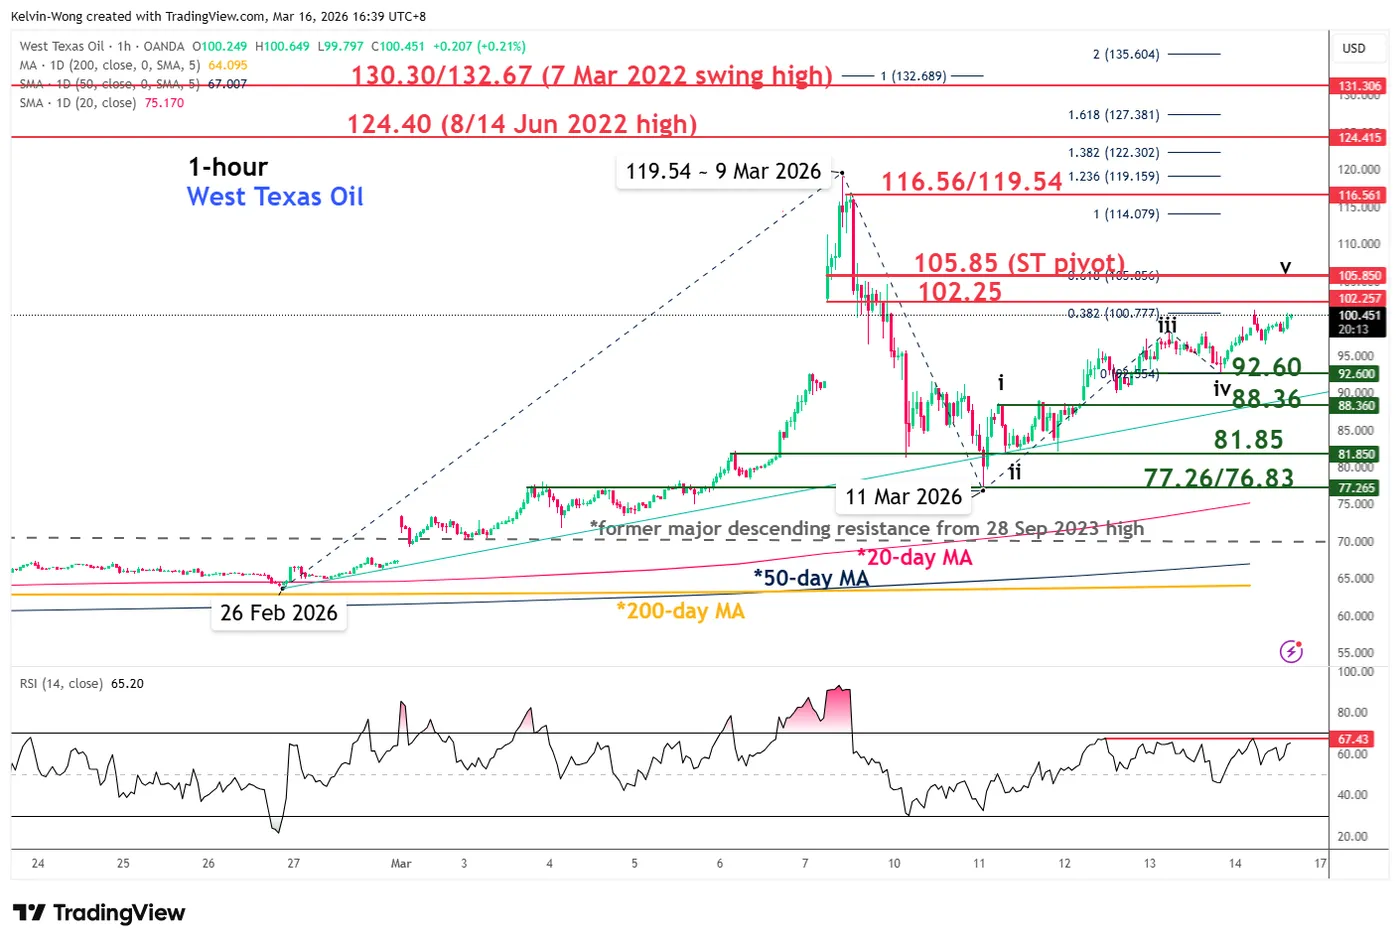
Fig. 2: West Texas Oil CFD minor trend as of 16 Mar 2026 (Source: TradingView)
At risk of a minor corrective pull-back to retrace a certain portion of the minor uptrend phase from the 11 March 2026 low for the West Texas Oil CFD index (a proxy of the WTI crude oil futures).
Watch the $105.85 key short-term pivotal resistance for a potential push down towards the next intermediate supports at $92.60 and $88.36 (also the minor ascending trendline support from 26 February 2026 low) (see Fig. 2).
On the other hand, a clearance and hourly closing above $105.85 invalidates the near-term bearish scenario for a squeeze up to retest $116.56/119.54 before targeting the next resistance at 124.40.
Key elements to support the near-term bearish bias on WTI crude
- The hourly RSI momentum indicator has found resistance at around the 67 level, which indicates a potential easing of short-term bullish momentum.
- Based on the Elliot Wave/fractal analysis, the short-term price structure of the West Texas Oil CFD index has traced out a potential five-wave minor uptrend impulsive up move cycle labelled as i, ii, iii, iv, v.
- The current price action is likely considered as the bullish impulsive wave v movement with its potential terminal level at $105.85 (0.618 Fibonacci extension) to complete the minor five-wave uptrend impulsive up move cycle.
Gold Price Falls to a Monthly Low
As the XAU/USD chart shows, gold prices today dropped below the 3 March low, reaching levels last seen in the third week of February.
Why Is Gold Declining Despite the War?
Geopolitical turmoil typically supports demand for gold as a safe-haven asset. However, in the current environment — with the Middle East conflict now lasting more than two weeks — the surge in oil prices and the associated inflation risks have moved to the forefront.
Market participants appear to believe that the Federal Reserve will keep interest rates higher for longer. This increases the attractiveness of US dollar-denominated instruments, particularly US Treasuries and money market assets. Rising yields on US government bonds confirm this shift in expectations and simultaneously weigh on gold, which does not generate interest income.
Technical Analysis of XAU/USD
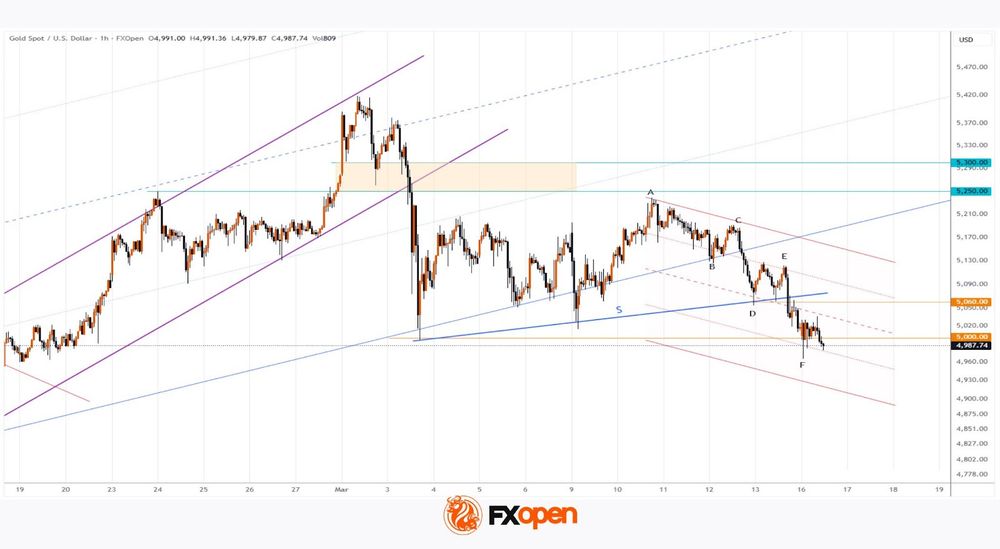
On the morning of 10 March, while analysing gold price movements, we confirmed that the long-term ascending channel remains in effect and also:
- → suggested that its lower boundary could provide support for gold prices;
- → noted that an important test of bullish momentum could come at the breakout level of the purple channel, near $5250.
As indicated by the arrow, the XAU/USD chart showed a continuation of the bullish impulse later that same day. However, the move lost momentum around $5235, forming peak A, after which a sequence of lower highs and lower lows (A–B–C–D–E) developed.
At the same time:
- → the lower boundary of the long-term rising channel was broken following a weak rebound from B to C;
- → a descending channel (shown in red) has now become relevant;
- → the $5060 level may act as an important resistance area, where sellers were strong enough to break the local support S and push gold prices into the lower half of the red channel.
If bears continue to maintain control, the price of an ounce could decline towards the lower boundary of the red channel.
Start trading commodity CFDs with tight spreads (additional fees may apply). Open your trading account now or learn more about trading commodity CFDs with FXOpen.
This article represents the opinion of the Companies operating under the FXOpen brand only. It is not to be construed as an offer, solicitation, or recommendation with respect to products and services provided by the Companies operating under the FXOpen brand, nor is it to be considered financial advice.