
Sample Category Title
China industrial production, retail sales, investment beat expectations in Jan–Feb
China’s economic activity showed a stronger-than-expected start to 2026, with key indicators rebounding in the January–February period. Industrial production rose 6.3% yoy, well above market expectations of 5.1%. Retail sales increased 2.8% yoy, also beating forecasts of 2.5%.
Investment also surprised to the upside. Fixed-asset investment rose 1.8% yoy, sharply outperforming expectations for a -2.1% decline. The improvement was largely driven by stronger spending in infrastructure and manufacturing. Excluding property development, investment increased 5.2% from a year earlier.
However, the property sector remained a major drag on the economy. Real estate development investment fell -11.1% in the first two months of the year, although the decline moderated from the -17.2% drop recorded in 2025.
China’s National Bureau of Statistics said the economy had made a “good start” to the year, but cautioned that external uncertainties, rising geopolitical risks and structural challenges continue to pose difficulties for businesses and the broader economic transition.
Gold breaks 5,000 as “Safe Haven Paradox” returns, 4,815 now key
Gold slipped back below 5,000 psychological level in Asian trading today, and the decline reveals an unusual dynamic dominating markets in 2026: escalating war is failing to lift Gold. Despite intensifying conflict involving the U.S., Israel and Iran in the Middle East, investors are increasingly abandoning the metal in favor of the Dollar, creating what could be described as a “Safe Haven Paradox.”
The reason lies in the energy shock rippling through global markets. Brent crude remains anchored near the 100 level as instability threatens supply routes across the Middle East. As a result, the dominant market concern has shifted away from geopolitical risk itself and toward the inflation consequences of surging energy prices.
Rising energy costs risk keeping inflation sticky, forcing investors to rethink the outlook for monetary policy. Markets are rapidly pricing out Fed rate cuts for 2026, while speculation is growing that other major central banks may also need to keep policy tighter.
That shift has pushed Treasury yields higher and strengthened Dollar broadly. For Gold, the environment is hostile. As a non-yielding asset, the metal becomes less attractive when interest rates rise, while Dollar benefits simultaneously from higher yields and its status as the world’s deepest liquidity haven.
Technically, last week’s recovery to 5,238.55 was somewhat stronger than expected. Nevertheless, the broader structure of Gold’s correction remains intact. The decline from 5,419.02 is viewed as the third leg of the corrective pattern following the 5,598.38 peak.
The break below 4996.03 support today signals that this decline has resumed. The next target at 100% projection of 5,419.02 to 4,996.03 from 5,238.55 at 4,815.55. This level is the key near-term focus for traders. Firm break there would prompt downward acceleration to 161.8% projection at 4,554.13.
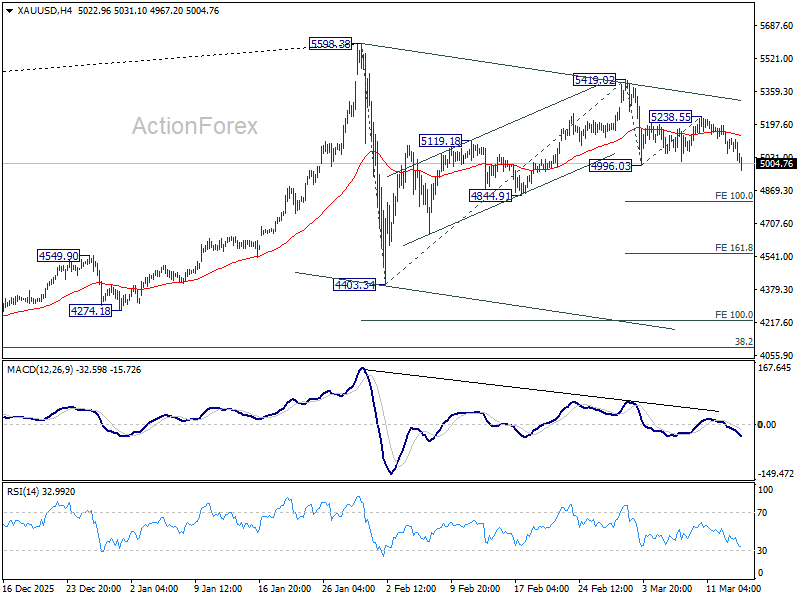
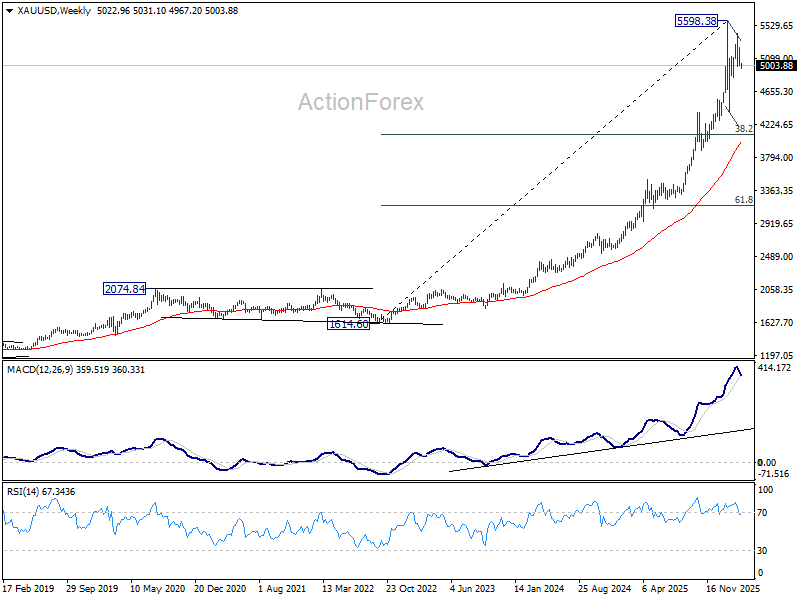
Looking further ahead, Gold is seen as correcting the broader uptrend that began from 2022 low at 1614.60. Deeper fall is likely to 4,000 region, which is slightly below 38.2% retracement of 1,614.60 to 5,598.38 at 4,076.57, or a bit lower to 55 W EMA (now at 4,005.22)
Though, that zone is likely to attract longer-term buyers and may eventually serve as the foundation for the next bullish cycle in the precious metal.
New Zealand BNZ services falls back Into contraction, weak demand hits
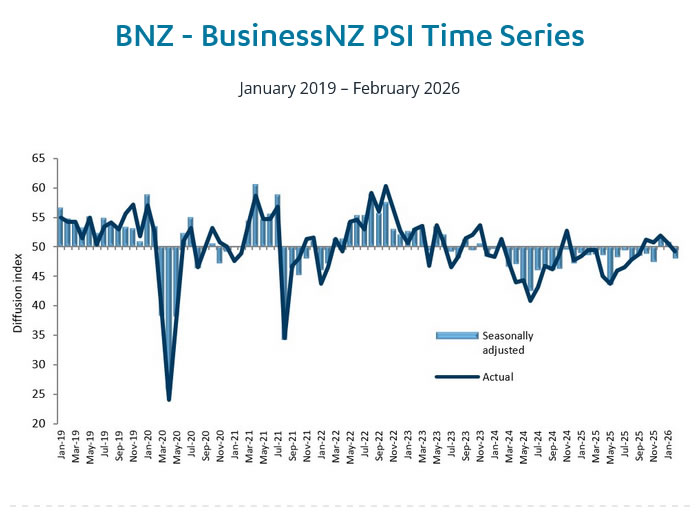
New Zealand’s services sector slipped back into contraction in February. BusinessNZ Performance of Services Index fell from 50.7 to 48.0, well below the survey’s long-term average of 52.8. The sector’s return to expansion proved short-lived, lasting only two months before momentum faded again.
The decline was broad-based across key components. Activity and sales dropped from 53.8 to 47.9, while employment fell from 49.0 to 47.2. New orders and business also weakened, slipping from 51.6 to 49.3, suggesting demand conditions remain soft despite signs of stabilization in parts of the manufacturing sector.
Negative sentiment remained elevated. Around 56.4% of comments were negative in February, slightly lower than January’s 58.7% but still above December’s 50.4%. Businesses pointed to weak economic conditions, high living costs, inflation and interest rates as factors restraining consumer spending.
BNZ Senior Economist Doug Steel said the latest PSI was “a real disappointment,” noting that it signals the economy is recovering more slowly than expected despite the relatively upbeat Performance of Manufacturing Index released last week.
Seven central banks, one energy shock: Critical monetary policy week
The coming week represents a rare convergence of global monetary policy decisions, with seven major central banks meeting within days of each other. The Reserve Bank of Australia, Bank of Canada, Federal Reserve, Bank of Japan, Bank of England, Swiss National Bank and European Central Bank will all announce policy decisions, making it arguably the most consequential week for global macro markets in 2026 so far.
What makes these meetings particularly significant is the dramatic shift in the global inflation outlook. Escalating military conflict in the Middle East has disrupted energy supply routes and driven oil and gas prices sharply higher. The resulting energy shock is forcing policymakers and investors alike to reconsider whether the global easing cycle may need to be reversed.
Federal Reserve – March 18
FOMC meeting will be the central event of the week. Markets overwhelmingly expect the Fed to hold the federal funds rate at 3.50–3.75%. However, the key issue is how policymakers respond to the recent oil shock.
Market pricing for a June rate cut has dropped to around 20%, reflecting expectations that higher energy prices could delay the easing cycle. Economists surveyed by Reuters still lean toward a June cut, with 63 of 96 expecting rates to be lowered to 3.25–3.50% next quarter, likely after Chair Jerome Powell’s term ends in May. Still, conviction is weakening, and nearly 40% of economists now expect only one cut or none this year.
Attention will focus on the updated dot plot and economic projections. Powell’s messaging on energy inflation will be critical. If he signals the Fed will look through the oil spike as transitory, markets may interpret that as dovish. But emphasis on potential second-round inflation effects in wages and services would signal a more hawkish stance.
Reserve Bank of Australia – March 17
The RBA decision opens the policy week, and Australia may deliver the most immediate policy action. According to a Reuters poll, 23 of 30 economists expect a 25-basis-point hike, lifting the cash rate to 4.10% from 3.85%. The median forecast now sees rates reaching 4.35% by the end of 2026.
The focus will be on whether Governor Michele Bullock signals that further tightening remains possible. Policymakers may frame the expected hike as insurance against inflation risks tied to the global energy shock, while leaving the door open for additional moves depending on the upcoming Q1 CPI report.
Bank of Canada – March 18
The BoC is expected to hold rates at 2.25%, with all 33 economists surveyed by Reuters forecasting no change. Despite rising global inflation risks, 76% of economists believe rates will remain unchanged through the end of 2026, reflecting concerns about domestic growth.
Governor Tiff Macklem’s tone will be closely watched, particularly after Canada’s weak February employment data. Markets will also focus on how the BoC views the oil surge, which presents a mixed macro signal for Canada—supporting energy exports while potentially weighing on broader economic activity.
Bank of Japan – March 19
The BoJ is expected to keep its policy rate at 0.75%, according to all 64 economists surveyed by Reuters. However, expectations for further normalization remain intact, with around 60% predicting a hike to 1.00% by June.
Two new members are expected to join the board later in Q2. Despite being viewed as more reflationary, most economists believe their presence will not prevent the BoJ from continuing its gradual tightening path.
Bank of England – March 19
The BoE is also expected to hold rates at 3.75%, with about 85% of economists supporting a pause. This represents a major shift from February, when most economists expected the BoE to continue cutting rates. Markets now see the next rate cut delayed until September, reflecting renewed inflation risks from higher energy prices.
As usual, the key surprise factor lies in the vote split within the Monetary Policy Committee. While unlikely, any hawkish dissent favoring a rate hike would signal growing concern about inflation persistence.
European Central Bank – March 19
The ECB is widely expected to keep its deposit rate unchanged at 2%, with more than 90% of economists forecasting no change through 2026. Only a handful of economists expect either a hike or a cut this year.
The main focus will be the updated staff projections, particularly inflation forecasts for 2026 and 2027. A significant upward revision in the 2026 HICP forecast—especially above 2.3%—could signal a hawkish shift in policy guidance.
President Christine Lagarde’s tone will also be critical, especially regarding the risk of stagflation. Markets will listen closely for any reference to recession risks as Europe grapples with the economic consequences of higher energy prices.
Swiss National Bank – March 19
The SNB is expected to keep rates at 0.00%. With the Swiss franc benefiting from safe-haven demand during the geopolitical turmoil, the SNB’s main concern will likely be preventing excessive currency strength.
For currency markets, the key message will be whether the SNB signals greater willingness to intervene in FX markets. Any indication that policymakers are prepared to sell francs aggressively to cap appreciation—particularly against Euro—could have immediate implications for CHF pairs.
Oil Hits $100 as Iran War Worries Investors and Yen Nears Intervention Levels
Markets reacted to signs that the conflict with Iran could last longer than first expected. Oil was very volatile during the week. Crude briefly moved above $100 early in the week, then pulled back, but later climbed again and finished just below $100. The main concern is that Iran may try to disrupt oil shipments through the Strait of Hormuz, which is one of the world’s most important oil routes.
Stock markets were weaker. U.S. equity markets fell for the third straight week as higher oil prices raised concerns about inflation and reduced expectations for quick interest rate cuts. Japan’s Nikkei also declined despite the weak yen. The U.S. dollar stayed strong because rising energy prices could delay Federal Reserve rate cuts.
Economic data had less impact than the geopolitical news. Japan’s GDP came in stronger than expected, while U.S. inflation was roughly in line with forecasts. However, U.S. GDP and durable goods data were weaker than expected. Gold struggled to move higher as much of the geopolitical risk already appears to be priced in, and the strong U.S. dollar encouraged some selling.
Markets This Week
U.S. Stocks
The downtrend in the Dow has become stronger, and with the war unlikely to end quickly, following the trend appears to be the best strategy for now. Continued disruption from higher oil prices and possible shipping problems in the Middle East could have negative effects on the global economy. While the market is already bearish, traders may look for the Dow to rebound toward the 10-day moving average before considering new selling opportunities this week. Resistance levels are at 47,500, 48,000, 48,500, and 49,000. Support is seen at 46,500, 46,000, 45,730, and 45,500.
Japanese Stocks
Japan is a major importer of oil, so higher energy prices could have a negative impact on business costs and economic data, even though the government plans to release oil reserves to help stabilize supply. The Nikkei’s recent downtrend has strengthened, and the growing risk that the Bank of Japan may intervene to support the yen could also create pressure on Japanese stocks. Like the Dow, the 10-day moving average is now pointing lower and may act as resistance this week, making it a possible level where traders look for selling opportunities. Resistance is seen at 54,750, 56,000, 57,000, and 58,000, while support is at 52,000円, 51,000円, and 50,000円.
USD/JPY
Higher oil prices are increasing inflation expectations in the United States, reducing the chances of interest rate cuts and supporting the U.S. dollar. USD/JPY closed just below the 160 level, which is an area where the Bank of Japan has intervened in the past. Markets are clearly aware of the intervention risk, so traders may be cautious about buying at these levels. However, if the war continues and the Bank of Japan does not intervene, the pair could continue to move higher. Resistance is at 160, 162, and 165, while support is seen at 159.00, 158.00 and 156.50.
Gold
Gold tried to move higher early in the week as tensions in Iran increased, but many traders were already long and the stronger U.S. dollar limited gains. As a result, gold finished the week just above the important $5,000 level. Short-term indicators have turned slightly negative, and if the market breaks below $5,000 this week it could trigger a quick move lower. Resistance is at $5,200, $5,250, $5,400, $5,418, and $5,500, while support is at $5,000, $4,900, and $4,850.
Crude Oil
Crude oil opened the week with another gap higher as fighting in Iran intensified, but prices briefly pulled back to the 10-day moving average, which held as strong support. As the week progressed, concerns grew that the war could last longer than expected and that Iran may try to disrupt oil shipments from the Middle East. Oil finished the week strongly, and although buying near the $100 resistance level may be late, looking to buy on pullbacks while the conflict continues could be the better strategy this week. Resistance is at $100, $110, $120, $125, and $130, while support is at $90, $80, $75, $70, and $67.5.
Bitcoin
Bitcoin recovered from support during the week, attracting some speculative buying as trading conditions remained relatively quiet and many traders focused on other markets. The market continues to move sideways, and range trading between $65,000 and $75,000 remains the preferred short-term strategy. Resistance is at $75,000, $80,000, and $85,000, while support is at $65,000, $60,000, and $55,000.
This Week’s Focus
- Monday: China Industrial Production and Unemployment Rate, U.s> NY Empire State Manufacturing Index and Industrial Production
- Tuesday: Australia RBA Interest Rate Decision, E.U. ZEW Economic Sentiment, U.S. Pending Home Sales
- Wednesday: Japan Trade Balance, E.U. CPI, U.S. PPI, Factory Orders and Fed Interest Rate Decision
- Thursday: Australia Unemployment Rate, Japan BoJ Interest Rate Decision and Industrial Production, U.K. Unemployment Rate and BoE Interest Rate Decision, U.S. Building Permits, E.U. ECB Interest Rate Decision
- Friday: E.U. Trade Balance
Another volatile week is likely ahead, with many trading opportunities as markets begin to assess how much damage the war in Iran could cause to the global economy. Equity markets have continued to fall, raising the risk that panic selling could start to appear if sentiment worsens, while oil prices could spike higher again if tensions escalate. USD/JPY has also moved close to 160, bringing the market near levels where the Bank of Japan could consider intervention.
Several major central banks are meeting this week. The U.S., Japan, and the U.K. are expected to keep interest rates unchanged, while Australia may raise rates. Markets will closely watch the central bank statements for clues about future policy, especially as higher oil prices could keep inflation elevated and complicate rate decisions.
CHFJPY Elliott Wave Analysis – Favors Upside Amid Choppy Actions
CHFJPY currency pair is poised for more upside despite recent decline and choppy price action. How further can the long term bullish cycle continue before the next big pullback?
Yen pairs have demonstrated significant bullish trends since the COVID-19 pandemic emerged. Following a bearish cycle in 2016, these pairs experienced a surge throughout 2017 and into 2018, although they subsequently retraced until January 2019. This robust bullish trend, which emerged after a sell-off between January 2015 and June 2016, is largely attributed to the Bank of Japan’s persistent implementation of ultra-loose monetary policies, in contrast to the monetary policy tightening observed in other major banks in the post-COVID-19 era. As a result of the weakened JPY, the CHFJPY has reached record highs.
CHFJPY Long term View
From our Elliott wave perspective, we shared the long term view on the weekly charts. There, we reckoned the low of January 2019 to depict the end of the grand supercycle degree ((II)). From that low, price completed sub-waves (I), (II), (III) and (IV) of ((III)) and now in (V). From the low of September 2024 where wave (IV) ended, we reckoned price had completed waves ((1)), ((2)), ((3)) and ((4)) of I of (IV) of ((III)). Thus, price is in the wave ((5)) which started from the low of February 2026.
Therefore, the most recent significant bullish cycle on this pair started in February and its end will most likely mark the end of the broader bullish cycle from September 2024. Thus, a big corrective pullback of the September 2024 cycle may not be that far away. However, Elliott wave theory shows wave ((5)) is not yet over and short-term traders can still buy the dips. Let’s now check the smaller cycles.
CHFJPY Elliott Wave Analysis – 1st Scenario
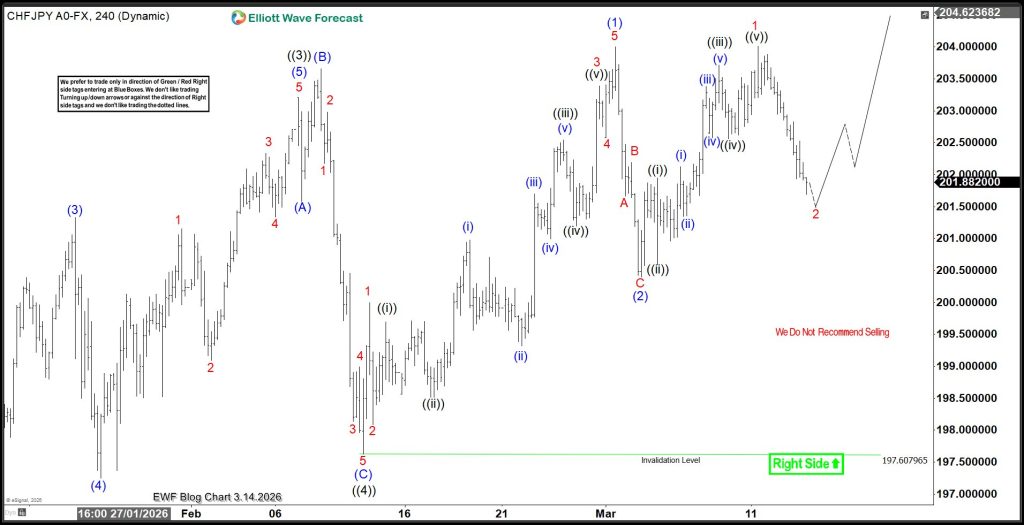
As the H4 chart shows, wave ((5)) appears to be in its early stages. Following the completion of waves (1) and (2) of ((5)), wave (3) began on March 3rd and could extend to the 208.33-210.79 region. The current pullback is anticipated as wave 2 of (3), correcting the previous 5-wave advance that surpassed the prior peak. Wave 2 is expected to end above the March 3rd low, likely between 201.76 and 201.15. From this zone, a new short-term bullish cycle should emerge for wave 3 of (3). As it establishes a new high, traders can look to buy the dips, as wave (3) is still a distance away. However, if this zone is breached and the price reaches the low of (2), the second scenario below should unfold.
CHFJPY Elliott Wave Analysis – 2nd Scenario
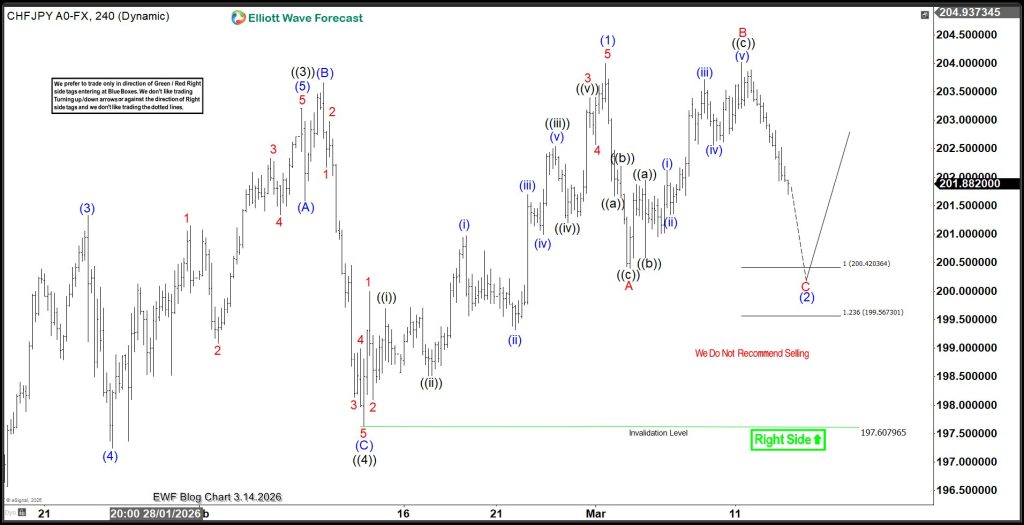
If the pullback extends below the low of wave (2) in the first scenario, a deeper wave (2) with an irregular flat structure could form. The flat could be contained between 200.42 and [#######], where new support might emerge. From this support level, or slightly below, we could see a new wave (3) emerge. Traders should wait for a break of the previous high to confirm the count, then look to buy the dips. Overall, the bullish run should continue as long as the pair trades above the 197.60 pivot.
CHFJPY Wave Analysis
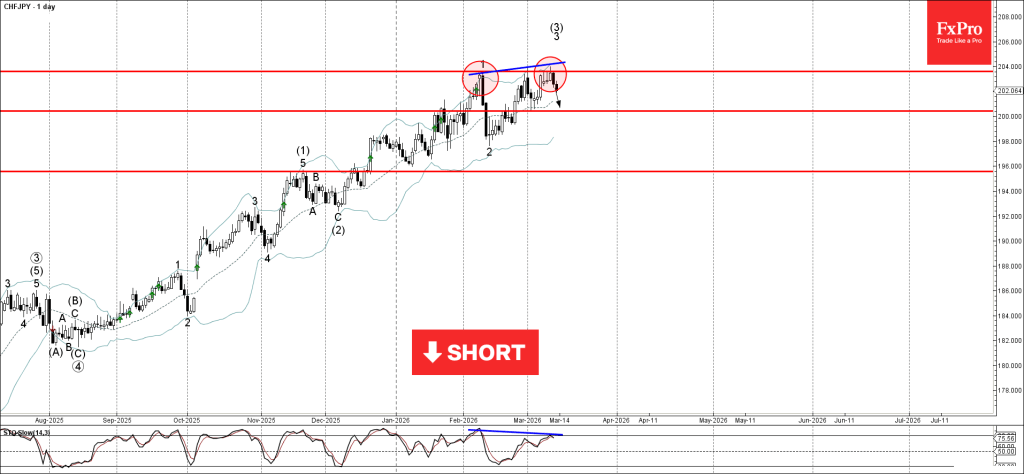
CHFJPY: ⬇️ Sell
- CHFJPY reversed from resistance zone
- Likely to fall to support level 200.40
CHFJPY currency pair recently reversed from the resistance zone between the key resistance level 203.60 (top of wave 1 from February) and the upper daily Bollinger Band.
The downward reversal from this resistance zone created the daily Japanese candlesticks reversal pattern Bearish Engulfing.
Given the strength of the resistance level 203.60 and the bearish divergence on the daily Stochastic, CHFJPY currency pair can be expected to fall to the next support level 200.40.
EURGBP Wave Analysis
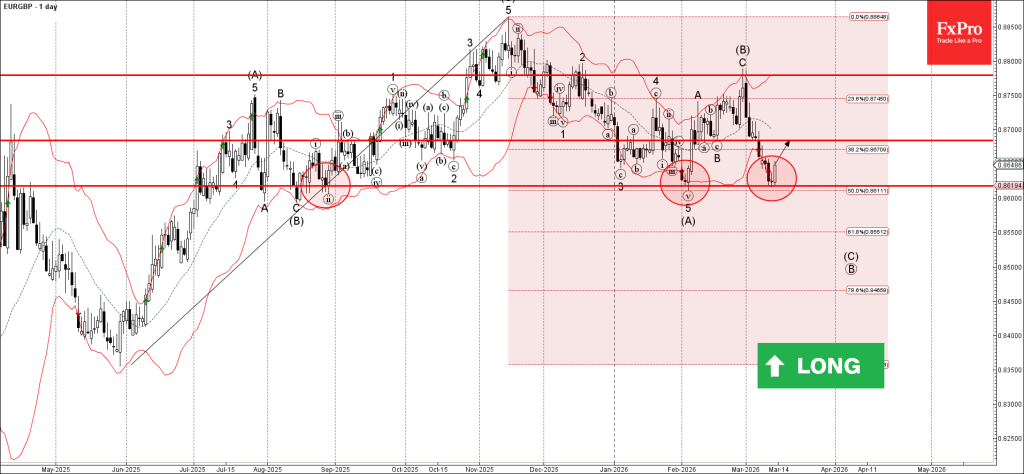
EURGBP: ⬆️ Buy
- EURGBP reversed from support zone
- Likely to rise to resistance level 0.8685
EURGBP currency pair recently reversed from the support zone between the support level 0.8620 (which has been reversing the price from last August), lower daily Bollinger Band and the 50% Fibonacci correction of the upward impulse from last May.
The upward reversal from this support zone will most likely form the daily candlesticks reversal pattern Morning Star – which stopped wave (A) in February.
Given the clear daily uptrend, EURGBP currency pair can be expected to rise to the next resistance level 0.8685.
Dow Jones Wave Analysis
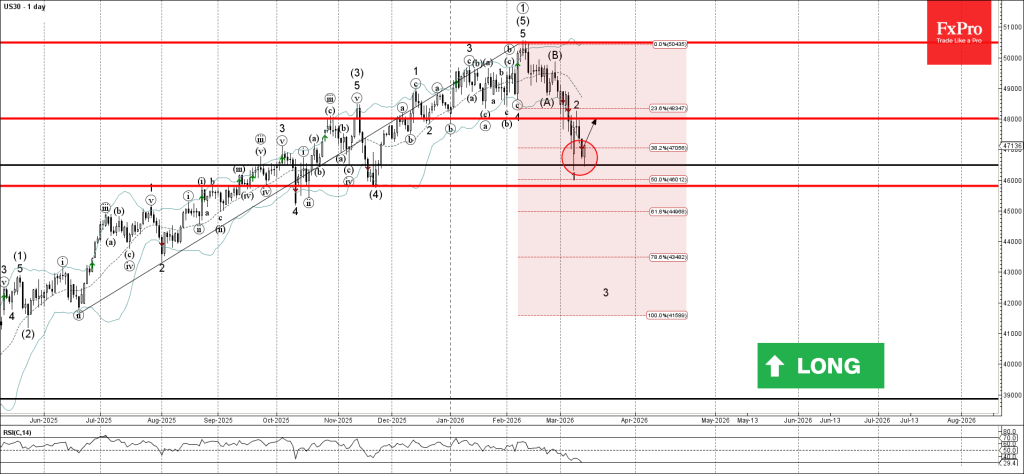
Dow Jones: ⬆️ Buy
- Dow Jones reversed from support level 46500.00
- Likely to rise to resistance level 48000.00
Dow Jones index recently reversed from the support zone between the support level 46500.00 (which stopped the previous impulse wave 1 at the start of March, as can be seen from the daily Dow Jones chart below), 50% Fibonacci correction of the upward impulse from 2025 and the lower daily Bollinger Band.
The upward reversal from the support level 46500.00 is aligned with the clear uptrend that can be seen on the daily Dow Jones charts.
Dow Jones index can be expected to rise to the next resistance level 48000.00 (former support from December, which stopped earlier correction 2).
Eco Data 3/16/26
| GMT | Ccy | Events | Act | Cons | Prev | Rev |
|---|---|---|---|---|---|---|
| 21:30 | NZD | Business NZ PSI Feb | 48 | 50.9 | 50.7 | |
| 02:00 | CNY | Industrial Production Y/Y Feb | 6.30% | 5.10% | 5.20% | |
| 02:00 | CNY | Retail Sales Y/Y Feb | 2.80% | 2.50% | 0.90% | |
| 02:00 | CNY | Fixed Asset Investment (YTD) Y/Y Feb | 1.80% | -2.10% | -3.80% | |
| 12:15 | CAD | Housing Starts Y/Y Feb | 251K | 243K | 238K | |
| 12:30 | CAD | CPI M/M Feb | 0.50% | 0.60% | 0.00% | |
| 12:30 | CAD | CPI Y/Y Feb | 1.80% | 1.90% | 2.30% | |
| 12:30 | CAD | CPI Median Y/Y Feb | 2.30% | 2.40% | 2.50% | |
| 12:30 | CAD | CPI Trimmed Y/Y Feb | 2.30% | 2.40% | 2.40% | |
| 12:30 | CAD | CPI Common Y/Y Feb | 2.40% | 2.60% | 2.70% | |
| 12:30 | USD | Empire State Manufacturing Mar | -0.2 | 3.8 | 7.1 | |
| 13:15 | USD | Industrial Production M/M Feb | 0.20% | 0.20% | 0.70% | |
| 13:15 | USD | Capacity Utilization Feb | 76.30% | 76.30% | 76.20% | 76.30% |
| 14:00 | USD | NAHB Housing Market Index Mar | 38 | 37 | 36 | 37 |
| 21:30 | NZD |
| Business NZ PSI Feb | |
| Actual | 48 |
| Consensus | |
| Previous | 50.9 |
| Revised | 50.7 |
| 02:00 | CNY |
| Industrial Production Y/Y Feb | |
| Actual | 6.30% |
| Consensus | 5.10% |
| Previous | 5.20% |
| 02:00 | CNY |
| Retail Sales Y/Y Feb | |
| Actual | 2.80% |
| Consensus | 2.50% |
| Previous | 0.90% |
| 02:00 | CNY |
| Fixed Asset Investment (YTD) Y/Y Feb | |
| Actual | 1.80% |
| Consensus | -2.10% |
| Previous | -3.80% |
| 12:15 | CAD |
| Housing Starts Y/Y Feb | |
| Actual | 251K |
| Consensus | 243K |
| Previous | 238K |
| 12:30 | CAD |
| CPI M/M Feb | |
| Actual | 0.50% |
| Consensus | 0.60% |
| Previous | 0.00% |
| 12:30 | CAD |
| CPI Y/Y Feb | |
| Actual | 1.80% |
| Consensus | 1.90% |
| Previous | 2.30% |
| 12:30 | CAD |
| CPI Median Y/Y Feb | |
| Actual | 2.30% |
| Consensus | 2.40% |
| Previous | 2.50% |
| 12:30 | CAD |
| CPI Trimmed Y/Y Feb | |
| Actual | 2.30% |
| Consensus | 2.40% |
| Previous | 2.40% |
| 12:30 | CAD |
| CPI Common Y/Y Feb | |
| Actual | 2.40% |
| Consensus | 2.60% |
| Previous | 2.70% |
| 12:30 | USD |
| Empire State Manufacturing Mar | |
| Actual | -0.2 |
| Consensus | 3.8 |
| Previous | 7.1 |
| 13:15 | USD |
| Industrial Production M/M Feb | |
| Actual | 0.20% |
| Consensus | 0.20% |
| Previous | 0.70% |
| 13:15 | USD |
| Capacity Utilization Feb | |
| Actual | 76.30% |
| Consensus | 76.30% |
| Previous | 76.20% |
| Revised | 76.30% |
| 14:00 | USD |
| NAHB Housing Market Index Mar | |
| Actual | 38 |
| Consensus | 37 |
| Previous | 36 |
| Revised | 37 |