
Sample Category Title
EUR/AUD Weekly Outlook
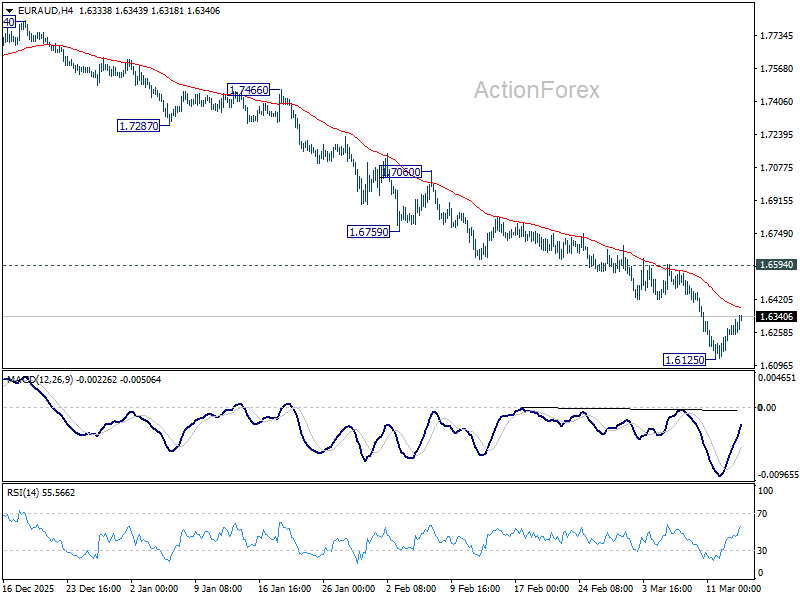
EUR/AUD's down trend accelerated to as low as 1.6125 last week but recovered since then. Initial bias remain neutral this week for consolidations. But outlook will remain bearish as long as 1.6594 resistance holds. Firm break of 1.6125 will resume the fall from 1.8554 to 1.5913 fibonacci level next. Nevertheless, break of 1.6594 will indicate short term bottoming, and bring stronger rebound.
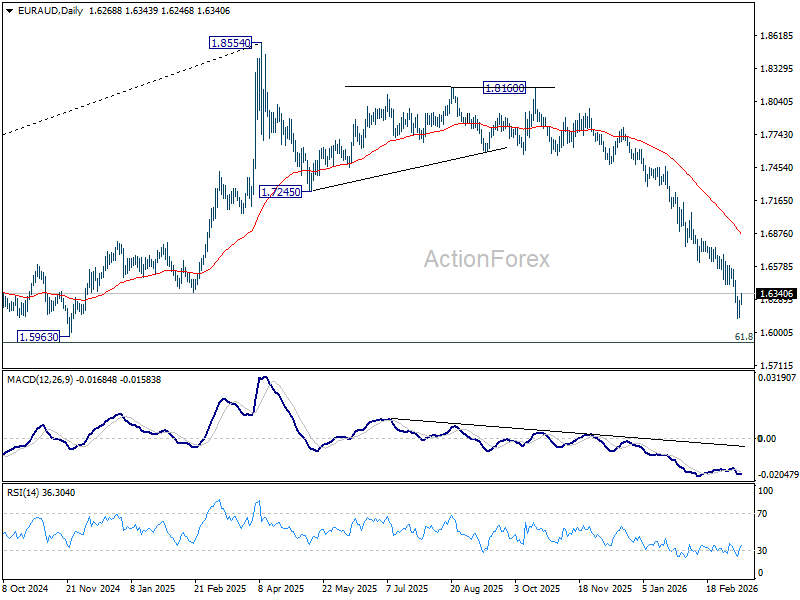
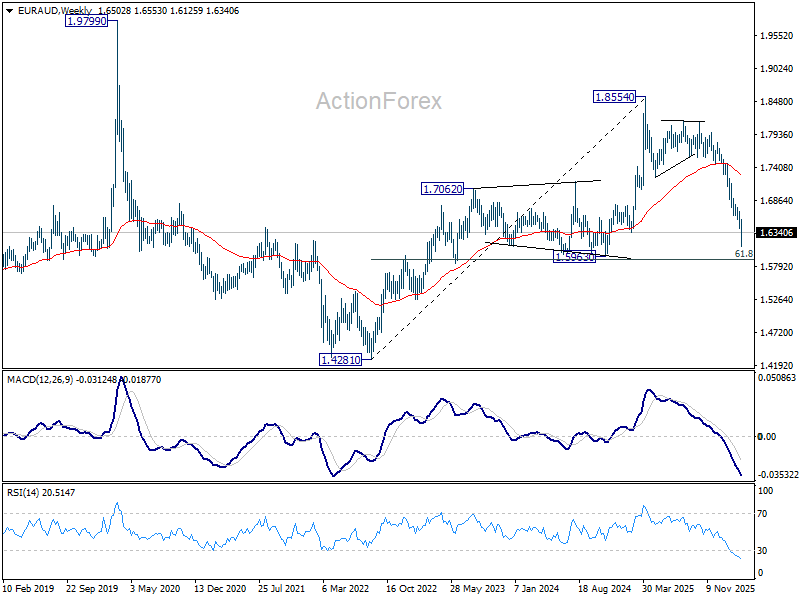
In the bigger picture, fall from 1.8554 medium term top is seen as reversing the whole up trend from 1.4281 (2022 low). Deeper decline should be seen to 61.8% retracement of 1.4281 to 1.8554 at 1.5913, which is slightly below 1.5963 structural support. Decisive break there will pave the way back to 1.4281. For now, risk will stay on the downside as long as 55 W EMA (now at 1.7273) holds, even in case of strong rebound.
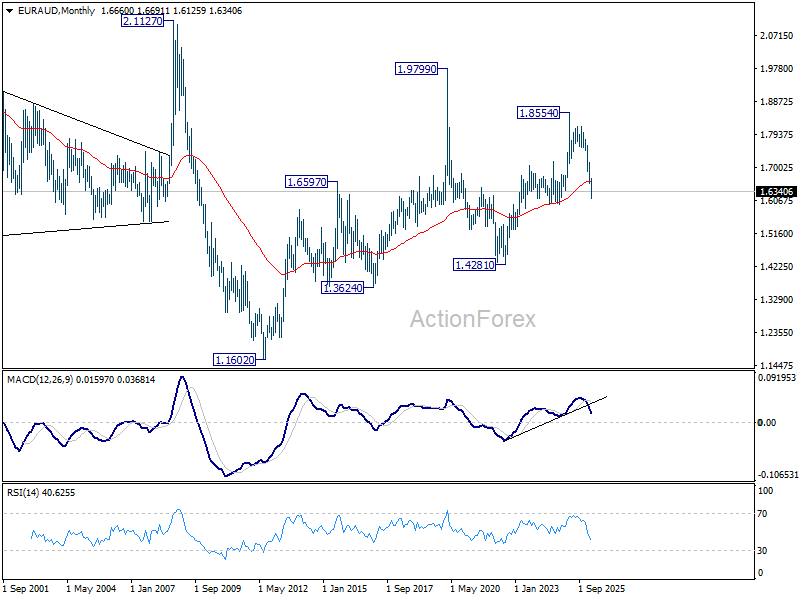
In the longer term picture, rise from 1.4281 is seen as the second leg of the pattern from 1.9799 (2020 high), which is part of the pattern from 2.1127 (2008 high). Current development argue that it has already completed at 1.8554. Sustained trading below 55 M EMA (now at 1.6603) will confirm this bearish case, and pave the way back towards 1.4281.
EUR/CHF Weekly Outlook
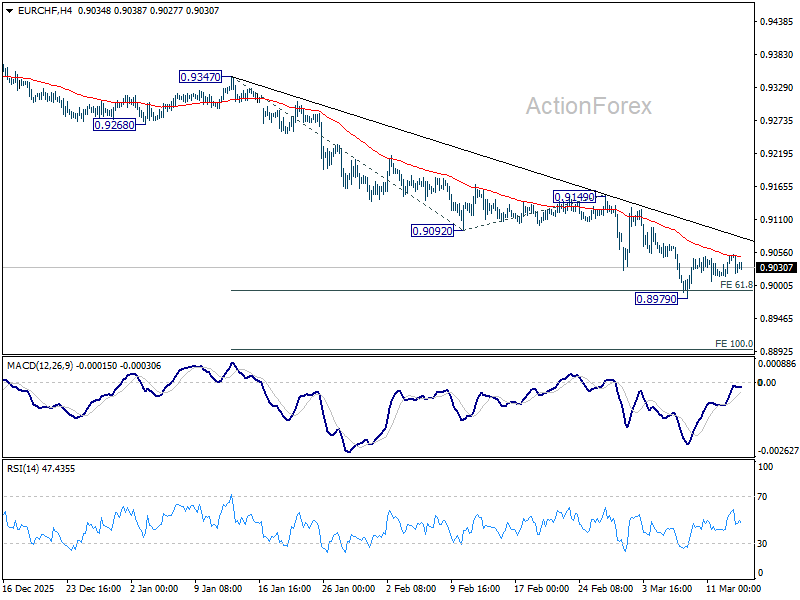
EUR/CHF edged lower to 0.8979 last week but quickly recovered. Initial bias remains neutral this week for some more consolidations first. But risk will stay on the downside as long as 0.9092 support turned resistance holds. On the downside, firm break of 0.8979 will resume larger down trend to 100% projection of 0.9347 to 0.9092 from 0.9149 at 0.8894.
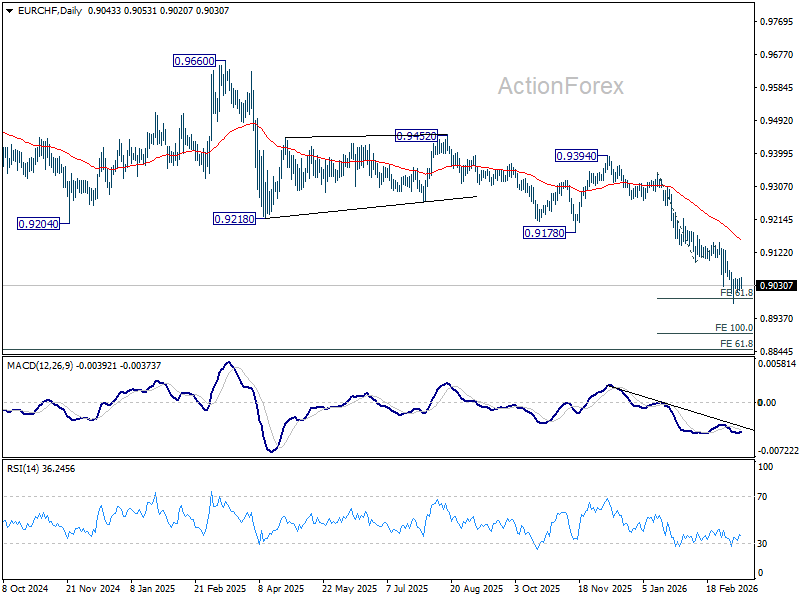
In the bigger picture, down trend from 0.9928 (2024 high) is still in progress. Next target is 61.8% projection of 1.1149 to 0.9407 from 0.9928 at 0.8851. Outlook will stay bearish as long as 0.9394 resistance holds, in case of rebound.
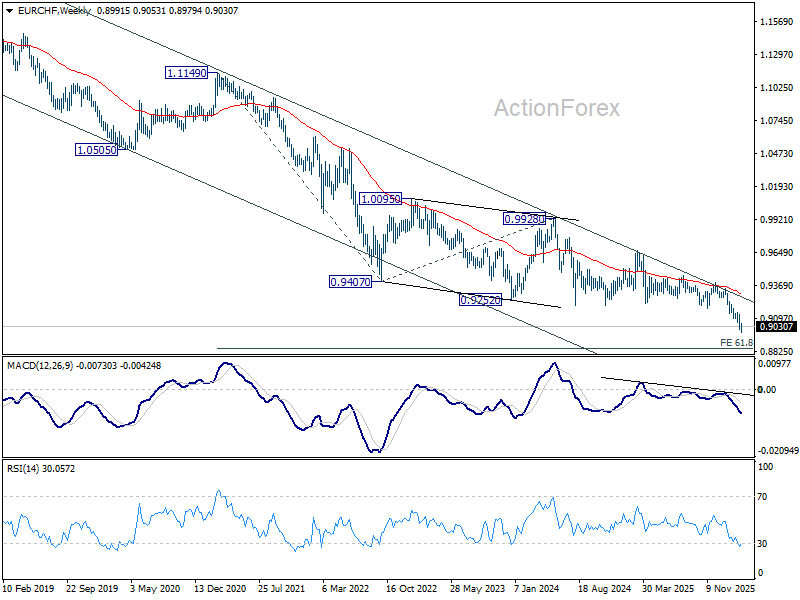
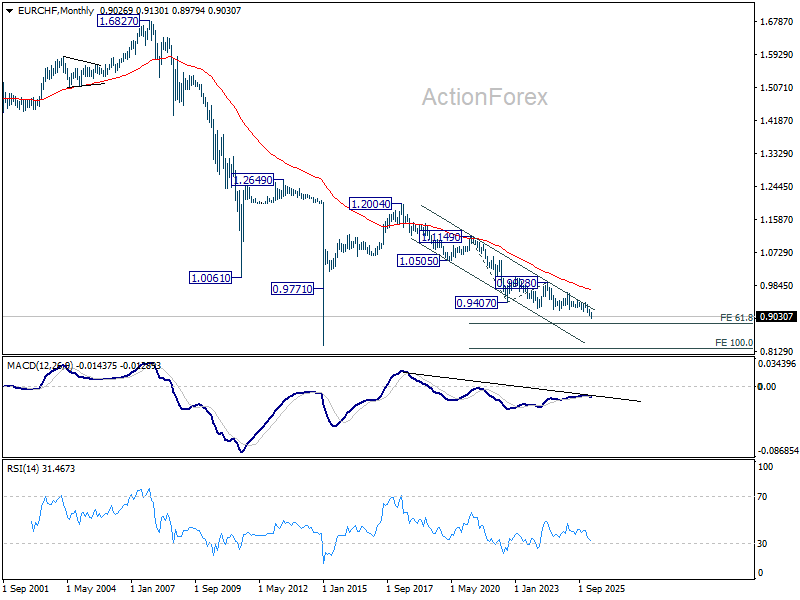
In the long term picture, EUR/CHF is holding well inside long term falling trend channel. Down trend from 1.2004 (2018 high) is still in progress. Outlook will continue to stay bearish as long as falling 55 M EMA (now at 0.9711) holds.
The Financial Damage of War – Markets Weekly Outlook
- Discover our Weekly Market Outlook, exploring themes and events that forged financial flows throughout the week.
- This week saw the commencement of large wartime impacts on volatility. With the FOMC coming up, it's not easy to expect better conditions ahead.
- Get ready for next week's action by exploring upcoming events across global Markets.
Week in review – Oil Wrought Havoc on Markets
Now reaching the third week of the US-Iran-Israel conflict, ongoing disruptions to the Energy commodity Market are starting to pose grand problems.
In short, higher Oil prices translate to higher inflation. Higher inflation translates to less profitability. Lower profitability and higher inflation translate into struggling Markets.
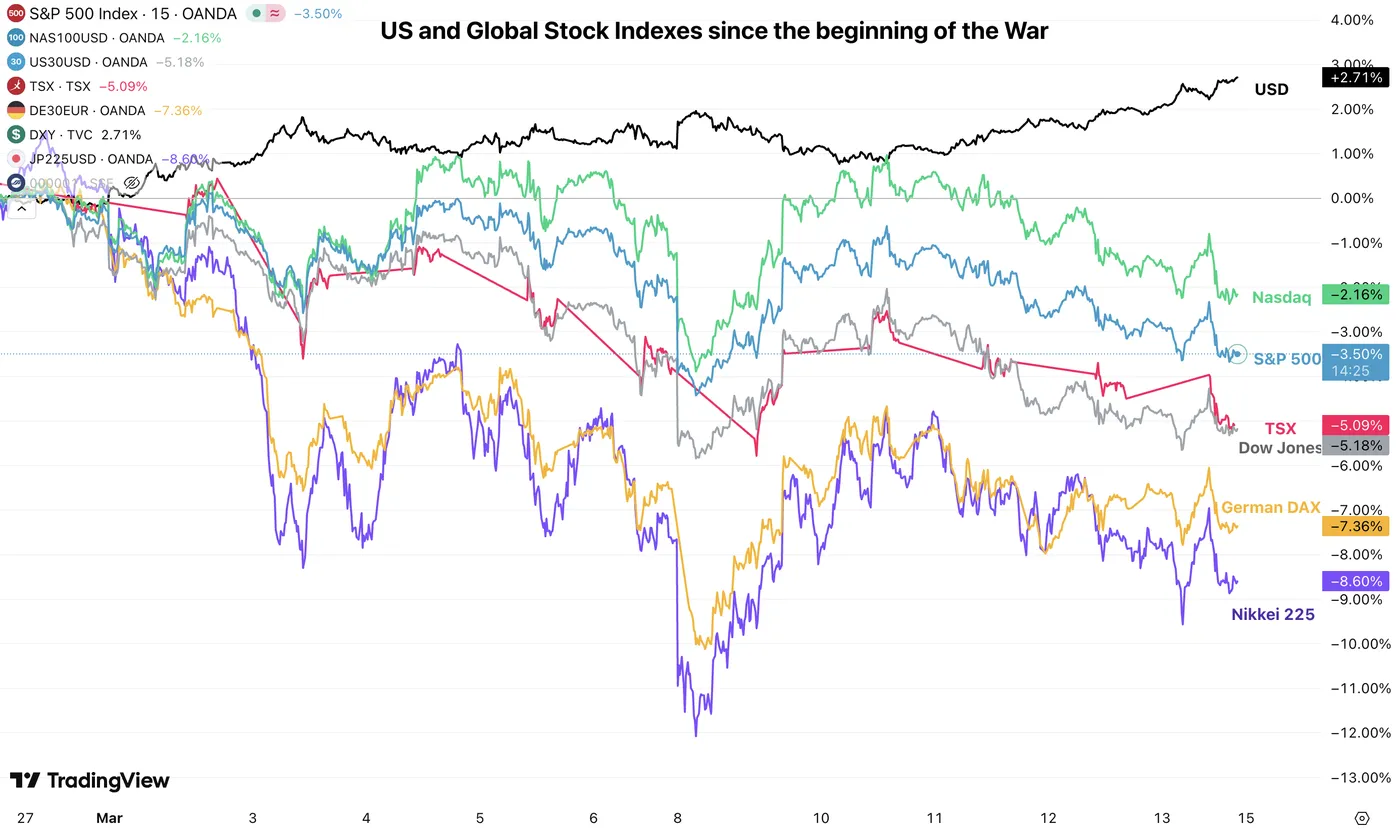
Global Weekly Index Performance – Source: TradingView – March 13, 2026
Stock Markets have taken a hit around the globe. Having remained impressively stable until recently, they are now entering a tougher period ahead.
As global Oil supply finds itself in jeopardy, companies will face significantly higher energy prices in the coming period; this effect should last at least as long as the Strait of Hormuz remains in de facto closure (only a few boats and tankers, if any, are crossing every day).
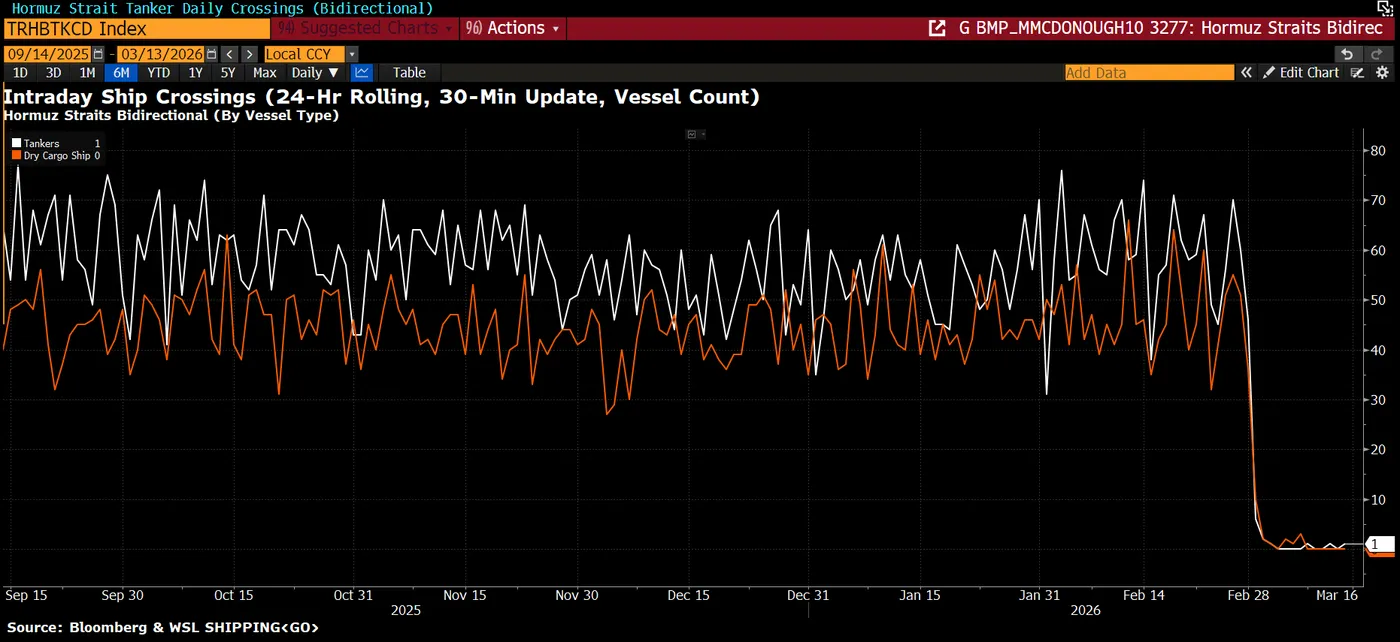
Strait of Hormuz Traffic – Source: Bloomberg – March 13, 2026
The issue is that Markets are starting to reprice the prolonged inflationary effect of such prices – the 1970s consecutive petrol crises taught painful lessons.
After the Oil embargos during that decade, stagflation brought heavy pain to consumers and global markets – and the effects lasted about 10 years, culminating in a significant economic cooldown in the early 80s.
With many ships attacked throughout the week, WTI went from about $80 to today's $98 – This doesn't even mention the 30% up and down swings in WTI prices since Monday.
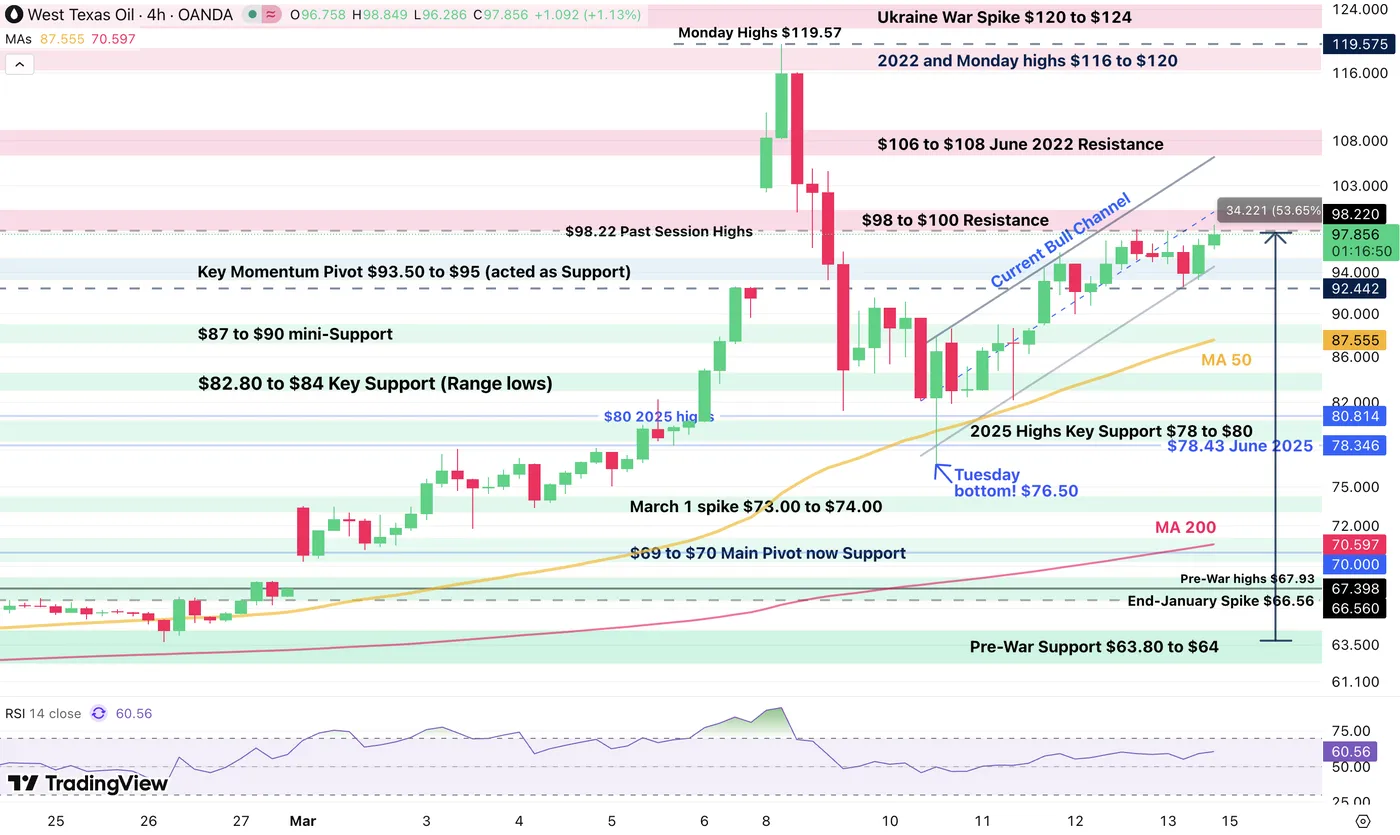
WTI Oil Prices since End February – Source: TradingView – March 13, 2026
To put things into perspective, this is about 72% higher than the prices seen in early January. But the issue is that this only reflects Crude Barrels – refined petrol products have well exceeded this rise worldwide, particularly in Asia.
The issue is that the narrative is shifting from a 4-5-week short war to the actual pricing of a much longer, more painful conflict. The media is blaming the US government for its lack of "exit plans".
Hence, Inflation expectations are racing higher, Yields are rising above their 2026 peaks, and cuts are being priced out, replaced by hikes, making the overall situation look quite grim.
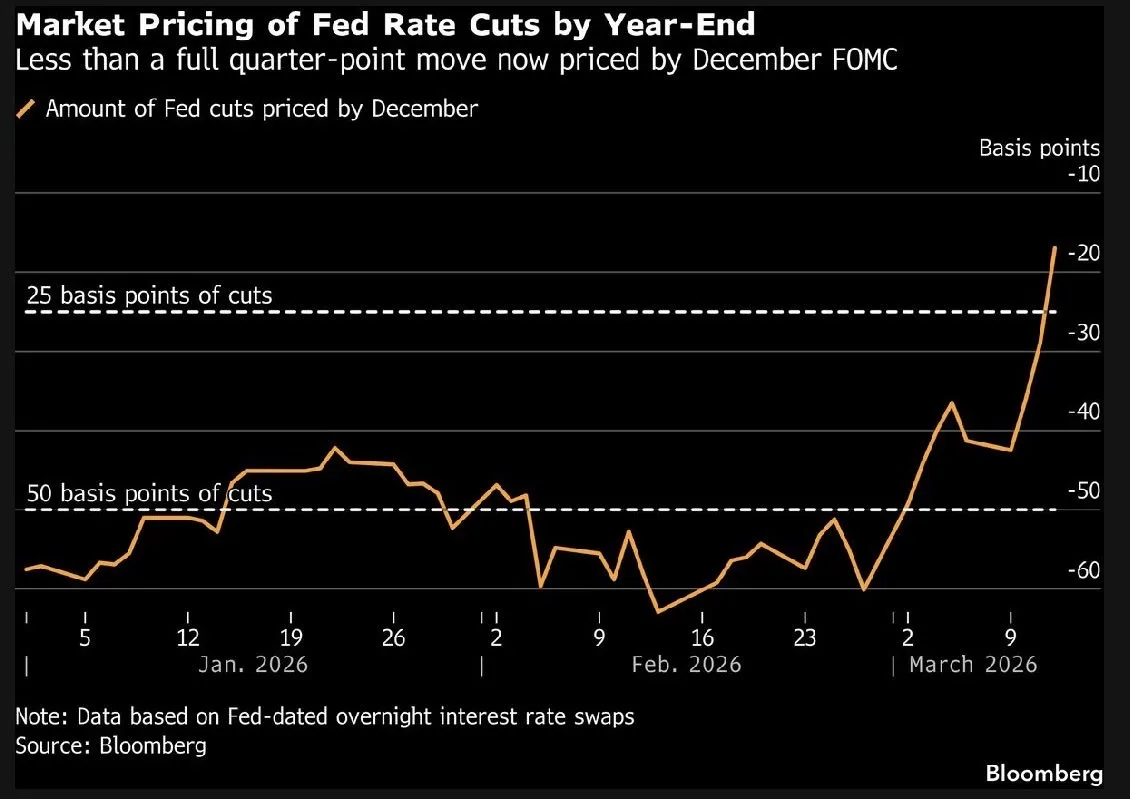
Rate Cuts are disappearing – Source: Bloomberg – March 13, 2026
The US Fed Funds rate cut pricing went from close to 65 bps to the current below ~20 bps. President Trump is proving Powell right yet again.
The only one enjoying the ride is the Petrodollar, which serves as the denominator for much more expensive Crude and loves the pricing out of cuts. The issue is that, at the current point in the economic cycle, this could pose heavy restraints on the economy.
Tracking upcoming data (particularly labor and manufacturing activity) and next week's Fed communications will be essential to get a better idea of what's coming.
The USD correlation with oil rises is once again pretty evident. Hence, it will be essential for traders to monitor the Dollar Index's movements to track overall Market flows in the coming period.
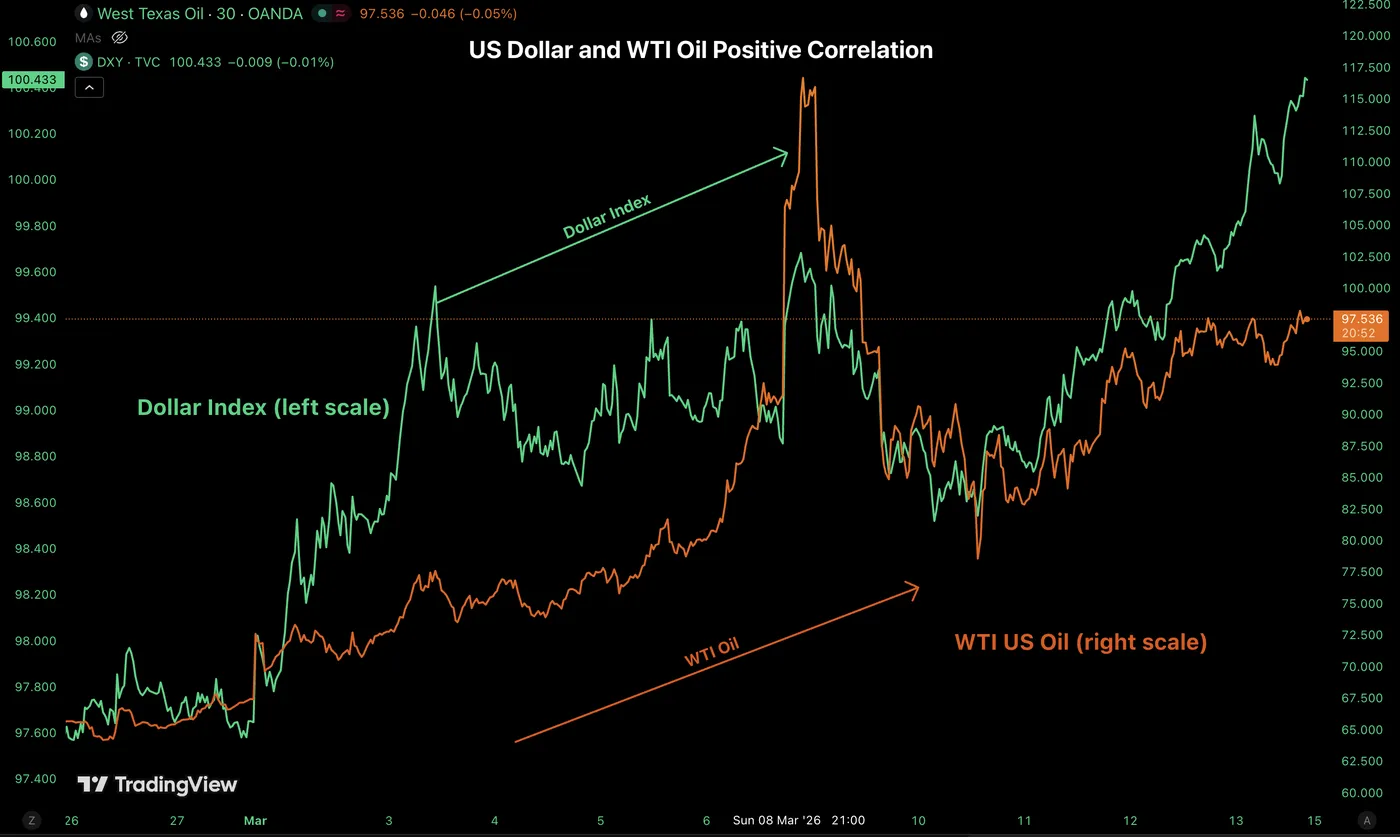
Oil and Dollar Index Positive Correlation. March 13, 2026 – Source: TradingView
On a brighter note (if we can call it such, there's nothing really bright about war), the US and Israel are making some strong advances to their strategy, with 90% of drone and ballistic missile launchers destroyed, and similar damage to the IRGC's military production sites.
The idea is that if Iran doesn't want to throw in the towel, and the US and Israel insist on inflicting mortifying blows to its enemy, Markets will have to count on the latter to hope for a shorter conflict.
To me, we are not at maximum Market fear yet, but there is a high chance that fears will get overblown. This could provide decent opportunities in the coming weeks.
Oil and Strait of Hormuz developments are, for now, the two largest threats to general Market pricing, so keep the two in check.
(And don't forget about the Private Credit trouble lurking out from far)
Weekly Performance across Asset Classes
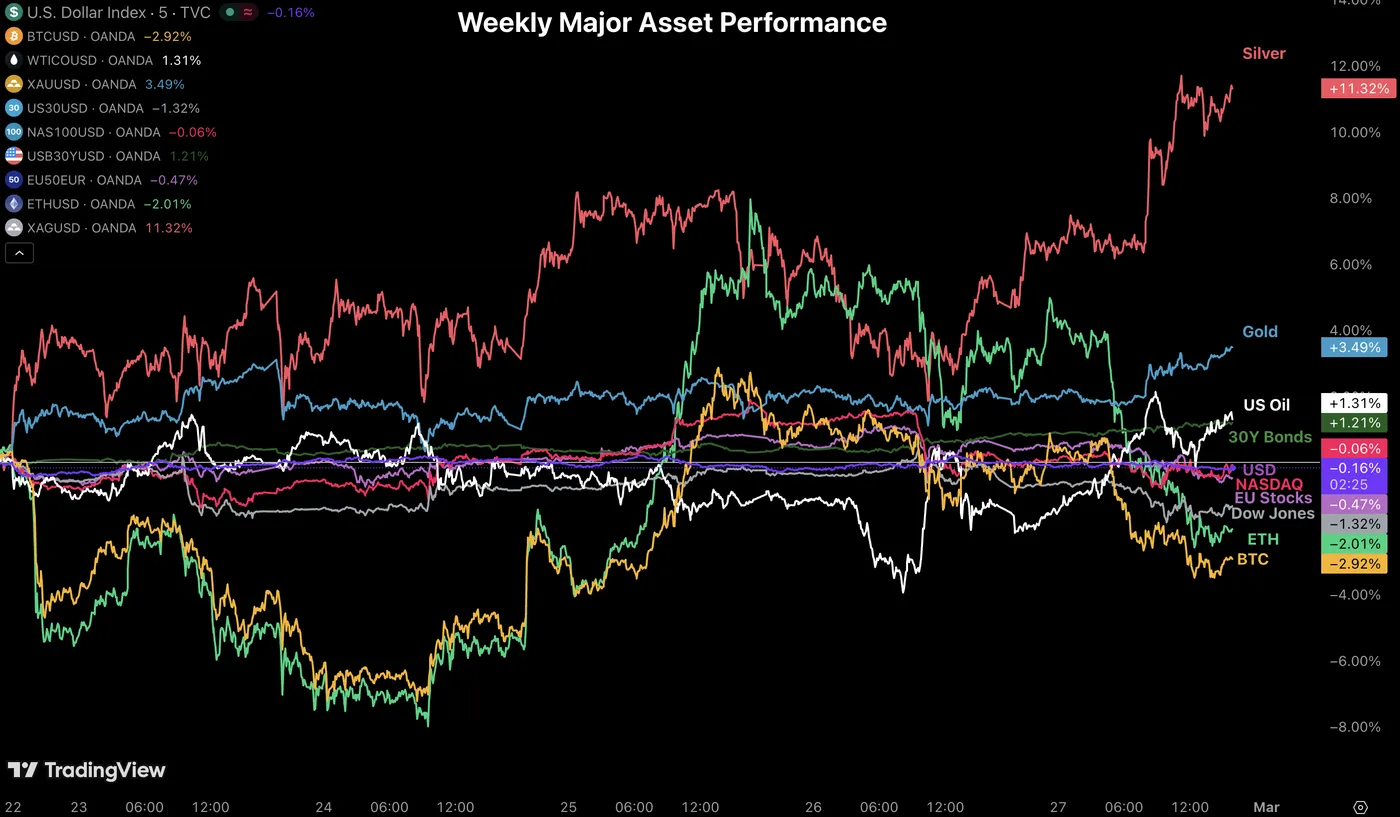
Weekly Asset Performance – March 13, 2026 – Source: TradingView
Metals were the worst performers of this week's action, and by far.
As long as Oil maintains a higher path, traders can expect similar flows ; That is, as long as Strait of Hormuz traffic doesn't pick up.
The Week Ahead – Major Central Bank decisions
Asia Pacific Markets – Royal Bank of Australia and Bank of Japan's Rate Decisions
APAC Traders will see the release of China's Industrial Production Numbers and Retail Sales, two key releases to track the second largest economy and particularly if the effect of their local supportive policies have been working.
This should have a slight influence on AUD prices, but some other releases should mark the strongest 2026 performance even more.
Monday evening welcomes the Royal Bank of Australia's rate decision, when a hike is about 80% priced.
This would bring the Australian rate to 4.35%, largely the highest for Major currencies (also erasing the 2025 very temporary rate cuts).
Aussie Dollar traders will also look for communication hints towards Wednesday's Employment Data for Australia.
Kiwi GDP data for 2025 will also finally release, so that should also get the NZD in the spotlight.
Thursday will bring the final major Market catalyst, with the Bank of Japan's Rate Decision. A hike is about 10% priced in for next week; A surprise hike would surely change a lot to the current Yen weakness, but to me, it wouldn't be so uncalled for after recent JPY weakness.
If the BoJ doesn't deliver, April will be the next rate hike target.
Europe and UK Markets – An intense Thursday Session
Europe will be mostly muted throughout next Week, but that wouldn't include Thursday's triple threat.
Currency traders will have a lot to work with between the UK Employment Data, but most importantly the Swiss National Bank, Bank of England and ECB Rate Decisions, all in the same day (and in that order).
North American Markets – Bank of Canada and FOMC
Canada will open the week with its Inflation data, but the largest day for North American Markets will surely be Wednesday.
The Bank of Canada and the FOMC will release their rate decisions, with no change expected.
Keep a very close eye and ear to what Powell has to say during his Press conference.
And don't forget the US PPI release!
Keep a close eye on geopolitical developments, particularly those involving the US-Iran talks, as they are likely to continue influencing Commodity and broader Markets.
Next Week's High Tier Economic Events
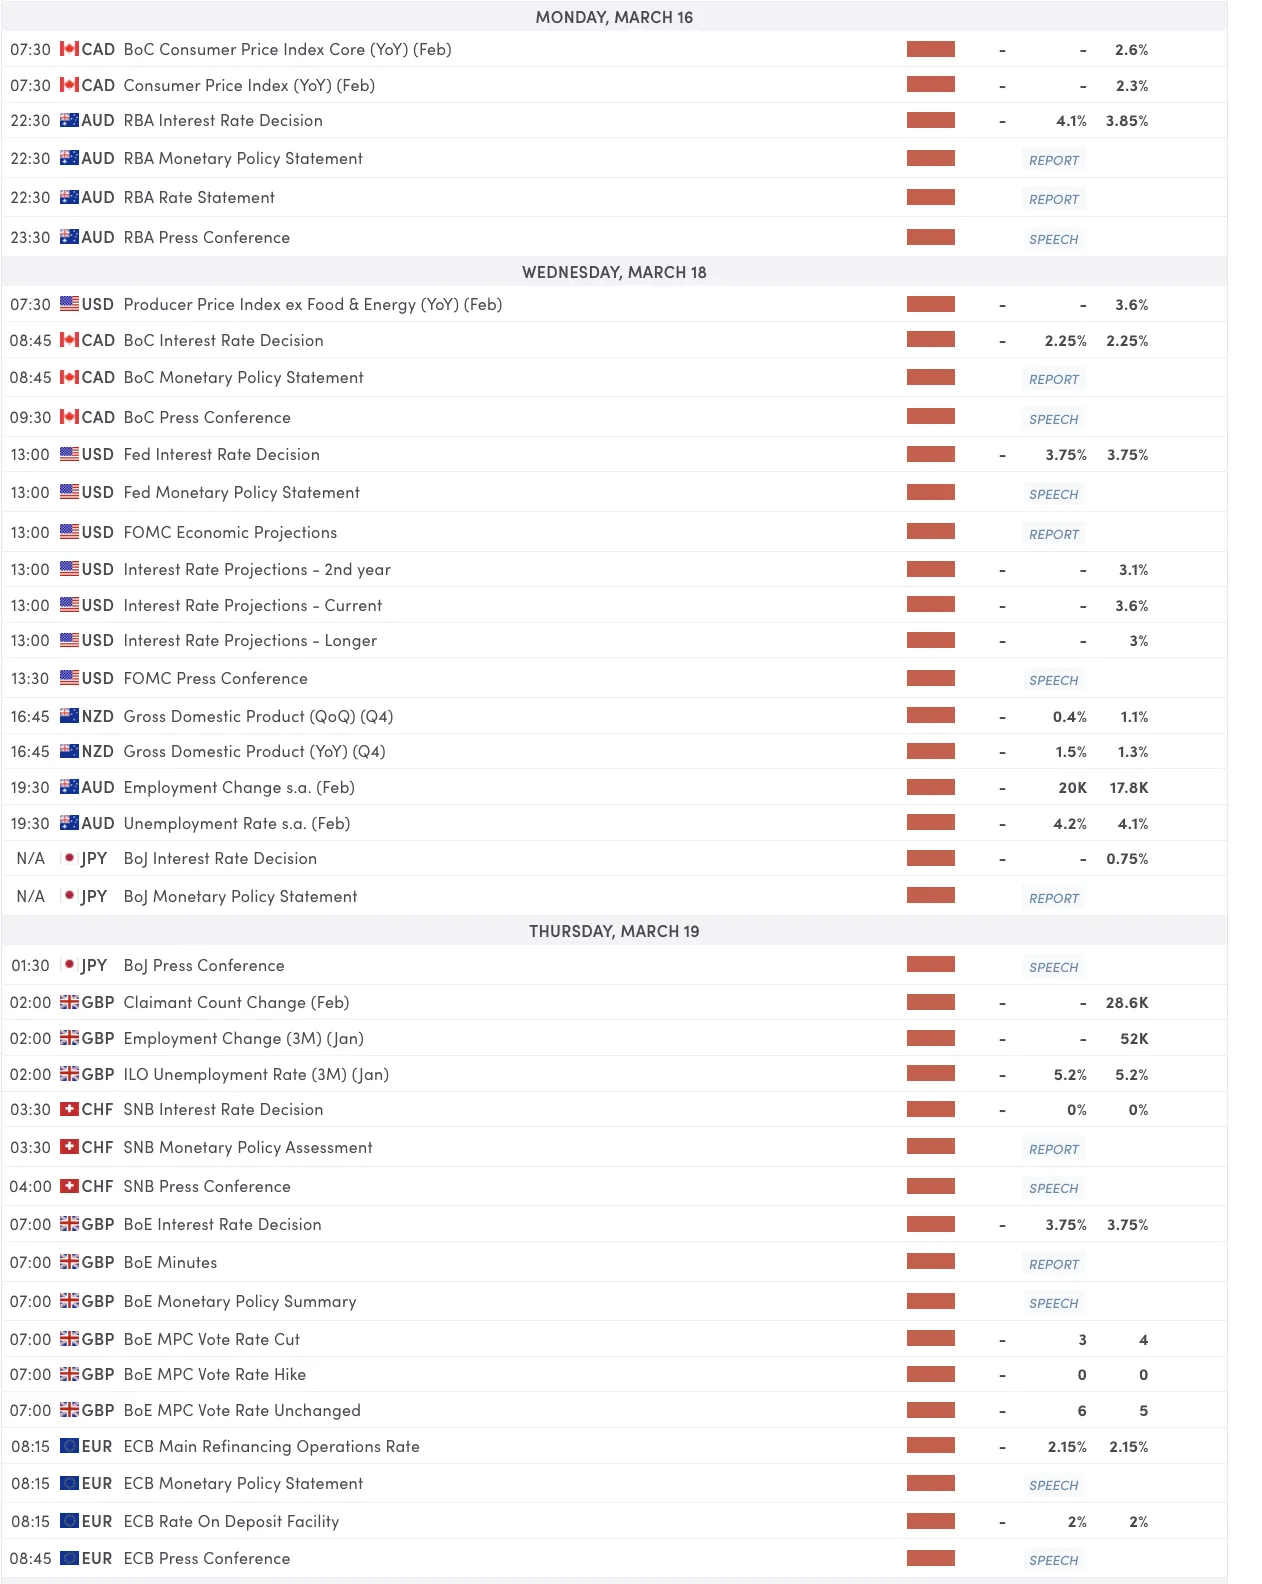
For all market-moving economic releases and events, see the MarketPulse Economic Calendar. (High-tier data only)
March 13th Market Wrap
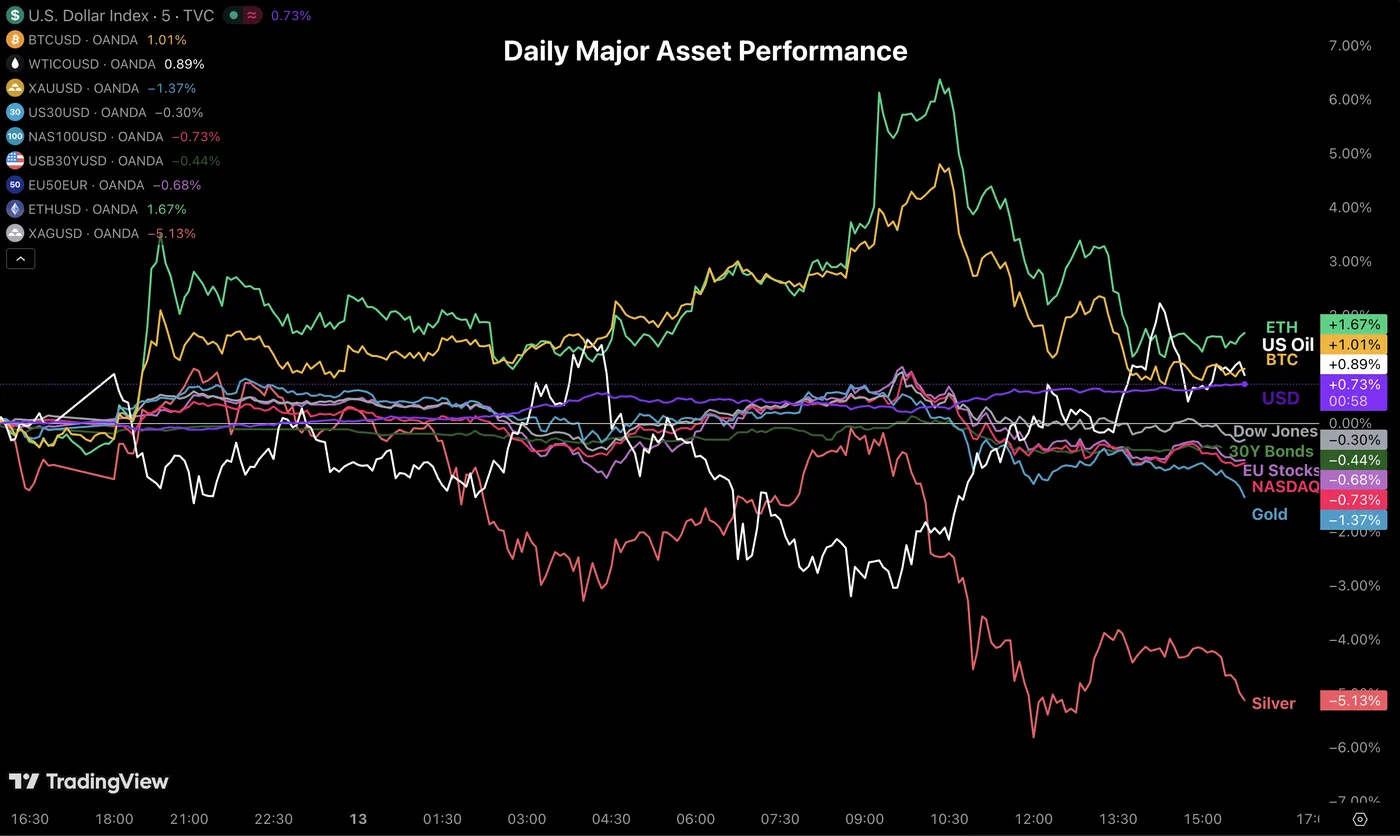
Cross-Asset Daily Performance, March 13, 2026 – Source: TradingView
Today marked a decent rebound in Cryptocurrencies which really stand out from the recent Market trends.
Apart from that, Oil bounces higher again despite its pullback attempt, and the US Dollar found new highs against most of its FX peers, particularly Antipodeans and Europeans.
The Dollar Index is now trading above its November peak.
In terms of economic data, releases were soft. Core PCE came in softer than expected (2.8% vs 2.9% exp), University of Michigan barely moved (which is a good sign these days), and Canadian employment shrugged by 89.3K (!).
This could somewhat ease inflationary fears, but this would more likely have its effect on Monday (as weekend risk gets unrolled, if there's valid reasons to do so!)
Safe Trades and enjoy your weekend!
Weekly Gold (XAU/USD) Forecast: 3% Slide to $5000/oz as Rate Cut Bets Tumble, FOMC Up Next
- Gold (XAU/USD) is under pressure, sliding this week as its safe haven appeal was overshadowed by a strengthening US dollar.
- Rate cut bets were slashed significantly due to fears over the Middle East conflict's impact on inflation, particularly elevated oil prices.
- The upcoming FOMC meeting is critical, as new forecasts may push the penciled-in 2026 rate cut back to 2027, which would strengthen the US dollar and weigh on Gold.
- The technical bias is neutral-to-bearish, with a "Death Cross" forming and price testing the critical psychological level of $5,000
Gold prices failed to capitalize on the gap higher at the start of the week with the precious metal sliding and remaining under pressure since Monday.
Gold has seen its safe haven appeal overshadowed by the US dollar as rate cuts bets tumbled this week on fears over the Middle East conflicts impact on inflation. As the week progressed it became clear that any hope of a swift resolution may not be forthcoming.
The closure or lack of movement through the Strait of Hormuz has kept Oil prices elevated with analysts across the board running various scenarios the longer the Strait remains closed.
One of the more interesting ones comes from Bloomberg Economics who predict Oil could hit around the $160/barrel mark if the Strait of Hormuz remains closed for 3 months. At 1 month they have oil prices just over $100/barrel with a 2 month closure seeing oil hit the $140/barrel mark.
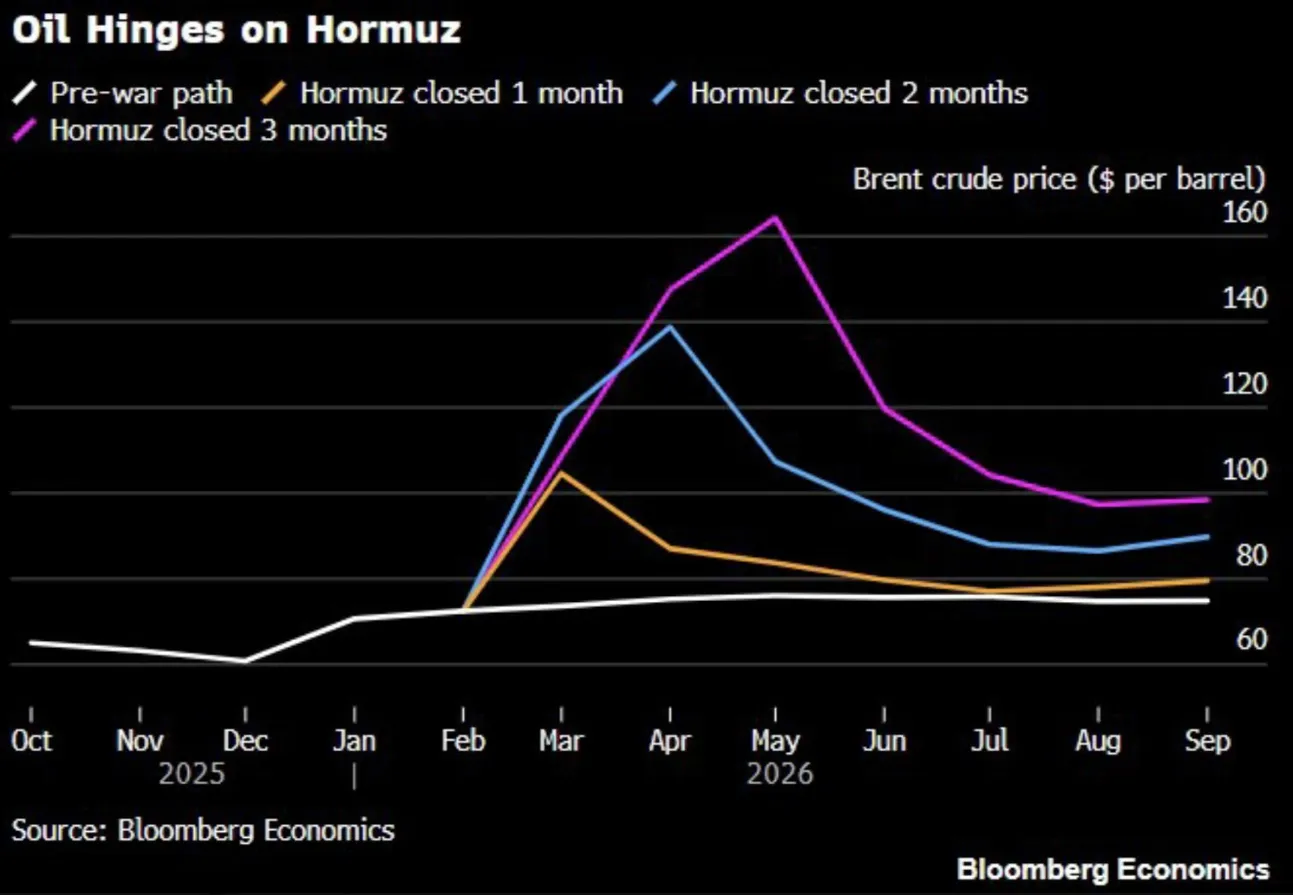
Source: Bloomberg Economics.
These concerns have seen rate cut bets slashed for the Federal Reserve from the +-66 bps prior to the conflict to 24 bps at the time of writing, per LSEG data.
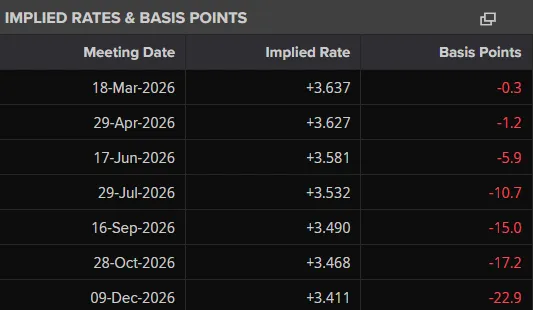
Source: LSEG
This has weighed heavily on Gold together with some profit taking earlier in the week likely also sharing some of the blame.
The week ahead for Gold (XAU/USD)
Gold will continue to be sensitive to the ever changing rate cut data as the geopolitical situation in the Middle East evolves. Things change quickly and despite all the tough man talk on both sides, a deal could materialize quickly as we have seen in the past.
Such a move may have a major impact on overall sentiment and thus also impact gold prices.
Rate cut data could also see significant changes after the Federal Reserve meeting when we may hear for the First time what Fed policymakers think of the Iran conflict and its implications. The Fed is currently in its blackout period and thus we have not gotten any reactions vis a vis the Iran situation.
We will get new forecasts from officials as well. The December update had one rate cut penciled in for 2026. There is a clear risk it gets pushed back to 2027 in the current climate. Such a move could further weigh on Gold prices and would strengthen the US dollar.
All other data releases will likely remain overshadowed by rate cut bets and geopolitical developments.
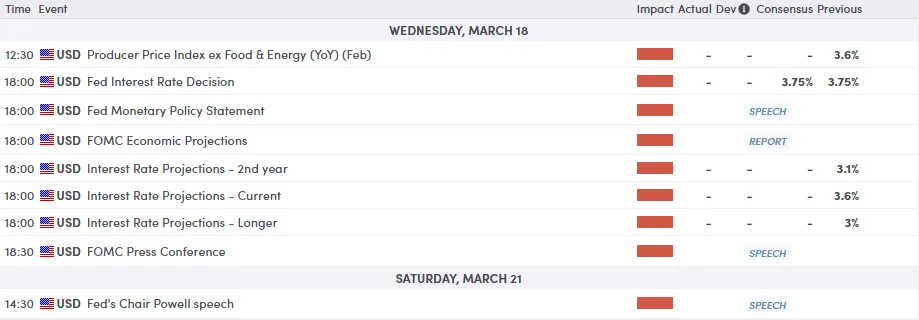
For all market-moving economic releases and events, see the MarketPulse Economic Calendar. (click to enlarge)
Technical Analysis - Gold (XAU/USD)
From a technical standpoint, Gold is currently exhibiting a bearish consolidation following a sharp correction from its early-month highs near $5420/oz and last week's highs at $5238/oz.
Gold is trading within a defined horizontal range (red box) between $5,050 and $5,200. A recent break below suggests increasing selling pressure, with price now testing the critical psychological level of $5,000.
However, given the overarching conditions, the break lower may prove short-lived. We saw a similar false breakout earlier this week,but to the upside.
It swiftly dropped back inside the box and has grinded sideways ever since,
A "Death Cross" is forming as the 50-SMA ($5,139) trends sharply toward the 100-SMA ($5,158). Price is currently pinned below both averages, confirming a bearish shift in short-term momentum.
The bias remains neutral-to-bearish while below $5,130. A decisive H4 close below the $5,000 support could trigger a deeper liquidation toward the $4,840 zone.
Conversely, buyers need a breakout above $5,200 to reclaim the bullish trend.
Gold (XAU/USD) Four-Hour Chart, March 13, 2026
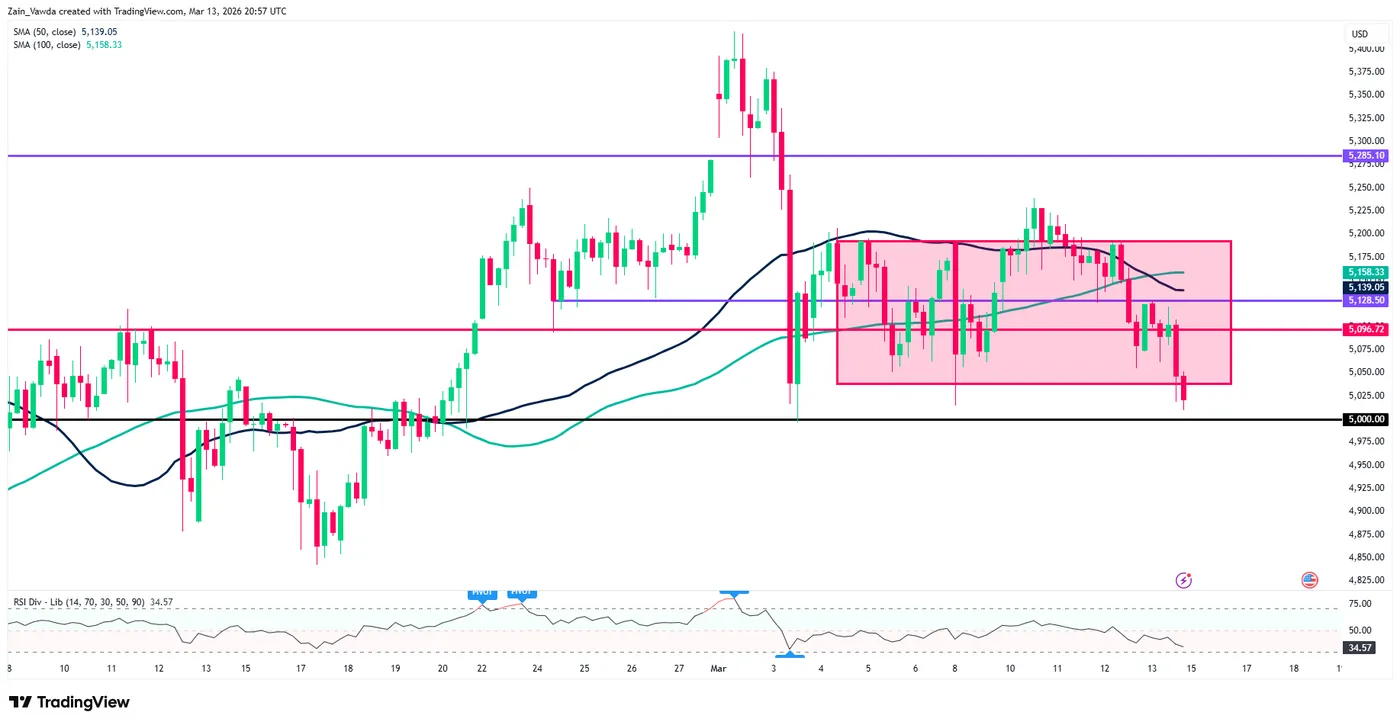
Source: TradingView
Trade Safe.
The Weekly Bottom Line: Oil Shock Therapy
Canadian Highlights
- Canada’s labour market weakness continued in February, with losses concentrated in full-time and private sector jobs. The unemployment rate rose to 6.7%.
- Canada’s trade deficit widened substantially in January, and we expect trade to subtract from Q1 GDP growth, with the recent oil price jump not yet reflected in the data.
- If elevated oil prices persist, the risk is that inflation expectations start to rise. For now, we expect the Bank of Canada to stay on hold next week, and continue to assess the impacts of the ongoing disruption.
U.S. Highlights
- The intensifying conflict in the Middle East continued to push global energy prices higher, as elevated uncertainty regarding the conflict’s duration weighed on financial markets.
- Inflation data for February, which pre-dated the uptick in energy prices, registered an annual reading of 2.4% ahead of next week’s Federal Reserve meeting.
- The U.S. announced new Section 301 tariff investigations covering dozens of countries, confirming that the administration will continue to levy tariffs in the wake of the Supreme Court ruling striking down the IEEPA tariffs.
Canada – Oil Shock Therapy
Wild swings in crude oil prices kept markets on their toes this week as the Strait of Hormuz – a choke point for roughly 20% of global oil supply – remained effectively closed. At time of writing, WTI crude is sitting above $96 per barrel, above last week’s close, but the path there has been a wild ride: prices have traded between $78 and $117 over that span. Equity markets weakened with the S&P TSX, declining 0.5%. Bond markets continued to price in higher inflation risks. The 10-year Government of Canada yield rose another 5 basis points to 3.46%, bringing the increase to more than 30 basis points since before the attacks on Iran.
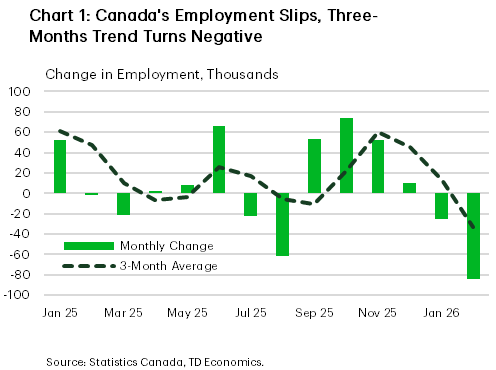
A view of Canada’s labour market immediately prior to the oil shock, came from Friday’s jobs report. Contrary to expectations for a rebound, February doubled down on January’s weakness with employment falling 84k, adding to the 25k decline the month before, moving the three-month trend back into negative territory (Chart 1). The details were also disappointing. losses were seen in full-time and private sector jobs, with Statistics Canada noting that private sector employment was virtually unchanged from a year earlier. The labour force also continued to contract, albeit at a more modest pace than in January.
Despite an exodus from the labour force, the unemployment rate rose to 6.7%. All in all, the report is decidedly weaker than markets expected, although the direction of travel was not entirely surprising given the multiple challenges facing the economy.
January’s merchandise trade report offered another reminder of the ongoing struggles. Canada’s trade deficit widened substantially, to $3.6 billion from $1.3 billion in December, as exports declined and erased gains from previous months (Chart 2). Much of the weakness came from the auto sector, where extended seasonal production shutdowns distorted both export and import numbers. As production schedules normalize, we expect some improvement over the next couple of months.
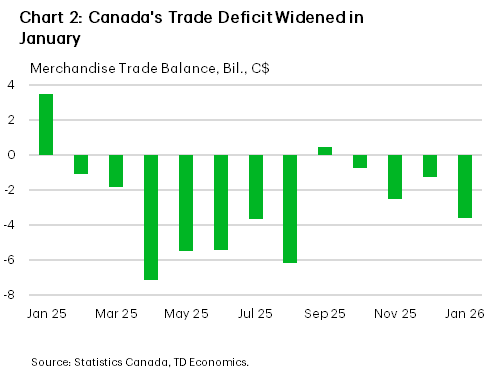
The recent jump in oil prices will not show up meaningfully in Canada’s trade balance until the March data. With limited information available, net trade is likely to subtract from Q1 2026 real GDP growth. If elevated oil prices persist, the risk is that cost-push inflation begins to spread beyond energy and inflation expectations start to rise. Deputy Governor Sharon Kozicki outlined how the Bank of Canada might respond to supply shocks in a speech last week. The size and persistence of the shock, coupled with the current state of the economy are the key determinants of the policy choice. It is the persistence of the oil shock that is a key uncertainty right now. As for the current state of the economy, Canada’s broader macro backdrop remains soft. With no boom in GDP on the horizon, we don’t see the conditions required for tightening this year, in contrast to the slight odds markets are currently placing on a hike. We expect the Bank of Canada to stay on hold next week, and continue to assess the impacts of the ongoing disruption in the Strait.
U.S. – Geopolitical Risks Keep Market on Edge
Financial markets faced another week of volatility as the conflict in the Middle East intensified. Iranian attacks against vessels passing through the Strait of Hormuz and energy infrastructure in the region has kept energy prices elevated, with oil prices remaining in the $90-100 per barrel range through the end of the week. The announcement that International Energy Agency member countries would release strategic oil reserves provided some relief to the tumult in financial markets, but on aggregate, the near-term risk outlook for the global economy remains elevated. As of the time of writing, the S&P 500 is down 1.2% and the U.S. 10-Year yield is up 14 basis points on the week to 4.27%.
The U.S. remains partially insulated from the spike in global energy prices as a net energy exporter, but the conflict is still expected to create a light headwind for growth this year. The duration of the conflict and its impact on energy prices remains highly uncertain, but the recovery time for energy markets is expected to be measured in months not weeks. This will likely weigh on U.S. consumers and businesses over the near-term.
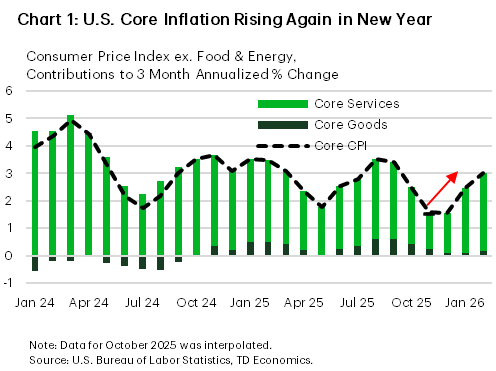
Inflation data for February, which pre-dated the rise in global energy prices, showed that inflationary pressures were still somewhat elevated to start the new year. The 3-month annualized percentage change in core CPI was back at 3% in February after briefly falling in the post-shutdown period (Chart 1). With energy prices rising sharply and tariff cost passthrough still occurring in the background, elevated inflation pressures are likely to keep the Federal Reserve cautious moving forward. As of the time of writing, financial markets have priced in a one-third chance of the Federal Reserve remaining on hold through this year.
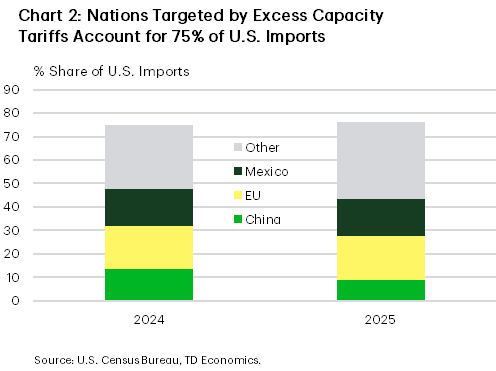
On the tariff front, U.S. Trade Representative Greer announced several new Section 301 tariff investigations covering dozens of countries this week. Section 301 tariffs are imposed against nations engaging in unfair/anti-competitive trading practices which disadvantage U.S. commerce. The first investigation announced on Wednesday relates to “structural excess capacity and production in manufacturing” which will target 15 countries and the E.U. The targeted countries account for roughly 75% of U.S. imports, with the E.U., Mexico, and China accounting for 40-50 percentage-points of that share (Chart 2). The other Section 301 tariff investigations relate to the failure of foreign nations to effectively prohibit the importation of goods produced using forced labor and targets the 60 largest U.S. trading partners. With the global 10% Section 122 tariff imposed last month set to expire at the end of July, the administration is likely to expedite these investigations to create a new tariff regime roughly equivalent to what was in place before the IEEPA tariffs were stuck down.
Looking ahead to next week, the Federal Reserve is widely expected to hold rates steady. However, investors will be keenly watching for their views on the balance of risks amid the spike in oil prices and elevated uncertainty. The labor market has weakened in recent months, but inflation pressures appear likely to keep inflation well above 2% through the year. Chairman Powell is likely to reiterate the data dependency of the FOMC and the need for patience to monitor the sustainability of emerging trends.
International Week Ahead
International Week Ahead
- European Central Bank: Focus On Communication, Not Near-Term Action
- Bank of Canada: On Hold, Policy Asymmetry Shift Away from Near-Term Easing
- Bank of Japan: Tightening Bias Intact, Yet Bar for Immediate Action Is High
- Canada CPI: Large Drop in Headline Inflation Reflects Base Effects
- Bank of England Bank Rate: On Hold, Easing Not Over
- Reserve Bank of Australia Cash Rate: Rate Hike Likely Brought Forward
- Brazilian Central Bank Selic Rate: Tempered Easing to Start
G10
European Central Bank Policy Rate Decision • (3/19)
Focus on Communication/Updated Staff Forecasts, Not Near-Term Action
February inflation surprised to the upside, driven by core components (firmer services, fading goods disinflation, hotter food and a diminished energy drag). The recent oil shock shifts risks away from undershooting inflation toward guarding against persistence. European Central Bank (ECB) staff forecasts should show meaningful upward revisions to 2026 inflation, with any lift to 2027 a key signal for second round effects. Activity looks more resilient than feared, but confidence remains fragile amid geopolitics, trade uncertainty and energy volatility. Expect a less relaxed tone, potentially retiring the long-standing “policy in a good place” language. This is intended to harden rhetoric without signaling imminent rate moves. Overall, we expect optionality to be preserved, but the asymmetry has shifted away from cuts. If energy prices remain elevated, H2 tightening risk creeps back into the distribution, even if near term action is unlikely. Financial conditions have already tightened via repricing in rates. We expect the euro may be negatively correlated with the oil shock as growth headwinds offset firmer rate expectations.
Bank of Canada Policy Rate Decision • (3/18)
On Hold, but Policy Asymmetry Has Shifted Away from Near-Term Easing
We expect the Bank of Canada (BoC) to leave rates unchanged at this meeting. March is too early for a material change in guidance, particularly with USMCA related trade risks still unresolved. That said, the tone should be less dovish than in recent months. The bar for additional cuts has risen, and the BoC is likely to emphasize two-sided risks rather than a clean easing bias. The external impulse from higher oil prices is a game changer relative to our previous views. We detailed this change in our recent Monthly. If sustained, higher energy prices support nominal income, bolster parts of the growth mix and keep inflation uncomfortably above target. This undermines the earlier logic for Q2–Q3 cuts that rested on soft labor markets, trade exposed sectors and easing underlying inflation. While core inflation had been cooling, the energy shock raises the risk of renewed persistence, especially via headline inflation and inflation expectations. On growth, Canada is relatively insulated versus other advanced economies given its energy exposure, which reduces downside risks relative to peers. The BoC is likely to frame policy as “wait-and-see,” stressing data dependence and uncertainty around the durability of the oil move. Importantly, the asymmetry now points away from cuts. Even if energy prices retrace modestly near term, the threshold for restarting easing is higher than it was earlier this year. We no longer expect near-term cuts, and our baseline now incorporates a 25 bps hike in Q3-2026, with scope for more if oil prices extend higher, USMCA risks fail to materialize (i.e., tariff weighted averages remain broadly unchanged) and/or fiscal rollout accelerates. The shift in policy asymmetry should be mildly supportive for front-end Canada rates and limits downside for the CAD, especially against currencies where policy trade-offs are acute and growth risks severe.
Bank of Japan Policy Rate Decision • (3/19)
Tightening Bias Intact, yet Bar for Immediate Action Is High
We expect the Bank of Japan (BoJ) to keep rates unchanged at this meeting. While recent market pricing and JPY dynamics keep March “in play,” the BoJ is more likely to use this meeting to reinforce its normalization bias. Communication should lean on gradualism, data dependence and vigilance around FX and financial conditions. Business activity has improved, with manufacturing and services indicators firming, but household demand remains fragile as real wage growth is only slowly stabilizing. Inflation has eased from recent peaks, yet core and underlying measures remain at or above target, leaving the BoJ comfortable that underlying inflation dynamics are broadly consistent with its objective. JPY weakness and JGB volatility remain key constraints. The BoJ is acutely sensitive to the risk that prolonged inaction could reignite currency depreciation and undermine policy credibility. That said, with the JPY relatively range bound in recent weeks and market conditions somewhat calmer, the urgency to act immediately has diminished. We continue to expect one additional hike later this year, with the timing skewed toward the latter part of the year (October). An earlier move would require clearer signs of renewed JPY dislocation and/or a further acceleration in services inflation and wage growth, while a delay would be more likely if growth softens again and inflation persistence fades. A hold with hawkish leaning guidance should limit near term downside in the JPY, but absent concrete action, the currency is likely to remain on a depreciating trend, pressured by a large negative terms-of-trade shock, weak fiscal dynamics and a still wide rate gap with the US.
Canada February CPI • (3/16)
Large Drop in Headline Inflation Reflects Base Effects
We expect headline inflation in February to decline to 1.8% year-over-year from 2.3% in January. This largely reflects base effects related to the GST/HST holiday related boost last year as month-over-month inflation is expected to accelerate to 0.6% month-over-month from a flat reading in the previous month. We expect underlying core inflation to continue to moderate with weighted median and trimmed mean inflation moving down to 2.4% and 2.3% year-over-year, respectively. If oil prices evolve as suggested by futures markets, the potential boost to Canada inflation is likely to be sizable—adding up to 1pp to headline inflation over a 1-year horizon. We expect most of this inflationary impulse to pass through into year-end 2026. Greater persistent in oil prices and/or higher levels imply a much larger inflationary surge. For example, if oil prices average above $130/bbl, the boost to inflation is in excess of 3pp. We recently upgraded our Canada inflation forecast for 2026 and 2027 higher to 2.4% and 2.3% from 1.6% and 2.0%, respectively (see here).
Reserve Bank of Australia Policy Rate Decision • (03/17)
Rate Hike Likely Brought Forward
We expect the Reserve Bank of Australia (RBA) to raise the cash rate by 25 bps to 4.10% at next week’s meeting, marking the second hike this year after February and pulling forward our previous expectation of a May move. While uncertainty tied to Middle East tensions and higher energy prices will factor into the decision, this is largely a domestic inflation story, with inflation trending higher since Q2-2025 and January headline and trimmed mean readings of 3.8% year-over-year and 3.4%, both exceeding expectations. With solid growth, low unemployment and rising inflation expectations, the RBA has scope to respond to mounting price pressures. We expect this to be the final hike as growth slows, though risks skew toward further tightening if inflation continues to rise, labor markets tighten further or higher oil prices and geopolitical uncertainty persist.
Bank of England Policy Rate Decision • (03/19)
On Hold, Easing Not Over
Next week, when the Bank of England (BoE) announces its latest policy decision, we expect the Bank Rate to remain unchanged at 3.75%, marking a shift from our prior call for a cut. This change does not reflect a view that easing is over but rather that elevated uncertainty may lead the Monetary Policy Committee to proceed cautiously until there is greater clarity on the duration of Middle East conflict and higher energy prices. The meeting comes without updated forecasts or a press conference and we expect neutral forward guidance that preserves optionality for the BoE. Given subdued growth, as reinforced by January’s GDP data, and elevated unemployment, we look for rate cuts in Q2 and Q3, taking Bank Rate to 3.25%, though risks are skewed toward a longer hold, not tightening, if the conflict persists.
EM
Brazilian Central Bank Policy Rate Decision • (03/18)
Tempered Easing to Start
We expect the Brazilian Central Bank (BCB) to begin its easing cycle with a 25 bps cut next week, taking the Selic Rate to 14.75%. Even before the Middle East conflict, election‑related fiscal risks and BRL volatility underpinned our more cautious view on easing. Pre-election populism alongside Lula's still competitive polling is likely to strain Brazil's limited fiscal flexibility and renew pressure on local financial markets. While higher oil prices can be a net positive for Brazil’s economy (keeping near-term growth prospects supported), the sharp rise in energy prices will keep inflation expectations uncomfortably elevated for policymakers. Lingering fiscal concerns and evidence of economic resilience pre-Iran reinforces our view for a more gradual and tempered BCB monetary easing cycle than forecast by economists' consensus. We forecast BCB's policy rate at 13.25% by end-2026 vs. 12.125% median forecast per the BCB's FOCUS Survey. Market expectations for the policy rate have moved higher in recent days with interest rate futures suggesting 13.5% by year-end vs. 12.16% at the start of March. Risk premium in interest rate markets may continue to widen as oil moves higher, inflation expectations show signs of becoming de-anchored and/or economic populism efforts are renewed.
U.S. Weekly Economic & Financial Commentary
Summary
U.S. Week In Review
- Nearly two weeks into the conflict with Iran, energy prices have surged, adding fresh inflation risk to an already fragile backdrop. Recent CPI and PCE data show further progress on inflation stalling out, driven in part by rising energy and goods prices, with March energy inflation expected to spike sharply if gasoline prices remain elevated. Housing activity remains subdued due to affordability constraints, as higher mortgage rates and soft single‑family demand offset pockets of strength in multifamily construction, while small business sentiment has weakened modestly. For the Fed, the uncertain inflation and labor market outlook reinforces a data‑dependent stance, with two rate cuts still our expectation this year, though persistently high oil prices and rising inflation expectations could delay or reduce future easing.
U.S. Week Ahead
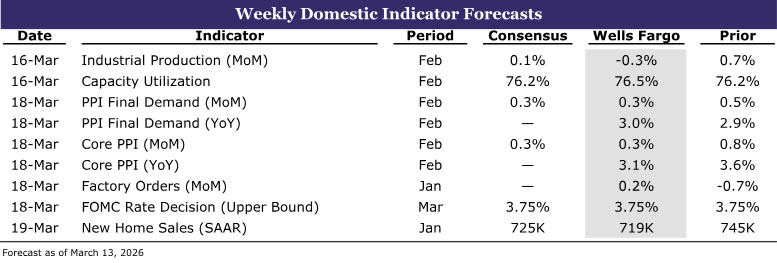
- The FOMC meeting will be the focal point next week, as intensifying stagflation risks put the Fed’s dual mandate in tension. We expect the Committee to hold rates steady and emphasize optionality, with the updated SEP likely to show that expectations for slightly higher inflation and lower growth will net out to an unchanged policy path. Elsewhere, activity in interest rate sensitive sectors remains touch and go; we forecast industrial production slipped in February and new home sales rose in January.
U.S. Week in Review
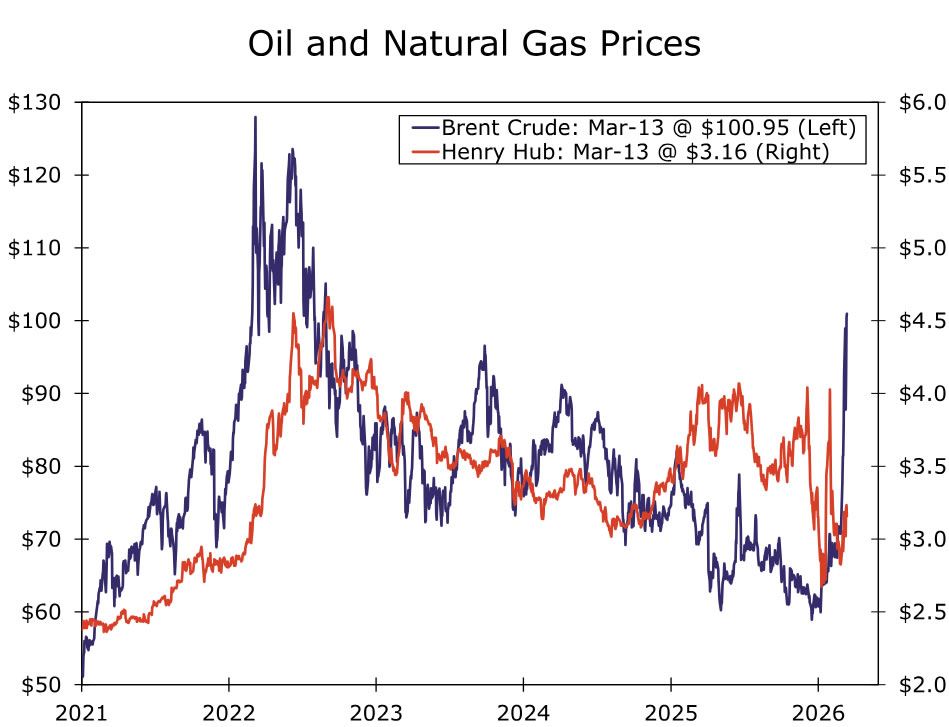
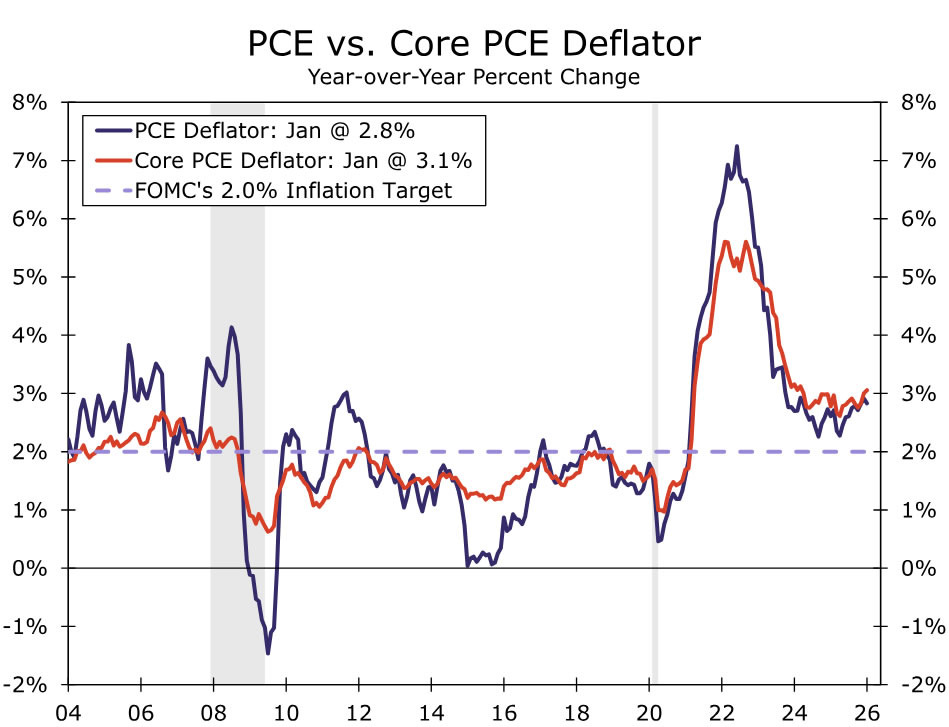
It has been almost two weeks since the start of the conflict with Iran, and since then, oil prices have been very volatile. As we go to print, the price of Brent crude has risen $32 since the U.S. strikes, or about 46% above its February average. Henry Hub natural gas prices are also up 4% in the wake of the strikes. The surge in oil prices introduces fresh risk to an already complicated economic environment. A renewed rise in energy prices is especially troublesome for inflation, which has stalled on its progress back toward 2%. We got fresh CPI data this week, which showed that headline inflation rose 0.3% in February, leaving the year-over-year rate at 2.4% but pushing the more recent three-month annualized pace up to 3.0%. Energy prices rose 0.6% in February, driven primarily by a solid 1.1% gain in energy goods. Oil and gas prices were already rising in February in anticipation of a conflict in the Middle East, underpinning the strength, and we anticipate this will only further strengthen in March. Assuming the cost of regular gas averages $3.65 per gallon for the rest of this month, we estimate energy goods will rise a more jarring ~18% month-over-month in March. Core CPI increased a moderate 0.22%, with softer vehicle prices offset by firmer gains in tariff-exposed goods such as apparel and household furnishings, while core services rose 0.3%, led by travel and medical services. Inflation pressures appear more stubborn in the PCE deflator, the Fed's preferred inflation metric. Headline PCE rose 0.3% over the month and 2.8% over the year in January, while core PCE rose 0.4%, lifting the year-ago rate a tenth to 3.1%. We estimate both headline and core measures to rise around 0.4% in February.
On the housing front, housing starts jumped 7.2% in January, though this was driven by a surge in multifamily starts. Underlying details painted a weaker picture as single‑family starts declined and permits fell. Builder confidence deteriorated amid slowdowns in buyer traffic and a weakening in sales expectations. That said, there remains scope for improvement in multifamily development, driven primarily by single-family affordability challenges and thinning apartment supply. Affordability remains a significant hurdle for home sales, and this was apparent in the existing home sales print for February. Though existing home sales rose 1.7% to a 4.09 million-unit pace in February, sales remain notably below the trend in late 2025. Mortgage rates remain elevated around 6.0%-6.1%, and inventories remain strong. Overall, home buying is likely to slowly improve over the course of the year, but likely should continue to run at a sluggish rate due to the adverse affordability conditions.
Small business sentiment softened for a second month as firms pared back hiring and capex plans, though optimism about broader economic conditions remained relatively constructive, supported by solid earnings and sales. Meanwhile, trade data continue to be distorted by investment‑related flows such as non‑monetary gold. These data won't translate directly to what is included in GDP accounting, and thus the $18.4 billion narrowing in the January trade deficit overstates the growth impact. Strong demand for high-tech-related products has propped up imports, though non-monetary gold accounted for roughly 40% of the overall drop in imports over the month. We expect the trade deficit to widen over the course of the year due to pent-up import demand and near-term clarity on tariffs.
It is times like these that justify the mantra of "data-dependence" for policymakers at the Fed. Given the inflation data from this week are a bit more dated than is typical when heading into the March meeting, we expect they do little to sway the hawks, doves, and undecideds one way or another. Policymakers are likely to focus instead on the uncertain outlook for energy prices and the broader inflation outlook in light of the developing conflict with Iran. On face value, the Fed is likely to look through a temporary energy-driven increase in inflation. However, inflation expectations are highly sensitive to energy prices, and sustained upward pressure on inflation could narrow the margin for additional easing and delay future rate cuts, particularly if labor market cooling continues to be gradual. For now, our base case forecast remains two 25 bps rate cuts at the June and September FOMC meetings. That said, the longer oil prices remain elevated, the more difficult that may be to realize.
U.S. Week Ahead
Industrial Production • Monday
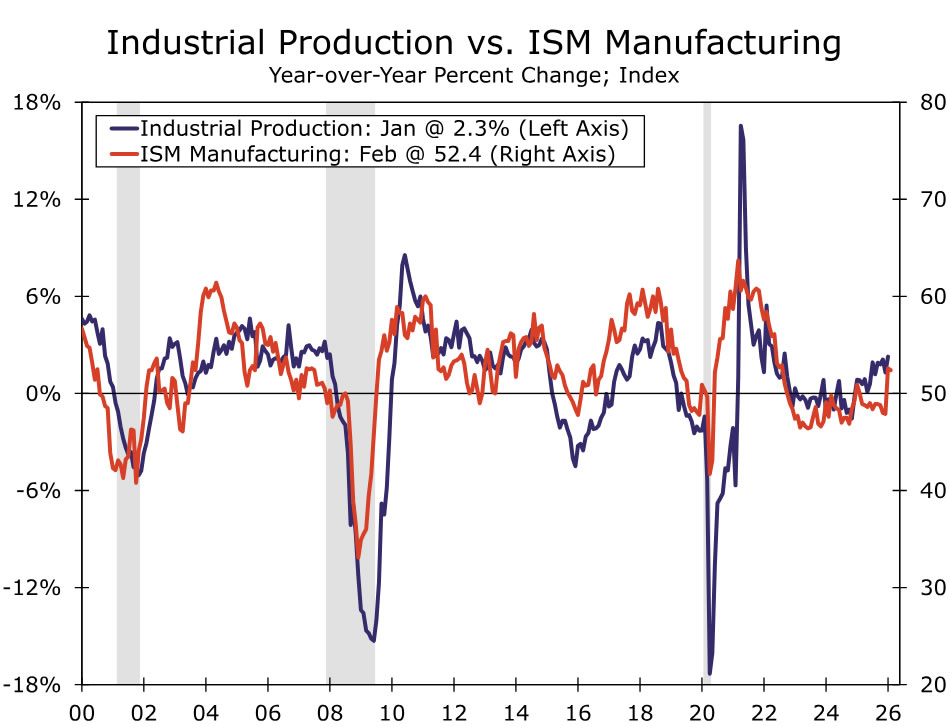
The manufacturing backdrop remains touch and go amid elevated uncertainty. We have long expected a rebound in broad manufacturing activity this year as firms begin to reengage sidelined capital spending plans that were delayed by tariffs, but the latest conflict in Iran introduces new downside risks to that outlook. Recent industrial data point to modest improvement at the margin, though growth continues to be driven primarily by high-tech-related investment rather than more traditional areas of capex.
That said, pent-up demand for conventional capital spending, combined with a recent easing in tariff pressures following the ruling against IEEPA tariffs and the maintenance of a 10% baseline tariff, could support a gradual pickup in activity. February ISM manufacturing edged down just 0.2 points to 52.4 but remained in expansion territory, supported by strength in new orders, production and supplier deliveries. Against this backdrop, we expect industrial production slipped modestly in February, down 0.3%.
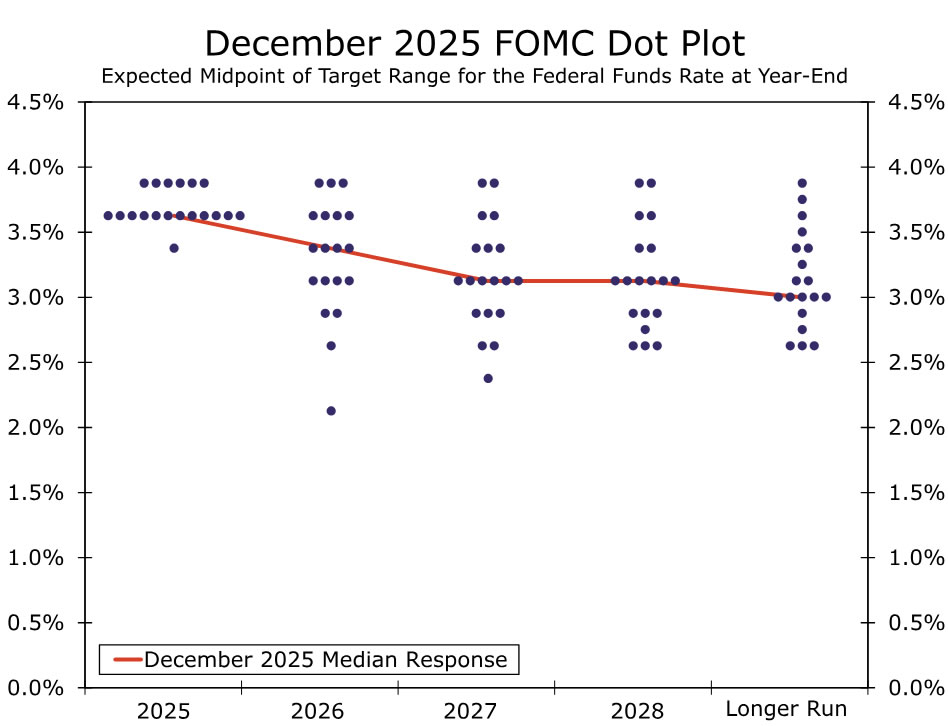
FOMC • Wednesday
Stagflation risks have increased since January, putting the FOMC’s dual mandate in tension. Volatile energy prices tied to the Iran conflict have induced uncertainty, but the net signal from recent data is little changed: the labor market is still muddling along, and PCE inflation remains stuck near 3%. We expect the Committee to hold rates steady next week and lean heavily on optionality, emphasizing that higher uncertainty argues for a data-dependent approach.
The Summary of Economic Projections (SEP) should tilt modestly in a stagflationary direction, with higher inflation forecasts extending into 2027, and slightly lower GDP projections and modestly higher unemployment rate expectations for 2026. We expect the median dot for the federal funds rate to remain unchanged, as the risks of higher inflation and lower growth are likely to offset each other. Our forecast continues to call for two 25 bps cuts in June and September, alongside a well‑telegraphed slowdown in balance sheet runoff that should have minimal impact on longer-term interest rates.
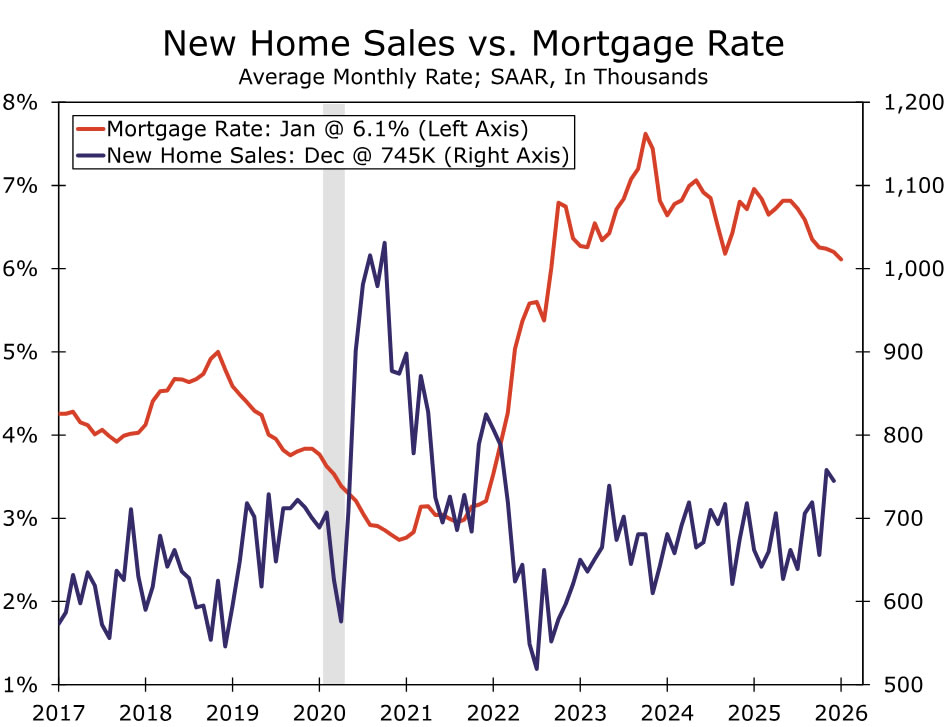
New Home Sales • Thursday
New home sales are gaining momentum. After averaging a 660K annual pace through the first half of 2025, which was slightly below the year prior, the average pace of transactions jumped to 751K in November and December. Lower mortgage rates appear to be a main driver. The average 30-year fixed rate fell from 7.0% in January 2025 to 6.2% in December and have since slid further to 6.0%. Furthermore, approximately two-thirds of builders are using incentives like price cuts and mortgage rate buy-downs to offset macro challenges, an elevated share compared to recent history.
Harsh winter weather likely prompted some giveback in January. However, price cuts and lower mortgage rates are likely to sustain a healthy overall pace of transactions. We forecast that 2026 started off with a 719K annual sales rate in January, which would be near the upper end of new home sales’ overall range last year.
We expect that new home sales will sustain this momentum over the course of 2026. Builder incentives will likely continue to buttress new home sales in the year ahead. We also anticipate an average 30-year mortgage rate of around 6.1% this year, still elevated but below the 6.6% average in 2025. That said, lofty inventory-to-sales ratios will likely preclude a corresponding pickup in single-family construction.
Canadian Inflation Print Unlikely to Sway BoC from Keeping Rates on Hold
It’s a busy week ahead for Canadian economic releases, highlighted by the February inflation report on Monday and the Bank of Canada’s interest rate decision on Wednesday.
Canada’s national balance sheet accounts will also be released on Monday, providing an updated snapshot of household and financial sector health.
The BoC will be watching the Consumer Price Index report closely ahead of its policy decision, but we expect a tick lower in headline CPI growth to 2% (right at the 2% inflation target) in February won’t sway the central bank to move from the sidelines.
Recent inflation readings have been distorted higher by the GST/HST tax holiday a year ago, which temporarily lowered price levels, and the removal of the consumer carbon tax from energy prices last April that continues to lower year-over-year energy prices.
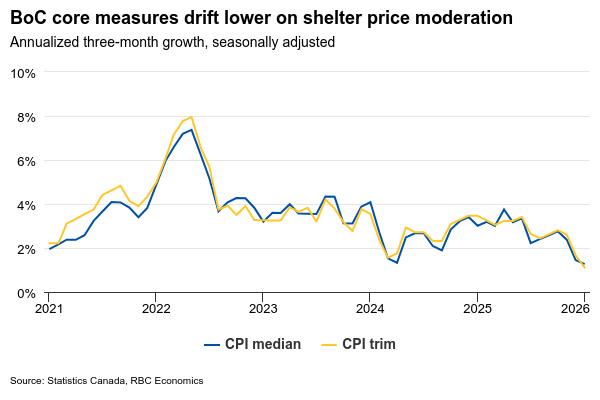
The BoC’s “core” median and trim measures control for tax changes, and have also been drifting lower to 2.5% on average in January, but driven largely by moderation in shelter price growth. Core services excluding shelter growth was still above 3% in January by our count.
Pockets of price growth remain elevated, particularly groceries still up almost 5% from a year ago in January. The drag from lower energy prices in recent months will reverse as oil prices spike higher due to conflict in the Middle East.
Recent labour market data shows mixed signals with some near-term softness but underlying conditions that support gradual improvement ahead. Employment fell 84,000 in February, adding to January’s 25,000 decline, with full-time positions bearing the brunt of losses. The unemployment rate rose to 6.7% in February from 6.5% in January, though it remains below the Q4/25 average of 6.8% and well below the recent peak of 7.1% in September.
As a result, we do not expect the BoC to make changes to the policy rate at Wednesday’s meeting. Our base case forecast also assumes the policy rate remains unchanged for the remainder of 2026 as inflation continues to trend lower toward target.
Data summary:
We expect the national balance sheet account for Q4 2025 to show household net worth continued upward, bolstered by ongoing equity market gains, albeit at a more moderate pace than robust Q3. The S&P/TSX Composite Index advanced 5.6% during the period, following an 11.8% surge in the previous three months. Nevertheless, a portion of these gains was likely offset by persistent declines in property values with the CREA Home Price Index falling 2.2%, maintaining deterioration similar to earlier periods. The debt service ratio probably decreased in Q4, driven by rising personal disposable income and reduced household non-mortgage borrowing.
Attention will also be on the U.S. Federal Reserve’s policy decision on Wednesday. The Fed held rates steady earlier this year, and recent U.S. data suggests labour market conditions continue to stabilize. We expect the Fed to keep rates unchanged through 2026.
Next Friday, we’ll get Canadian January retail sales, providing some indications of spending momentum in early 2026. Statistics Canada’s advance retail indicator released a month ago indicated sales increased 1.5% in January, reversing the decline in the prior month.
DXY: Bulls Remain Fueled by Strong Safe-Haven Demand and Crack Key $100 Resistance Zone
The dollar keeps firm tone and remains on track to complete the second week of steep rally, acting as a major safe-haven asset in the situation of risk aversion.
Higher oil prices on escalating war in the Middle East threat of fresh rise of inflation that also underpins the greenback, as the Fed is unlikely to cut interest rates, as initially expected, but may opt for holding rates or fresh policy tightening.
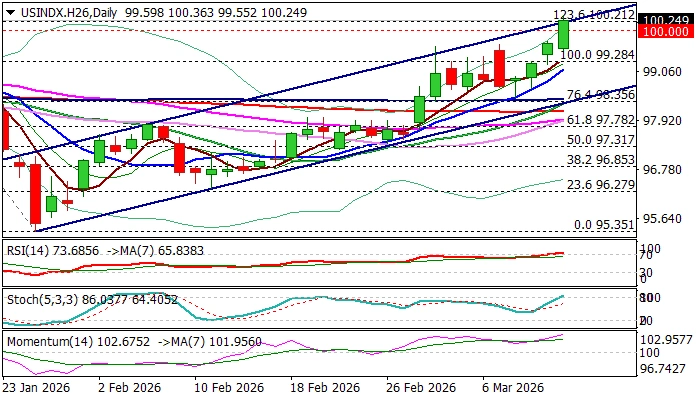
Friday’s rally (index was up nearly 0.7% until mid-US session) broke through key barriers in $100 zone (former top at $99.64 / psychological), as well as the upper boundary of bull-channel from $95.35 ($100.23) and cracked 2025 peak at $100.32, after bulls penetrated falling and thick weekly Ichimoku cloud (base lays at $99.28).
Close above these levels to validate fresh signal of reversal and open way for stronger recovery of larger $110.00/$95.35 downtrend, with Fibo 38.2% retracement ($100.94) marking next significant barrier.
Bullish daily studies (10/100DMA and 20/200DMA bull crosses / strong positive momentum) contribute to supportive fundamental components, though overbought conditions should be anticipated.
Broken $100 level reverts to immediate support, with deeper dips to find firm ground at $99.60/30 zone and keep larger bulls in play.
Res: 100.50; 100.94; 101.25; 101.71
Sup: 100.00; 99.60; 99.30; 99.09
Summary 3/16 – 3/20
Monday, Mar 16, 2026
| GMT | Ccy | Events | Cons | Prev |
|---|---|---|---|---|
| 21:30 | NZD | Business NZ PSI Feb | 50.9 | |
| 02:00 | CNY | Industrial Production Y/Y Feb | 5.10% | 5.20% |
| 02:00 | CNY | Retail Sales Y/Y Feb | 2.50% | 0.90% |
| 02:00 | CNY | Fixed Asset Investment (YTD) Y/Y Feb | -2.10% | -3.80% |
| 12:15 | CAD | Housing Starts Y/Y Feb | 243K | 238K |
| 12:30 | CAD | CPI M/M Feb | 0.60% | 0.00% |
| 12:30 | CAD | CPI Y/Y Feb | 1.90% | 2.30% |
| 12:30 | CAD | CPI Median Y/Y Feb | 2.40% | 2.50% |
| 12:30 | CAD | CPI Trimmed Y/Y Feb | 2.40% | 2.40% |
| 12:30 | CAD | CPI Common Y/Y Feb | 2.60% | 2.70% |
| 12:30 | USD | Empire State Manufacturing Mar | 3.8 | 7.1 |
| 13:15 | USD | Industrial Production M/M Feb | 0.20% | 0.70% |
| 13:15 | USD | Capacity Utilization Feb | 76.30% | 76.20% |
| 14:00 | USD | NAHB Housing Market Index Mar | 37 | 36 |
| 21:30 | NZD |
| Business NZ PSI Feb | |
| Consensus | |
| Previous | 50.9 |
| 02:00 | CNY |
| Industrial Production Y/Y Feb | |
| Consensus | 5.10% |
| Previous | 5.20% |
| 02:00 | CNY |
| Retail Sales Y/Y Feb | |
| Consensus | 2.50% |
| Previous | 0.90% |
| 02:00 | CNY |
| Fixed Asset Investment (YTD) Y/Y Feb | |
| Consensus | -2.10% |
| Previous | -3.80% |
| 12:15 | CAD |
| Housing Starts Y/Y Feb | |
| Consensus | 243K |
| Previous | 238K |
| 12:30 | CAD |
| CPI M/M Feb | |
| Consensus | 0.60% |
| Previous | 0.00% |
| 12:30 | CAD |
| CPI Y/Y Feb | |
| Consensus | 1.90% |
| Previous | 2.30% |
| 12:30 | CAD |
| CPI Median Y/Y Feb | |
| Consensus | 2.40% |
| Previous | 2.50% |
| 12:30 | CAD |
| CPI Trimmed Y/Y Feb | |
| Consensus | 2.40% |
| Previous | 2.40% |
| 12:30 | CAD |
| CPI Common Y/Y Feb | |
| Consensus | 2.60% |
| Previous | 2.70% |
| 12:30 | USD |
| Empire State Manufacturing Mar | |
| Consensus | 3.8 |
| Previous | 7.1 |
| 13:15 | USD |
| Industrial Production M/M Feb | |
| Consensus | 0.20% |
| Previous | 0.70% |
| 13:15 | USD |
| Capacity Utilization Feb | |
| Consensus | 76.30% |
| Previous | 76.20% |
| 14:00 | USD |
| NAHB Housing Market Index Mar | |
| Consensus | 37 |
| Previous | 36 |
Tuesday, Mar 17, 2026
| GMT | Ccy | Events | Cons | Prev |
|---|---|---|---|---|
| 03:30 | AUD | RBA Interest Rate Decision | 4.10% | 3.85% |
| 04:30 | AUD | RBA Press Conference | ||
| 04:30 | JPY | Tertiary Industry Index M/M Jan | 0.70% | -0.50% |
| 07:30 | CHF | Producer and Import Prices M/M Feb | 0.00% | -0.20% |
| 07:30 | CHF | Producer and Import Prices Y/Y Feb | -2.20% | |
| 10:00 | EUR | Germany ZEW Economic Sentiment Mar | 39 | 58.3 |
| 10:00 | EUR | Germany ZEW Current Situation Mar | -67.1 | -65.9 |
| 10:00 | EUR | Eurozone ZEW Economic Sentiment Mar | 24.3 | 39.4 |
| 14:00 | USD | Pending Home Sales M/M Feb | -1.00% | -0.80% |
| 03:30 | AUD |
| RBA Interest Rate Decision | |
| Consensus | 4.10% |
| Previous | 3.85% |
| 04:30 | AUD |
| RBA Press Conference | |
| Consensus | |
| Previous | |
| 04:30 | JPY |
| Tertiary Industry Index M/M Jan | |
| Consensus | 0.70% |
| Previous | -0.50% |
| 07:30 | CHF |
| Producer and Import Prices M/M Feb | |
| Consensus | 0.00% |
| Previous | -0.20% |
| 07:30 | CHF |
| Producer and Import Prices Y/Y Feb | |
| Consensus | |
| Previous | -2.20% |
| 10:00 | EUR |
| Germany ZEW Economic Sentiment Mar | |
| Consensus | 39 |
| Previous | 58.3 |
| 10:00 | EUR |
| Germany ZEW Current Situation Mar | |
| Consensus | -67.1 |
| Previous | -65.9 |
| 10:00 | EUR |
| Eurozone ZEW Economic Sentiment Mar | |
| Consensus | 24.3 |
| Previous | 39.4 |
| 14:00 | USD |
| Pending Home Sales M/M Feb | |
| Consensus | -1.00% |
| Previous | -0.80% |
Wednesday, Mar 18, 2026
| GMT | Ccy | Events | Cons | Prev |
|---|---|---|---|---|
| 21:45 | NZD | Current Account (NZD) Q4 | -4.85B | -8.37B |
| 23:30 | AUD | Westpac Leading Index M/M Feb | -0.04% | |
| 23:50 | JPY | Trade Balance (JPY) Feb | -0.61T | 0.46T |
| 08:00 | CHF | SECO Economic Forecasts | ||
| 10:00 | EUR | Eurozone CPI Y/Y Feb F | 1.90% | 1.90% |
| 10:00 | EUR | Eurozone Core CPI Y/Y Feb F | 2.40% | 2.40% |
| 12:30 | USD | PPI M/M Feb | 0.30% | 0.50% |
| 12:30 | USD | PPI Y/Y Feb | 2.90% | 2.90% |
| 12:30 | USD | PPI Core M/M Feb | 0.30% | 0.80% |
| 12:30 | USD | PPI Core Y/Y Feb | 3.70% | 3.60% |
| 13:45 | CAD | BoC Interest Rate Decision | 2.25% | 2.25% |
| 14:00 | USD | Factory Orders M/M Jan | 0.40% | -0.70% |
| 14:30 | USD | Crude Oil Inventories (Mar 13) | -1.5M | 3.8M |
| 18:00 | USD | Fed Interest Rate Decision | 3.75% | 3.75% |
| 18:30 | USD | FOMC Press Conference |
| 21:45 | NZD |
| Current Account (NZD) Q4 | |
| Consensus | -4.85B |
| Previous | -8.37B |
| 23:30 | AUD |
| Westpac Leading Index M/M Feb | |
| Consensus | |
| Previous | -0.04% |
| 23:50 | JPY |
| Trade Balance (JPY) Feb | |
| Consensus | -0.61T |
| Previous | 0.46T |
| 08:00 | CHF |
| SECO Economic Forecasts | |
| Consensus | |
| Previous | |
| 10:00 | EUR |
| Eurozone CPI Y/Y Feb F | |
| Consensus | 1.90% |
| Previous | 1.90% |
| 10:00 | EUR |
| Eurozone Core CPI Y/Y Feb F | |
| Consensus | 2.40% |
| Previous | 2.40% |
| 12:30 | USD |
| PPI M/M Feb | |
| Consensus | 0.30% |
| Previous | 0.50% |
| 12:30 | USD |
| PPI Y/Y Feb | |
| Consensus | 2.90% |
| Previous | 2.90% |
| 12:30 | USD |
| PPI Core M/M Feb | |
| Consensus | 0.30% |
| Previous | 0.80% |
| 12:30 | USD |
| PPI Core Y/Y Feb | |
| Consensus | 3.70% |
| Previous | 3.60% |
| 13:45 | CAD |
| BoC Interest Rate Decision | |
| Consensus | 2.25% |
| Previous | 2.25% |
| 14:00 | USD |
| Factory Orders M/M Jan | |
| Consensus | 0.40% |
| Previous | -0.70% |
| 14:30 | USD |
| Crude Oil Inventories (Mar 13) | |
| Consensus | -1.5M |
| Previous | 3.8M |
| 18:00 | USD |
| Fed Interest Rate Decision | |
| Consensus | 3.75% |
| Previous | 3.75% |
| 18:30 | USD |
| FOMC Press Conference | |
| Consensus | |
| Previous | |
Thursday, Mar 19, 2026
| GMT | Ccy | Events | Cons | Prev |
|---|---|---|---|---|
| 21:45 | NZD | GDP Q/Q Q4 | 0.40% | 1.10% |
| 23:50 | JPY | Machinery Orders M/M Jan | -9.50% | 19.10% |
| 00:30 | AUD | Employment Change Feb | 20.0K | 17.8K |
| 00:30 | AUD | Unemployment Rate Feb | 4.10% | 4.10% |
| 02:46 | JPY | BoJ Interest Rate Decision | 0.75% | 0.75% |
| 04:30 | JPY | Industrial Production M/M Jan | 2.20% | 2.20% |
| 07:00 | GBP | Claimant Count Change Feb | 25.8K | 28.6K |
| 07:00 | GBP | ILO Unemployment Rate (3M) Jan | 5.20% | 5.20% |
| 07:00 | GBP | Average Earnings Excluding Bonus 3M/Y Jan | 4.00% | 4.20% |
| 07:00 | GBP | Average Earnings Including Bonus 3M/Y Jan | 3.90% | 4.20% |
| 08:30 | CHF | SNB Interest Rate Decision | 0.00% | 0.00% |
| 09:00 | CHF | SNB Press Conference | ||
| 12:00 | GBP | BoE Interest Rate Decision | 3.75% | 3.75% |
| 12:00 | GBP | MPC Official Bank Rate Votes | 0--3--6 | 0--4--5 |
| 12:30 | USD | Initial Jobless Claims (Mar 13) | 215K | 213K |
| 12:30 | USD | Philadelphia Fed Manufacturing Survey Mar | 17.5 | 16.3 |
| 13:15 | EUR | ECB Main Refinancing Rate | 2.15% | 2.15% |
| 13:15 | EUR | ECB Deposit Rate | 2.00% | 2.00% |
| 13:45 | EUR | ECB Press Conference | ||
| 14:00 | USD | New Homeles Jan | 725K | 745K |
| 14:00 | USD | Wholele Inventories Jan F | 0.20% | 0.20% |
| 14:30 | USD | Natural Gas Storage (Mar 13) | 39B | -38B |
| 21:45 | NZD |
| GDP Q/Q Q4 | |
| Consensus | 0.40% |
| Previous | 1.10% |
| 23:50 | JPY |
| Machinery Orders M/M Jan | |
| Consensus | -9.50% |
| Previous | 19.10% |
| 00:30 | AUD |
| Employment Change Feb | |
| Consensus | 20.0K |
| Previous | 17.8K |
| 00:30 | AUD |
| Unemployment Rate Feb | |
| Consensus | 4.10% |
| Previous | 4.10% |
| 02:46 | JPY |
| BoJ Interest Rate Decision | |
| Consensus | 0.75% |
| Previous | 0.75% |
| 04:30 | JPY |
| Industrial Production M/M Jan | |
| Consensus | 2.20% |
| Previous | 2.20% |
| 07:00 | GBP |
| Claimant Count Change Feb | |
| Consensus | 25.8K |
| Previous | 28.6K |
| 07:00 | GBP |
| ILO Unemployment Rate (3M) Jan | |
| Consensus | 5.20% |
| Previous | 5.20% |
| 07:00 | GBP |
| Average Earnings Excluding Bonus 3M/Y Jan | |
| Consensus | 4.00% |
| Previous | 4.20% |
| 07:00 | GBP |
| Average Earnings Including Bonus 3M/Y Jan | |
| Consensus | 3.90% |
| Previous | 4.20% |
| 08:30 | CHF |
| SNB Interest Rate Decision | |
| Consensus | 0.00% |
| Previous | 0.00% |
| 09:00 | CHF |
| SNB Press Conference | |
| Consensus | |
| Previous | |
| 12:00 | GBP |
| BoE Interest Rate Decision | |
| Consensus | 3.75% |
| Previous | 3.75% |
| 12:00 | GBP |
| MPC Official Bank Rate Votes | |
| Consensus | 0--3--6 |
| Previous | 0--4--5 |
| 12:30 | USD |
| Initial Jobless Claims (Mar 13) | |
| Consensus | 215K |
| Previous | 213K |
| 12:30 | USD |
| Philadelphia Fed Manufacturing Survey Mar | |
| Consensus | 17.5 |
| Previous | 16.3 |
| 13:15 | EUR |
| ECB Main Refinancing Rate | |
| Consensus | 2.15% |
| Previous | 2.15% |
| 13:15 | EUR |
| ECB Deposit Rate | |
| Consensus | 2.00% |
| Previous | 2.00% |
| 13:45 | EUR |
| ECB Press Conference | |
| Consensus | |
| Previous | |
| 14:00 | USD |
| New Homeles Jan | |
| Consensus | 725K |
| Previous | 745K |
| 14:00 | USD |
| Wholele Inventories Jan F | |
| Consensus | 0.20% |
| Previous | 0.20% |
| 14:30 | USD |
| Natural Gas Storage (Mar 13) | |
| Consensus | 39B |
| Previous | -38B |
Friday, Mar 20, 2026
| GMT | Ccy | Events | Cons | Prev |
|---|---|---|---|---|
| 21:45 | NZD | Trade Balance (NZD) Feb | -740M | -519M |
| 01:15 | CNY | 1-Y Loan Prime Rate | 3.00% | 3.00% |
| 01:15 | CNY | 5-Y Loan Prime Rate | 3.50% | 3.50% |
| 07:00 | GBP | Public Sector Net Borrowing (GBP) Feb | 8.6B | -30.4B |
| 07:00 | EUR | Germany PPI M/M Feb | 0.30% | -0.60% |
| 07:00 | EUR | Germany PPI Y/Y Feb | -2.70% | -3.00% |
| 09:00 | EUR | Eurozone Current Account (EUR) Jan | 17.2B | 14.6B |
| 10:00 | EUR | Eurozone Trade Balance (EUR) Jan | 12.8B | 11.6B |
| 12:30 | CAD | Industrial Product Price M/M Feb | 1.10% | 2.70% |
| 12:30 | CAD | Raw Material Price Index Feb | 2.40% | 7.70% |
| 12:30 | CAD | New Housing Price Index M/M Feb | -0.20% | -0.40% |
| 12:30 | CAD | Retail Sales M/M Jan | 1.40% | -0.40% |
| 12:30 | CAD | Retail Sales ex Autos M/M Jan | 1.20% | 0.10% |
| 21:45 | NZD |
| Trade Balance (NZD) Feb | |
| Consensus | -740M |
| Previous | -519M |
| 01:15 | CNY |
| 1-Y Loan Prime Rate | |
| Consensus | 3.00% |
| Previous | 3.00% |
| 01:15 | CNY |
| 5-Y Loan Prime Rate | |
| Consensus | 3.50% |
| Previous | 3.50% |
| 07:00 | GBP |
| Public Sector Net Borrowing (GBP) Feb | |
| Consensus | 8.6B |
| Previous | -30.4B |
| 07:00 | EUR |
| Germany PPI M/M Feb | |
| Consensus | 0.30% |
| Previous | -0.60% |
| 07:00 | EUR |
| Germany PPI Y/Y Feb | |
| Consensus | -2.70% |
| Previous | -3.00% |
| 09:00 | EUR |
| Eurozone Current Account (EUR) Jan | |
| Consensus | 17.2B |
| Previous | 14.6B |
| 10:00 | EUR |
| Eurozone Trade Balance (EUR) Jan | |
| Consensus | 12.8B |
| Previous | 11.6B |
| 12:30 | CAD |
| Industrial Product Price M/M Feb | |
| Consensus | 1.10% |
| Previous | 2.70% |
| 12:30 | CAD |
| Raw Material Price Index Feb | |
| Consensus | 2.40% |
| Previous | 7.70% |
| 12:30 | CAD |
| New Housing Price Index M/M Feb | |
| Consensus | -0.20% |
| Previous | -0.40% |
| 12:30 | CAD |
| Retail Sales M/M Jan | |
| Consensus | 1.40% |
| Previous | -0.40% |
| 12:30 | CAD |
| Retail Sales ex Autos M/M Jan | |
| Consensus | 1.20% |
| Previous | 0.10% |