Sample Category Title
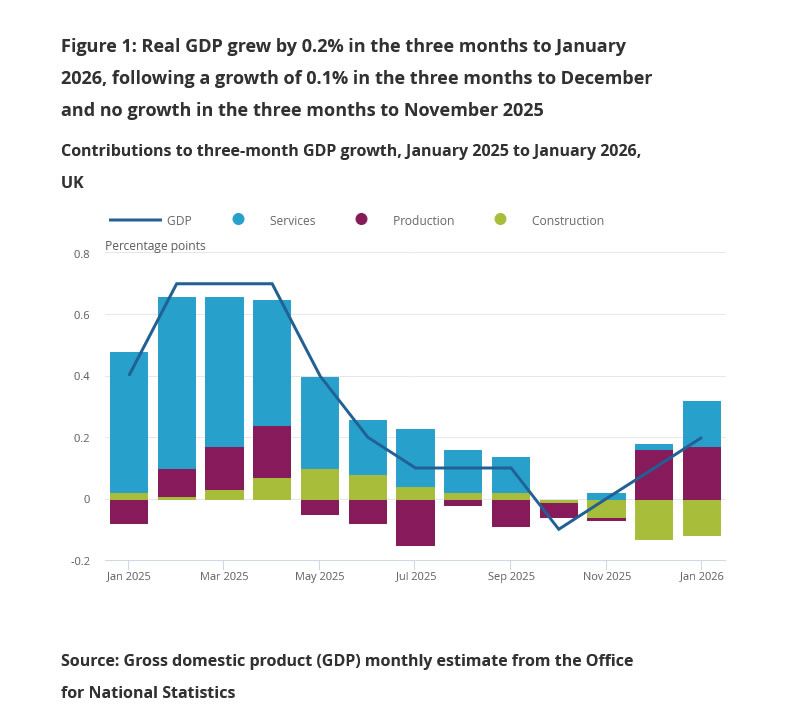
UK GDP flat in January as services stall, production contracts
UK economic growth stalled at the start of the year, with GDP showing no expansion in January, falling short of expectations for a modest 0.2% mom rise. Sector data showed a mixed picture beneath the headline reading. Services output, which accounts for the largest share of the UK economy, was flat during the month. Production declined slightly by -0.1%
Construction posted 0.2% mom growth, but the sector remains under sustained pressure following a prolonged period of contraction driven by high borrowing costs and subdued investment.
Looking at the broader trend, the UK economy still managed a modest expansion of 0.2% in the three months to January, an improvement from the 0.1% growth recorded in the three months to December. Services output rose by 0.2% over the period, while production delivered stronger growth of 1.3%. However, construction was a significant drag, contracting by -2.0% over the same period.
Oil Spikes Regardless of Measures to Ease Pressure
We’re coming toward the end of the second trading week since the US-Israel joint attack on Iran caused major damage to both sides’ oil facilities and disrupted trade through the Strait of Hormuz — where around 20% of global oil flows transit. Oil prices have been wavering up and down on the news ever since.
Several measures have been proposed to ease the oil rally: countries within the International Energy Agency said they would release a record amount of oil from their reserves; the US said it would insure and escort ships through the Strait of Hormuz; and Washington temporarily scrapped a century-old maritime law requiring American-built ships to transport goods between US ports, allowing foreign vessels to step in.
More surprisingly, the US announced earlier this week that it would tolerate continued purchases of Russian oil by India to help ease pressure on global oil prices. Yesterday, officials went even further by signalling broader flexibility around Russian oil flows.
So far, these efforts have been largely in vain. The strikes in the Middle East, damage to regional oil facilities and the closure of the Strait of Hormuz — with Iran possibly laying mines to prevent ships from passing — continue to keep upside pressure on oil prices tight.
WTI crude briefly rose to $98 per barrel before easing this morning, while Brent Crude hit $100pb and is consolidating near $98pb today. Quick measures are unlikely to relieve the pressure. If the bombings continue, the situation could worsen.
Rising oil prices have been fueling global inflation expectations since the beginning of the month. In the US, gasoline prices are up more than 25% since the start of the month and nearly 80% since the beginning of the year.
Oil prices are only part of the equation — tariffs are the other. Latest reports suggest that US trade officials are looking for ways to restore tariffs that the Supreme Court of the US judged unlawful earlier this year. If companies face both higher energy costs and renewed tariffs, they will ultimately pass those costs on to consumers.
As a result, the inflation outlook for the US — and the rest of the world — is deteriorating. And the US decisions remain decisive for global markets.
So what’s next? Investors tend to get used to war headlines faster than they get used to rising energy prices. The US 2-year yield — which closely reflects expectations for Federal Reserve (Fed) policy — spiked past 3.75% as rising energy prices erode hopes for Fed rate cuts.
Activity in Fed funds futures has also shifted: markets are no longer pricing a full 25bp cut this year, meaning investors increasingly believe the Fed may not cut rates at all in 2026 — even as Donald Trump continues to call for immediate rate cuts. But financial markets do not work that way. An unjustified rate cut would not necessarily help bring yields lower.
Consequently, the short end of the US yield curve is being pushed higher by the idea that the Fed may not cut rates this year, while the long end faces another pressure: the growing fear that a prolonged conflict could add further strain to US finances. The US 10-year yield is preparing to test the 4.30% level, while the 30-year yield topping 4.90%.
Equities are feeling the pinch from rising yields and growing stress in the private-equity space. More “cockroaches,” as Jamie Dimon calls them, are appearing in headlines every day. Banks are being shaken by their exposure to private credit companies facing record redemption requests due to heavy software selloff. And risk appetite in that the Saas-space remains weak despite falling valuations.
Adobe released earnings after the bell yesterday. Results topped estimates on both revenue and earnings, but the stock still slid 6–7% in after-hours trading as AI-related concerns combined with the announcement that the long-time CEO would step down.
Meanwhile, Big Tech stocks also slipped yesterday, shrugging off the optimism that followed Oracle earnings.
Overall, the S&P 500 fell 1.52% yesterday. Yet the index is still down less than 5% from its January peak — meaning that despite the combination of negative news — the Iran conflict, rising energy prices, fading Fed-cut expectations, AI anxiety and private-credit stress — the correction remains relatively shallow.
US and European futures are pointing to modest gains this morning, though the bearish outlook is unlikely to reverse until tensions in the Middle East materially ease — and that does not appear to be on the menu for now.
Today, investors will watch the latest US GDP and core PCE updates — with Core PCE Price Index being the Fed’s preferred gauge of inflation.
US growth is expected to slow from 4.4% to 1.4% in Q4 as consumer spending cools, high borrowing costs from the Fed weigh on demand, inventories normalize, AI investment momentum wanes, and tariffs add pressure to trade and business activity.
Core PCE, on the other hand, is expected to rise to around 3.1% — still sticky and well above the Fed’s 2% policy target. And that 3% mark comes before the surge in oil and gas prices triggered by the Middle East conflict.
That means the market reaction to today’s data could be asymmetric. Slower growth may matter less for markets right now than inflation. A strong PCE print could further crush hopes for Fed cuts this year, while a softer-than-expected reading may do little to calm fears that inflation could reaccelerate in the coming months.
Looking ahead, uncertainty, market volatility and the risk of slower global growth combined with rising inflation remain firmly on the menu. Markets will eventually find a floor — they always do — but further downside may come before that moment arrives.
Middle East Unrest Keeps Oil Markets on Edge Ahead of Weekend Close
In focus today
Focus remains on energy markets ahead of the close of the week, as tensions in the Middle East continue to weigh on oil supply disruptions and market sentiment.
The Fed's preferred measure of inflation, the PCE, will be released for January today. The January JOLTs report is also due for release today after a delay caused by the government shutdown. On the more forward-looking front, University of Michigan's flash consumer sentiment survey will be released for March.
In Norway the Technical Calculation Committee will publish its final report ahead of the front party wage negotiations. Markets will look for potential revisions to the provisional 3.0% CPI forecast in particular, as this would impact wage demands.
UK publishes January GDP data. 2025 finished on a stronger note and PMIs suggest momentum has continued in the new year.
In Sweden, the Labour Force Surveys (AKU) for February will be published today. Yesterday's figures from the Public Employment Service indicated continued declines in unemployment. However, AKU is notoriously volatile, and following the significant drop in January to 8.0%, we anticipate a slight rebound today to 8.4% due to increased labour force participation. Employment levels have risen and are close to an all-time high, and an unchanged figure today would be reassuring given the weaker GDP reading for January.
Economic and market news
What happened yesterday
The oil price traded around the USD 100/bbl level yesterday and overnight, driven by still high tensions in the Middle East and growing concerns of prolonged disruption to traffic through the Strait of Hormuz. Yesterday, two tankers in Iraqi waters were hit by explosive-laden Iranian boats, prompting Iraq to halt operations at its oil ports, while Oman relocated vessels from its main oil terminal as a precautionary measure. The oil market has been hit by big shocks over the past two weekends, and the IEA has described the conflict as the largest oil-supply disruption in history. While the IEA announced a record release of 400 million barrels from strategic reserves, scepticism remains about its impact, as the volume covers only 25 days of the current disruption, according to Reuters. Overnight, the US Treasury issued a 30-day waiver allowing countries to purchase stranded Russian oil at sea. While the waiver may ease short-term supply pressures, it risks undermining efforts to limit Russian revenue and has drawn criticism from US allies. Pressure on oil prices is likely to persist ahead of the close of the week.
In Iran, newly appointed Supreme Leader Mojtaba Khamenei pledged to keep the Strait of Hormuz closed, and called for intensified attacks on US bases, further escalating geopolitical tensions in his first speech.
In the US, the Trump administration is considering a temporary waiver of the Jones Act to address fuel price spikes and supply disruptions caused by the conflict with Iran. The waiver would allow foreign vessels to transport goods between US ports, easing domestic shipping constraints and potentially lowering costs. Gasoline and diesel prices are at their highest levels in years, creating political risks for Trump and Republicans ahead of the midterm elections.
Furthermore, in an effort to rebuild tariff pressure after the Supreme Court struck down Trump's global tariffs last month, the Trump administration has launched two trade investigations under Section 301. The probes target excess industrial capacity in 16 trading partners, including China, the EU, and Japan, and forced labour in global supply chains across over 60 countries. These investigations could lead to new tariffs by summer.
In yesterday's release, the US goods trade deficit narrowed from USD 99.2bn to USD 81.8bn in January primarily as exports recovered. That said, the deficit remains above last fall's lows, and we expect it to continue widening later in the year as import volumes are likely to recover.
In Sweden, the final print confirmed the flash estimate with revisions showing year-on-year core inflation (CPIF ex energy) at 1.38%, CPIF at 1.71%, and CPI at 0.49%. Higher energy prices will increase headline inflation in the near term, but we do not expect a rapid rise in underlying price pressures. The pass-through from energy prices to core inflation will depend on the duration of the conflict.
Equities: As oil prices edged up, US equities sold off. S&P 500 closed down -1.5% and small cap Russell 2000 -2.2%. Europe managed better, with Stoxx 600 ending just -0.7%. The US session had more classical risk-off dynamics than last week. Cyclicals underperformed defensives, small caps underperformed large caps and growth stocks underperformed value. Outside energy, we note relative outperformance in materials and consumer staples, while industrials, tech and consumer discretionary sold off the most.
FI and FX: Risk sentiment deteriorated further over yesterday's trading session following Iran's new supreme leader vowing to continue blocking the Strait of Hormuz. Equities sold off and oil is currently trading around USD 100/bbl. The USD gained vs most currencies and EUR/USD drop to around the 1.15 mark. SEK was the main underperformer, pushing EUR/SEK above 10.70. EUR/NOK moved higher to just below 11.19 and EUR/DKK stayed elevated above 7.4720, which we expect will continue going into the dividend season. Yields climbed across markets, with Bunds gaining some 2-4bp across the curve and the 1Y EUR ZC inflation swaps trading around 20bp higher over the past two days. 2Y US Treasury yields gained some 10bp. Looking to today, the University of Michigan's flash March survey will provide the Fed with the first (partial) sense of how consumers' inflation perceptions have evolved during the war.
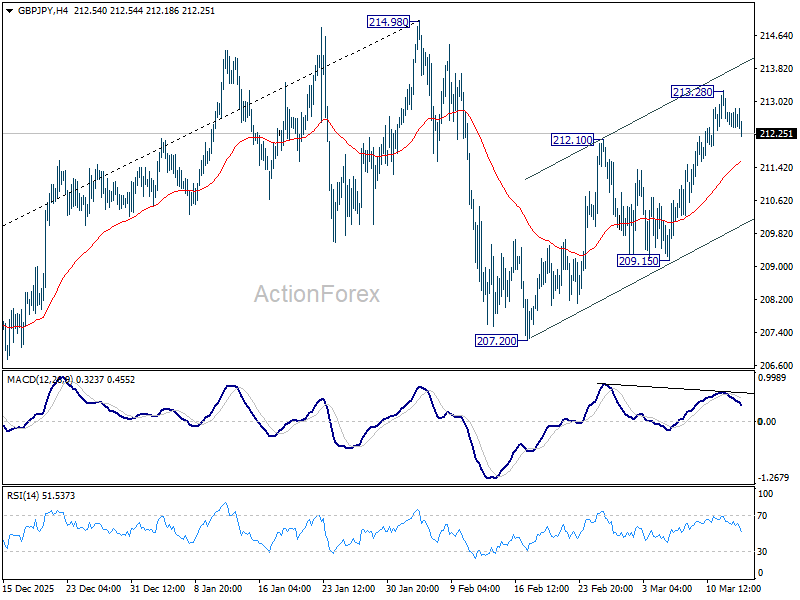
GBP/JPY Daily Outlook
Daily Pivots: (S1) 212.28; (P) 212.75; (R1) 213.09; More...
A temporary top is formed at 213.28 and intraday is turned neutral in GBP/JPY first. On the upside, break of 213.28 will resume the rebound from 207.20 to retest 214.98 high. However, sustained break of 55 4H EMA (now at 211.54) will argue that the rebound has completed, and turn bias back to the downside for 209.15 support first.
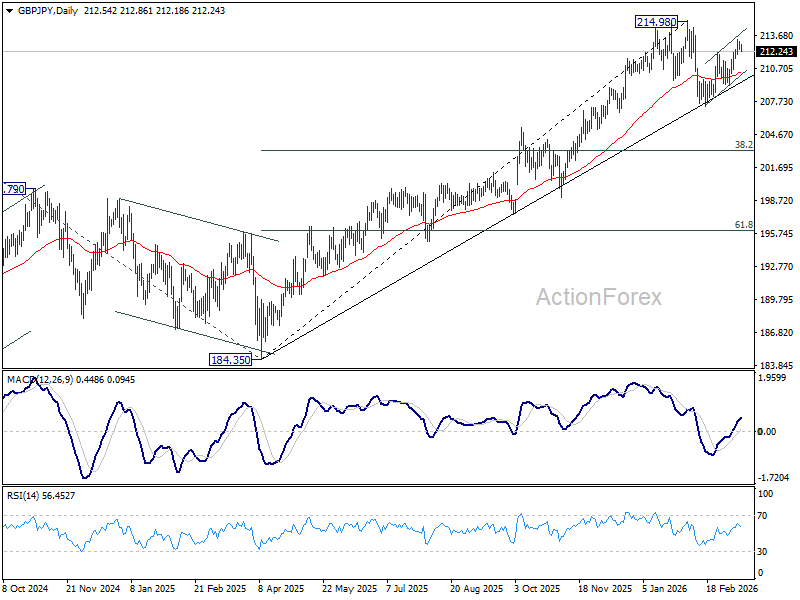
In the bigger picture, up trend from 123.94 (2020 low) is still in progress. Firm break of 214.98 will target 61.8% projection of 148.93 (2022 low) to 208.09 (2024 high) from 184.35 at 220.90. This will remain the favored case as long as 55 W EMA (now at 202.80) holds, even in case of another deep pullback.
EUR/JPY Daily Outlook
Daily Pivots: (S1) 183.11; (P) 183.53; (R1) 183.85; More...
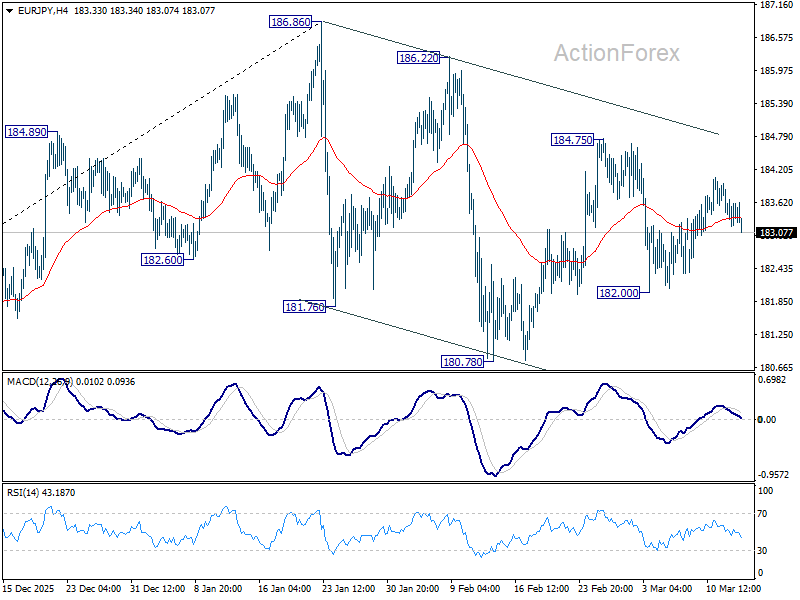
Intraday bias in EUR/JPY remains neutral and outlook is unchanged. On the upside, above 184.75 will resume the rebound from 180.78 to retest 186.86 high. Firm break there will confirm larger up trend resumption. On the downside, 182.00 will target 180.78. Firm break there will indicate that fall from 186.86 is already correcting whole up rise from 154.77.
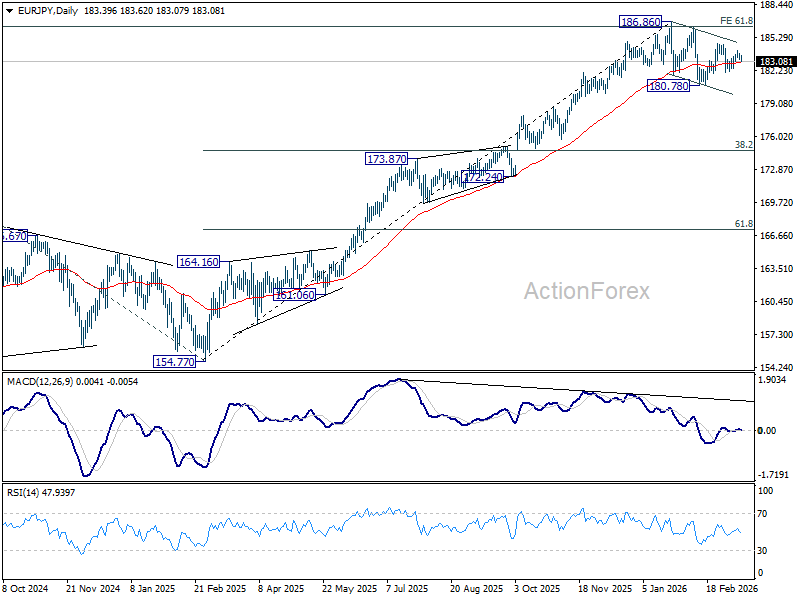
In the bigger picture, a medium term top could be in place at 186.86 and some more consolidations could be seen. Nevertheless, the larger up trend from 114.42 (2020 low) remains intact. Firm break of 186.86 will pave the way to 78.6% projection of 124.37 (2022 low) to 175.41 (2025 high) from 154.77 at 194.88 next.
EUR/GBP Daily Outlook
Daily Pivots: (S1) 0.8616; (P) 0.8628; (R1) 0.8639; More…
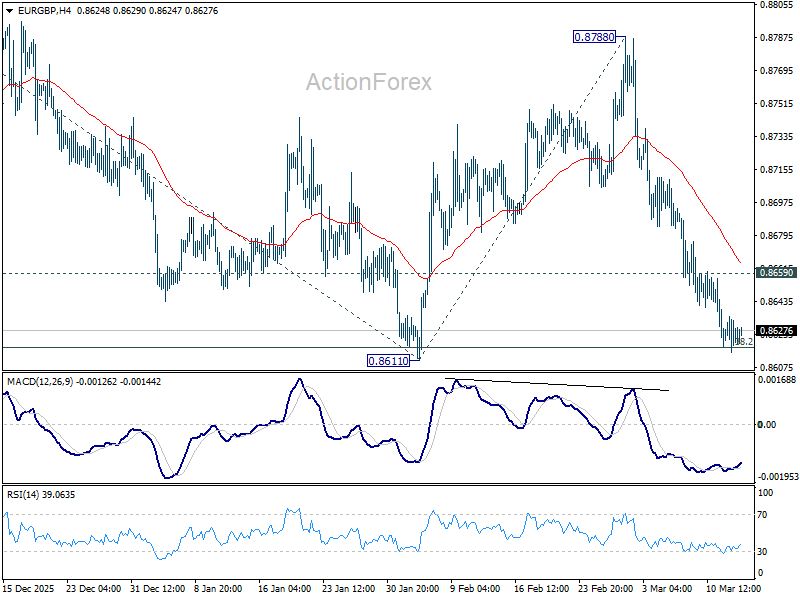
Intraday bias in EUR/GBP remains on the downside at this point. Firm break of 0.8611 will resume the whole decline from 0.8863, and target 100% projection of 0.8863 to 0.8611 from 0.8788 at 0.8536. On the upside, above 0.8659 minor resistance will turn intraday bias neutral again first.
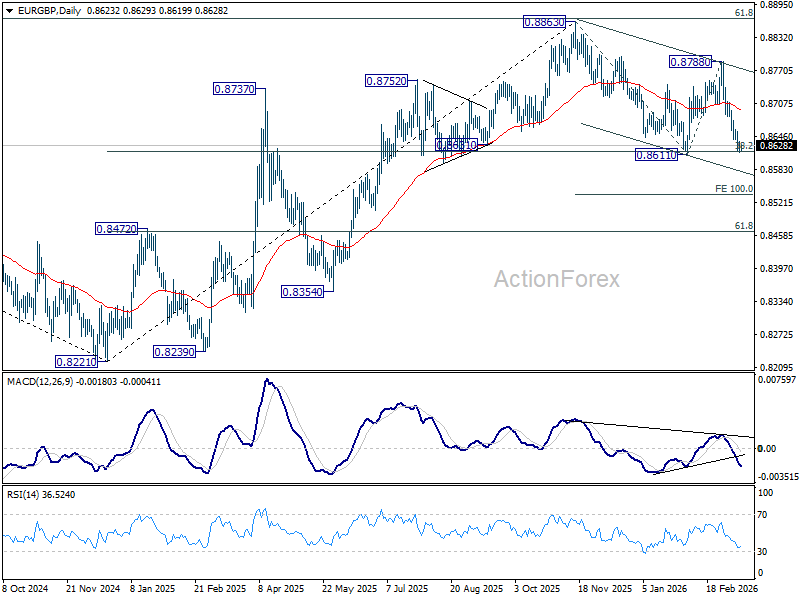
In the bigger picture, current development revived the case that whole rise from 0.8221 (2024 low) has completed at 0.8863, after rejection by 61.8% retracement of 0.9267 (2022 high) to 0.8221 at 0.8867. Sustained trading below 38.2% retracement of 0.8821 to 0.8863 at 0.8618 will confirm this case, and bring deeper fall to 61.8% retracement at 0.8466 at least. For now, medium term outlook is neutral at best as long as 0.8863 resistance holds.
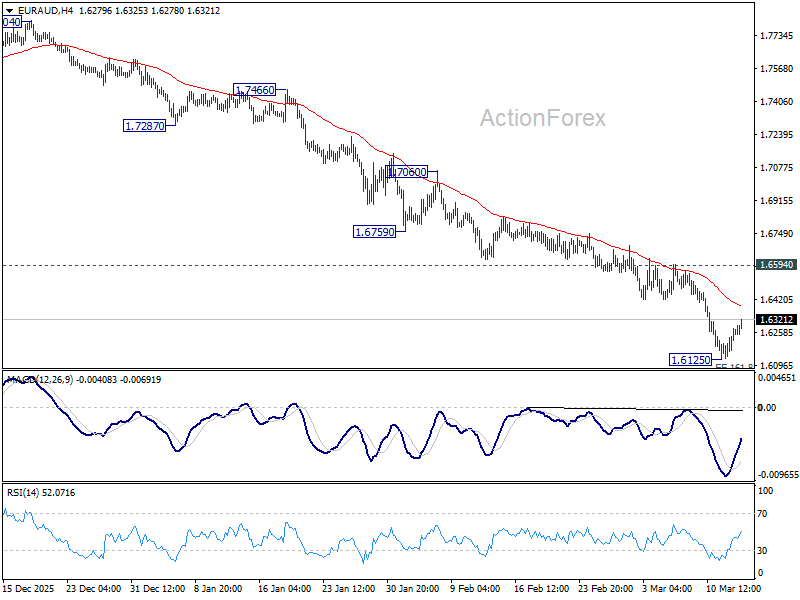
EUR/AUD Daily Outlook
Daily Pivots: (S1) 1.6176; (P) 1.6228; (R1) 1.6319; More...
A temporary low is in place at 1.6125 with current recovery, and intraday bias is turned neutral in EUR/AUD first. Still, outlook will remain bearish as long as 1.6594 resistance holds. On the downside, firm break of 161.8% projection of 1.8554 to 1.7245 from 1.8160 at 1.6042 will pave the way to 200% projection at 1.5542.
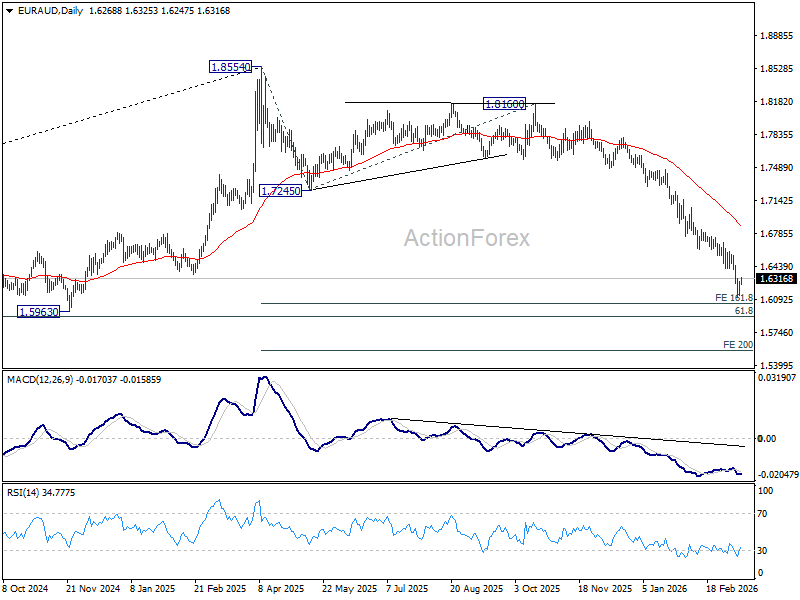
In the bigger picture, fall from 1.8554 medium term top is seen as reversing the whole up trend from 1.4281 (2022 low). Deeper decline should be seen to 61.8% retracement of 1.4281 to 1.8554 at 1.5913, which is slightly below 1.5963 structural support. Decisive break there will pave the way back to 1.4281. For now, risk will stay on the downside as long as 55 D EMA (now at 1.6884) holds, even in case of strong rebound.
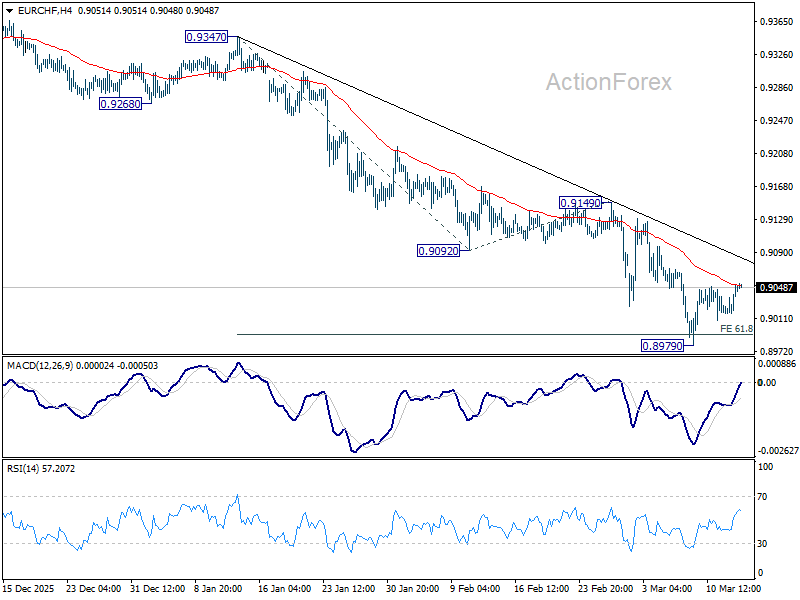
EUR/CHF Daily Outlook
Daily Pivots: (S1) 0.9025; (P) 0.9039; (R1) 0.9064; More....
EUR/CHF is extending consolidations pattern from 0.8979 and intraday bias stays neutral. Near term outlook remains bearish with 0.9149 resistance intact. On the downside, below 0.8979 will extend the larger down trend to 100% projection of 0.9347 to 0.9092 from 0.9149 at 0.8894.
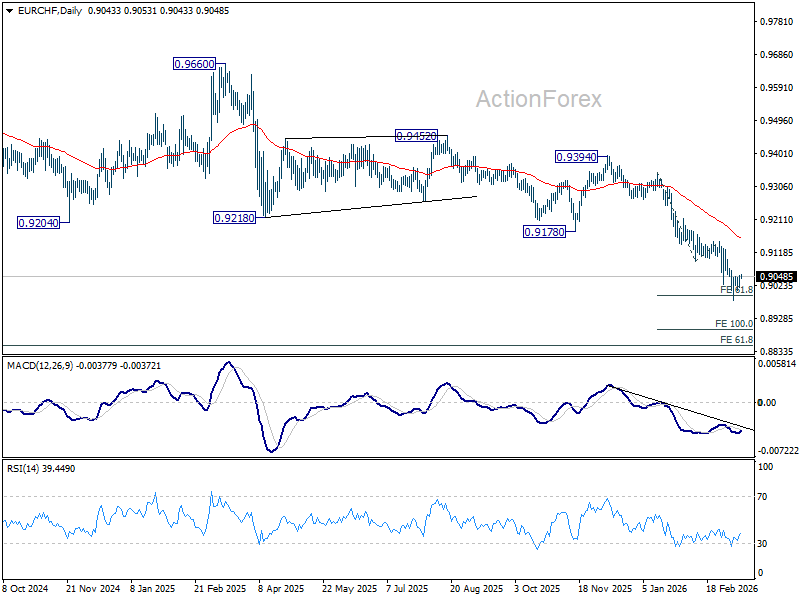
In the bigger picture, down trend from 0.9928 (2024 high) is still in progress. Next target is 61.8% projection of 1.1149 to 0.9407 from 0.9928 at 0.8851. Outlook will stay bearish as long as 0.9394 resistance holds, in case of rebound.
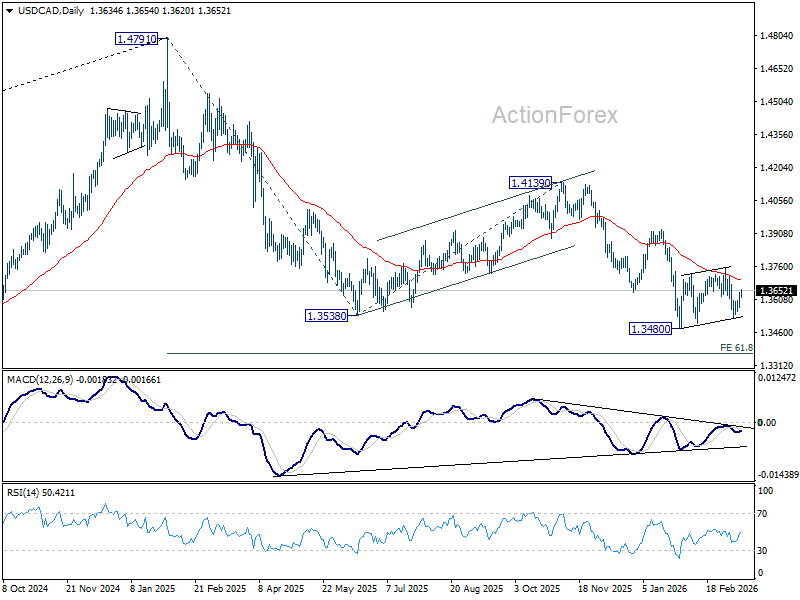
USD/CAD Daily Outlook
Daily Pivots: (S1) 1.3598; (P) 1.3620; (R1) 1.3664; More...
While USD/CAD's rebound from 1.3524 extends, it's still bounded in established near term range. Intraday bias remains neutral and outlook stays bearish with 1.3571 resistance intact. On the downside, firm break of 1.3480 low will confirm resumption of whole fall from 1.4791, and target 61.8% projection of 1.4791 to 1.3538 from 1.4139 at 1.3365. However, sustained break of 1.3751 will indicate that larger scale corrective bounce is underway.
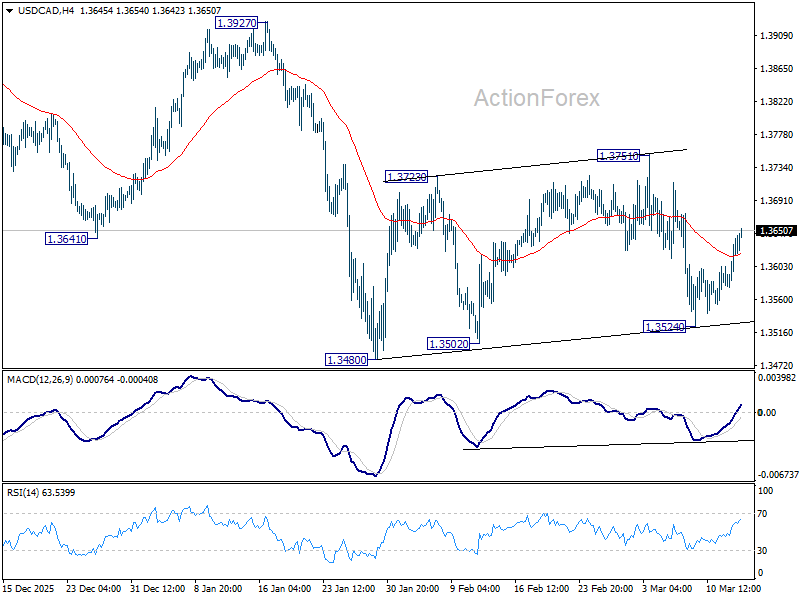
In the bigger picture, price actions from 1.4791 are seen as a corrective pattern to the whole up trend from 1.2005 (2021 low). Deeper fall could be seen, as the pattern extends, to 61.8% retracement of 1.2005 to 1.4791 at 1.3069. For now, medium term outlook will be neutral at best, until there are signs that the correction has completed, or that a bearish trend reversal is confirmed.
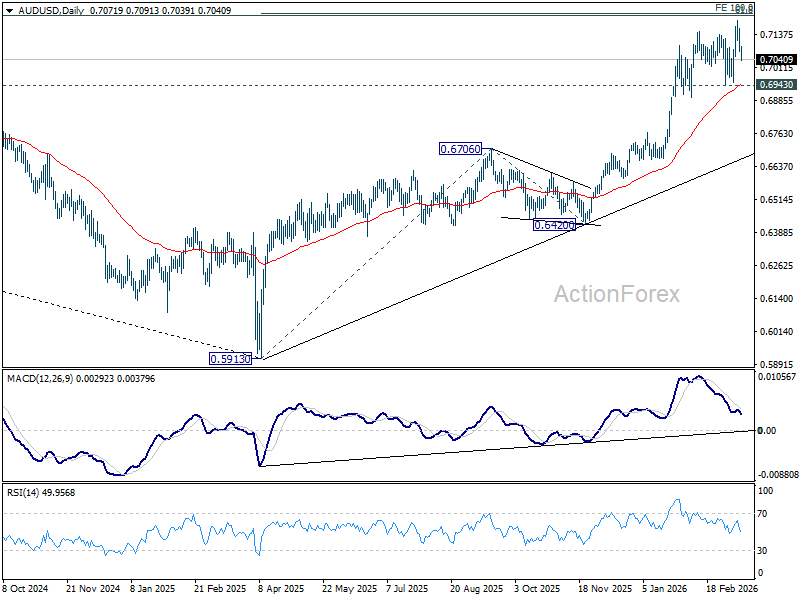
AUD/USD Daily Report
Daily Pivots: (S1) 0.7046; (P) 0.7103; (R1) 0.7135; More...
AUD/USD's pullback from 0.7187 accelerates lower today but downside is held well above 0.6943 support. Intraday bias remains neutral and outlook stays bullish. Firm break of 100% projection of 0.5913 to 0.6706 from 0.6420 at 0.7213 could prompt upside acceleration to 161.8% projection at 0.7703. However, firm break of 0.6943 will indicate that a larger scale correction is already underway.
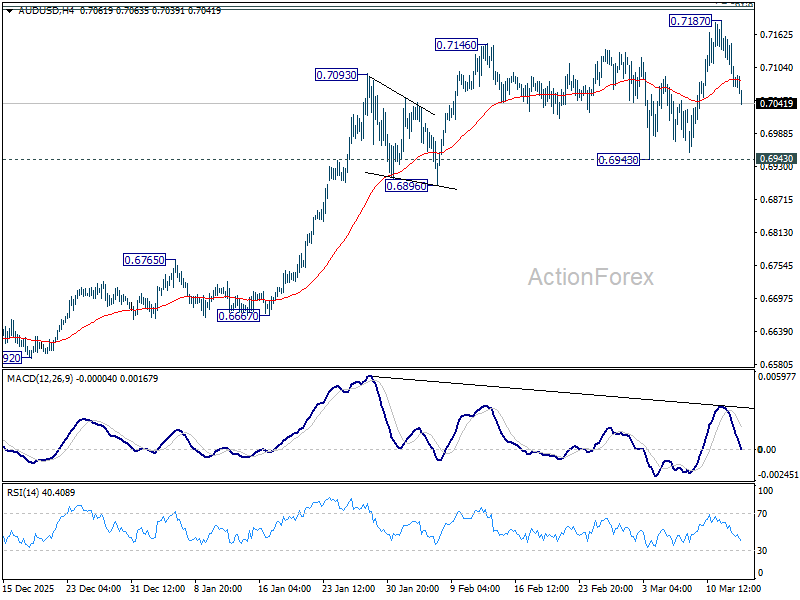
In the bigger picture, current development argues that rise from 0.5913 (2024 low) is reversing whole down trend from 0.8006 (2021 high). Decisive break of 61.8% retracement of 0.8006 to 0.5913 at 0.7206 will pave the way back to 0.8006. This will remain the favored case as long as 0.6706 resistance turned support holds, even in case of deep pullback.