
Sample Category Title
Cliff Notes: A Time for Caution
Key insights from the week that was.
The Westpac-MI Consumer Sentiment Index lifted modestly in March, up 1.2% to 91.6, still an outright pessimistic reading. The latest survey was in the field over the week to March 7, so it only captured part of this week’s conflict escalation in the Middle East. Responses over the last three days of the sample were closer to an index read of 84 – a deeply pessimistic result which emphasises just how dynamic sentiment is to the situation offshore.
Underscoring the slightly firmer headline result in the month was an improvement in current assessments of family finances (+1.8%), buyer sentiment (4.9%) and the economy in five years’ time (2.4%). This more than offset the flat and weaker readings on the year-ahead view for family finances and the economy respectively. Many of the near-term nerves stem from consumers’ hawkish mortgage rate expectations, with over 75% of respondents anticipating a lift over the next twelve months.
Recent commentary from RBA officials has continued to emphasise the Board’s pessimistic view on supply capacity, concerns over the persistence of domestic inflation and their desire to keep price expectations anchored. Now facing an additional threat from offshore in the form of surging energy prices, the RBA is likely to feel compelled to act without delay. Responding to these developments, Chief Economist Luci Ellis this week announced a revision to our RBA profile, adding an additional 25bp rate hike next week at the March meeting, in addition to the hike already forecast for May. This cumulative 50bps of tightening will take the cash rate back to its post-pandemic peak of 4.35%. The breadth, intensity and persistence of inflation risks stemming from the conflict are highly uncertain and skewed upward near term, but should fade through 2027, allowing a reversal of 2026’s rate hikes from late-2027.
Before moving offshore, it is worth noting that the latest NAB business survey suggests optimism among Australian businesses largely evaporated in February. Not only does this coincide with weaker reads on consumer sentiment, but also a somewhat softer start to the year for trading conditions and profitability. This foreshadows a plateauing of economic growth after an acceleration to near trend over the course of 2025.
In the US, current assessments and expectations of the labour market were re-written last Friday. US nonfarm payrolls surprised to the downside in February, declining 92k in the month. Gains over the prior two months were also revised down 69k, leaving the 3-month average at just 6k versus 50k in January, and the 12-month average around 13k compared to 89k the year prior. The unemployment rate also ticked up to 4.4% despite a 0.1ppt decline in the participation rate. More significantly, annual revisions reduced the participation rate and employment-to-population ratio by 0.4ppts and 0.5ppts respectively. These outcomes point to US labour supply being constrained by both structural and cyclical factors, risking economic growth into the medium term.
That said, to date economic growth has held up, as highlighted by January retail sales – the control group up 0.3%. Housing starts also showed some life in January, up 7.2%, although the level of starts is still 18% below its 2022 peak and permits are weaker still, 28% below. The run up in US term interest rates into the end of the week meanwhile signals growing risks for US inflation and financial conditions. This is particularly troubling for the US, coming at a time when labour market data warrants further easing. Our full updated expectations for the US economy and interest rates can be found in March Market Outlook, out today on Westpac IQ.
Finally to China. The January/February trade data highlighted the continued success of China’s rapid expansion of high-tech manufacturing and related infrastructure, exports up 21.8% year-to-date and the trade surplus near its widest mark at $213.6bn (for the two months combined). Persistent strength in the trade surplus is a core expectation of our China forecasts. But, after near 20% gains for several years, growth in external demand must slow. As discussed in the last edition of Cliff Notes and March Market Outlook, pro-active stimulus is necessary to accelerate domestic demand from H1 2026. The greater the risk for global energy prices and supply, the more pressing the need for action.
Retreating but Not Defeated: AUD/USD Bulls Find Hope in Technical Support and Hawkish RBA
- AUD/USD fell over 1% from a multi-year peak as the US Dollar strengthened amid intensifying safe-haven demand.
- The hawkish Reserve Bank of Australia (RBA) may limit the downside, driven by escalating inflation pressures.
- The pair has retreated to a key technical inflection point between the 100-day MA (0.7072) and 200-day MA (0.7051), where the RSI is now signaling a potential shift in momentum in favor of bulls.
AUD/USD fell 1% + on Thursday with the pair reacting to a resurgent US Dollar as safe haven demand intensified due to Middle East tensions. AUD/USD was trading at a multi-year peak and thus a retracement may be welcomed in some quarters.
Hawkish RBA may limit downside
Inflationary pressures are intensifying in Australia, where the Melbourne Institute survey recently reported that March Consumer Inflation Expectations climbed to 5.2%, the highest level since July 2023.
This uptick from February's 5% reading underscores the growing challenge for the Reserve Bank of Australia (RBA), which had already taken a proactive stance in early February by raising the Official Cash Rate (OCR) by 25 basis points to 3.85%.
As the ongoing energy crisis continues to drive costs higher, market speculation is mounting that the RBA and other global central banks will be forced to maintain an aggressive interest rate hiking cycle to contain burgeoning prices.
According to the latest LSEG data, markets are pricing in around a 78% probability of a 25 bps rate hike at the upcoming March 17, 2026 meeting.
Economic data ahead
While the Australian economic calendar remains quiet this Friday, the focus shifts to a heavy slate of data from the United States.
Markets are bracing for a series of high-impact releases, including the January Personal Consumption Expenditures (PCE) Price Index, the Federal Reserve’s preferred inflation metric alongside January Durable Goods Orders.
Additionally, the preliminary March reading of the Michigan Consumer Sentiment Index will provide a fresh look at how the spike in energy prices and financial market volatility are impacting American consumer confidence.
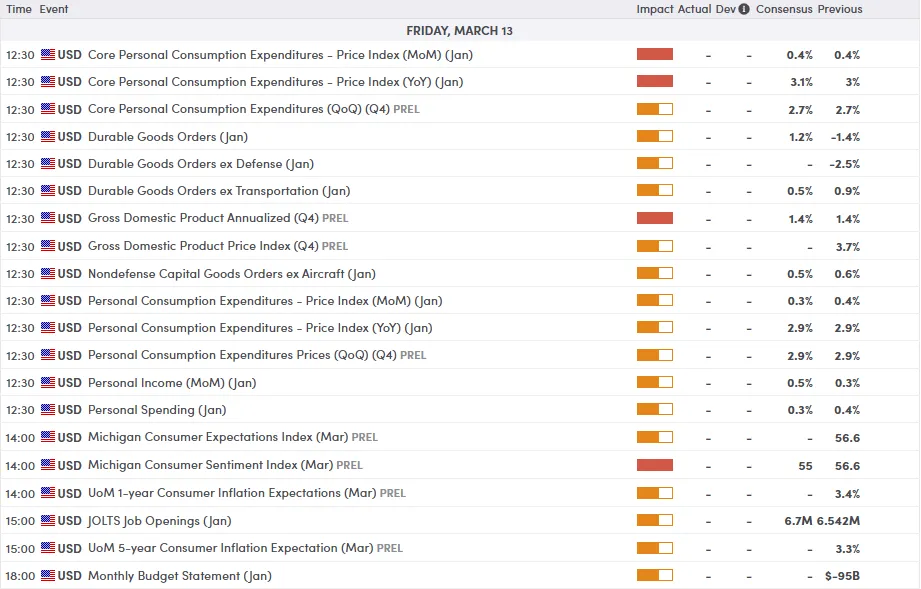
For all market-moving economic releases and events, see the MarketPulse Economic Calendar. (click to enlarge)
Markets may remain at the mercy of geopolitical developments which could even overshadow tomorrow's US data. The intriguing part about AUD/USD is the technical picture where the pair is at a key inflection point.
Technical Analysis - AUD/USD
From a technical point of view, AUD/USD has finally pulled back from its multi-year peak around the 0.7187 handle.
The pullback has brought the pair to a key inflection area resting between the 0.07072 (100-day MA) and 0.7051 (200-day MA) handles.
The previous impulse move to the upside occurred after a breakout of the 0.7034 handle which rests just below the inflection area.
AUD/USD Four-Hour Chart, March 13, 2026
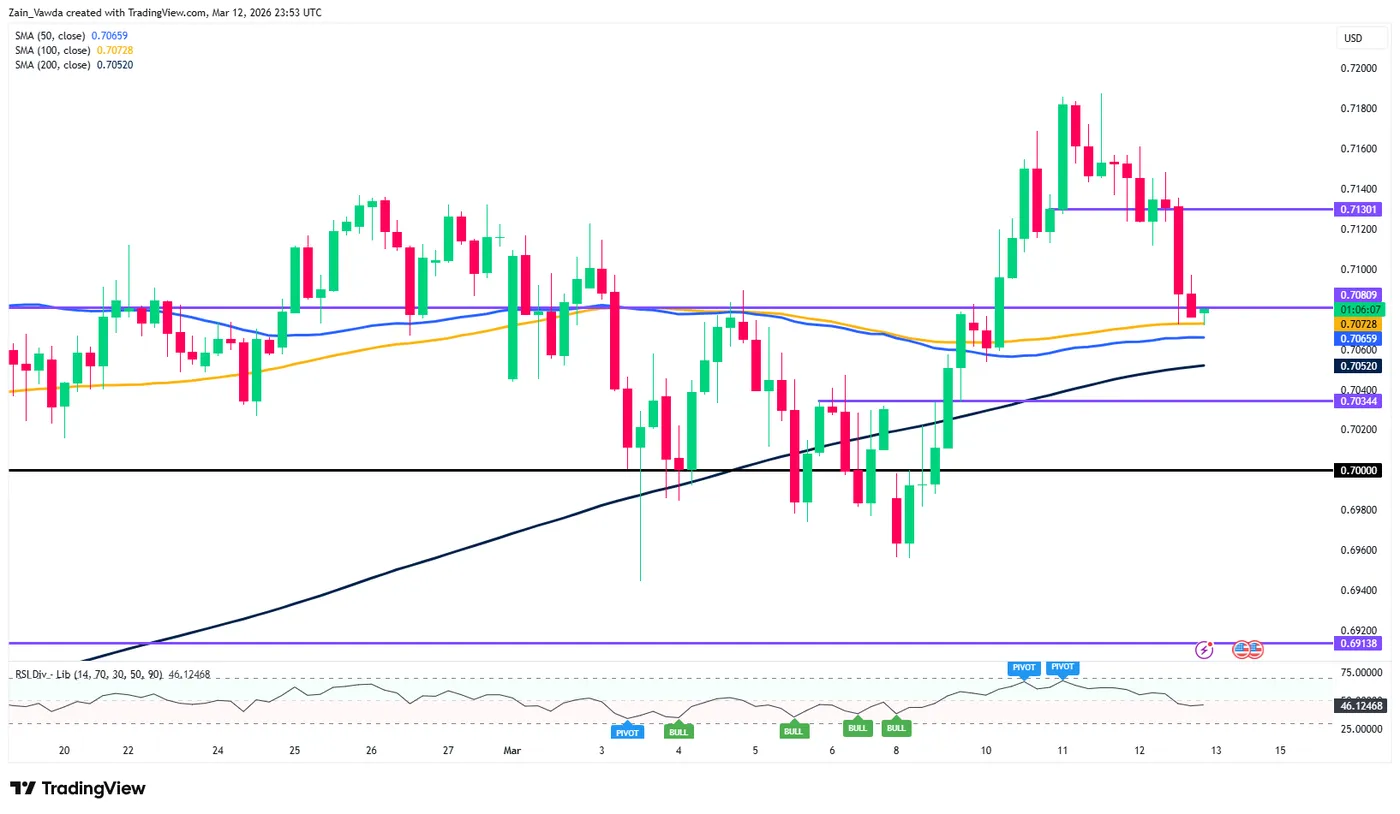
Source:TradingView.com
Dropping down to a one-hour chart and there is some evidence that bulls may already be returning.
The price has slowed significantly as it approached the 0.7070 handle.
The bigger hint comes from the period-14 RSI which has just left oversold territory. This is usually seen as a sign that momentum has shifted in favor of the bulls.
An immediate hurdle on the H1 chart rests at 0.7100. Acceptance back above this level is needed before the 0.7130 and recent highs at 0.7187 come into focus.
AUD/USD One-Hour Chart, March 13, 2026
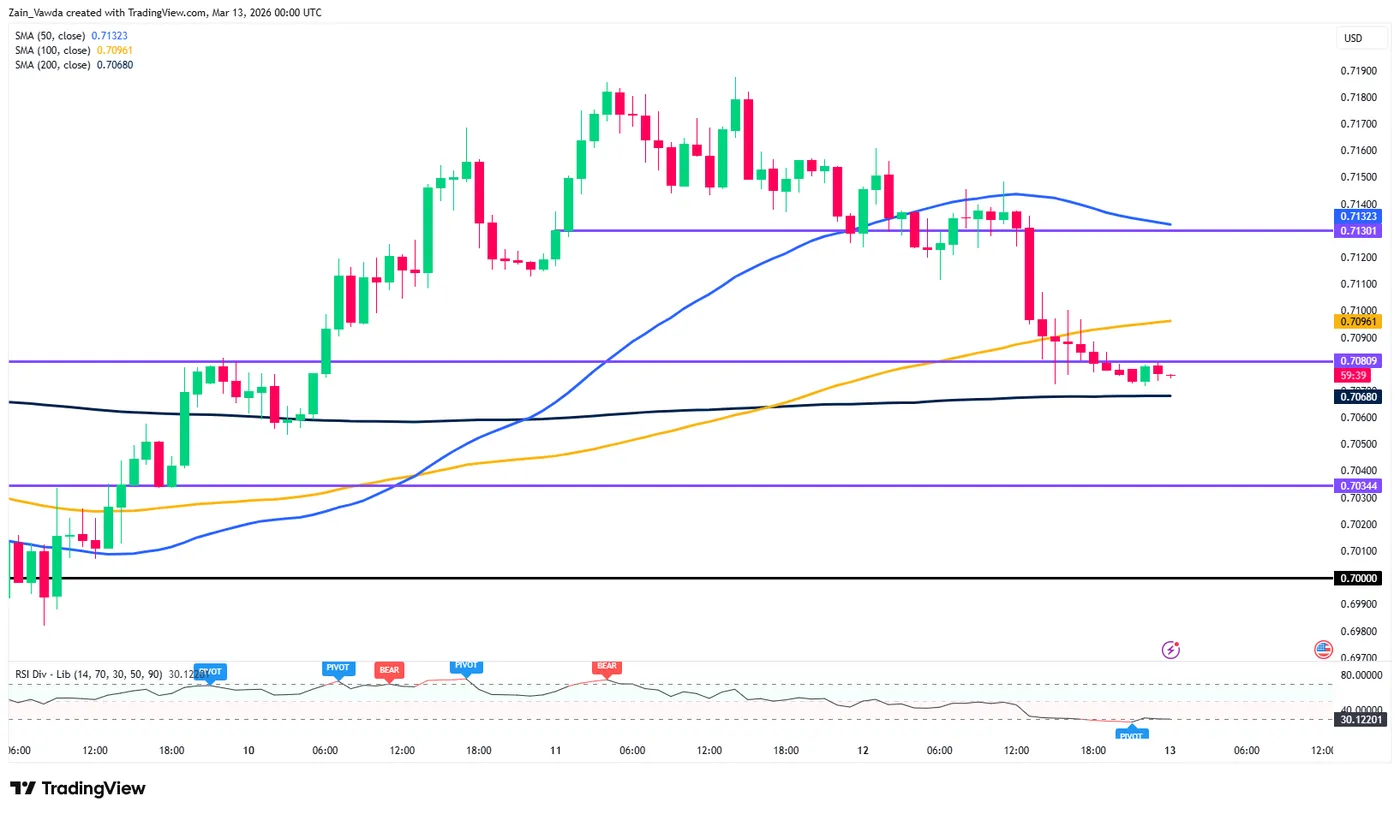
Source:TradingView.com
USD Extends Lead as Fed Cuts Price Out: USD/JPY to New Cycle Highs
Despite yesterday's more optimistic US CPI report, Markets are now focusing on a bleaker inflationary picture ahead.
A major theme in Markets is the progressive repricing for a more persistent and damaging US-Iran-Israel war, which would have a long-lasting consequences on Oil prices.
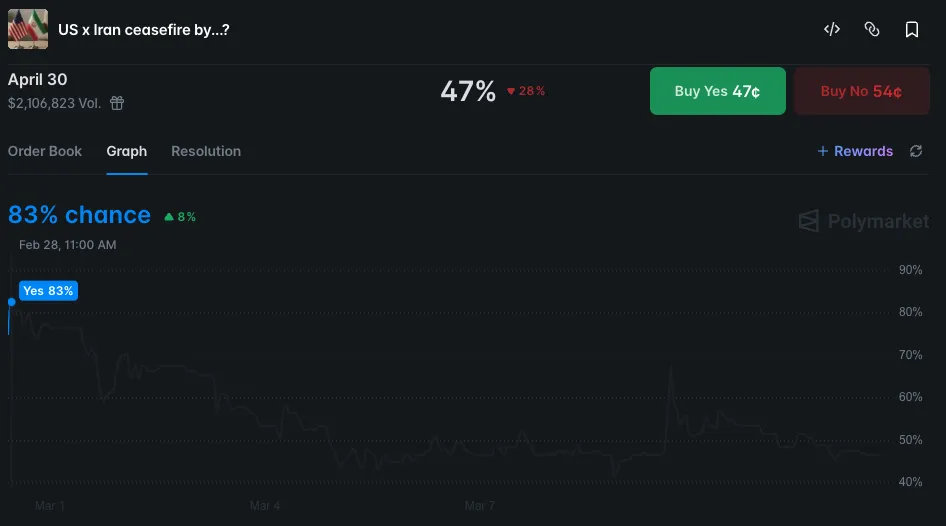
Polymarket Odds for the War to End before April 30
As you can see from the Polymarket odds, the odds for a 5- to 6-week conflict fell from 80% to the current 47%, adding to the (justified) fears of a damaging long-war.
With the Iranian regime holding out stronger than expected, nominating a new leader in Mojtaba Khamenei and continuing its attacks on neighboring countries, it seems that it would either require more force or a new plan to really materialize the conflict into the desired regime change outcome.
Participants and the general media are now roasting the Trump Administration for its lack of Exit plans. To me, this could be a strategy to create doubt, as we are "only" on the 13th day of the conflict, but people's skepticism regarding Trump's temerity is justified.
Even his prior advisors warned of such, warning of a "self-afflicted wound" to the US Economy as Oil rallies back to $95.
For those who haven't looked back yet, the consecutive Oil Crises in the 1970s were the prelude to the infamous Stagflation era, and the Market never jokes around with such economic trends.
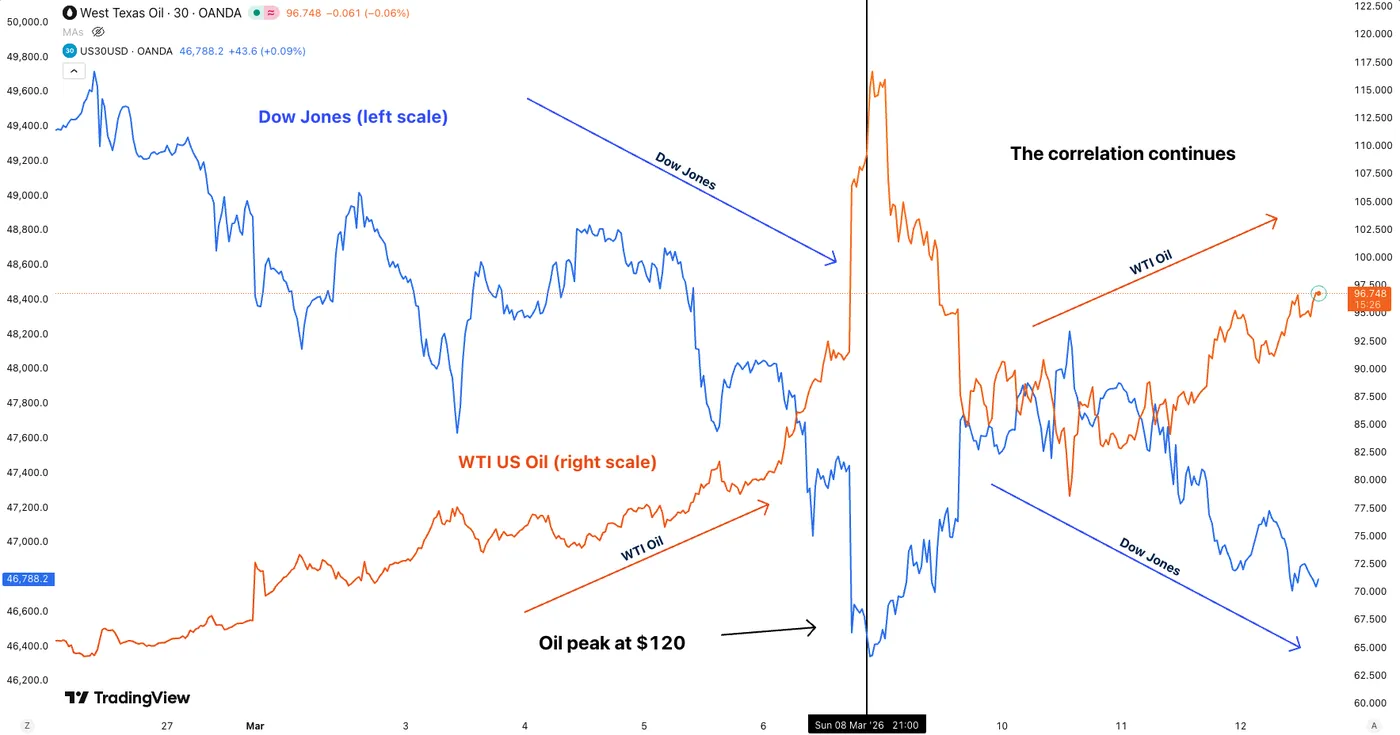
Oil and Dow Jones Inverse Correlation. March 12, 2026 – Source: TradingView
If anybody is enjoying this at least, it's the Dollar bulls, as the Petrodollar has been fuming higher since the beginning of the Conflict.
Rate traders have now priced out around 40 bps of rate cut pricing since the beginning of the conflict, with Rate cut odds towards end 2026 only around 23 bps.
Subject to an almost 1 to 1 correlation with Oil since early March, the Greenback has kept outperforming major Forex currencies, in particular the subject of this afternoon's FX outlook, the Yen.
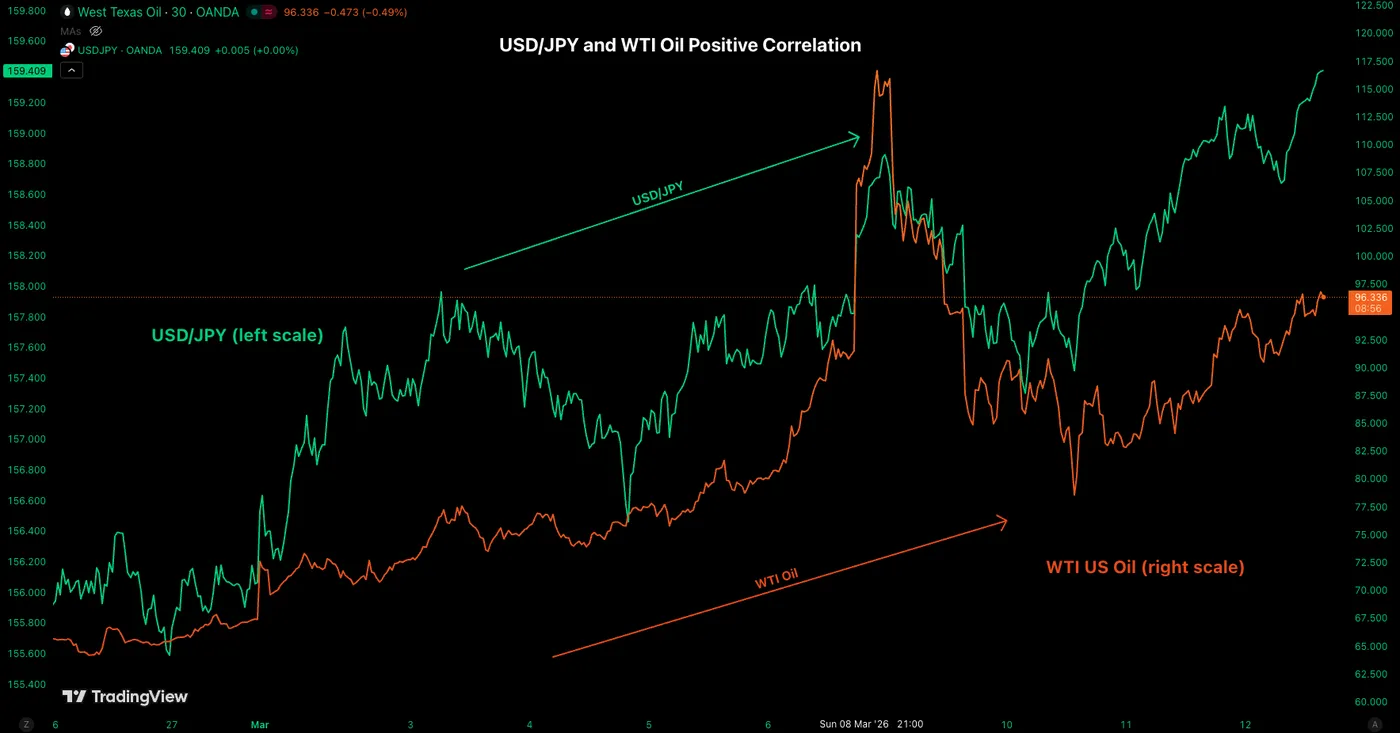
Oil and USD/JPY Positive Correlation. March 12, 2026 – Source: TradingView
We will dive into a two-timeframe outlook for USD/JPY as the pair comes close to the 160.00 barrier.
An intervention could be near!
USD/JPY Daily Chart
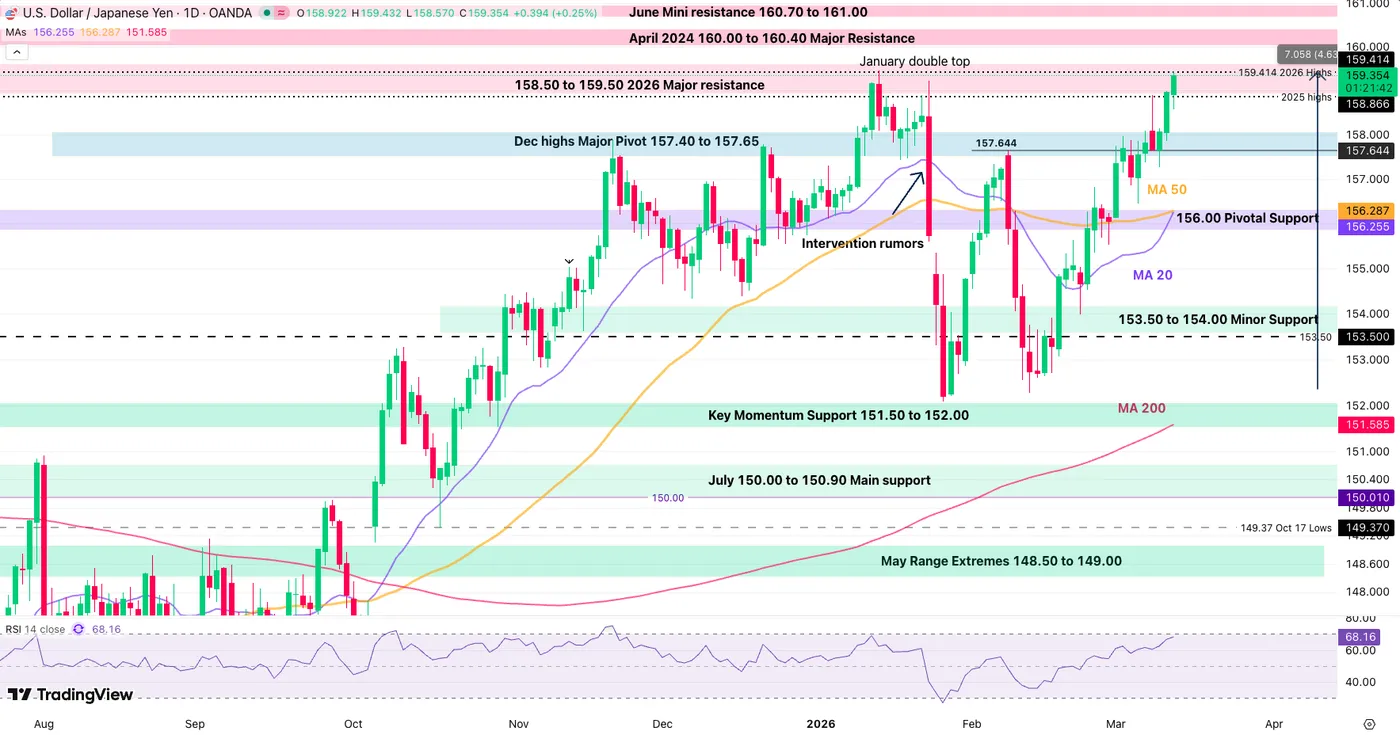
USD/JPY Daily Chart – March 12, 2026. Source: TradingView
USD/JPY has been the most affected major pair since the beginning of the conflict, holding an almost perfectly negative correlation to the Oil prices.
Asian countries are the major victims of Strait of Hormuz disruptions, particularly concerning Oil deliveries.
Despite Japan having some of the most ample strategic Oil reserves, Yen was already facing some heavy scrutiny regarding heavy imports and their more elevated costs.
The effect of higher forecasted deficits doesn't help.
So if the Hormuz Crisis lasts longer, it could be a final nail in the coffin for the pair.
Furthermore, the Japanese Yen is highly correlated to US Treasuries, which have been getting ransacked from the higher inflation expectations due to Japan being the nº1 owner of the Debt asset. The combination of both has led to the current 4.60% move higher in the major pair.
160.00 is the level to watch, as the Ministry of Finance could really move the pin on the numerous threats of an FX intervention – Watch reactions as we regain the January highs.
USD/JPY 1H Chart and Technical Levels
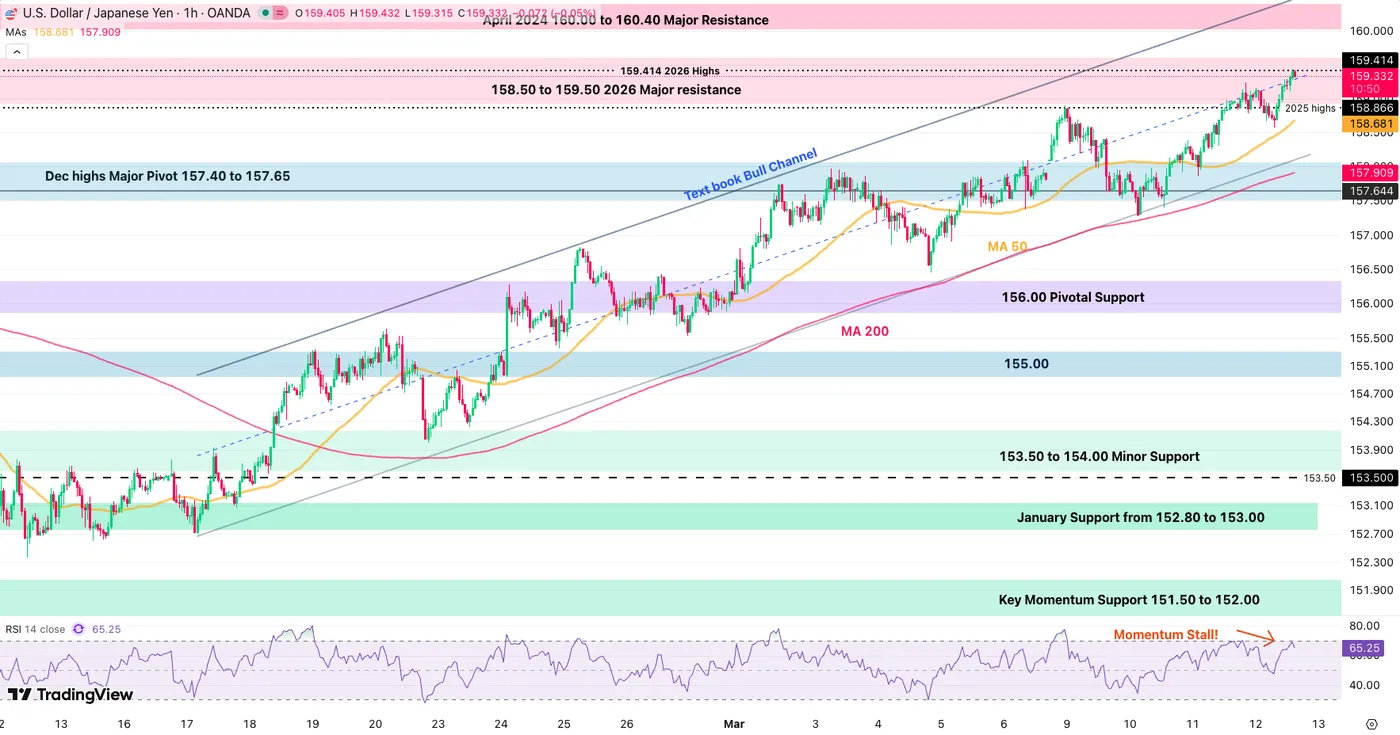
USD/JPY 1H Chart – March 12, 2026. Source: TradingView
Despite the staggering run in the pair, some profit taking is unrolling just after the pair wicked above January highs to 159.420.
Reversing around the mid-line of the textbook bull channel, particularly at current trading levels could bring interesting mean-reversion opportunities.
If the pair continues back above 159.50 and makes a 4H close above, the idea would get pushed back until 160.00, with potential intervention coming up at these levels.
Levels to place on your USD/JPY charts:
Support Levels:
- Bull Channel Lows 158.10
- Dec highs Major Pivot 157.40 to 157.65
- 156.00 Pivotal Support
- 153.50 to 154.00 Minor Support
- 146.00 August Range Main Support
Resistance Levels:
- Daily and 2026 highs 159.420
- 159.00 to 159.50 2026 Major resistance
- April 2024 160.00 to 160.40 Major Resistance
- June 2024 Mini resistance 160.70 to 161.00
Rate Cuts Get Priced Out in 2026! Oil Explodes to $96
The Market is turning bleak in this morning's action as Oil rallies to fresh highs yet again.
Our past-day Oil analysis saw rangebound action to potentially turn into a grind higher, which realized quicker than most expected!
The commodity is up close to 10% on the day, slowly but surely extending to the $98-$100 Resistance.
This occurs as attacks on tankers around the Arabian Sea and the Strait of Hormuz are now multiplying.
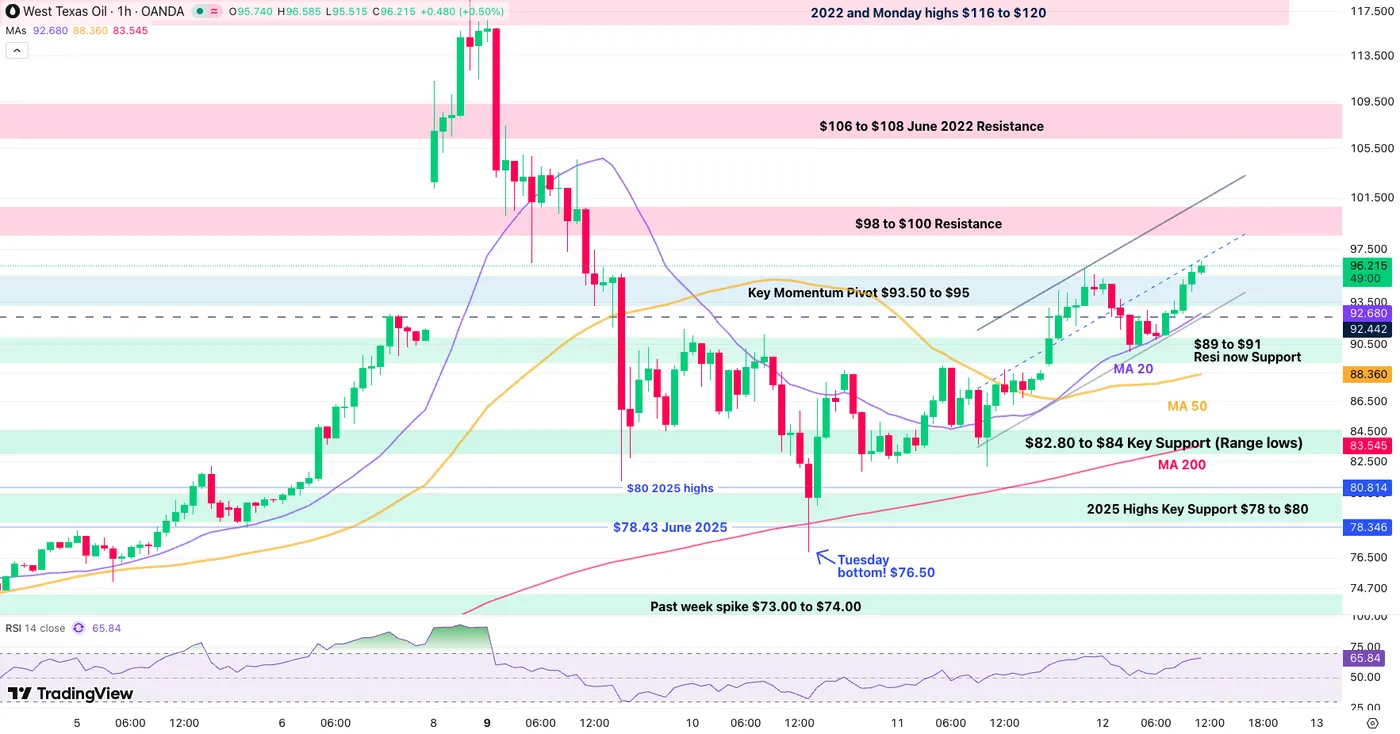
WTI Oil 1H Chart (11:16) – March 12, 2026. Source: TradingView
Oil is forming a bull-channel in the immediate action – Its top is located around $101.30 so that could be a target to the upside.
Buyers are attempting a break of the channel's mid-line ($96.55) – A key area for momentum.
Momentum buyers will want to see if the 20-Hour MA ($92.68) holds.
The recent rise in Oil has gradually priced out Fed Cuts for 2026 due to inflationary fears. There is now less than one full cut priced in for the year!
The FOMC meeting is approaching fast (next Wednesday, March 18).

Current Fed Rate Cut Pricing to the December 2026 Meeting– FedWatch Tool
This is hurting Stock Markets extensively on the session, Nasdaq is leading to the Downside down -1.50% – update coming up soon!
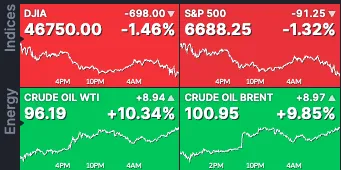
Stock Index and Energy Commodity Futures – Courtesy of Finviz
Safe Trades, keep track of the advancement of the conflict!
AUDCAD Wave Analysis
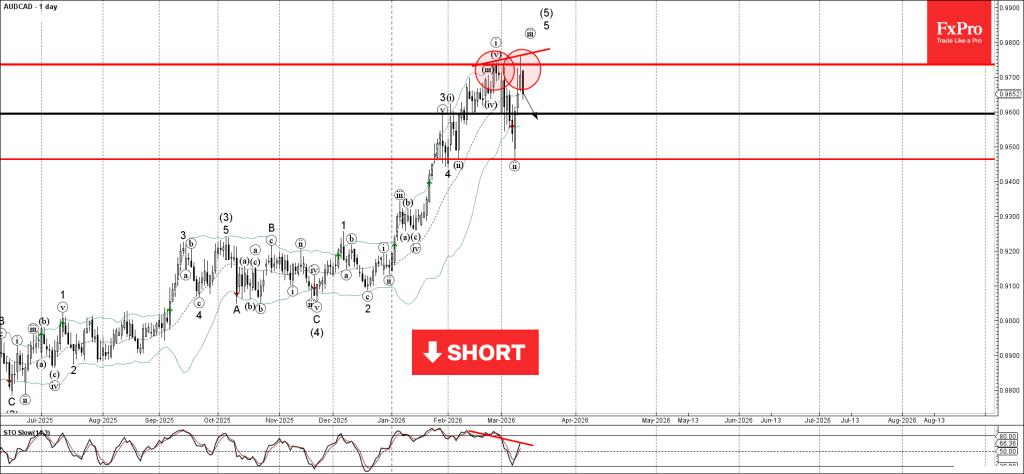
AUDCAD: ⬇️ Sell
- AUDCAD reversed from resistance area
- Likely to fall to support level 0.9600
AUDCAD currency pair reversed from the resistance area between the key resistance level 0.9735 (which stopped wave i at the end of February) and the upper daily Bollinger Band.
The downward reversal from this resistance area will most likely form the daily Japanese candlesticks reversal pattern Bearish Engulfing.
Given the strength of the resistance level 0.9735 and the bearish divergence on the daily Stochastic, AUDCAD currency pair can be expected to fall to the next support level 0.9600.
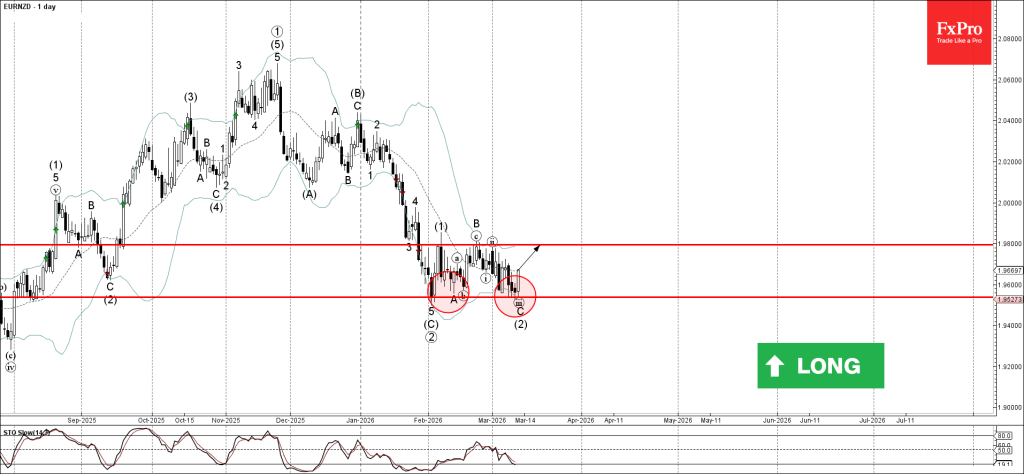
EURNZD Wave Analysis
EURNZD: ⬆️ Buy
- EURNZD reversed from support area
- Likely to rise to resistance level 1.9800
EURNZD currency pair reversed from the support area between the key support level 1.9535 (which has been reversing the price from August of 2025) and the lower daily Bollinger Band.
The upward reversal from this support area stopped the previous wave C of the intermediate ABC correction (2).
Given the strength of the support level 1.9535 and the bullish divergence on the daily Stochastic indicator, EURNZD currency pair can be expected to rise to the next resistance level 1.9800.
Eco Data 3/13/26
| GMT | Ccy | Events | Act | Cons | Prev | Rev |
|---|---|---|---|---|---|---|
| 21:30 | NZD | Business NZ PMI Feb | 55 | 55.2 | 55.1 | |
| 07:00 | GBP | GDP M/M Jan | 0.00% | 0.20% | 0.10% | |
| 07:00 | GBP | Goods Trade Balance (GBP) Jan | -14.4B | -21.7B | -22.7B | |
| 10:00 | EUR | Eurozone Industrial Production M/M Jan | -1.50% | 0.70% | -1.40% | -0.50% |
| 12:30 | CAD | Net Change in Employment Feb | -83.9K | 10.0K | -24.8K | |
| 12:30 | CAD | Unemployment Rate Feb | 6.70% | 6.60% | 6.50% | |
| 12:30 | CAD | Manufacturingles M/M Jan | -3.00% | -3.30% | 0.60% | |
| 12:30 | CAD | Capacity Utilization Q4 | 78.50% | 78.40% | 78.50% | |
| 12:30 | USD | Personal Income M/M Jan | 0.40% | 0.50% | 0.30% | |
| 12:30 | USD | Personal Spending M/M Jan | 0.40% | 0.30% | 0.40% | |
| 12:30 | USD | PCE Price Index M/M Jan | 0.30% | 0.30% | 0.40% | |
| 12:30 | USD | PCE Price Index Y/Y Jan | 2.80% | 2.90% | 2.90% | |
| 12:30 | USD | Core PCE Price Index M/M Jan | 0.40% | 0.40% | 0.40% | |
| 12:30 | USD | Core PCE Price Index Y/Y Jan | 3.10% | 3.10% | 3.00% | |
| 12:30 | USD | GDP Annualized Q4 P | 0.70% | 1.40% | 1.40% | |
| 12:30 | USD | GDP Price Index Q4 P | 3.80% | 3.60% | 3.70% | |
| 12:30 | USD | Durable Goods Orders Jan | -1.40% | 1.10% | -1.40% | -0.90% |
| 12:30 | USD | Durable Goods Orders ex Transport Jan | 0.40% | 0.50% | 0.90% | 1.30% |
| 14:00 | USD | UoM Consumer Sentiment Mar P | 55.5 | 55 | 56.6 | |
| 14:00 | USD | UoM 1-Yr Inflation Expectations Mar P | 3.40% | 3.40% |
| 21:30 | NZD |
| Business NZ PMI Feb | |
| Actual | 55 |
| Consensus | |
| Previous | 55.2 |
| Revised | 55.1 |
| 07:00 | GBP |
| GDP M/M Jan | |
| Actual | 0.00% |
| Consensus | 0.20% |
| Previous | 0.10% |
| 07:00 | GBP |
| Goods Trade Balance (GBP) Jan | |
| Actual | -14.4B |
| Consensus | -21.7B |
| Previous | -22.7B |
| 10:00 | EUR |
| Eurozone Industrial Production M/M Jan | |
| Actual | -1.50% |
| Consensus | 0.70% |
| Previous | -1.40% |
| Revised | -0.50% |
| 12:30 | CAD |
| Net Change in Employment Feb | |
| Actual | -83.9K |
| Consensus | 10.0K |
| Previous | -24.8K |
| 12:30 | CAD |
| Unemployment Rate Feb | |
| Actual | 6.70% |
| Consensus | 6.60% |
| Previous | 6.50% |
| 12:30 | CAD |
| Manufacturingles M/M Jan | |
| Actual | -3.00% |
| Consensus | -3.30% |
| Previous | 0.60% |
| 12:30 | CAD |
| Capacity Utilization Q4 | |
| Actual | 78.50% |
| Consensus | 78.40% |
| Previous | 78.50% |
| 12:30 | USD |
| Personal Income M/M Jan | |
| Actual | 0.40% |
| Consensus | 0.50% |
| Previous | 0.30% |
| 12:30 | USD |
| Personal Spending M/M Jan | |
| Actual | 0.40% |
| Consensus | 0.30% |
| Previous | 0.40% |
| 12:30 | USD |
| PCE Price Index M/M Jan | |
| Actual | 0.30% |
| Consensus | 0.30% |
| Previous | 0.40% |
| 12:30 | USD |
| PCE Price Index Y/Y Jan | |
| Actual | 2.80% |
| Consensus | 2.90% |
| Previous | 2.90% |
| 12:30 | USD |
| Core PCE Price Index M/M Jan | |
| Actual | 0.40% |
| Consensus | 0.40% |
| Previous | 0.40% |
| 12:30 | USD |
| Core PCE Price Index Y/Y Jan | |
| Actual | 3.10% |
| Consensus | 3.10% |
| Previous | 3.00% |
| 12:30 | USD |
| GDP Annualized Q4 P | |
| Actual | 0.70% |
| Consensus | 1.40% |
| Previous | 1.40% |
| 12:30 | USD |
| GDP Price Index Q4 P | |
| Actual | 3.80% |
| Consensus | 3.60% |
| Previous | 3.70% |
| 12:30 | USD |
| Durable Goods Orders Jan | |
| Actual | -1.40% |
| Consensus | 1.10% |
| Previous | -1.40% |
| Revised | -0.90% |
| 12:30 | USD |
| Durable Goods Orders ex Transport Jan | |
| Actual | 0.40% |
| Consensus | 0.50% |
| Previous | 0.90% |
| Revised | 1.30% |
| 14:00 | USD |
| UoM Consumer Sentiment Mar P | |
| Actual | 55.5 |
| Consensus | 55 |
| Previous | 56.6 |
| 14:00 | USD |
| UoM 1-Yr Inflation Expectations Mar P | |
| Actual | 3.40% |
| Consensus | |
| Previous | 3.40% |
Sunset Market Commentary
Markets
The Brent crude price shows no sings of cooling off today with the $100/b mark nearby. Hostile comments from both sides suggest no near-term end to the Middle East conflict with Iran’s Khamenei for example warning of potentially opening new fronts. The Internation Energy Agency said that the war is causing the largest supply disruption in the history of the global oil market. Only yesterday, its member agreed to release 400mn barrels from emergency reserves, but that failed to calm down prices. On the contrary. As the conflict drags on, interest rate money markets continue erring on the side of a different reaction function from central banks. In the case of Europe, they look towards interest rate hikes with German/EMU yields adding a few bps today. The German 10-yr yield today reached its highest level since October 2023 with underlying inflation dynamics doing the same. At 2.3% for Germany, they move further away from the “anchored” position they’ve been in over the past two years near the ECB’s 2% target. UK Gilts extend their underperformance. There, the bear flattening already turns into a bear steepening with yields adding 6 bps (2-yr) to 9 bps (30-yr) today. UK money markets switched from discounting a cumulative 50 bps of rate cuts by the end of this year at the end of February to currently attaching a 50% probability to a rate hike before year-end. The UK 2-yr yield surpasses the 4% mark with the UK 10-yr yield (4.76%) gradually closing in on a test of the 2024 high at 4.92%. Overall risk sentiment takes a new significant setback with main European and US indices losing around 1.5%. In FX space, dollar remains king with the trade-weighted greenback testing the YtD highs at 99.68 and EUR/USD testing the YtD lows just north of 1.15. Both are risk of a (USD) break higher. US eco data included January trade numbers. Based on strong export numbers (+5.5% M/M), our in-house KBC Nowcast for Q1 GDP jumps to 4% Q/Qa, but no strong conclusions should be drawn at this stage as the volatility in the data remains significant. We keep a close eye at the US Treasury’s 30-yr Bond auction tonight following weak 3-yr Note and 10-yr Note sales earlier this week.
News & Views
The German Kiel IFW Institute and the Ifo institute today published its Spring eco forecasts for Germany. The forecast of the Kiel Institute has a working assumption that commodity prices, consistent with market expectations, will stay significantly elevated only for a short period and then start to ease again. The Institute then sees a 0.6% of GDP loss of purchasing power this year. The Kiel Institute reduces its 2026 GDP growth forecast for Germany to 0.8% (from 1% Winter forecast). 2027 growth is still seen reaccelerating to 1.4%. Due to the rise in energy prices, inflation is forecast at 2.5% this year (from 1.8%) to still hold at 2.1% next year. The institute sees moderate export growth (0.3%) but this still causes Germany to lose global market share. It takes a guarded approach on the structural growth potential of the economy. “Without the stimulus measures bought with high budget deficits, the momentum would be so moderate that it does not qualify for a self-sustaining recovery.". The public deficit is projected to rise from 2.7% of GDP in 2025, to 3.7% this year and 4.2% in 2027. Ifo works with two scenarios. In a de-escalation scenario, GDP growth is seen at 0.8% this year and 1.2% next year. Without the energy price shock, IFO would have set a slight upward revision (to 1%), as the fiscal measures in the defense sector are having a faster impact. Inflation is expected to peak just below 2.5%. In the escalation scenario, the growth burden will increase to 0.8 ppt negative this year and next year compared to the pre-war scenario. Inflation then remains higher for longer and peaks at just under 3%. This is not only due to energy prices, but also as higher production costs will be passed on to the prices of other goods and services. The ECB is than expected to respond by raising the policy interest rate by a total of 50 basis points in H2. With GDP growth of just 0.6% and 0.8% this year and next year, the recovery will continue.
Indian inflation accelerated from 2.74% Y/Y in January to 3.02% in February. Food prices in the same context rose from 2.13% Y/Y to 3.46%. The rise in inflation was slightly more than expected. Even so inflation currently holds well with the 4% +/-2% inflation target range of the Reserve Bank India (RBI) RBI over last year reduced the policy rate from 6.5% to currently 5.25%. It left the policy rate unchanged at the February meeting. As the case for most other countries, the rise in energy prices also here poses upside inflation risks, with the rupee trading at all-time lows against the dollar, adding to those risks. USD/INR currently trades near 92.2. According to Bloomberg reporting, referring to people familiar with the matter the RBI today conduced FX swaps support the rupee.
GBP/USD at the Crossroads: Will Cable Break the 1.3437 Resistance?
- The US Dollar remains strong, driven by safe-haven flows from ongoing geopolitical conflicts and rising inflationary concerns.
- Expectations for US rate cuts have fallen sharply from 66 basis points (bps) to around 30 bps due to the potential impact of high oil prices on inflation.
- GBP/USD is caught in a technical tug-of-war, facing immediate resistance at the 100-day moving average of 1.34376.
GBP/USD has found support in early trade around the 1.3360 handle. A stellar rally from the Monday lows ran into resistance provided by the 100-day MA at 1.3437 as risk off sentiment returned and the US Dollar strengthened.
Will USD strength keep further gains at bay?
The rise in GBP/USD today comes as the US Dollar index retreats from a multi month resistance level at 99.57.
If this level holds and DXY continues to decline then GB/USD could retest the 100-day MA and finally the psychological 1.3500 handle.
Cable's fate is very much tied to the US Dollar at the moment, while the US Dollars is tied to overall risk sentiment as well as inflationary concerns. Given the steep rise in oil prices and the impact it may have on gasoline prices, markets expect a potential 3% rise in headline inflation next month.
These developments are also keeping the US Dollar supported as rate cut expectations have fallen from around 66 bps two weeks ago to around 30 bps as of this morning.
US Dollar Index Daily Chart, March 12, 2026
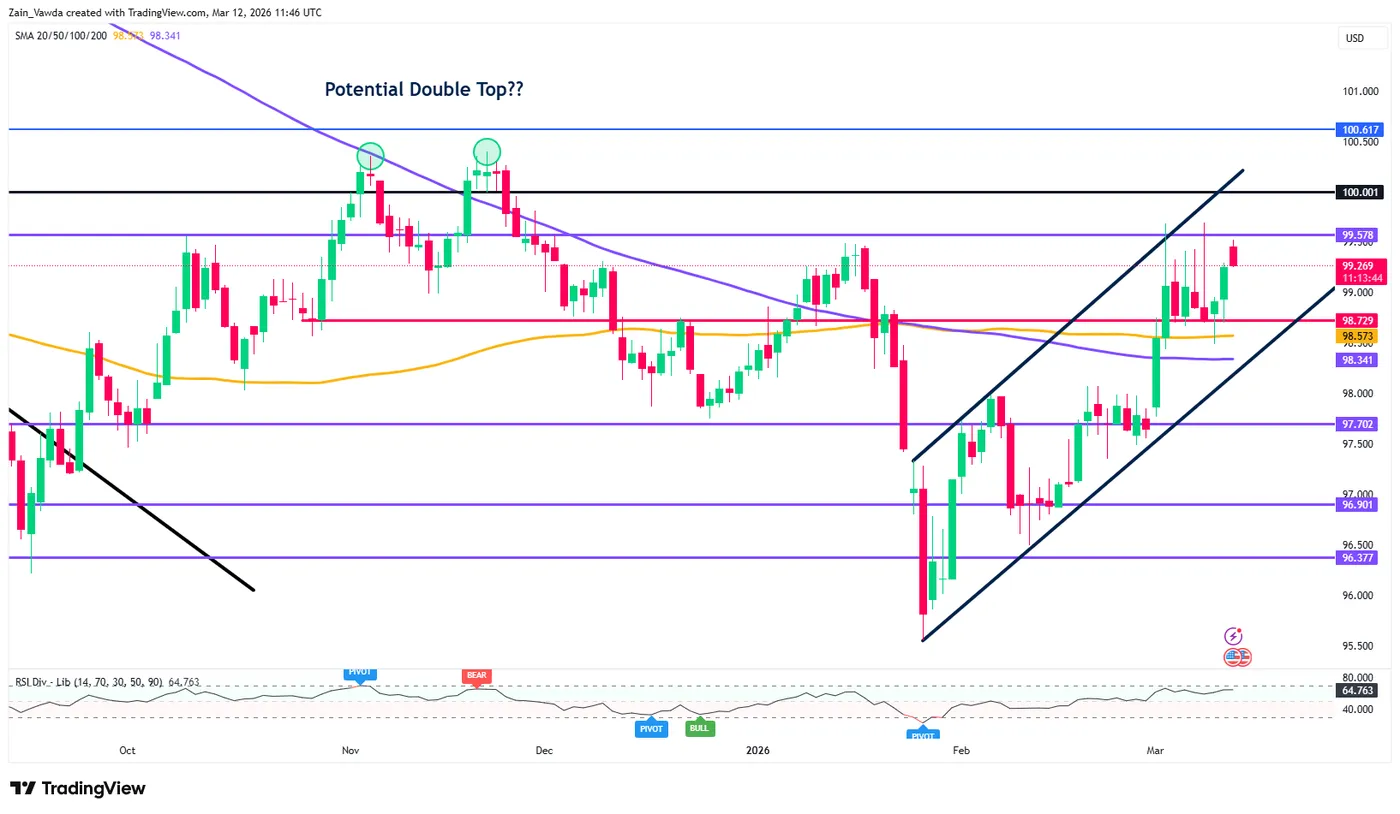
Source: TradingView
What next for the Dollar and GBP/USD?
Financial markets remain primarily focused on the duration of current geopolitical conflicts and the resulting supply shocks.
Recent emergency measures intended to mitigate oil supply disruptions may have inadvertently signaled to investors that global leaders anticipate a prolonged period of tension rather than a swift de-escalation, a sentiment reflected in yesterday's volatile oil and equity performance.
Furthermore, market sensitivity to optimistic military updates from the Trump administration appears to be waning, as investors grow increasingly skeptical of claims regarding the achievement of strategic objectives.
While the fx market continues to be driven by immediate headlines, the broader signals emanating from equity and energy sectors currently suggest a bullish outlook for the US Dollar, especially if the conflict drags on for a prolonged period.
Tomorrow's US PCE data may also take a backseat to the geopolitical situation as markets know that any inflation numbers at the moment are out of touch with the new reality.
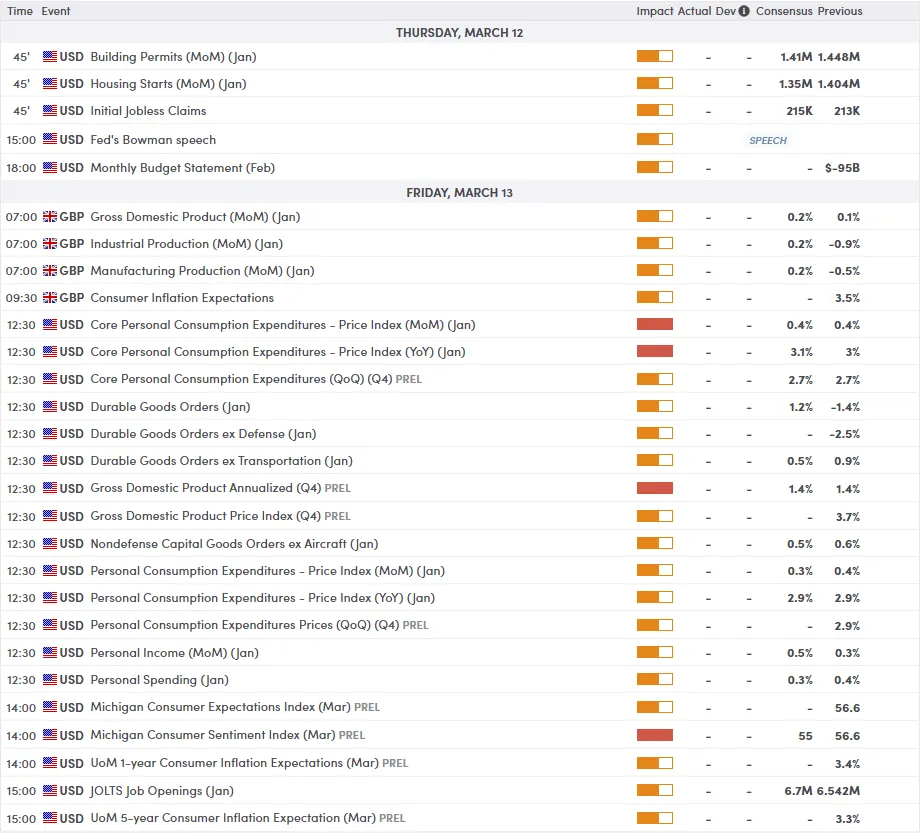
For all market-moving economic releases and events, see the MarketPulse Economic Calendar. (click to enlarge)
Technical Analysis - GBP/USD
From a technical perspective, the pair is currently caught in a tug-of-war between a long-term downtrend and a significant horizontal support zone.
While the British Pound has shown resilience, the US Dollar remains dominant due to safe-haven flows stemming from the ongoing conflict in the Middle East and concerns over the Strait of Hormuz.
Technical Indicators
Simple Moving Averages (SMA):
- 100-period SMA (Blue): Currently at 1.34376. This acts as immediate dynamic resistance. The price is currently trading below this line, confirming a bearish bias on the 4-hour timeframe.
- 200-period SMA (Dark Blue): Sitting higher at 1.35543. The fact that the 100-SMA is below the 200-SMA indicates that the medium-term trend remains firmly to the downside.
The RSI period-14 is currently at 51.20, which is usually a sign that momentum has shifted to potentially favor bulls.
Trading Outlook
- Bearish Case: If the pair fails to break above the 100-period SMA (1.34376), expect a retest of the 1.33788 support. A break below the recent low of 1.33332 would open the door to 1.3250.
- Bullish Case: A sustained move above 1.3450 would invalidate the immediate bearish structure, potentially leading to a test of the 200-period SMA near 1.3550.
GBP/USD Daily Chart, March 12, 2026
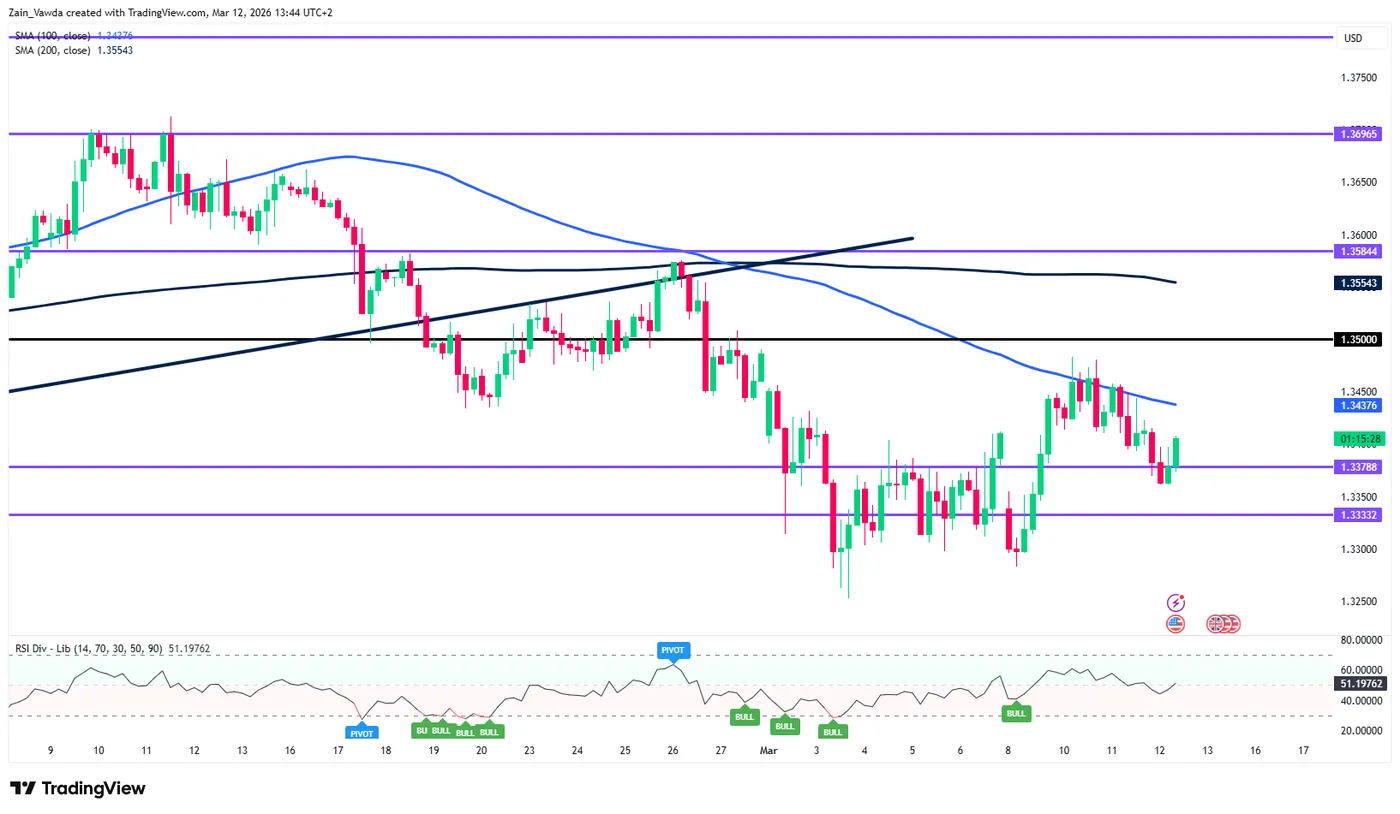
Source:TradingView.com
Canada’s Trade Deficit Widens in January
Canada's trade deficit widened substantially in January, up to $3.6 billion from $1.3 billion in December.
Exports in January slipped 4.7% month-on-month (m/m), more than reversing last month's gain. Exports of motor vehicles and parts fell sharply (-21.2% m/m) to its lowest level since late-2021. In line with recent trends, exports of unwrought gold, silver and platinum groups were volatile, down by 12.6% m/m. Energy exports, led by natural gas (+23.7% m/m) provided a bit of an offset. In total, 6 of 11 product categories registered a decrease on the month.
Goods imports fell in January (-2.2% m/m), with 7 of 11 subsectors booking a decline. Imports of motor vehicles and parts (-8.3% m/m) was also the biggest contributor to the contraction. A 3.6% m/m dip in electronic and electrical equipment also dragged the headline lower, with industrial machinery and equipment (+3.4% m/m) providing an offset.
In volume terms, exports sagged by 5.8% m/m while imports fell by a lesser 2.2% m/m.
Canada's merchandise trade surplus with the United States narrowed from $5.7 billion in December to $5.3 billion in January. Exports to non-U.S. destinations fell by 6.5% m/m after reaching an all-time high last months.
Key Implications
Trade activity had a chilly start to 2026. Much of the weakness however came through the auto sector as prolonged seasonal production stoppages muddied both the export and import numbers – we expect some improvement as conditions normalize over the next couple of month. The recent sharp increase in oil prices won't materialize in Canada's trade balance until March, so with the limited data we have for the quarter, net trade will likely be a drag on Q1-2026 real GDP growth.
The recent U.S. Supreme Court ruling striking down the IEEPA tariffs is a small net positive for Canada, reducing tariffs on non-USMCA compliant exports from 35% to 10% and marginally lowering the country's effective tariff rate. Now, the main focus is the upcoming CUSMA review, due by July 1st. Our base case is that the agreement remains in place, though the possibility of scenarios involving U.S. withdrawal will continue to weigh on business confidence and investment.