Sample Category Title
Elliott Wave View: Nasdaq (NQ) Consolidation Likely to Break Lower
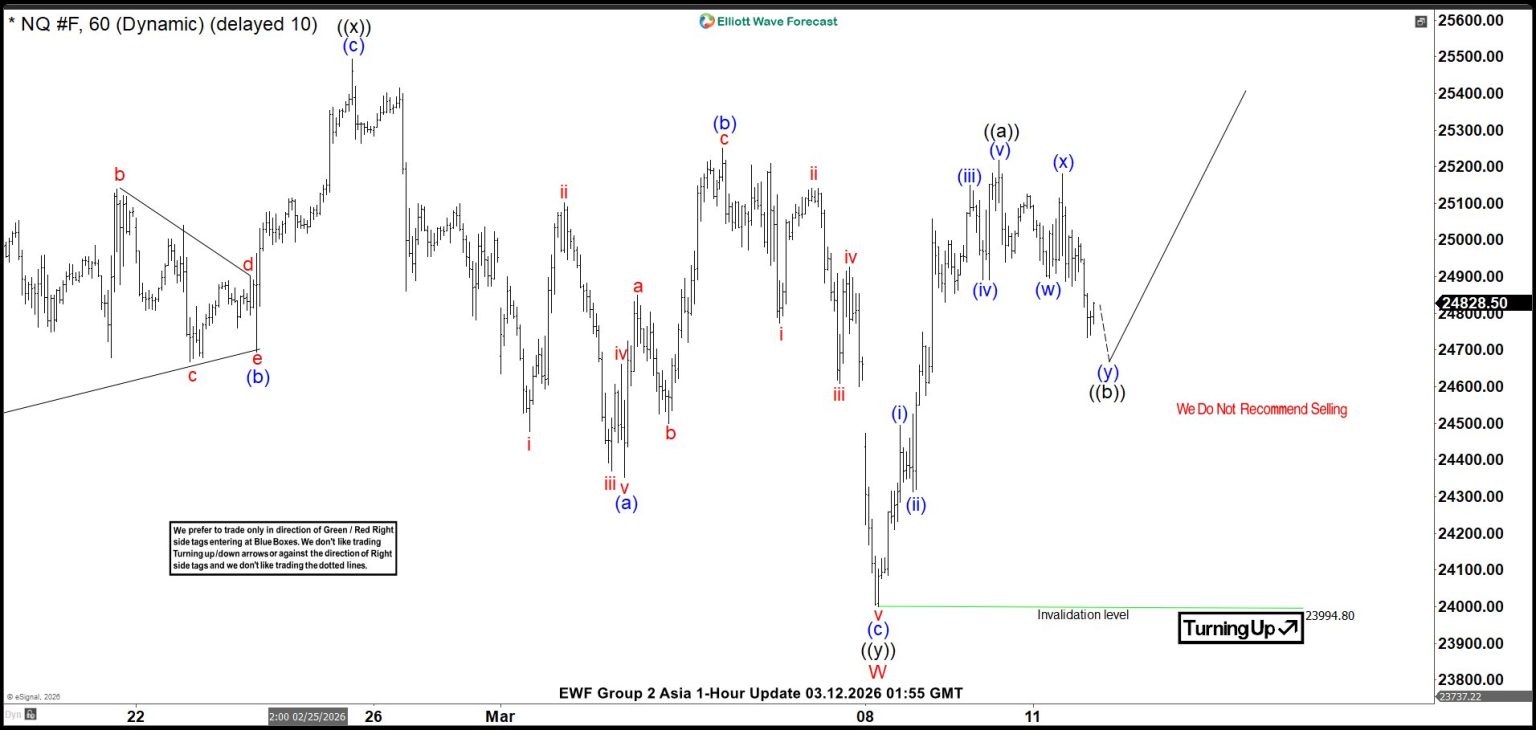
Since peaking on October 30, 2025, the Nasdaq (NQ) has remained in a sideways consolidation, a pattern that appears poised to resolve lower. The decline from that high marked the completion of wave (W) at 23,994.5. Subsequently, a corrective rally unfolded, ending wave (X) at 26,349, after which the Index turned down again into wave (Y). The internal structure of wave (Y) is developing as a double three Elliott Wave formation, underscoring the complexity of the ongoing correction.
From the termination of wave (X), the market produced a decline that completed wave W at 24,000. Following this, wave X began to unfold as a zigzag Elliott Wave structure. Within this sequence, wave ((a)) advanced to 25,217.5 before a pullback commenced in wave ((b)). This retracement is currently in progress and serves to correct the cycle that began from the March 9, 2026 low. Once this correction is complete, the expectation is for the Index to resume higher in wave ((c)) of X.
In the near term, as long as the pivot at 23,994.8 remains intact, the Index retains the potential to turn upward in wave ((c)). Such a move would complete the corrective rally in wave X before the broader downtrend resumes. The overall structure suggests that while short-term strength may emerge, the larger corrective sequence is not yet finished, and the eventual resolution is likely to favor the downside.
Nasdaq (NQ) 60-Minute Elliott Wave Chart
NQ Elliott Wave Video:
https://www.youtube.com/watch?v=e7iWqBKpGNc
Oil is Up, Again
US inflation came in line with expectations for the February reading; headline inflation steadied near 2.4% y/y, core inflation near 2.5%. Yet the tame numbers couldn’t cheer investors as oil prices rose despite news that the IEA would release a record amount from its strategic reserves to keep oil prices in check as the Middle East war continues with no near-term end in sight.
This felt like a typical buy-the-rumour, sell-the-fact pricing dynamic: oil prices eased earlier this week on news that the IEA would release reserves and rebounded after the announcement that 400 million barrels would be released. The IEA announcement was at the top end of expectations; it could have given some relief, but as was the case during the release in the early days of the Ukrainian war, the news instead fuelled oil prices.
Some say that the size of the release actually increased worries that the war could last longer. Again, the math is simple: 400 million barrels would only be enough to meet the IEA’s oil demand for roughly 9-10 days. After that? The IEA system is estimated to hold around 1.2 billion barrels. It goes fast. Its head, Fatih Birol, said that only the resumption of normal trade through the Strait of Hormuz would help. Well, that’s not on the menu du jour.
Oil spiked higher again this morning, with US crude up more than 6% at the time of writing, above $94 per barrel, and Brent up 7% near $97 per barrel on news that three more vessels were struck in the Gulf yesterday.
In summary, oil will hardly return to levels that would tame inflation expectations until geopolitical tensions materially ease.
Rising oil prices are leading to a significant shift in central bank expectations. The US 2-year yield – which best captures Federal Reserve (Fed) expectations – approached 3.70% this morning, the highest since September, while the benchmark European 10-year yield spiked to more than 2.5-year highs, near 2.95%.
The US dollar is up again this morning, extending gains against most majors. But the Middle East war and rising oil prices hit majors unevenly. The so-called oil currencies – the Australian dollar and Canadian dollar – have outperformed since the war broke out almost two weeks ago, while the oil-dependent yen and the euro have been among the hardest hit.
The USDJPY is preparing to test the 160 level, which could trigger intervention from authorities, while some European Central Bank (ECB) officials warn they are not willing to repeat the mistake made during the Ukrainian energy crisis and could act sooner rather than later to prevent inflation from rising on the back of higher energy prices. But that comes with the threat of slowing demand and is not necessarily positive for the euro.
The EURUSD could retreat toward 1.1350 without compromising its longer-term bullish trend that has been building since the beginning of 2025 following Donald Trump’s return to the White House. Below that level, the single currency would return to a bearish consolidation zone, and rising oil prices – along with Europe’s energy-dependent status – would likely be to blame.
What’s certain is that a second energy crisis in five years highlights the urgent need to wean economies off imported energy. Clean energy funds are rising along with oil and gas prices these days, while gains in uranium remain relatively weak, which is surprising as European officials said this week that abandoning nuclear was a strategic mistake and that the continent is considering returning to nuclear energy. It may be the only way to gain greater energy independence as wind and solar alone cannot meet total demand.
In the traditional energy space, energy companies gained 2.5% in the US yesterday, while the S&P 500 was flat to slightly negative. Modest gains across Big Tech helped limit losses at the index level, as Oracle jumped 9% after announcing strong results and better-than-expected guidance, while telling investors that customers would pay up-front for the expensive chips themselves, preventing the company from taking on more debt. It’s an unusual move, but it helped ease concerns about leveraged investment in AI infrastructure.
Elsewhere, private credit stress has worsened this week, with multiple reports of banks writing down the value of their loans – especially to software companies facing AI-related uncertainty.
I don’t want to sound pessimistic, but there is a combination of ugly developments suggesting that market risks remain tilted to the downside. We have AI anxiety, severe disruption to oil and fertilizer trade, a significant threat to global inflation and private credit stress. And yet many Western indices are still near all-time highs.
A 10% retreat in US equity indices is plausible. Given the cyclical and energy-dependent nature of European companies, Europe could see a deeper sell-off. The Stoxx 600 lost around 8% at the worst of this week’s sell-off, and the recovery remains fragile and highly dependent on war headlines.
One place that has outperformed global peers is China. The CSI 300 index has lost less than other major indices, partly thanks to diversified energy supplies. The fact that Russia benefits from Middle East oil disruptions and that the US has softened its tone regarding purchases of Russian oil also helps.
But if the war pushes global economies into contraction, China – which exported record volumes last year – could also face difficulties. Domestically, the country continues to struggle with property and demographic challenges, meaning China could hardly do well if its main trading partners weaken.
So, there is nowhere to hide safely. War headlines and energy prices will determine how risk appetite evolves in the coming days. It is nearly impossible to give precise price forecasts. Instead, taking oil and energy prices as given, the longer they remain high, the shorter market rebounds are likely to be and the greater the risk of a notable market correction.
Oil Price Back at USD 100/bbl Despite Record Release of Oil Reserves
In focus today
Today, focus will remain on energy markets as investors look for signs of progress in resolving the Gulf oil disruptions and gauge the impact of the IEA's record reserve release.
US January international trade data is due for release today. We think that rebounding imports will continue to widen the trade deficit in early 2026.
In Sweden, the final inflation outcome for February, along with the underlying details, is being released today. In the current situation, the focus is on the future, and February's figures may already feel outdated. However, the details will provide valuable information on the starting point as we face turbulent global market prices. The preliminary outcome indicated CPIF excluding energy at 1.4%, CPIF at 1.7%, and CPI at 0.5%. This is the first time preliminary figures for subcategories have been published, making it interesting to see to what extent they are revised. The aggregated figures tend to hold up well.
Economic and market news
What happened yesterday
In Oil markets, the oil price jumped back at the USD100/bbl level after Iraq and Oman halted oil operations due to the war. The IEA's announcement of a record release of 400 million barrels from strategic oil reserves has failed to calm the market, likely because the decision was anticipated and lacks details on the pace and breakdown of reserve sales. The worry in the oil market seems to be both the immediate supply situation and the growing risk of a lasting impact as producers in the region continue to shut down production. The oil price traded as high as USD118/bbl on Monday and there is a clear chance it could rise to that level again or higher. Adding to upward pressure, six vessels were attacked in Gulf and Strait of Hormuz waters on Wednesday, including two tankers in Iraqi waters and four merchant ships in Gulf waters, bringing the total number of vessels struck since the conflict began to 16. Iran's Revolutionary Guards reiterated their threat to block oil exports to the US, Israel, and their allies, while military officials warned that oil prices could surge beyond USD200/bbl.
ECB Executive Board member Schnabel was on the wire yesterday, highlighting that the March forecasts will partly reflect the economic impact of the Iran conflict, noting upside inflation risks amid geopolitical uncertainty. Schnabel reiterated that policy remains in a "good place" but stressed the need to monitor the persistence of energy-price shifts closely. Meanwhile, Slovakian ECB governor Kazimir stated, "I'd say a reaction by the ECB is potentially closer than many people think," while emphasising patience for now as the ECB prepares for its March meeting.
In the US, February CPI came in unchanged and in line with expectations, with headline inflation at 2.4% y/y and core inflation steady at 2.5% y/y. Monthly CPI rose 0.3% m/m (prior: 0.2%), while core CPI eased to 0.2% m/m (prior: 0.3%). Energy prices rebounded, but markets showed little reaction, remaining focused on oil prices and the Strait of Hormuz.
Morgan Stanley restricted redemptions at one of its private credit funds after investors sought to withdraw nearly 11% of shares, returning only 45.8% of requests for the quarter. Concerns over credit deterioration, AI disruption in software companies, and higher interest rates are weighing on the USD 2 trillion private credit market. JPMorgan has marked down loans to private credit funds, while BlackRock and Blackstone have also limited withdrawals amid surging redemption requests. Shares of private credit firms continue to face pressure as investor fears grow over valuation transparency and redemption risks.
In the euro area, governments are taking steps to shield consumers and small businesses from rising energy prices, which could lead to larger deficits and increased debt issuance. Croatia implemented a binding cap on fuel prices two days ago, while Greece has capped profit margins for fuel companies and food retailers until 30 June, but has not capped outright fuel prices. Austria will introduce a cap on power prices for households and small businesses starting in July. France and Italy are monitoring petrol pump prices for excess profits but have refrained from announcing price caps or fiscal easing measures so far. Any easing of fiscal policy could strengthen hawkish voices in the ECB's governing council, but we still expect the ECB to remain unchanged.
In Sweden, unemployment statistics from the Public Employment Service for February were published this morning. The situation on the labour market continues to improve, and unemployment according to the service's statistics is now at 6.6%. Tomorrow, the official AKU unemployment data will be published.
Equities: Equities headed south again on Wednesday. Oil price still governing the moves in bond and equity markets and with oil prices above 100 dollar per barrel this morning, futures indicated another red start in the ballpark of -1%. Diving into markets in more detail, US tech continued to outperform the market yesterday. It was not a classic risk-off session, as was the case for most of last week as well. Instead, many defensive sectors were hit the hardest and consumer staples one of the worst performers.
FI and FX: Risk sentiment retreated again over yesterday's trading session following headlines from the Middle East. Markets were not convinced that the IEA will be able to stabilize oil prices with its 400-million-barrel release of strategic reserves. Brent crude is back just below the USD 100/bbl mark. EUR/USD continued to trade lower below 1.16, EUR/SEK bounced back just shy of 10.70 and EUR/NOK weakened to about 11.17. US Treasury yields were about unchanged, up about 1bp across the belly of the curve. European bond markets underwent a bearish repricing amid hawkish comments by ECB staff, with 2Y EUR swap yields climbing about 10bp.
EUR/AUD Daily Outlook
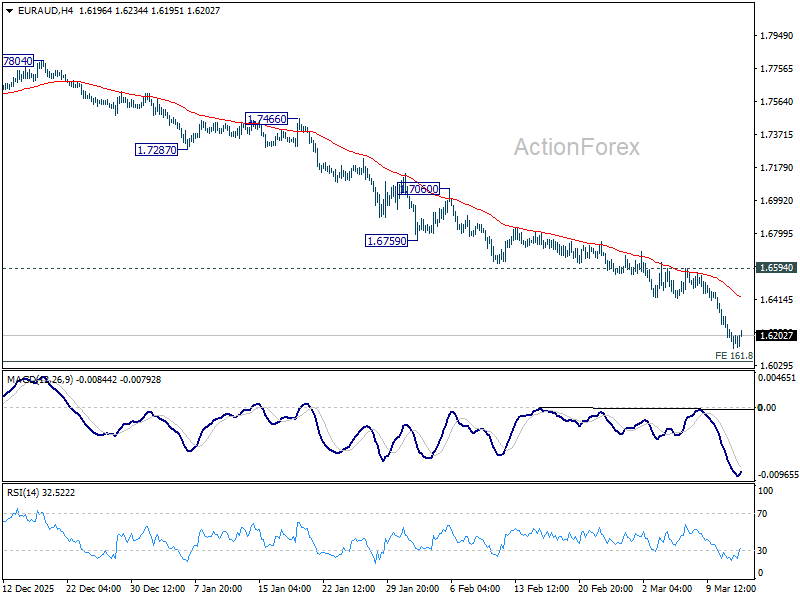
Daily Pivots: (S1) 1.6095; (P) 1.6208; (R1) 1.6286; More...
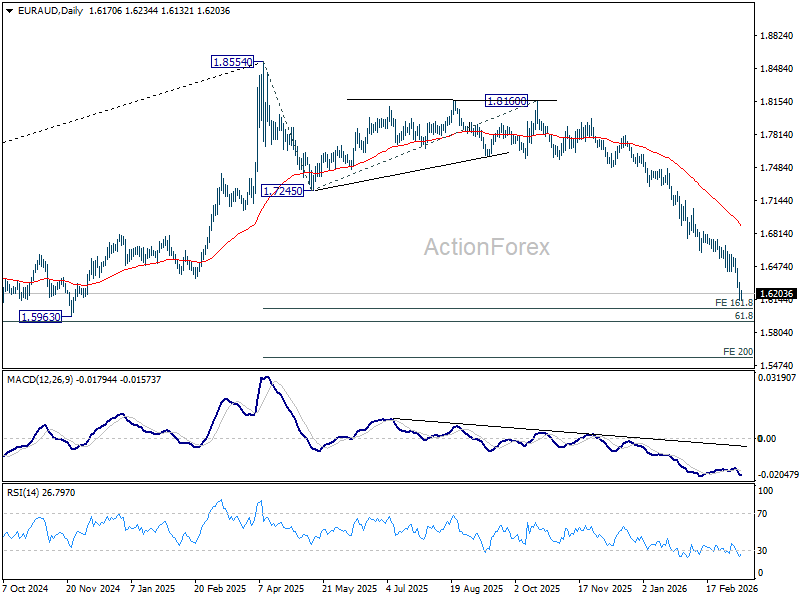
Intraday bias in EUR/AUD remains on the downside as down trend continues for 161.8% projection of 1.8554 to 1.7245 from 1.8160 at 1.6042. Firm break there will pave the way to 200% projection at 1.5542. For now, near term outlook will remain bearish as long as 1.6594 support holds, in case of recovery.
In the bigger picture, fall from 1.8554 medium term top is seen as reversing the whole up trend from 1.4281 (2022 low). Deeper decline should be seen to 61.8% retracement of 1.4281 to 1.8554 at 1.5913, which is slightly below 1.5963 structural support. Decisive break there will pave the way back to 1.4281. For now, risk will stay on the downside as long as 55 D EMA (now at 1.6884) holds, even in case of strong rebound.
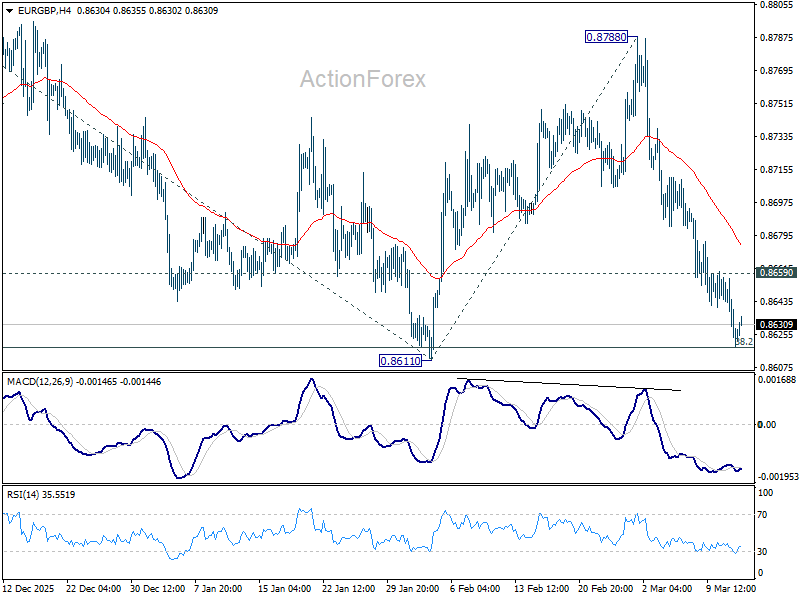
EUR/GBP Daily Outlook
Daily Pivots: (S1) 0.8611; (P) 0.8635; (R1) 0.8649; More…
EUR/GBP's fall from 0.8788 is still in progress and intraday bias stays on the downside. Firm break of 0.8611 will resume the whole decline from 0.8863, and target 100% projection of 0.8863 to 0.8611 from 0.8788 at 0.8536. On the upside, above 0.8659 minor resistance will turn intraday bias neutral again first.
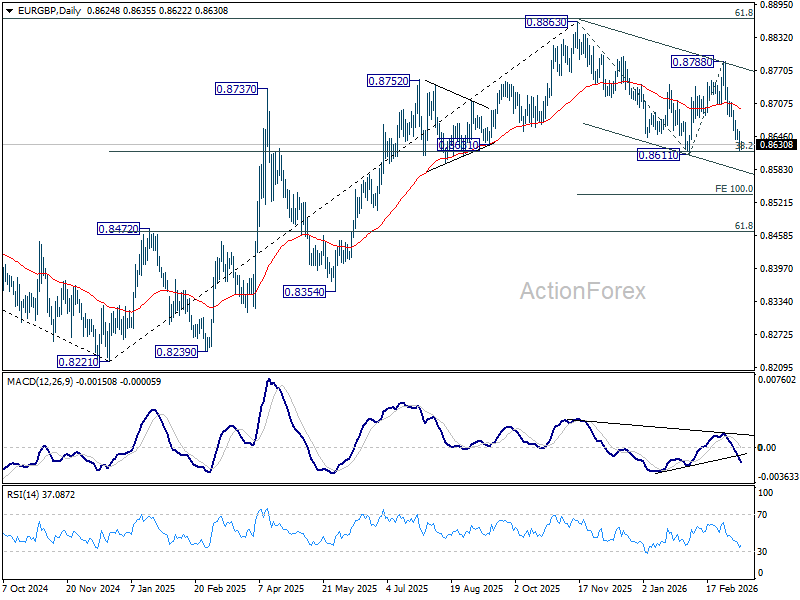
In the bigger picture, current development revived the case that whole rise from 0.8221 (2024 low) has completed at 0.8863, after rejection by 61.8% retracement of 0.9267 (2022 high) to 0.8221 at 0.8867. Sustained trading below 38.2% retracement of 0.8821 to 0.8863 at 0.8618 will confirm this case, and bring deeper fall to 61.8% retracement at 0.8466 at least. For now, medium term outlook is neutral at best as long as 0.8863 resistance holds.
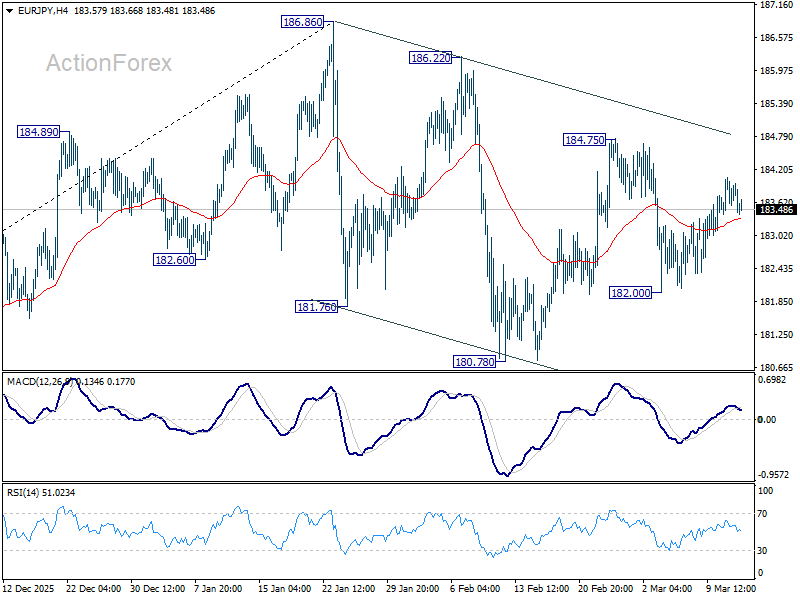
EUR/JPY Daily Outlook
Daily Pivots: (S1) 183.50; (P) 183.80; (R1) 184.15; More...
No change in EUR/JPY's outlook and intraday bias stays neutral. On the upside, above 184.75 will resume the rebound from 180.78 to retest 186.86 high. Firm break there will confirm larger up trend resumption. On the downside, 182.00 will target 180.78. Firm break there will indicate that fall from 186.86 is already correcting whole up rise from 154.77.
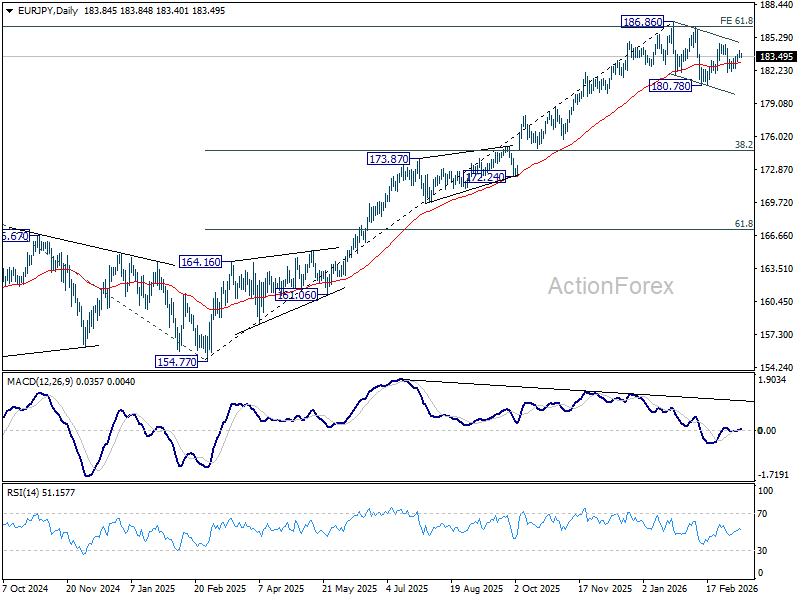
In the bigger picture, a medium term top could be in place at 186.86 and some more consolidations could be seen. Nevertheless, the larger up trend from 114.42 (2020 low) remains intact. Firm break of 186.86 will pave the way to 78.6% projection of 124.37 (2022 low) to 175.41 (2025 high) from 154.77 at 194.88 next.
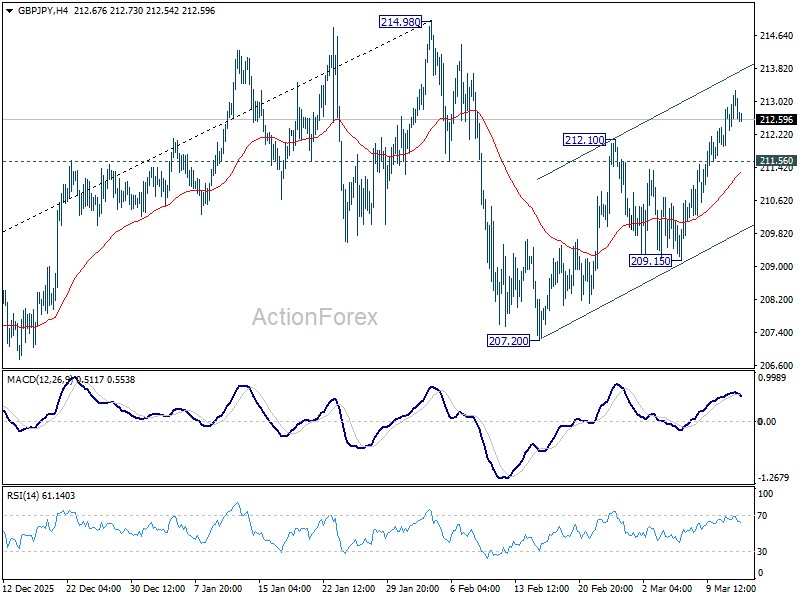
GBP/JPY Daily Outlook
Daily Pivots: (S1) 212.35; (P) 212.83; (R1) 213.66; More...
Intraday bias in GBP/JPY remains mildly on the upside at this point. Rise from 207.20 should continue to retest 214.98 high. Firm break there will resume larger up trend. On the downside, below 211.56 minor support will turn intraday bias neutral first. Further break of 209.15 will extend the corrective pattern from 214.98 with another falling leg, and target 207.20 support.
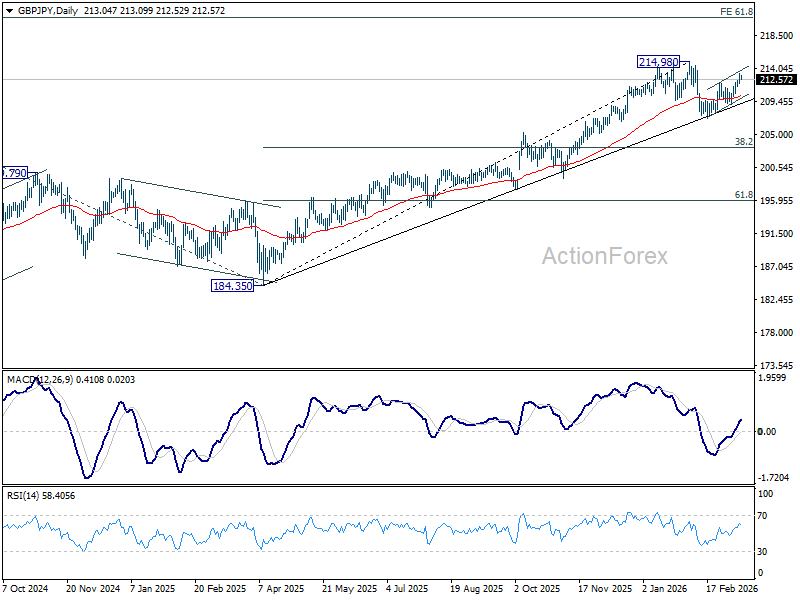
In the bigger picture, up trend from 123.94 (2020 low) is still in progress. Firm break of 214.98 will target 61.8% projection of 148.93 (2022 low) to 208.09 (2024 high) from 184.35 at 220.90. This will remain the favored case as long as 55 W EMA (now at 202.80) holds, even in case of another deep pullback.
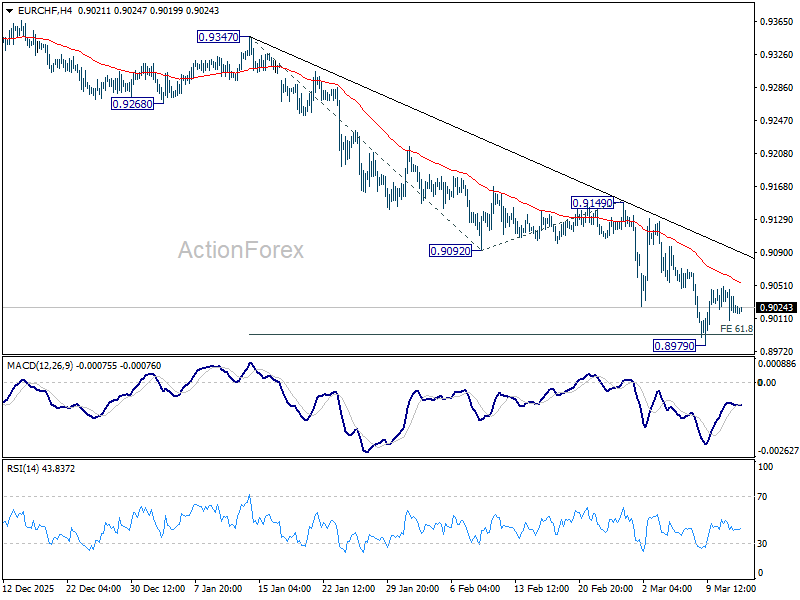
EUR/CHF Daily Outlook
Daily Pivots: (S1) 0.9007; (P) 0.9028; (R1) 0.9047; More....
Sideway trading continues in EUR/CHF and intraday bias remains neutral. Outlook will stay bearish as long as 0.9149 resistance holds. On the downside, below 0.8979 will extend the larger down trend to 100% projection of 0.9347 to 0.9092 from 0.9149 at 0.8894.
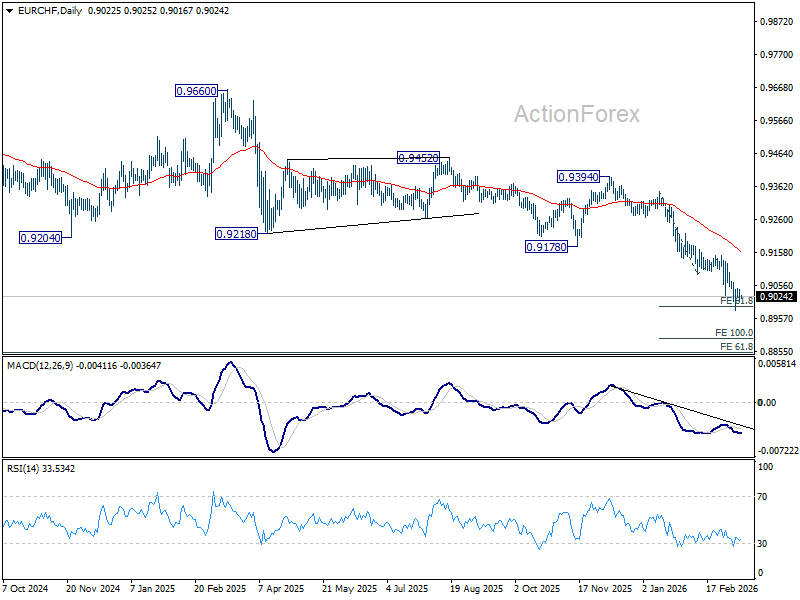
In the bigger picture, down trend from 0.9928 (2024 high) is still in progress. Next target is 61.8% projection of 1.1149 to 0.9407 from 0.9928 at 0.8851. Outlook will stay bearish as long as 0.9394 resistance holds, in case of rebound.
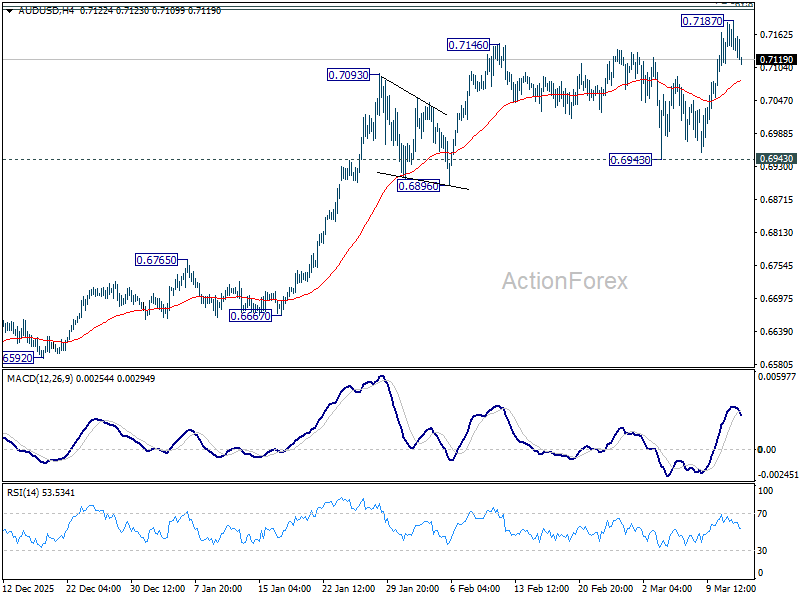
AUD/USD Daily Report
Daily Pivots: (S1) 0.7113; (P) 0.7151; (R1) 0.7189; More...
AUD/USD retreated after hitting 0.7187 and intraday bias is turned neutral first. Outlook stays bullish with 0.6943 support intact. Firm break of 100% projection of 0.5913 to 0.6706 from 0.6420 at 0.7213 could prompt upside acceleration to 161.8% projection at 0.7703.
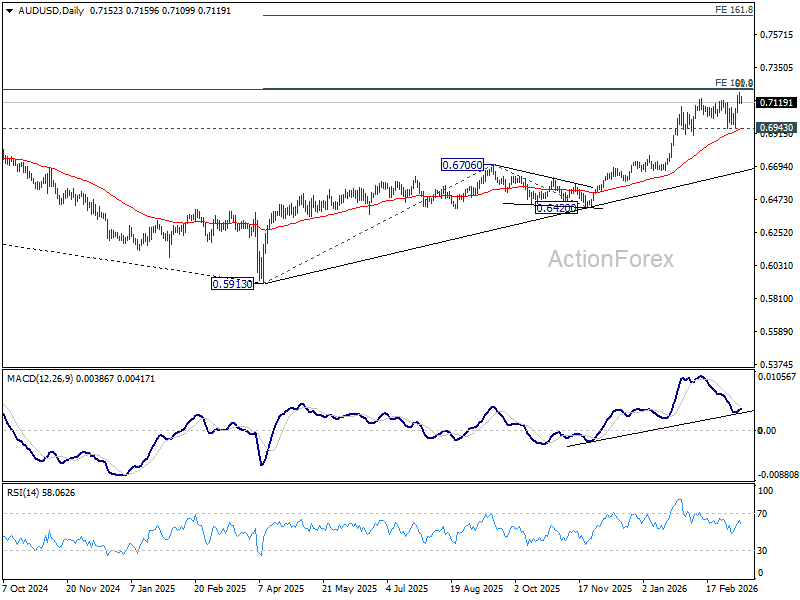
In the bigger picture, current development argues that rise from 0.5913 (2024 low) is reversing whole down trend from 0.8006 (2021 high). Decisive break of 61.8% retracement of 0.8006 to 0.5913 at 0.7206 will pave the way back to 0.8006. This will remain the favored case as long as 0.6706 resistance turned support holds, even in case of deep pullback.
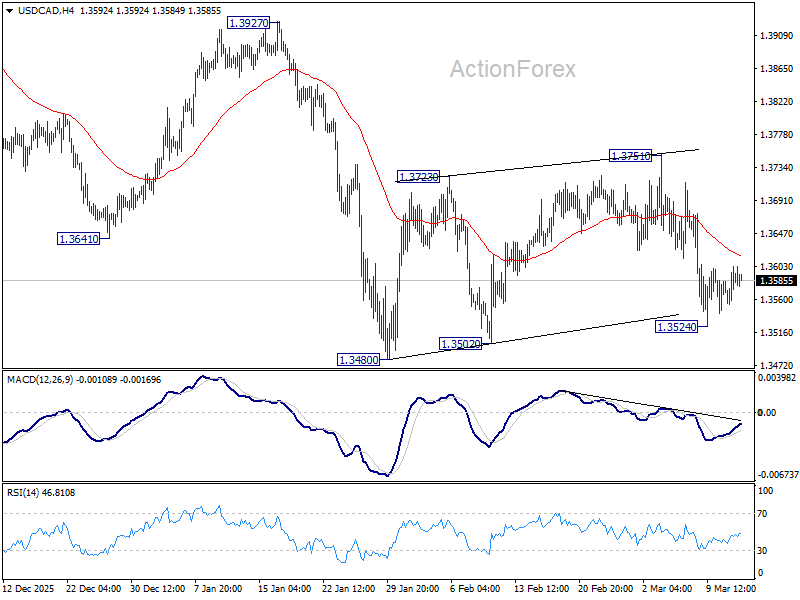
USD/CAD Daily Outlook
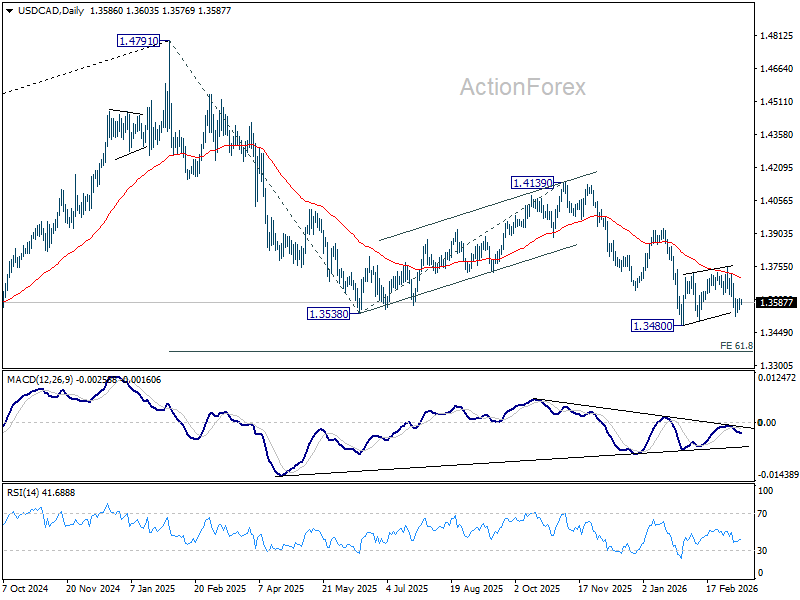
Daily Pivots: (S1) 1.3564; (P) 1.3584; (R1) 1.3614; More...
Intraday bias in USD/CAD remains neutral at this point. Outlook is unchanged that consolidation pattern from 1.3480 could have completed at 1.3751, after hitting 55 D EMA (now at 1.3700). Risk will stay on the downside as long as 1.3751 resistance holds. On the downside, below 1.3524 will bring retest of 1.3480 low. Firm break there will confirm resumption of whole fall from 1.4791, and target 61.8% projection of 1.4791 to 1.3538 from 1.4139 at 1.3365.
In the bigger picture, price actions from 1.4791 are seen as a corrective pattern to the whole up trend from 1.2005 (2021 low). Deeper fall could be seen, as the pattern extends, to 61.8% retracement of 1.2005 to 1.4791 at 1.3069. For now, medium term outlook will be neutral at best, until there are signs that the correction has completed, or that a bearish trend reversal is confirmed.