
Sample Category Title
Dollar Mildly Higher After CPI as Markets Await Massive Strategic Oil Release
Dollar edged modestly higher in early US session, but the move lacked conviction as investors digested February CPI data that broadly matched expectations. Although the annual core rate remains somewhat elevated around 2.5%, the key takeaway is that inflation is not reaccelerating. That provides the Fed with breathing room to observe how the Iran war and the resulting oil shock feed into broader price dynamics.
For policymakers, the immediate concern is not the current inflation level but the possibility of “second-round effects.” A sustained surge in energy costs could eventually push up transportation prices, services inflation, and wage demands. February’s data, however, does not yet show those pressures emerging before the war.
As a result, there is little urgency for the Fed to respond aggressively. A rate hold at the March meeting is already fully priced by markets, and today’s CPI report reinforces the central bank’s ability to remain in a wait-and-see mode while assessing how the geopolitical shock evolves.
The debate instead centers on when the Fed might resume its easing cycle. Markets now see June and September as the key windows for rate cuts this year, though the probability of a mid-year move remains uncertain given the volatile global backdrop.
Energy markets remain the dominant macro driver. Officials from the International Energy Agency and the G7 are now finalizing plans for what could become the largest coordinated emergency oil reserve release in history. The proposal reportedly involves releasing between 300 and 400 million barrels.
Such an intervention would dwarf the 182-million-barrel release implemented following Russia’s invasion of Ukraine in 2022. The scale of the plan highlights the severity of supply concerns after the Iran war effectively disrupted shipping through the Strait of Hormuz.
In currency markets, Yen and Swiss Franc are the weakest performers so far this week, along with Euro, as investors rotate out of defensive positions. Commodity and risk-sensitive currencies have benefited from the shift. Aussie leads the performance table as markets increasingly bet the RBA may bring forward another rate hike this month. Kiwi follows closely, while Sterling also gains support from improving risk sentiment. Dollar and Loonie remain in the middle of the pack.
In Europe, at the time of writing, FTSE is down -0.86%. DAX is down -1.57%. CAC is down -0.97%. UK 10-year yield is up 0.121 at 4.619. Germany 10-year yield is up 0.081 at 2.921. Earlier in Asia, Nikkei rose 1.43%. Hong Kong HSI fell -0.24%. China Shanghai SSE rose 0.25%. Singapore Strait Times rose 0.07%. Japan 10-year JGB yield fell -0.02 to 2.166.
US CPI steady at 2.4% in February, core unchanged at 2.5
US inflation rose slightly faster than expected in February, though the broader price trend remained stable. Headline CPI increased 0.3% mom, above the expected 0.2% rise, while core CPI—which excludes food and energy—rose 0.2% on the month, matching market expectations.
Housing costs continued to play the largest role in the monthly increase. The shelter index rose 0.2% mom and was the biggest contributor to the overall CPI gain. Food prices also moved higher, climbing 0.4% on the month, while the energy index increased 0.6%.
On an annual basis, inflation remained unchanged. Headline CPI held steady at 2.4% year-on-year while core CPI remained at 2.0%, both in line with expectations. Over the past year, the energy index rose 0.5% while food prices increased 3.1%.
Japan import costs surge on weak Yen, fastest since July 2024
Japan’s producer inflation moderated in February, offering some relief on the domestic cost front even as import prices surged. Producer Price Index rose 2.0% yoy, slowing from January’s 2.3% pace and coming in slightly below market expectations of 2.1%.
The softer PPI reading suggests upstream price pressures in Japan’s domestic production sector may be easing slightly. However, the picture is less benign when looking at import costs, which are heavily influenced by Yen’s weakness.
Japan’s yen-based import price index jumped 2.8% yoy, accelerating sharply from a revised 0.7% increase in January and marking the fastest rise since July 2024. The data highlights how the weak Yen continues to push up import costs, a dynamic that could keep underlying inflation pressures elevated despite the moderation in producer prices.
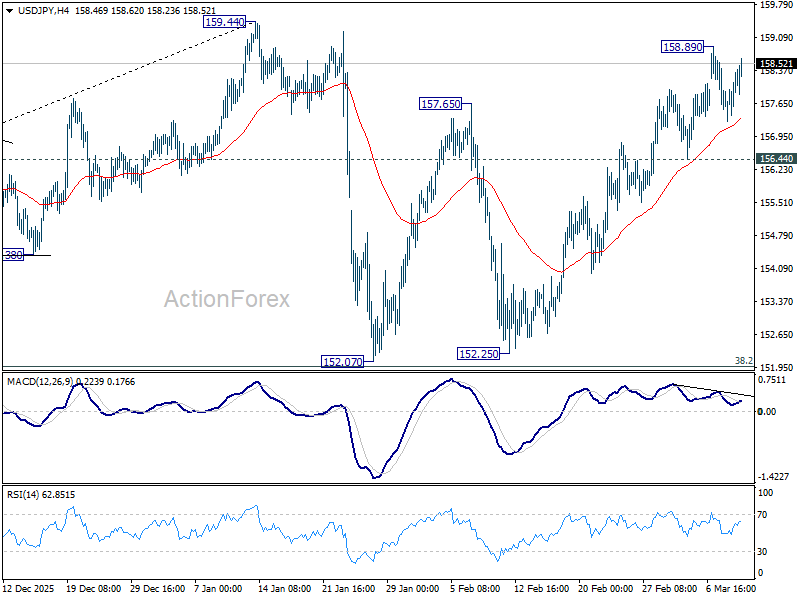
USD/JPY Mid-Day Outlook
Daily Pivots: (S1) 157.44; (P) 157.84; (R1) 158.44; More...
USD/JPY strengthens mildly in early US session but stays below 158.98 temporary top. Intraday bias remains neutral for the moment. On the upside, above 158.89 will extend the rise from 152.07 to 159.44 resistance. Decisive break there will target 161.94 high next. However, considering bearish divergence condition in 4H MACD, firm break of 156.44 support will argue that the rebound has completed, and turn bias back to the downside for 152.07 support. Overall, price actions from 159.44 are viewed as a near term consolidation pattern. Outlook will remain bullish as long as 38.2% retracement of 139.87 to 159.44 at 151.96 holds.
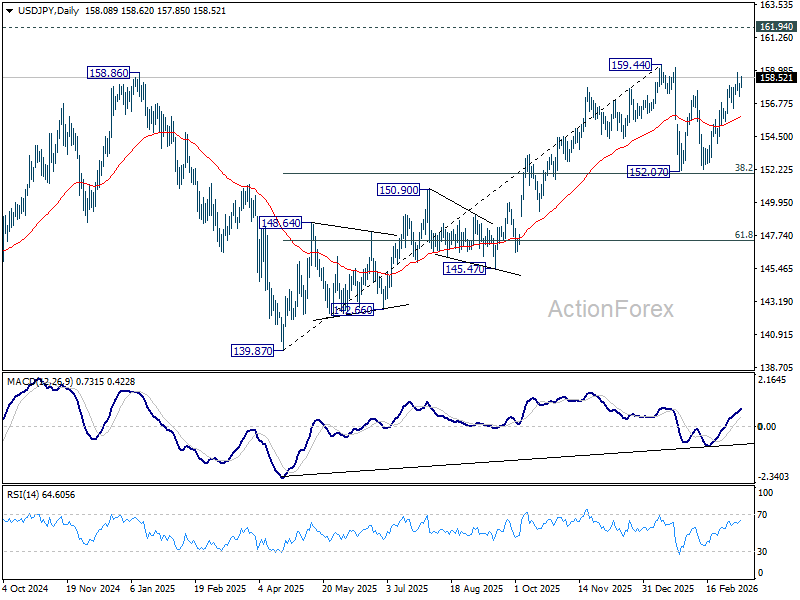
In the bigger picture, outlook is unchanged that corrective pattern from 161.94 (2024 high) should have completed with three waves at 139.87. Larger up trend from 102.58 (2021 low) could be ready to resume through 161.94. This will remain the favored case as long as 55 W EMA (now at 152.16) holds. However, sustained break of 55 W EMA will argue that the pattern from 161.94 is extending with another falling leg.
US CPI steady at 2.4% in February, core unchanged at 2.5
US inflation rose slightly faster than expected in February, though the broader price trend remained stable. Headline CPI increased 0.3% mom, above the expected 0.2% rise, while core CPI—which excludes food and energy—rose 0.2% on the month, matching market expectations.
Housing costs continued to play the largest role in the monthly increase. The shelter index rose 0.2% mom and was the biggest contributor to the overall CPI gain. Food prices also moved higher, climbing 0.4% on the month, while the energy index increased 0.6%.
On an annual basis, inflation remained unchanged. Headline CPI held steady at 2.4% year-on-year while core CPI remained at 2.0%, both in line with expectations. Over the past year, the energy index rose 0.5% while food prices increased 3.1%.
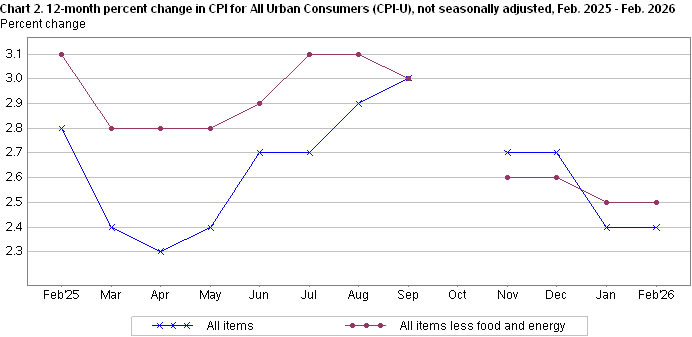
Chart Alert: EUR/USD Bullish Reversal, Watch 1.1673 Upside Trigger Level as US CPI Looms
Key takeaways
Recovery after sharp decline: The EUR/USD rebounded from a four-month low of 1.1507 after earlier falling 4.8% from its 2026 high, as the euro stabilized following a sharp pullback in oil prices triggered by the International Energy Agency proposal for a large, coordinated oil stockpile release.
Macro drivers turning supportive: Expectations of a more hawkish stance from the European Central Bank and widening Eurozone–US Treasury yield spreads are improving the euro’s outlook, with upcoming US CPI data seen as a key catalyst for further moves.
Technical bullish reversal setup: The pair is forming a minor inverse head-and-shoulders pattern, with 1.1673 as the upside trigger. A break above it could push prices toward 1.1740–1.1774, while a drop below 1.1565 would invalidate the bullish scenario.
The EUR/USD has declined by 4.8% from its current year-to-date high of 1.2083 on 27 January 2026 to hit a four-month low of 1.1507 on Monday, 9 March 2026, on the onset of escalating Middle East tensions due to the US-Iran war that drives a safe-haven demand for the US dollar.
After the dramatic reversal of oil prices on Monday, where the West Texas crude oil tumbled by 35% from $119.54/barrel, a 4-year high, to trade below $90 as it printed an intraday low of $76.83/barrel on Tuesday, 10 March 2026, as the International Energy Agency proposed a significant historical coordinated stockpile release of more than 182 million barrels of oil.
The energy-vulnerable euro has managed to find a footing as the EUR/USD attempted to recover to trade higher now at 1.1603 at the time of writing from Monday’s low of 1.1507.
Meanwhile, the ongoing US-Iran war does not seem to be showing signs of abating as it entered its 12th day.
On the monetary policy front, expectations have also shifted in a more hawkish direction for the European Central Bank (ECB). The Eurozone’s short-term interest rate swaps market has now implied a 40% chance of a 25-basis-point interest rate hike by the ECB by June this year, where the ECB has held its policy deposit rate steady since June 2025.
Widening Eurozone sovereign bond/US Treasury yield spreads support a recovery in EUR/USD
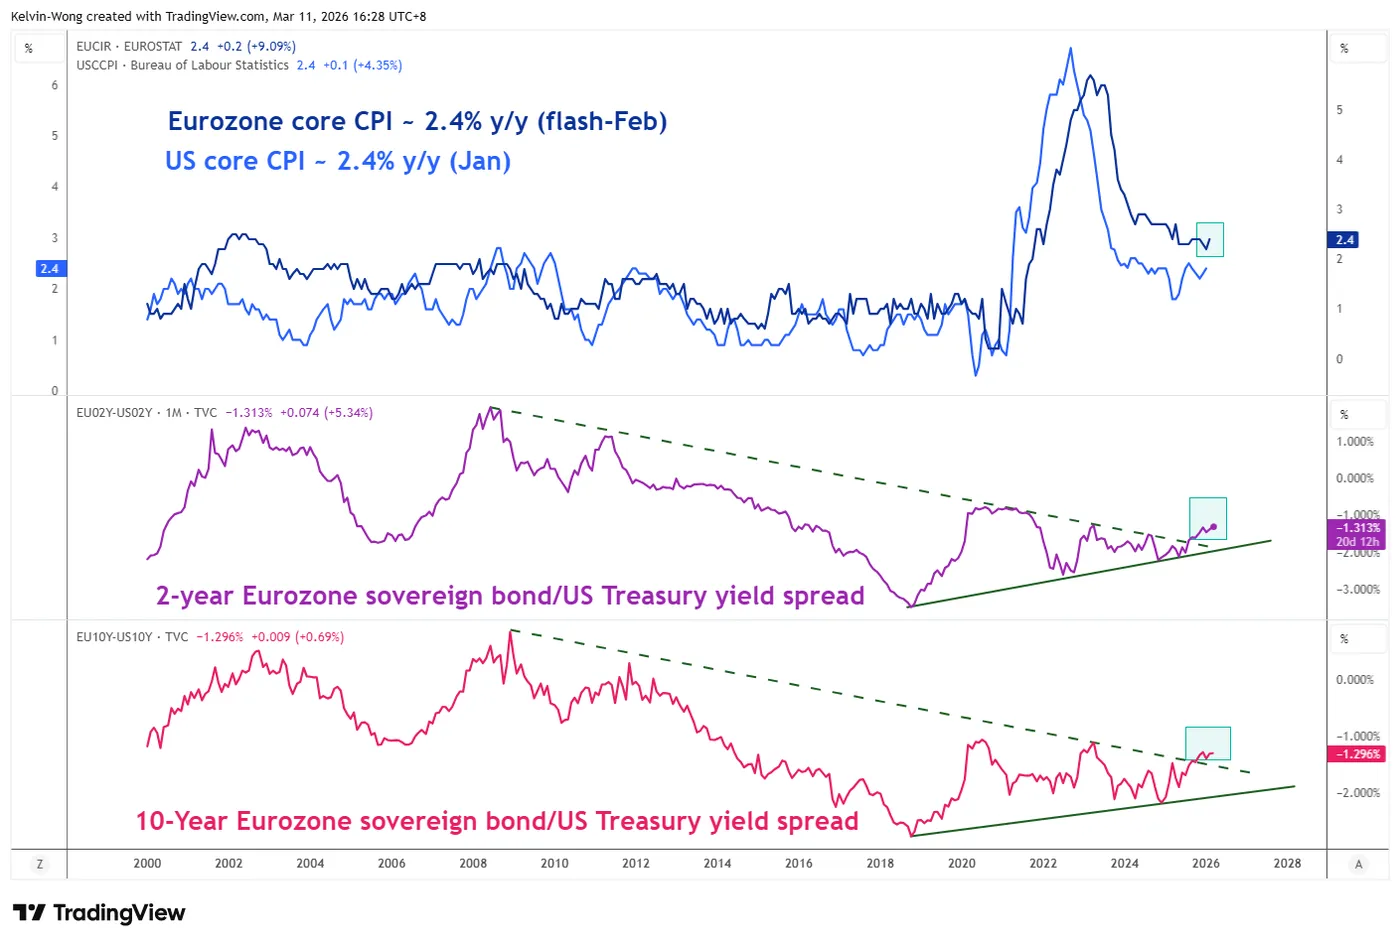
Fig. 1: 2-year & 10-year Eurozone sovereign bond/US Treasury yield spreads as of 11 Mar 2026 (Source: TradingView)
Interestingly, the 2-year and 10-year Eurozone sovereign bond/US Treasury yield spreads have staged major bullish breakouts to trade at -1.25% and -1.27% respectively at this time of writing, in line with the recent uptick in the Eurozone’s preliminary core inflation rate for February that inched higher to 2.4% year-on-year from January’s print of 2.2% (see Fig. 1).
A further widening of the 2-year and 10-year Eurozone sovereign bond/US Treasury yield spreads may allow the EUR/USD to stage a further recovery, and the key risk event that is likely to trigger such a movement will be today’s release of US CPI data for February.
Let’s now decipher the short-term trajectory (1 to 3 days) of the EUR/USD from a technical analysis perspective.
EUR/USD – Tracing out a minor bullish “Inverse Head & Shoulders” configuration
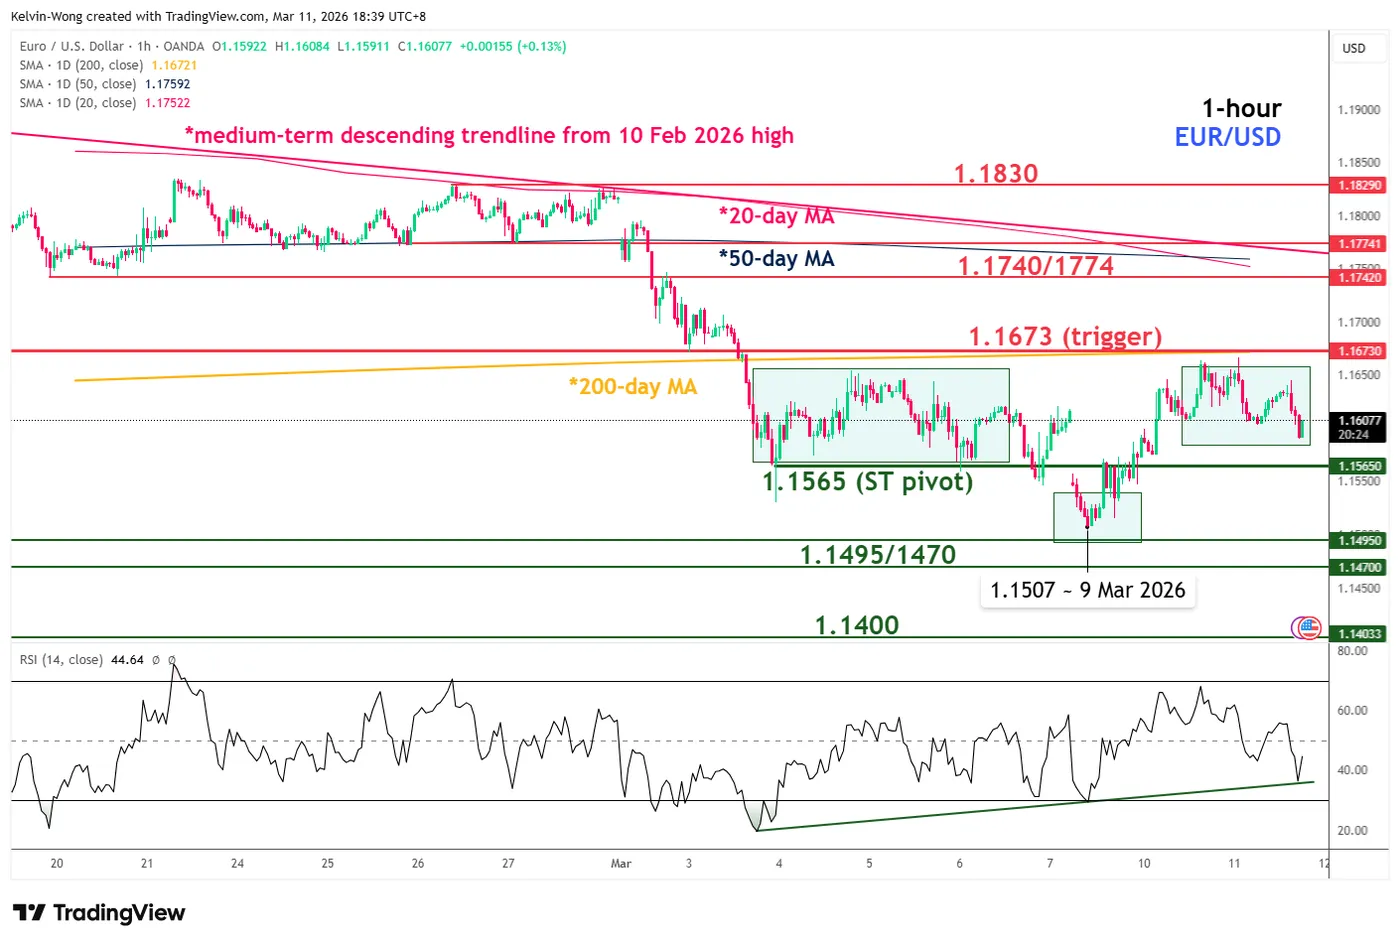
Fig. 2: EUR/USD minor trend as of 11 Mar 2026 (Source: TradingView)
Watch the 1.1565 key short-term pivotal support on the EUR/USD, and a clearance above the 1.1673 neckline resistance (upside trigger level) of the minor “Inverse Head & Shoulders” may see a potential push up towards the next intermediate resistance at 1.1740/1774 (also the 20-day and 50-day moving averages). Above 1.1774 may see further strength towards 1.1830 (see Fig. 2).
On the flip side, a break and an hourly close below 1.1565 negates the bullish tone for a retest on the next intermediate support at 1.1495/1470.
Key elements to support the bullish bias on EUR/USD
- Since the start of March 2026, the EUR/USD’s earlier corrective decline has started to stabilize at the 1.1495/1470 support zone via the formation of a minor bullish reversal “Inverse Head & Shoulders” configuration.
- The hourly RSI momentum indicator has just retested and staged a rebound from its ascending support at the 36 level.
EUR/USD Reclaims Ground While USD/JPY Momentum Fades
EUR/USD is recovering losses from 1.1500. USD/JPY is correcting gains from 159.00 and might decline further if it stays below 158.30.
Important Takeaways for EUR/USD and USD/JPY Analysis Today
- The Euro struggled to stay in a positive zone and declined below 1.1700 before finding support.
- There was a break above a connecting bearish trend line with resistance at 1.1580 on the hourly chart of EUR/USD at FXOpen.
- USD/JPY started a decent increase above 157.00 before the bears appeared near 158.90.
- There is a key contracting triangle forming with resistance near 158.30 on the hourly chart at FXOpen.
EUR/USD Technical Analysis
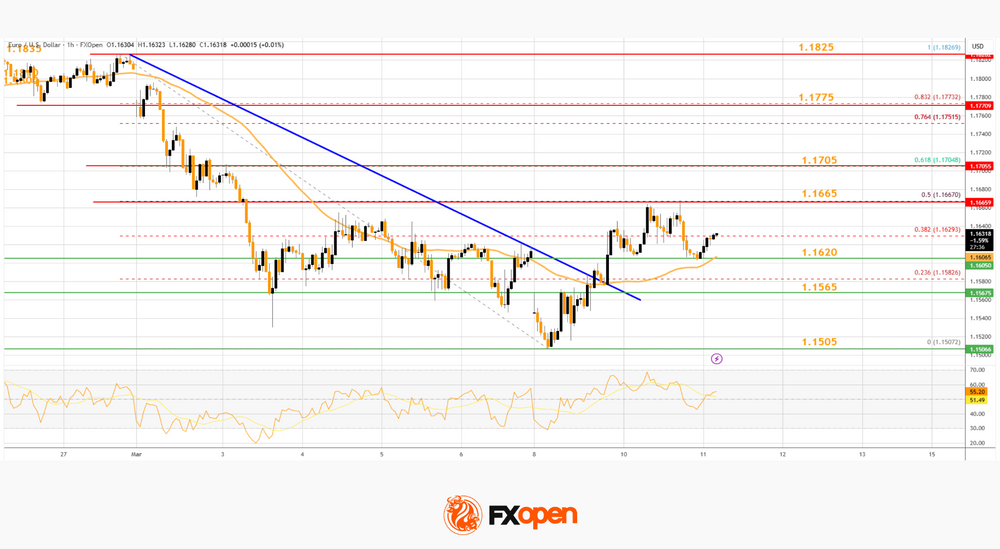
On the hourly chart of EUR/USD at FXOpen, the pair started a fresh decline from 1.1825. The pair broke below 1.1665 and the 50-hour simple moving average. Finally, it tested the 1.1500 zone. A low was formed at 1.1507, and the pair is now recovering losses.
There was a move above 1.1550 and a connecting bearish trend line at 1.1580. The pair surpassed the 38.2% Fib retracement level of the downward move from the 1.1826 swing high to the 1.1507 low. On the upside, the pair is now facing resistance near the 50% Fib retracement at 1.1665.
The first major hurdle for the bulls could be 1.1705. A break above 1.1705 could set the pace for another increase. In the stated case, the pair might rise toward 1.1775.
If not, the pair might drop again. Immediate support is near the 50-hour simple moving average and 1.1620. The next key area of interest might be 1.1565. If there is a downside break below 1.1565, the pair could drop towards 1.1505. The main target for the bears on the EUR/USD chart could be 1.1440, below which the pair could start a major decline.
USD/JPY Technical Analysis
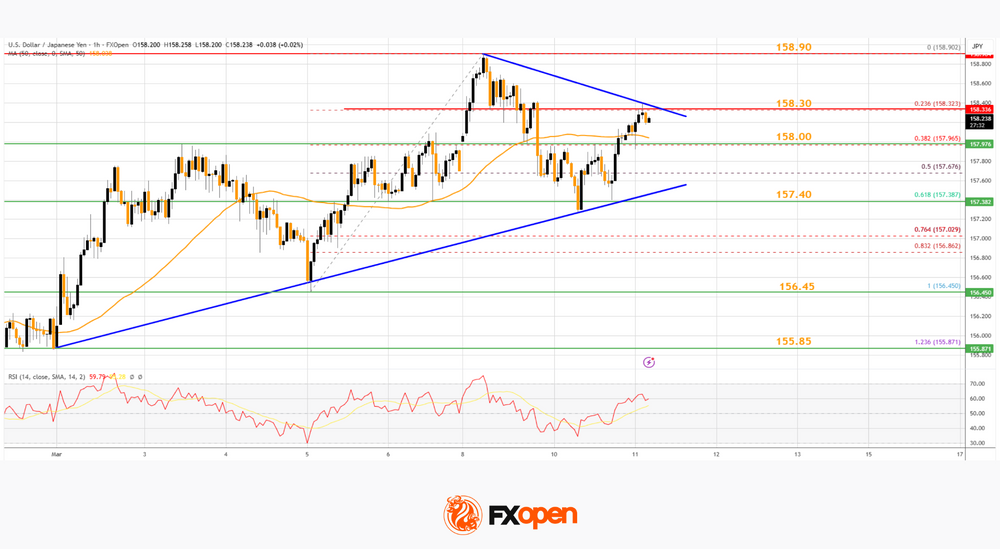
On the hourly chart of USD/JPY at FXOpen, the pair gained pace for a move above 158.00. The US dollar even traded close to 159.00 against the Japanese yen before the bears emerged.
A high was formed at 158.90 before a downside correction. The pair dipped below 158.00 and the 50% Fib retracement level of the upward move from the 156.45 swing low to the 158.90 high. However, the bulls were active above 157.00 and protected the 61.8% Fib retracement.
The pair is back above the 50-hour simple moving average and 158.00. Immediate resistance on the USD/JPY chart is near 158.30. There is also a key contracting triangle at 158.30.
If there is a close above the triangle and the hourly RSI moves above 65, the pair could rise towards 158.90. The next major barrier for the bulls could be 159.25, above which the pair could test 160.00 in the near term.
On the downside, the first major support is near 158.00. The next key region for the bears might be 157.40. If there is a close below 157.40, the pair could decline steadily. In the stated case, the pair might drop towards 156.45. Any more losses might send the pair toward 155.85.
Trade over 50 forex markets 24 hours a day with FXOpen. Take advantage of low commissions, deep liquidity, and spreads from 0.0 pips (additional fees may apply). Open your FXOpen account now or learn more about trading forex with FXOpen.
This article represents the opinion of the Companies operating under the FXOpen brand only. It is not to be construed as an offer, solicitation, or recommendation with respect to products and services provided by the Companies operating under the FXOpen brand, nor is it to be considered financial advice.
S&P 500 Fluctuates Ahead of CPI Report
As the S&P 500 chart (US SPX 500 mini on FXOpen) shows, the index is trading near the 6,800 level this morning. However, the balance between supply and demand could change significantly after the release of the Consumer Price Index (CPI) report scheduled for 15:30 GMT+3.
Against the backdrop of military developments in the Middle East and sharp movements in oil prices (as we previously noted, the WTI market remains volatile), today’s data will be an important factor for traders assessing the future policy path of the Federal Reserve. According to Forex Factory, analysts expect headline inflation to remain at 2.4%.
Technical Analysis of the S&P 500 Chart

The chart shows that the 7,000-point psychological level acted as an important threshold at the beginning of 2026 — the price attempted to move above it but failed. It is worth recalling that we highlighted early bearish signals in the article “S&P 500 Hits a Record – But Is Everything Really So Positive?” as early as 13 January.
Since then, bearish pressure has led to:
- → the formation of the descending trend line R;
- → the trading channel (originating in late 2025) being extended downward twofold in early March.
In the context of recent S&P 500 price action, it is important to note that:
- → the lower boundary of the expanded channel has acted as support;
- → the median line is currently showing signs of resistance.
Also note the increasing importance of the 6,700 area:
- → a bearish gap formed there at the beginning of this week;
- → however, the price later moved sharply above this gap, meaning it could potentially act as support in the future.
In the near term, it is reasonable to expect that the release of the data may trigger a spike in S&P 500 volatility. It is possible that the price will test either the red trend line R or the highlighted support area.
Trade global index CFDs with zero commission and tight spreads (additional fees may apply). Open your FXOpen account now or learn more about trading index CFDs with FXOpen.
This article represents the opinion of the Companies operating under the FXOpen brand only. It is not to be construed as an offer, solicitation, or recommendation with respect to products and services provided by the Companies operating under the FXOpen brand, nor is it to be considered financial advice.
XTI/USD Chart Analysis: Oil Prices Remain Volatile
Against the backdrop of military developments in the Middle East, the situation in the oil market is evolving rapidly. Only two days have passed since 9 March, when we published a morning analytical note in which we:
- → highlighted the rise of XTI/USD above $100 and a sharp spike in volatility (as reflected by the ATR indicator);
- → outlined an ascending channel and pointed to signs of a bearish engulfing pattern, suggesting that sellers were gaining the initiative.
Subsequent price action in the following hours confirmed that selling pressure was strong enough to break below the lower boundary of the channel later that same day. This occurred amid statements from President Trump, and a wide bearish candle formed on the XTI/USD chart.
On 10 March, the former lower boundary of the channel (marked by red arrows) acted as resistance while traders closely monitored developments around the Strait of Hormuz. According to The Wall Street Journal, the International Energy Agency proposed the largest oil reserve release in its history, which added another bearish factor for the market.
Technical Analysis of the XTI/USD Chart

Today the oil market remains highly volatile. Although the ATR indicator is pointing lower, its readings remain far above typical levels.
The sequence of lower highs and lower lows in WTI prices over the past 36 hours outlines the structure of a potential downward trajectory (shown in red). However, the chart also suggests that sustained downside momentum remains uncertain. This is reflected in the aggressive rebound from yesterday’s low.
It is possible that the XTI/USD price may continue to fluctuate within the orange range defined by the bearish candle formed on 9 March until significant news emerges that could shift the current balance in the market. In particular, traders remain focused on the risks of further escalation of the conflict in the Middle East.
Start trading commodity CFDs with tight spreads (additional fees may apply). Open your trading account now or learn more about trading commodity CFDs with FXOpen.
This article represents the opinion of the Companies operating under the FXOpen brand only. It is not to be construed as an offer, solicitation, or recommendation with respect to products and services provided by the Companies operating under the FXOpen brand, nor is it to be considered financial advice.
GBP/USD Managed to Rise, but Pressure Factors Remain in Place
GBP/USD rose to 1.3450 on Wednesday. Expectations of de-escalation in the Middle East supported the pound, as lower oil prices reduced inflationary risks for the British economy, which is heavily dependent on energy imports.
Despite this localised strengthening, investors continue to monitor the development of the conflict between the United States, Israel and Iran closely. Its consequences could significantly affect the global economy. The situation remains uncertain: US President Donald Trump has suggested the war could end soon, but Iran's Islamic Revolutionary Guard Corps stated that oil shipments through the Strait of Hormuz will not resume while attacks by the United States and Israel continue.
Amid these external risks, investors are also revising expectations for UK monetary policy. On average, a Bank of England interest rate cut in the second quarter is now considered possible.
Domestic factors continue to weigh on the pound. Weak economic statistics and political uncertainty in the UK maintain downside risks for the currency. An additional source of tension may be the local elections, scheduled to take place in two months.
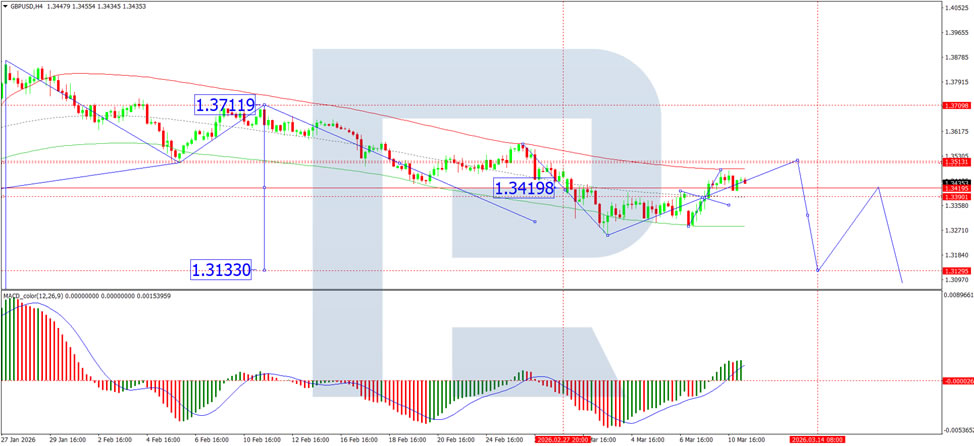
Technical Analysis
On the H4 GBP/USD chart, the market is forming a wide consolidation range around the 1.3382 level, currently extending up to 1.3474. A decline to 1.3384 is expected in the near term. Following the completion of this correction, the formation of a new consolidation range is likely. An upside breakout would open potential for a continuation wave to 1.3515, while a downside breakout would suggest further movement towards 1.3133. Technically, this scenario is confirmed by the MACD indicator, whose signal line is above the zero level and pointing strictly upwards.
On the H1 chart, the market has formed a compact consolidation range around the 1.3434 level. A downside breakout would initiate a wave structure extending to 1.3382. Should this level be breached, further downside potential towards 1.3125 would open. Conversely, an upside breakout from the range could trigger a growth wave to the 1.3515 level. Technically, this scenario is supported by the Stochastic oscillator, with its signal line above the 50 level and pointing strictly upwards.

Conclusion
GBP/USD has found temporary relief amid hopes for Middle East de-escalation, which has helped moderate oil prices and ease inflationary concerns for the UK. However, the underlying picture remains uncertain, with geopolitical risks, domestic economic weakness, and political tensions continuing to cloud the outlook. While technical indicators suggest potential for further upside in the near term, the broader trend will likely depend on whether geopolitical conditions stabilise and whether the Bank of England signals a clearer policy direction.
Today’s Eco Calendar Contains February US CPI
Markets
The oil price (Brent) hovered around the $90/mark yesterday following Monday’s wild swings. Talk that the US navy escorted an oil tanker through the Strait of Hormuz was later denied by the White House. Overnight, the WSJ reports that the International Energy Agency has proposed the largest release of oi reserves in its history. The release would exceed the 182mn barrels put out in two releases in 2022 after the start of Russia’s invasion of Ukraine. Countries are expected to decide on the proposal today. It would be adopted if none objects, but even one country’s protests could delay the plan, officials said. IEA members hold 1.2bn barrels in public stocks, plus another 600mn in mandatory commercial inventories according to IEA Executive Director Birol. It’s one of the developing stories to look out for today as fighting in the Middle-East continues. A potential release could help lower short-term market volatility.
After European close, ECB President Lagarde spoke on France 2. She stressed that the EMU (economy) is in a better situation than during the 2022 energy price shock with a greater capacity to absorb shocks. The ECB president struck a vigilant tone, saying that they will do all that is necessary to ensure inflation is under control and avoid a repeat of the inflation increases like those in 2022-2023. The high amount of uncertainty makes her incapable to say precisely what the ECB will decide next week, but the central bank won’t rush into a decision. While EMU money markets on Monday at one point discounted two rate hikes this year (currently just one), they never wagered bets that it could happen very soon. The ECB publishes new quarterly growth and inflation forecasts next week and those will likely be accompanied with additional scenarios due to volatile energy prices.
Today’s eco calendar contains February US CPI. Our in-house KBC nowcast model expects both headline and core inflation at 2.5% Y/Y. Consensus stands at 2.4% and 2.5% respectively. With regard to coming months, we conducted some simulations based on oil price developments. Our pre-Iran base scenario suggested annual inflation prints of 2.8% and 2.9% in March & April. Taking into account current gasoline prices ($3.5/gallon) lifts those readings to 3.1% and 3.4%! An in-between scenario of $3/gallon implies 2.8% and 3% levels according to the nowcast. If anything, it shows how rapidly inflation numbers might be impacted by the ongoing conflict, warranting vigilance by the Fed as well. The US Treasury continues its mid-month refinancing operation with a $39bn 10-yr Note auction. Yesterday’s 3-yr Note auction disappointed with the auction tailing 1.1 bp compared to the WI yield. Bidding metrics also showed a below-average bid cover of 2.55 with lower than expected accepted indirect and direct bids. The long end of the US yield curve might be vulnerable in case of weakness tonight and in tomorrow’s 30-yr Bond sale given the US’s limited fiscal leeway (to fund a lasting war).
News & Views
The Financial Times this morning reported that US bank JPMorgan Chase informed private credit lenders that it has marked down the value of certain loans in their portfolios. Since these loans serve as collateral that the funds use to borrow from the bank, the move means JPMorgan is limiting the amount it is lending to private credit groups going forward. The loans that have been devalued are to software companies. Just last week, the bank’s chief executive said they were being more prudent vis-à-vis software assets, which are seen particularly vulnerable to AI disruption.
The UK’s Office for Budget Responsibility warned its inflation forecasts in the spring update of earlier this month could quickly become outdated if the energy price spike does not abate. David Miles, a member of the OBR committee before UK parliament noted that “we (the UK) are significant importers of both oil and gas, and there’s nothing but negative effects from those prices being higher.” The OBR had penciled in a return from 3% to 2% by end this year. A “very substantial” increase in oil prices, however, would keep the inflation rate on 3%. The potential broader price effect of the energy spike already resulted in a dramatic repricing from money markets. At some point, they fully priced out two further rate cuts and started prepping for a hike. Tensions eased (including in oil markets) somewhat in the last few days, with UK investors now discounting a 50% probability for a rate cut by mid-2026.
Chart Alert: AUD/USD Bullish Breakout (Finally) Above 0.7140, New Bullish Impulsive Up Move Sequence
Key takeaways
- Bullish technical breakout: The AUD/USD has finally broken above the 0.7140 major resistance—a level tested multiple times since 2022—reaching a 52-week high near 0.7185, signalling the start of a fresh bullish impulsive uptrend.
- Macro catalysts supporting AUD: Strength in commodity prices driven by the US–Iran war 2026 and expectations that the Reserve Bank of Australia may raise rates to 4.10% have boosted demand for the Australian dollar.
- Key levels to watch: Near-term bullish momentum remains intact above 0.7080 support, with upside targets at 0.7246–0.7266 and 0.7335–0.7350. A break below 0.7080 would weaken the bullish outlook and risk a pullback toward 0.7050–0.7030.
The price actions of the AUD/USD have finally staged a bullish breakout above its “stubborn” major resistance at 0.7140 (11 August 2022/2 August 2023 swing highs) after it tested twice in February 2026.
The AUD/USD has extended its gains by 0.8% in today’s Asia session (Wednesday, 11 March 2026) to record a new year-to-date and 52-week intra-session high at 0.7185.
The firmer AUD/USD has been supported by the ongoing bullish trend in commodity prices due to global oil supply disruption arising from the ongoing US-Iran war.
Secondly, the short-term interest rate market in Australia is expecting the Reserve Bank of Australia (RBA) to maintain its tightening monetary policy stance with an increased probability of its second interest rate hike of 25 basis points (bps) to come as soon on the next meeting on 17 March 2026 to raise the cash policy rate to 4.10% to negate inflationary expectations from jumping higher due to firmer oil prices.
AU/US implied future policy interest rate curves spread supports a hawkish RBA
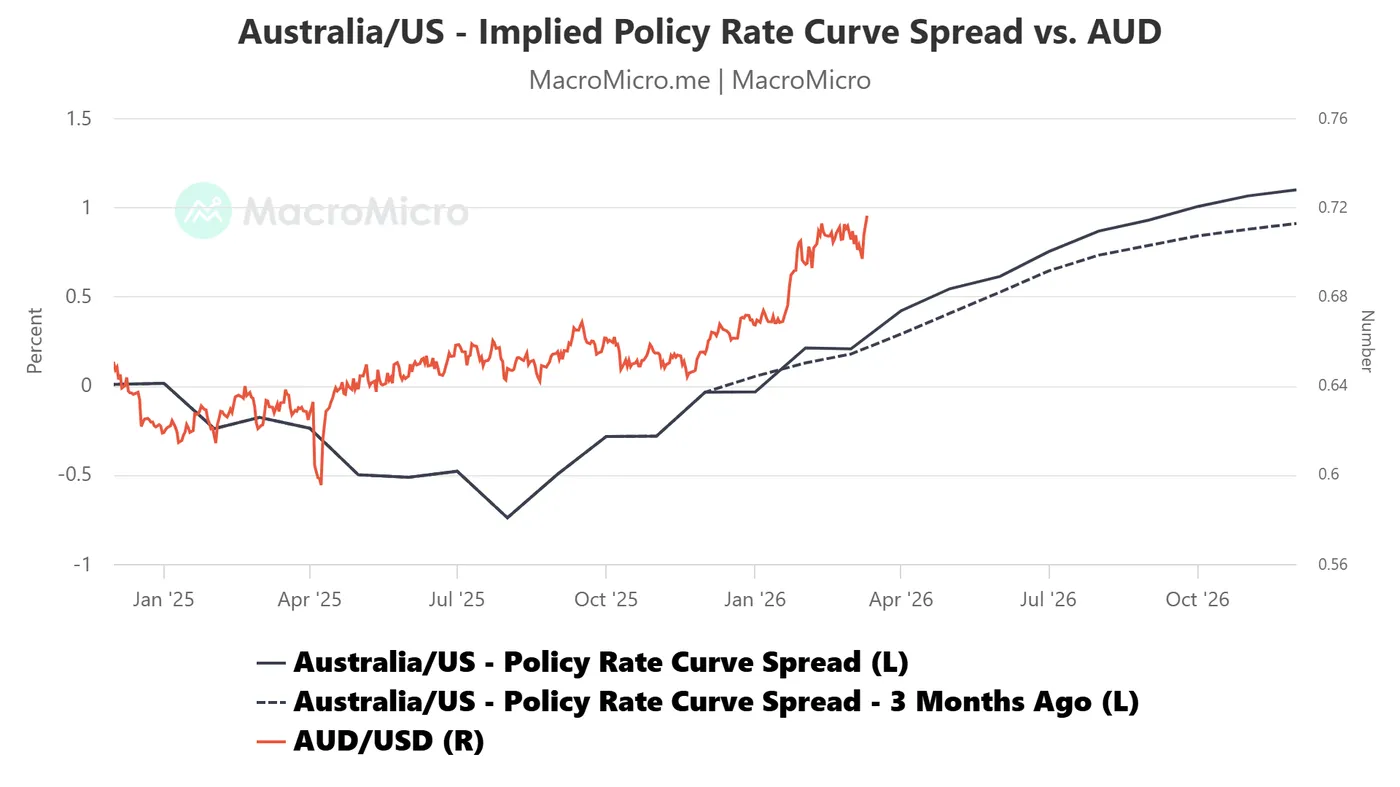
Fig. 1: AU/US monthly implied future policy interest rate curves spread as of 11 Mar 2026 (Source: MacroMicro)
The spread/differential between the monthly implied future policy interest rate curves for Australia and the US (derived from short-term interest rate futures) has risen steadily and shifted upwards (see Fig. 1).
The spread for April 2026 now stands at 0.42%, an increase of 13 bps from 0.29% recorded three months ago, and the spread for May 2026 increases to 0.54%, a similar increase of 13 bps from 0.41% three months ago.
Let us now focus on the short-term (1 to 3 days) trajectory of the AUD/USD from a technical analysis perspective.
AUD/USD – Bullish momentum supports a fresh impulsive up move sequence
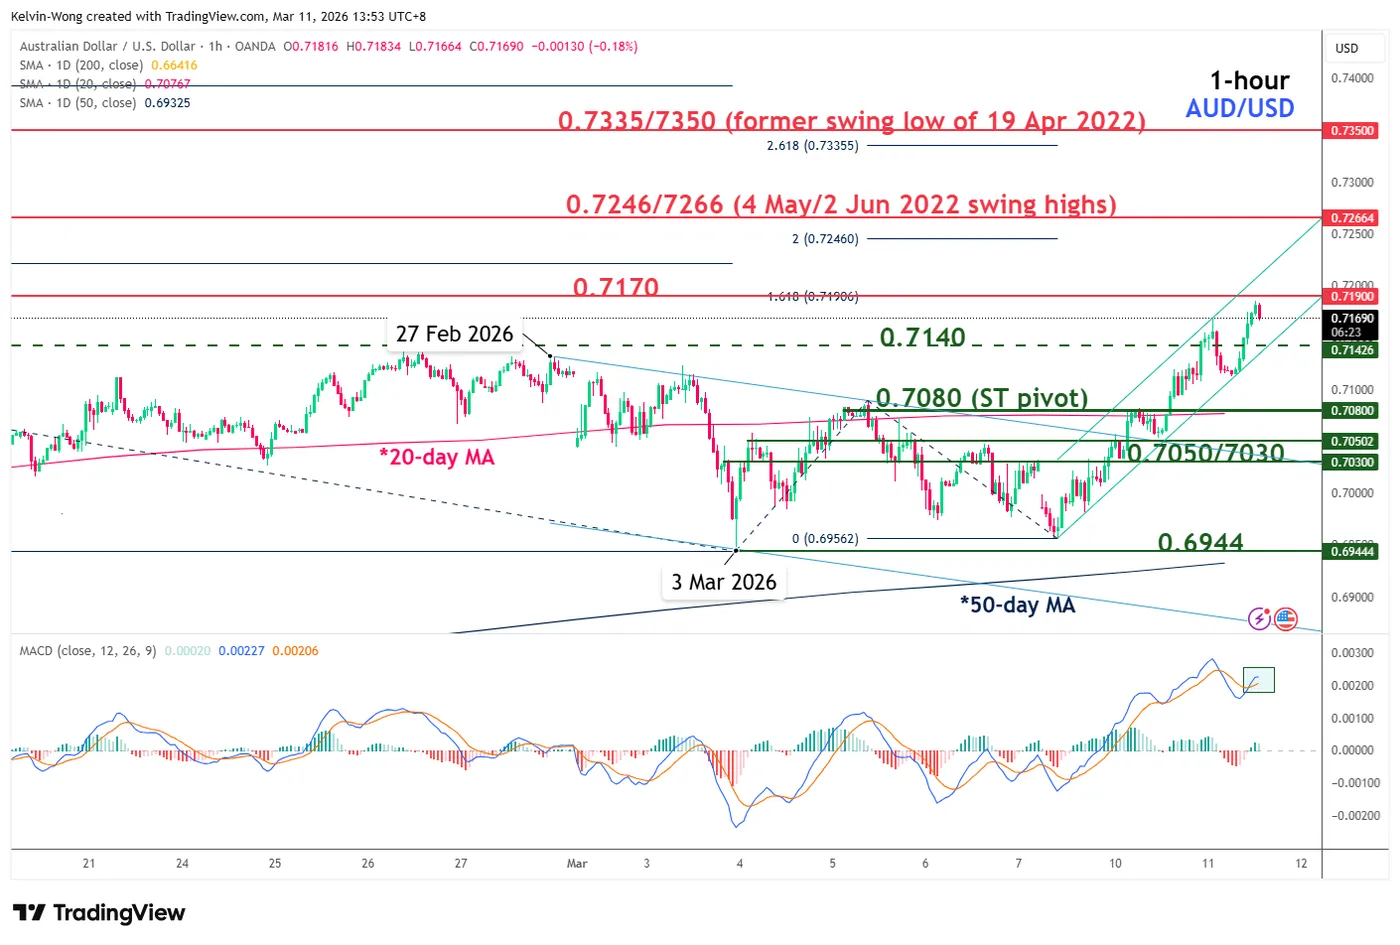
Fig. 2: AUD/USD minor trend as of 11 Mar 2026 (Source: TradingView)

Fig. 3: AUD/USD medium-term & major trends as of 11 Mar 2026 (Source: TradingView)
Today’s bullish breakout above the 0.7140 major resistance suggests that the AUD/USD has exited from a 4-week choppy range configuration in place since 12 February 2026, in turn, igniting a potential fresh bullish impulsive up move sequence within its medium-term and major uptrend phases.
In the near-term, watch the 0.7080 key short-term pivotal support (also the 20-day moving average) to maintain the minor bullish impulsive up move sequence view for the next intermediate resistances to come in at 0.7246/7266 and 0.7335/7350 (See Fig. 2).
However, a break and an hourly close below 0.7080 negates the bullish tone for a slide back to retest 0.7050/7030 (the pull-back support of the former minor descending channel resistance from 27 February 2026 high). Below 0.7030 exposes further near-term weakness towards 0.6944 (also the 50-day moving average).
Key elements to support the bullish bias on AUD/USD
- The hourly MACD trend indicator has just flashed out a bullish crossover condition above its centreline, which suggests that short-term bullish momentum remains intact within its minor uptrend phase (see Fig. 2).
- The daily 2-year Australian sovereign bond/US Treasury yield spread has continued to widen to 0.85% from 0.75% a week ago, in turn, supporting the ongoing medium-term uptrend phase of the AUD/USD (see Fig. 3).
Markets on Hold as Oil Retreats, Eyes on US CPI
Oil prices reversed their Asian session gains again yesterday, pulling US crude all the way down to the $76pb mark as the International Energy Agency (IEA) announced that it could release a record amount of strategic reserves. The exact amount has not been disclosed yet, but it will reportedly be more than the 182 million barrels released after Russia’s invasion of Ukraine in 2022. There is talk that it could be around 300–400 million barrels.
But that amount remains meagre compared with the roughly 45 million barrels that IEA/OECD countries consume every day. It would therefore be a temporary fix. The announcement is helping keep oil prices in check this morning, but the Middle East is now pumping less oil – around 6% less – in reaction to the Iran war. The duration of the conflict will determine whether the spike in oil prices is over, or whether there is more to come.
Oil prices have therefore become the most important ingredient of market sentiment. If the war ends and the worst – in terms of an energy price spike – is behind us, investors could return to a more constructive mode. But uncertainties loom, and there is a chance that the Iran war will not be done and dusted quickly.
For now, thanks to cooling upside pressure in oil prices, investors are scaling back the early-week jump in inflation expectations, which is helping support equities and bonds. Market volatility is easing and the US dollar is giving back ground against most major currencies. But restoring confidence will take time and require supportive data. And by supportive data, I primarily mean reasonable inflation numbers in the weeks ahead.
Today, the US will release its latest CPI report. But the report will be backward-looking to February—that is before Middle East tensions escalated, pushing energy prices higher. Middle East trade disruptions also threaten food prices via rising fertilizer costs, as fertilizers require natural gas for production and a large share of global supply comes from the Gulf region. And that is without even talking about the potential impact of US tariffs.
So today’s US CPI report will likely be taken with a pinch of salt. Investors will keep in mind that the recent jump in energy prices could add a few basis points to inflation in the coming months, as energy prices often account for a large share of short-term swings in inflation.
Still, the lower today’s CPI reading, the better. US headline inflation may have steadied near 2.4% year-on-year, according to a Bloomberg consensus, while core inflation is seen near 2.5%.
Then on Friday, the US will release the core PCE index for February—the Federal Reserve’s preferred gauge of inflation—which is expected to show around 2.7% year-on-year price growth.
These numbers—combined with the fact that the recent jump in energy prices could push inflation higher in the coming months—suggest that the Federal Reserve (Fed) may not be in a position to cut rates any time soon. Activity in Fed funds futures still prices in a July rate cut with around 55% probability, but there may be room for a hawkish readjustment.
A further hawkish shift in Fed expectations would continue to pressure bond markets pushing US yields higher, which would likely translate into weaker appetite for risk assets. Yesterday’s US Treasury auction, for example, saw soft demand.
Among risk assets, small- and mid-cap stocks are more vulnerable to an energy shock and a potential hawkish readjustment in Fed policy, while US large-cap indices continue to grapple with AI-related uncertainties.
For Big Tech companies, the fear is that revenue growth may struggle to keep pace with massive infrastructure investment, raising concerns that some companies could eventually face balance-sheet pressure.
But there was good news on the wire. Oracle, often seen as a barometer of AI-related investment risks, released earnings after the bell yesterday and both the results and the guidance were stronger than expected. Revenue grew 84% in the period ending Feb. 28 versus 79% expected by analysts, AI investments appear to be paying off, and bookings came in higher than projected. The company also said that customers will fund upfront semiconductor purchases, meaning it will not need to borrow more to meet demand for computing services. Investors reacted positively: the shares jumped around 8% in after-hours trading, helping lift the Nasdaq Composite slightly.
Meanwhile, Amazon reportedly saw strong demand for its US bond sale, one of the largest corporate offerings on record—offering a contrast with rising anxiety about Big Tech’s leveraged AI investments.
Whether Oracle’s results will help lift sentiment across Big Tech remains to be seen. It will also depend on the broader macro environment, where higher interest rates could prematurely reverse the rotation trade back toward Big Tech, though likely with less conviction and more questions than what we saw between 2022 and 2025.