Sample Category Title
Brent Chooses Its Path
- Investors are assessing whether the 2022 or 2025 oil scenario will play out.
- Releasing reserves will not necessarily lower oil prices.
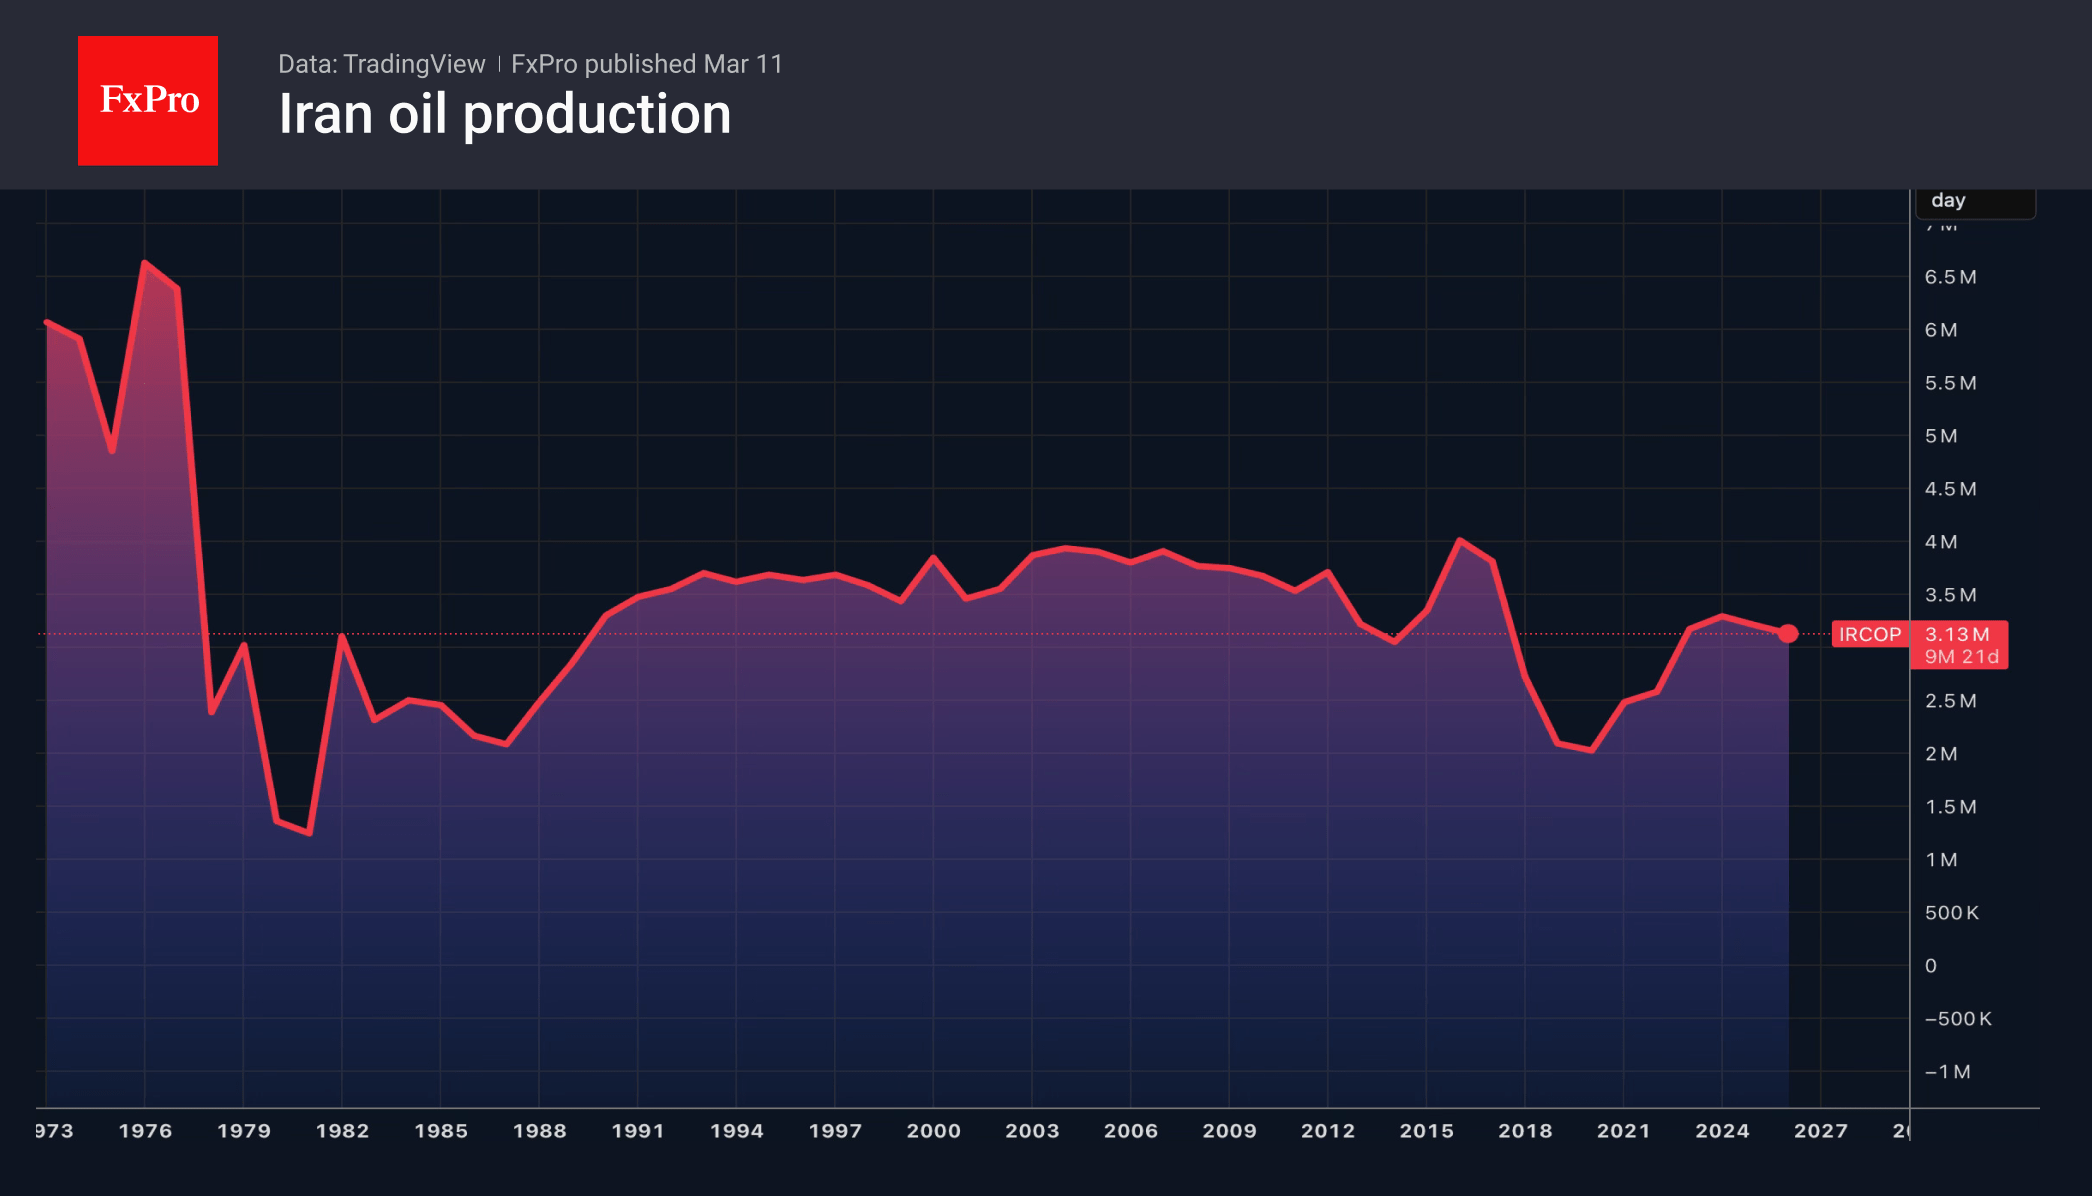
The oil market is focused on two main issues: how quickly the conflict in the Middle East will end, and how it will conclude. Donald Trump insists on regime change and further cooperation between Tehran and Washington. The so-called Venezuelan scenario could enable Iran to boost oil production from the current 3.5 million bpd. Before the 1979 revolution, production exceeded 6 million bpd. An increase in supplies will likely cause prices to fall sharply. If the ruling regime remains in power and relations with the West stay strained, production may decline.
Earlier this week, Donald Trump assured investors that the conflict would soon conclude, setting the stage for a 12-day war in 2025 and causing a surge in Brent and WTI prices at the start of the week. Market rumours suggest that the US president, under domestic political pressure, might declare victory and back down. Investors are awaiting the right moment to deploy the TACO strategy, or Trump Always Chickens Out.
However, in past instances, the White House’s opponents agreed to the conditions imposed upon them. Iran is now outright refusing to engage in negotiations, citing that two previous dialogues with the US, in summer 2025 and winter 2026, ended in bombings. Trump has promised to escalate actions if Tehran begins mining the Strait of Hormuz. Rumours of a tanker explosion near Abu Dhabi imply that he is already taking such steps.
Meanwhile, according to Goldman Sachs, oil flows through the world’s main artery have increased from zero to 1.6 million bpd. While this is far below the pre-war level of 20 million bpd, its growth could support the bearish outlook on Brent and WTI. In fact, the actual volume of crude passing through the Strait of Hormuz may be even higher, as tankers try to conceal their movements.
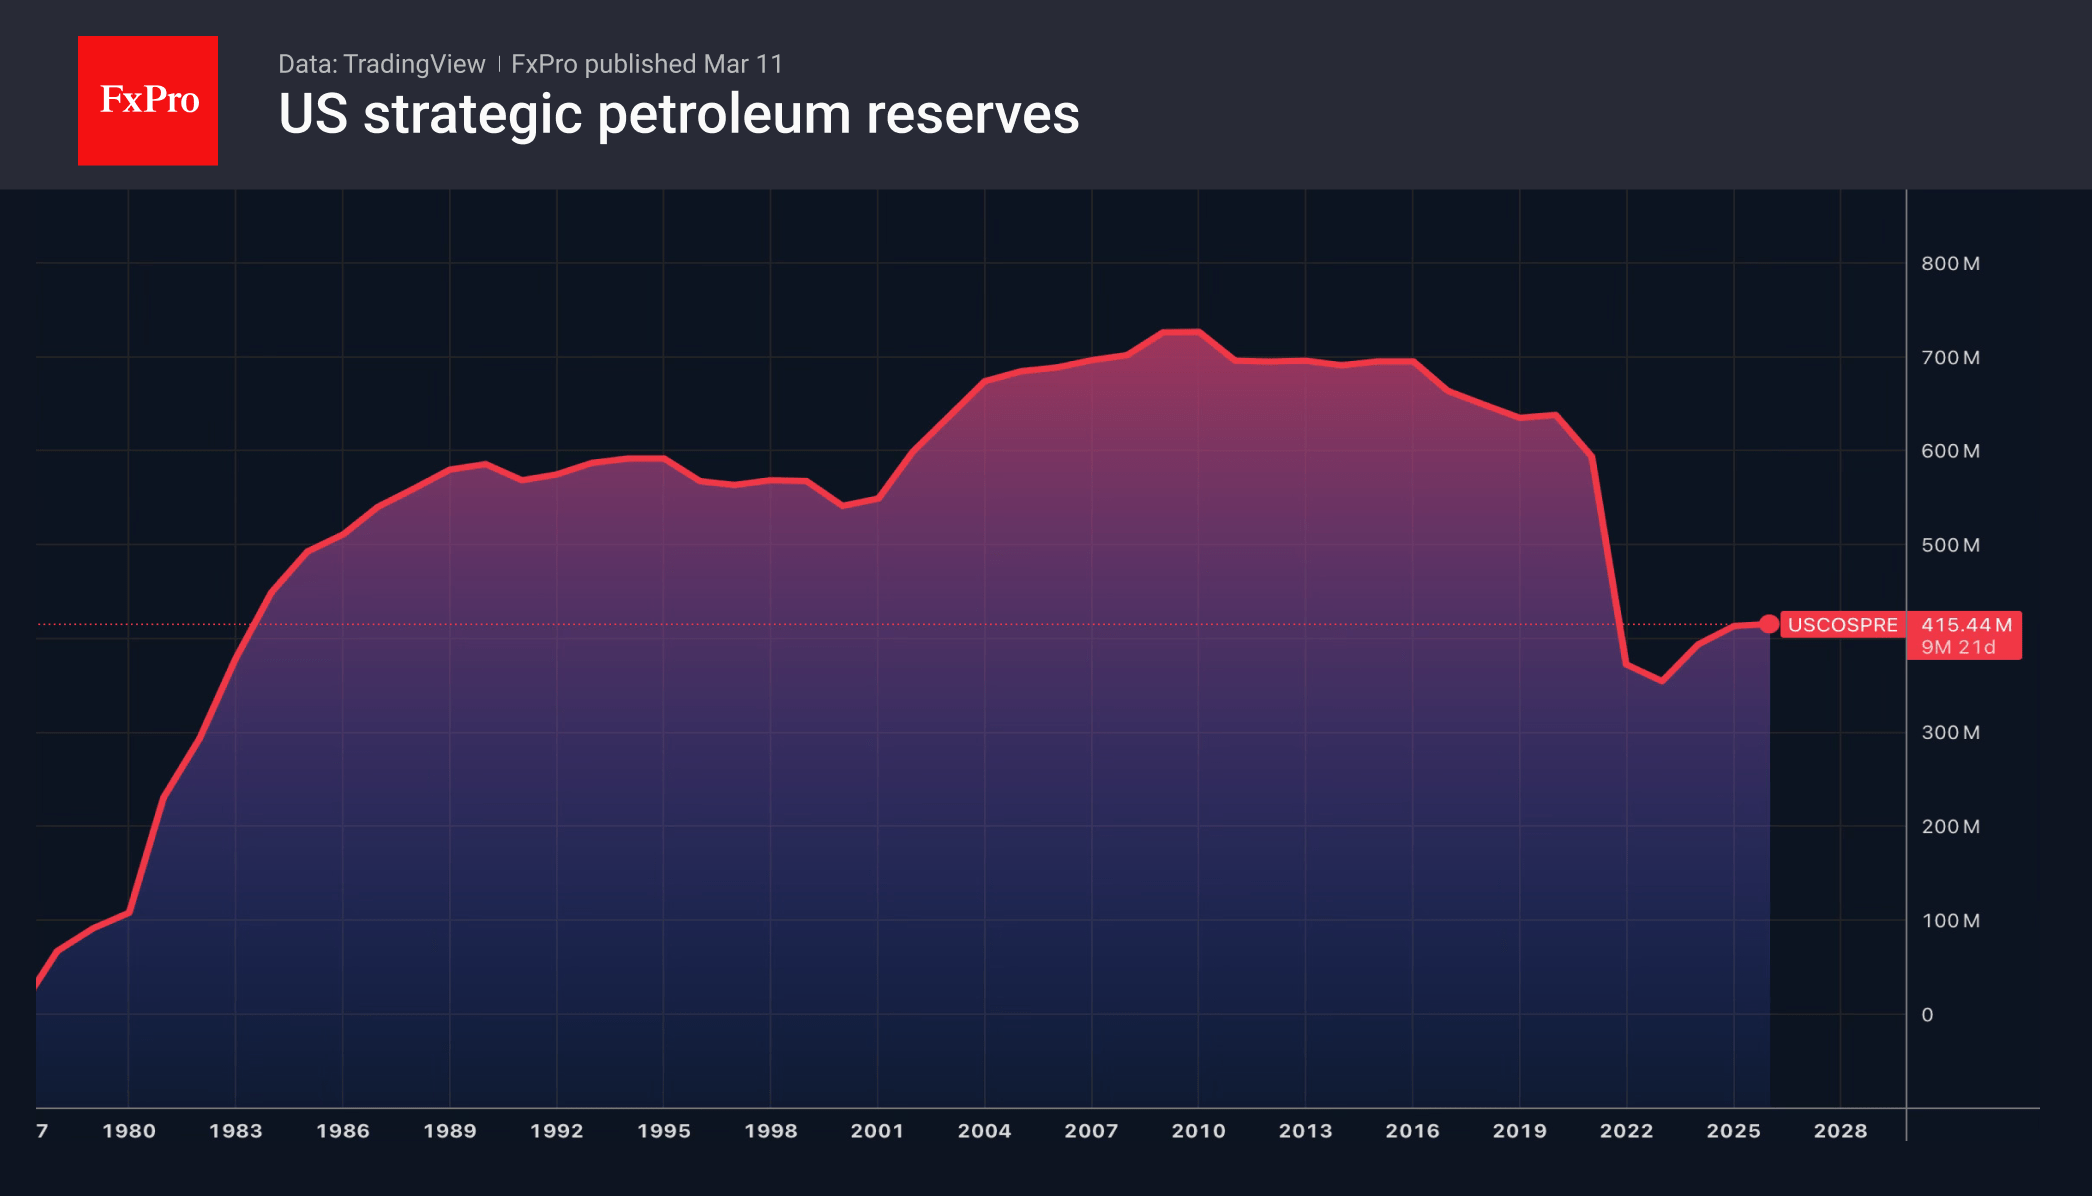
The intention behind the IEA member countries releasing barrels from strategic reserves appears to be twofold. The US and its allies experienced a similar situation in 2022, when the release of 182 million barrels caused fears and a 20% spike in Brent prices within a week. Investors interpreted this as a sign of a fragile market. Conversely, the United States’ sale of reserves on the first day of the 1991 Iraq invasion, during Operation Desert Storm, led to a 20% decline in North Sea crude prices.
Eco Data 3/12/26
| GMT | Ccy | Events | Act | Cons | Prev | Rev |
|---|---|---|---|---|---|---|
| 21:45 | NZD | Manufacturing Sales Q4 | 0.60% | 2.70% | 2.60% | |
| 23:50 | JPY | BSI Large Manufacturing Q1 | 3.8 | 5.5 | 4.7 | |
| 00:00 | AUD | Consumer Inflation Expectations Mar | 5.20% | 5% | ||
| 00:01 | GBP | RICS Housing Price Balance Feb | -12% | -9% | -10% | |
| 12:30 | CAD | Building Permits M/M Jan | 4.80% | -2.00% | 6.80% | 6.10% |
| 12:30 | CAD | Trade Balance (CAD) Jan | -3.6B | -1.0B | -1.3B | |
| 12:30 | CAD | Wholesale Sales M/M Jan | -1.00% | -0.60% | 2.00% | |
| 12:30 | USD | Initial Jobless Claims (Mar 6) | 213K | 215K | 213K | 214K |
| 12:30 | USD | Housing Starts Jan | 1.49M | 1.34M | 1.40M | |
| 12:30 | USD | Building Permits Jan | 1.38M | 1.39M | 1.45M | |
| 13:30 | USD | Trade Balance (USD) Jan | -54.5B | -67.8B | -70.3B | -72.9B |
| 14:30 | USD | Natural Gas Storage (Mar 6) | -38B | -42B | -132B |
| 21:45 | NZD |
| Manufacturing Sales Q4 | |
| Actual | 0.60% |
| Consensus | |
| Previous | 2.70% |
| Revised | 2.60% |
| 23:50 | JPY |
| BSI Large Manufacturing Q1 | |
| Actual | 3.8 |
| Consensus | 5.5 |
| Previous | 4.7 |
| 00:00 | AUD |
| Consumer Inflation Expectations Mar | |
| Actual | 5.20% |
| Consensus | |
| Previous | 5% |
| 00:01 | GBP |
| RICS Housing Price Balance Feb | |
| Actual | -12% |
| Consensus | -9% |
| Previous | -10% |
| 12:30 | CAD |
| Building Permits M/M Jan | |
| Actual | 4.80% |
| Consensus | -2.00% |
| Previous | 6.80% |
| Revised | 6.10% |
| 12:30 | CAD |
| Trade Balance (CAD) Jan | |
| Actual | -3.6B |
| Consensus | -1.0B |
| Previous | -1.3B |
| 12:30 | CAD |
| Wholesale Sales M/M Jan | |
| Actual | -1.00% |
| Consensus | -0.60% |
| Previous | 2.00% |
| 12:30 | USD |
| Initial Jobless Claims (Mar 6) | |
| Actual | 213K |
| Consensus | 215K |
| Previous | 213K |
| Revised | 214K |
| 12:30 | USD |
| Housing Starts Jan | |
| Actual | 1.49M |
| Consensus | 1.34M |
| Previous | 1.40M |
| 12:30 | USD |
| Building Permits Jan | |
| Actual | 1.38M |
| Consensus | 1.39M |
| Previous | 1.45M |
| 13:30 | USD |
| Trade Balance (USD) Jan | |
| Actual | -54.5B |
| Consensus | -67.8B |
| Previous | -70.3B |
| Revised | -72.9B |
| 14:30 | USD |
| Natural Gas Storage (Mar 6) | |
| Actual | -38B |
| Consensus | -42B |
| Previous | -132B |
Oil shrugs off record IEA reserve release as supply deficit persists
The IEA has officially pulled the trigger on a "historic bazooka," yet the oil market’s response has been a collective shrug. By authorizing a 400-million-barrel release—the largest coordinated action in the agency's history—the IEA intended to crush speculative fervor. However, crude prices remain stubbornly anchored, with WTI hovering near $85. This suggests that while the headline volume is staggering, the underlying market mechanics are far more concerned with the math of a physical deficit than a diplomatic gesture.
The disconnect lies in a simple, brutal calculation. The closure of the Strait of Hormuz has effectively orphaned 20 million barrels per day (mb/d) of global supply. Spreading the IEA’s 400 million barrels over a 60-day window provides a supplementary flow of only ~6.6 mb/d. This leaves a gaping 13.4 mb/d hole in the global energy balance. Even with the "largest release ever," the world remains in a state of extreme scarcity, a reality that traders are pricing in with surgical precision.
Furthermore, the market had already digested the news. Large-scale interventions of this nature are rarely a surprise; they are telegraphed through G7 communiqués and diplomatic leaks days in advance. By the time the formal announcement hit the wires at 13:00 GMT, the "intervention premium" had already been shaved off. The initial dip to $76.76 proved to be a "bear trap," as buyers quickly realized that the strategic reserves are a finite band-aid for an infinite geopolitical wound.
Logistics also play a haunting role. An IEA announcement is a policy shift, not a physical delivery. Moving these reserves to the right refineries involves a labyrinth of maritime hurdles, especially with the world's primary transit artery blocked. The time lag between the "order" and the "barrel at the pump" is estimated to be at least a week, if not more. In a war-torn market, a week is an eternity, and the "spot" price reflects that immediate anxiety.
Technically, the picture has shifted. We have adjusted lower the near-term range to $76.76–$91.44, down from $80-100. The $91.44 level is now the critical pivot point; a firm break above this resistance would signal that the market has completely discounted the IEA's intervention. Such a move would likely trigger a technical "sling-shot" toward the 61.8% Fibonacci retracement at $103.14. For now, the IEA has prevented a vertical spike to $150, but they haven't won the war for $70- oil.

US Dollar Index (DXY) Rises as US Inflation in Line With Forecasts
- YOY inflation remained stable at 2.4% (matching expectations and the lowest level since May 2025).
- Core inflation remained unchanged at 2.5% annually, a multi-year low.
- Monthly CPI rose 0.3%, primarily driven by Shelter (0.2% increase), Gasoline (0.8% increase), and Food (0.4% increase).
- Future inflation releases (especially April's) will be significantly impacted by the surge in oil prices stemming from the Middle East conflict (Israel, Iran, US). The US Dollar Index (DXY) rose, continuing its upward trend, and remains swayed by developments in the Middle East.
The US annual inflation rate remained stable at 2.4%, holding firm from January and matching market expectations. This figure represents a continued cooling of the economy, maintaining the lowest inflationary levels seen since May 2025.
Monthly Fluctuations and Core Trends
On a month-to-month basis, the Consumer Price Index (CPI) edged up slightly by 0.3%, a minor acceleration from January’s 0.2% increase. The primary contributors to this monthly rise were:
- Shelter: Increased by 0.2%, serving as the largest contributor to the monthly gain.
- Gasoline: Rose by 0.8%.
- Food: Increased by 0.4%.
While the headline number (YoY) stayed flat, the underlying drivers saw some shifts: energy prices rebounded to a 0.5% increase, fueled by rising natural gas costs and a significant spike in fuel oil, which offset a moderating decline in gasoline prices.
Conversely, the cost of used cars and trucks saw a steeper drop than the previous month, while inflation for essential categories like food and shelter held steady at 3.1% and 3% respectively.
Meanwhile, core inflation, which strips out the volatile food and energy sectors to provide a clearer look at long-term trends remained unchanged at an annual rate of 2.5%. This marks a multi-year low, hovering near levels not seen since 2021.
On a monthly basis, core prices rose by a modest 0.2%, showing a slight deceleration from the previous month and signaling that underlying price pressures remain largely in check.
Outlook moving forward
Today 's CPI print for lack of a better term is ‘out of touch’ with reality. The reason i say this is that the surge in oil prices and concerns around its impact on inflation all began on February 28.
Thus any shocks to be felt on the inflation front may only start to filter through in next month's release, which should be a blockbuster one. The release in April could potentially make or break the case for rate cuts globally.
If the war drags on to that date between Israel, Iran and the US, the impact may be huge on energy prices. Thus the longer the war drags on the larger the impact on inflation and thus rate cut expectations.
For now, even this week's PCE data may take a backseat and not have a huge impact on markets. Not until some form of clarity on the Middle East situation comes to fruition.
Market impact & US dollar index (DXY) reaction
The data was not really a huge surprise and heading into the release the print was highly unlikely to have a major impact on markets.
The DXY did however continue on its upward trajectory which began yesterday.
The Dollar continues to sway based on developments in the Middle East. A daily candle close is still needed above the 99.57 handle if the bullish momentum is to continue.
Immediate support rests at 98.72 before the 100 and 200-day MAs come into focus.
If acceptance above the 99.57 handle is achieved, then the psychological 100.00 level comes into focus.
US Dollar Index Daily Chart (Left)/15M Chart (Right), March 11, 2026
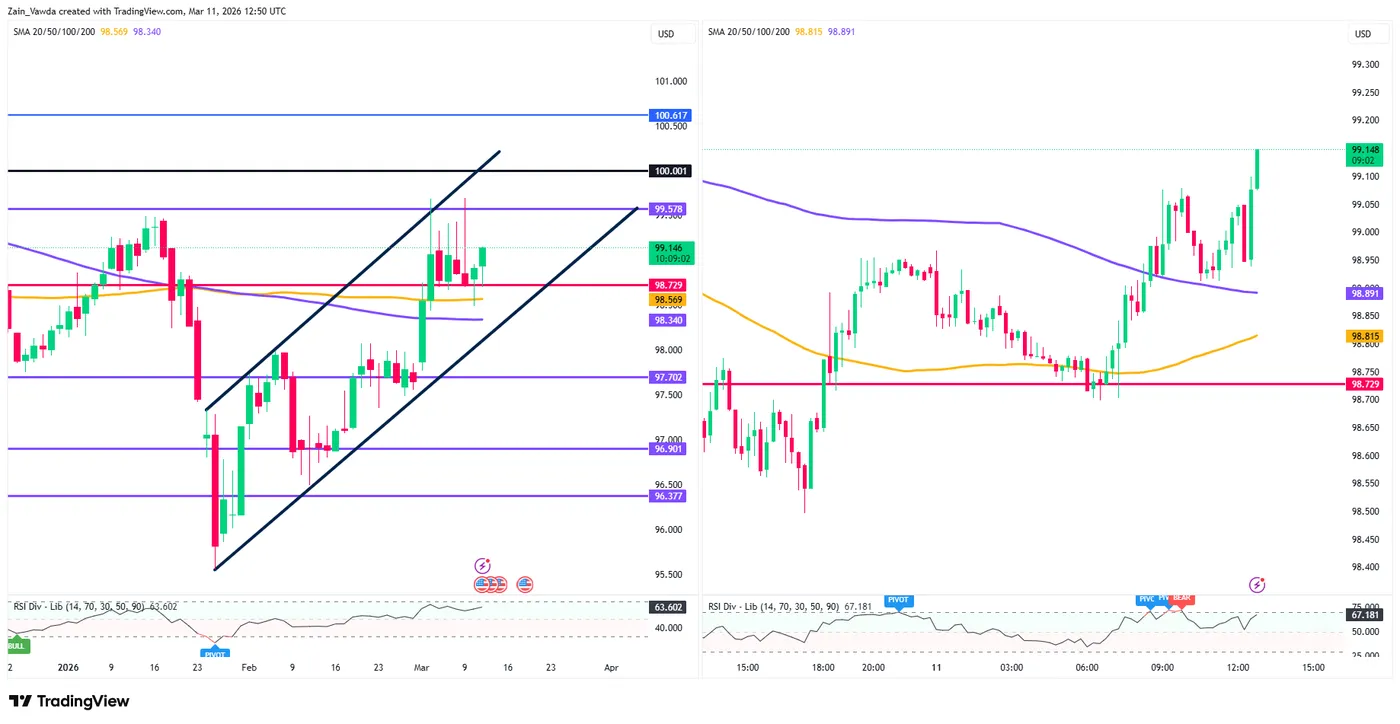
Source: TradingView
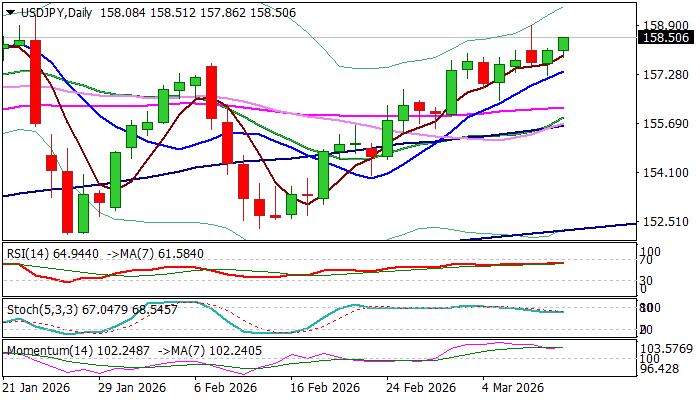
USDJPY – Bulls Hold Grip and Eye Key Barriers at 160 Zone
USDJPY keeps firm tone and heads towards Monday’s peak (158.89) after broader uptrend (from 152.26, Feb 12 low) was briefly interrupted by shallow pullback (158.89/157.27 on Mon-Tue) when rally was capped by upper 20-d Bollinger band and subsequent dip contained by rising 20DMA (near-term price action continues to channel higher between these two indicators).
Daily picture remains bullish (strong positive momentum / multiple ascending DMAs bull-crosses) and favor attack at 158.89, violation of which to open way towards key barriers at 159.45 (2026 peak, posted on Jan 14) and 160.00 (psychological).
Traders remain cautious as the pair approaches 160 zone where Japanese authorities may intervene to support weakening currency.
The Bank of Japan is widely expected to keep interest rates unchanged at 0.75% in the policy meeting next week, but with growing bets for 25 basis points hike by the end of June and another one in early 2027 that may also provide headwinds to the pair’s action.
Initial support lays at 158.00 zone, followed by 157.39 (ascending 10DMA which tracks the action in nearly three weeks) and 156.20 (55DMA).
Res: 158. 89; 159.22; 159.45; 160.00
Sup: 158.00; 157.39; 156.20; 155.71
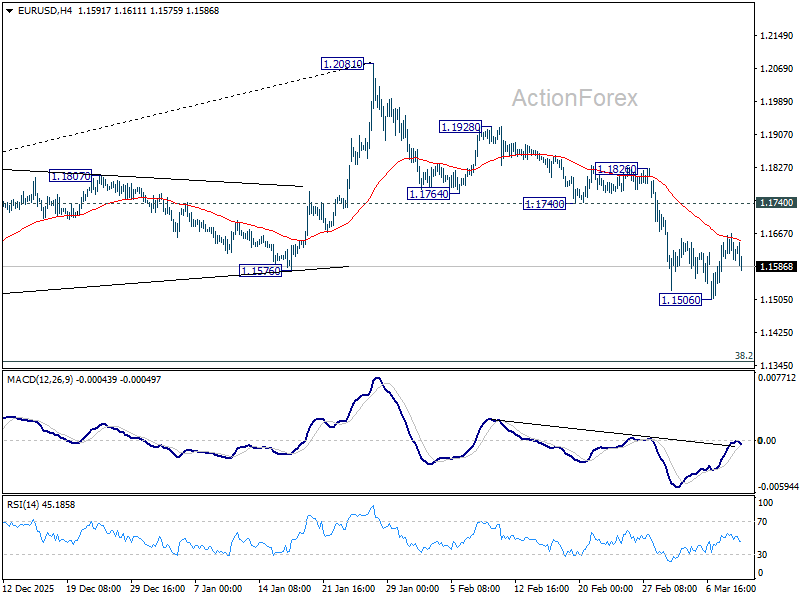
EUR/USD Mid-Day Outlook
Daily Pivots: (S1) 1.1590; (P) 1.1628; (R1) 1.1650; More….
Range trading continues in EUR/USD and intraday bias remains neutral. Further decline is expect red with 1.1740 support turned resistance intact. On the downside, break of 1.1506 will resume the fall from 1.2081 and target 38.2% retracement of 1.0176 to 1.2081 at 1.1353 next.
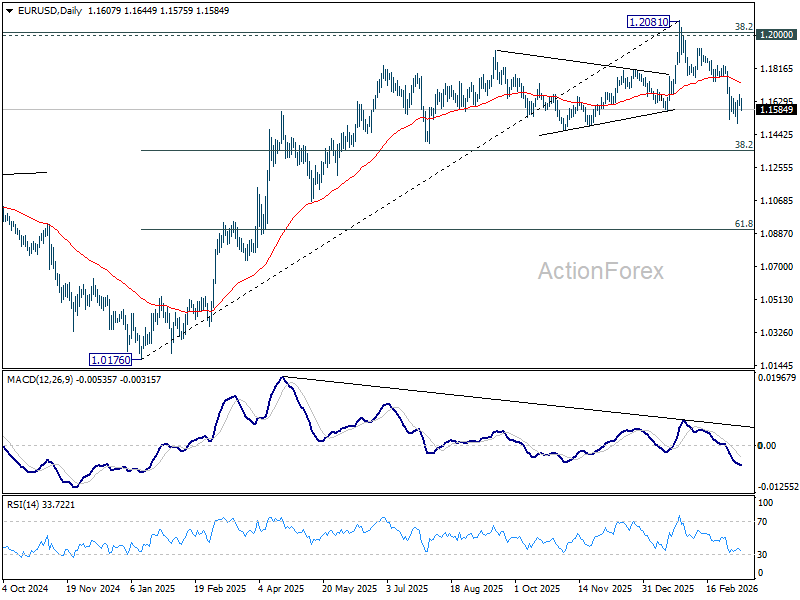
In the bigger picture, a medium term top should be in place at 1.2081 on bearish divergence condition in D MACD. Sustained trading below 55 W EMA (now at 1.1500) should confirm rejection by 1.2 key cluster resistance level. That would also raise the chance that whole up trend from 0.9534 (2022 low) has completed as a three wave corrective bounce too. For now, medium term outlook is neutral at best as long as 1.2081 holds, even in case of rebound.
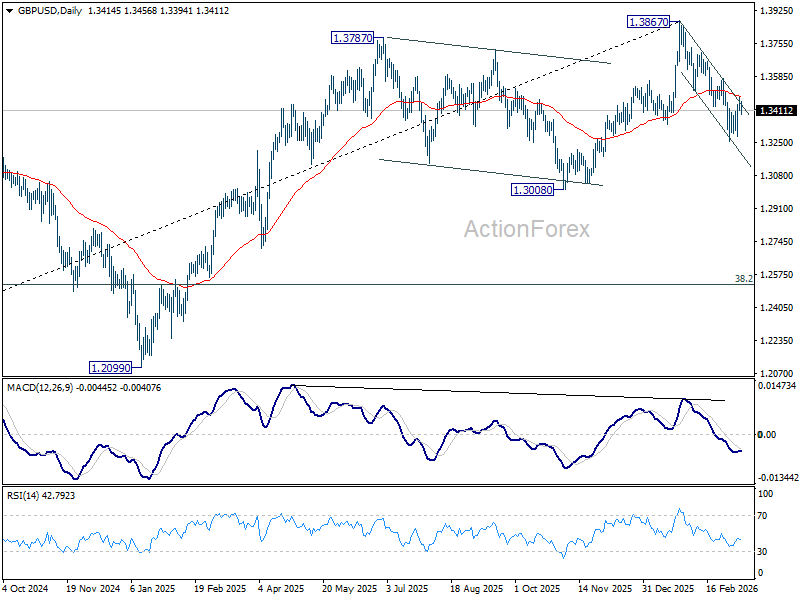
GBP/USD Mid-Day Outlook
Daily Pivots: (S1) 1.3392; (P) 1.3438; (R1) 1.3463; More...
Range trading continues in GBP/USD and intraday bias stays neutral. With 1.3574 resistance intact, further decline is still in favor. On the downside, below 1.3252 will extend the decline from 1.3867 to 1.3008 structural support. Decisive break there will carry larger bearish implications.
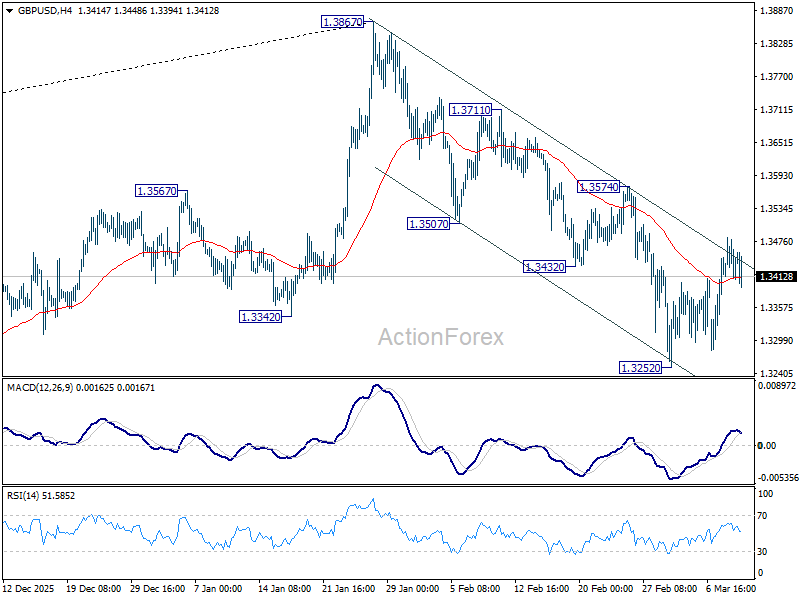
In the bigger picture, considering bearish divergence condition in both D and W MACD, a medium term top should be in place from 1.3867. Firm break of 1.3008 support will argue that fall from 1.3867 is at least corrective the whole rise from 1.0351 (2022 low) with risk of bearish reversal. That would open up further decline to 38.2% retracement of 1.0351 to 1.3867 at 1.2524. For now, medium term outlook will be neutral at best as long as 1.3867 resistance holds, or under further development.
USD/CHF Mid-Day Outlook
Daily Pivots: (S1) 0.7758; (P) 0.7775; (R1) 0.7804; More….
No change in USD/CHF's outlook and intraday bias stays neutral at this point. On the downside, break of 0.7671 support will revive near term bearishness and bring retest of 0.7603 low. Decisive break there will resume larger down trend. On the upside, though, break of 0.7877 will bring stronger rally to 0.8039 resistance next.

In the bigger picture, a medium term bottom could be in place at 0.7603 on bullish convergence condition in D MACD, Firm break of 0.8039 resistance will argue that it's at least correcting the down trend from 0.9002. Stronger rebound would then be seen to 38.2% retracement of 0.9200 to 0.7603 at 0.8213. However, break of 0.7603 will resume the down trend to 100% projection of 1.0146 (2022 high) to 0.8332 from 0.9200 at 0.7382.

US: Inflation Progress Slows Ahead of Oil Shock
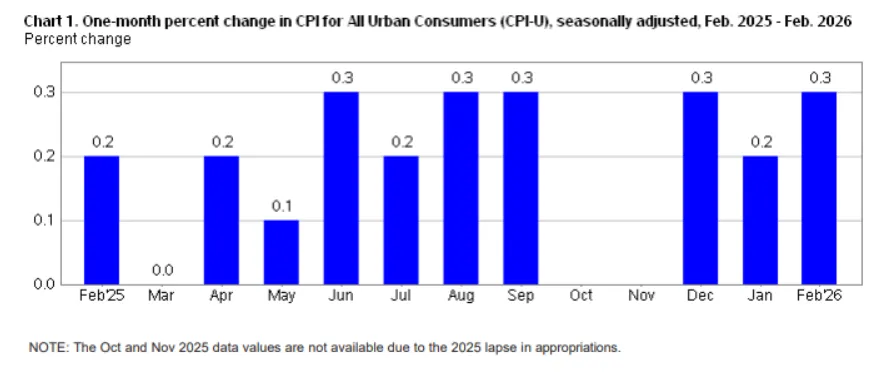
The Consumer Price Index (CPI) rose 0.3% month-on-month (m/m) in February, meeting the Bloomberg consensus forecast. On a twelve-month basis, CPI was unchanged at 2.4%.
- Energy costs rose 0.6% m/m, amid some firming in prices at the pump and utility costs. Food prices also heated up in February, rising 0.4% m/m following a softer gain of 0.2% the month prior. The uptick was driven by an acceleration in both grocery costs and "food away from home".
Excluding food and energy, core inflation rose 0.2% m/m, a tick lower than the month prior. On a twelve-month basis, the core measure held steady at 2.5%, though over the past three months it is running a bit hotter at a 3.0% annualized pace.
The softening in the monthly core reading was due to a cooling in services inflation, largely the result of an easing in travel related costs and a pullback in recreational services. Meanwhile, primary shelter costs rose roughly in line with January's increase, pushing the year-ago measure for core services inflation down to 2.9%.
Core goods prices rose a 'soft' 0.1% m/m, following flat readings in each of the two prior months. Apparel prices jumped 1.3% m/m, while home furnishings and recreational goods also recorded gains, which were largely offset by a sharp decline in education & communication goods (-3.0% m/m) and a further pullback in used car prices (-0.4% m/m).
Key Implications
This morning's inflation report feels a bit backward looking following recent geopolitical developments. Perhaps the most notable takeaway is that even before the recent spike in oil prices, progress on the inflation front was already showing signs of petering out.
Looking ahead, we don't see much more room for services inflation to cool, while further tariff passthrough and secondary effects from higher oil prices are two-sources of upside risk to the inflation outlook. For now, this leaves the Federal Reserve in a holding pattern, unless the labor market were to show further signs of softening in the months ahead.
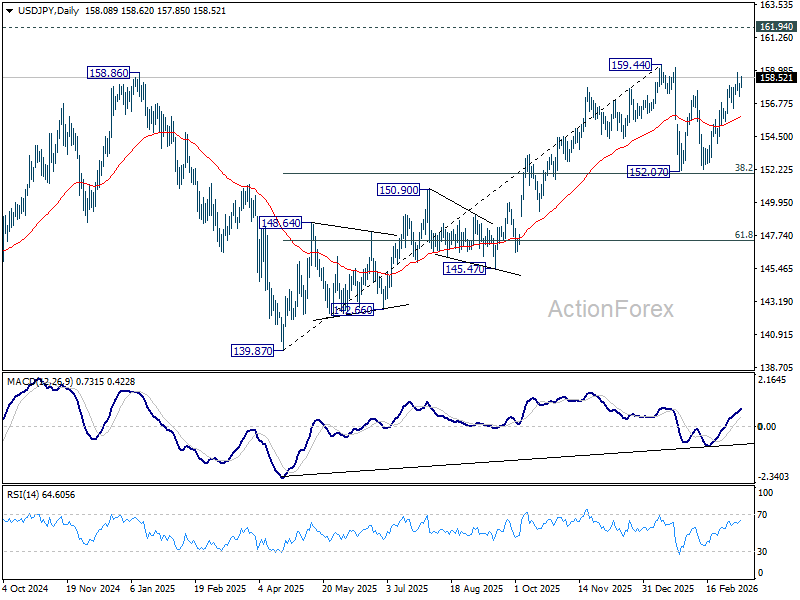
USD/JPY Mid-Day Outlook
Daily Pivots: (S1) 157.44; (P) 157.84; (R1) 158.44; More...
USD/JPY strengthens mildly in early US session but stays below 158.98 temporary top. Intraday bias remains neutral for the moment. On the upside, above 158.89 will extend the rise from 152.07 to 159.44 resistance. Decisive break there will target 161.94 high next. However, considering bearish divergence condition in 4H MACD, firm break of 156.44 support will argue that the rebound has completed, and turn bias back to the downside for 152.07 support. Overall, price actions from 159.44 are viewed as a near term consolidation pattern. Outlook will remain bullish as long as 38.2% retracement of 139.87 to 159.44 at 151.96 holds.
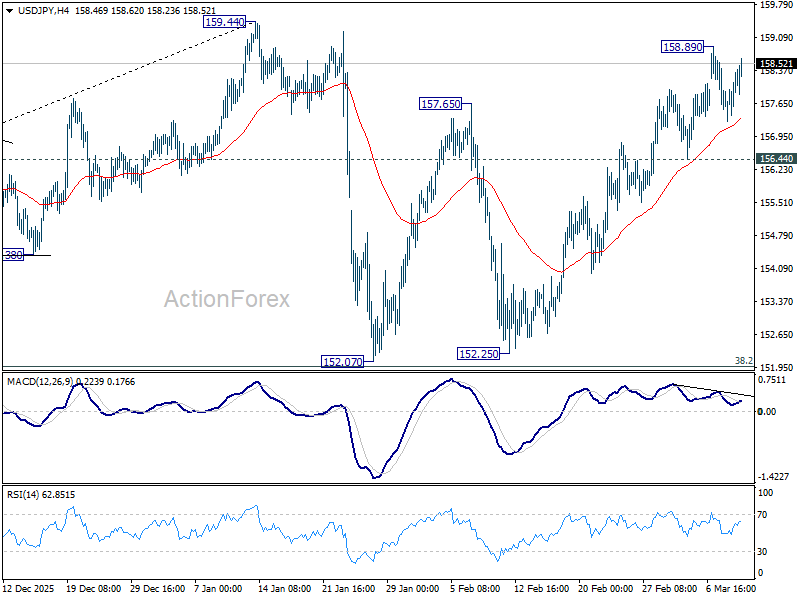
In the bigger picture, outlook is unchanged that corrective pattern from 161.94 (2024 high) should have completed with three waves at 139.87. Larger up trend from 102.58 (2021 low) could be ready to resume through 161.94. This will remain the favored case as long as 55 W EMA (now at 152.16) holds. However, sustained break of 55 W EMA will argue that the pattern from 161.94 is extending with another falling leg.