
Sample Category Title
Oil Price Moves Back Below USD 90/bbl
In focus today
Geopolitical tensions in Iran continue to dominate market sentiment, with uncertainty over how long the conflict and energy supply disruptions will persist. Investors will be watching closely for updates on the global release of strategic reserves, oil supply disruptions, geopolitical developments, and any further comments from the Trump administration.
Today's most important data release will be the US February CPI. US gasoline prices were on the rise already before the war in Iran erupted, and we expect energy inflation to lift headline CPI by +0.3% m/m SA (2.5% y/y). Core inflation will likely remain more modest at +0.2% m/m SA (2.5% y/y) due to low housing contribution.
We will follow comments from ECB executive board member Schnabel, who is scheduled to speak today. As the silent period ahead of the March meeting begins tomorrow, both Guindos and Schnabel have the chance to offer key insights today.
Economic and market news
What happened yesterday
The pressure on oil prices has eased since Monday with the Brent crude trading around USD 86/bbl - down from USD 118/bbl on Monday. The easing comes as US President Trump suggested the conflict with Iran could soon de-escalate, alleviating fears of prolonged supply disruptions. Saudi Arabia is working to redirect some oil supply via pipeline to the Red Sea, while the IEA is rumoured to propose a strategic reserve release larger than the one following Russia's invasion of Ukraine. Though neither solution offers a permanent fix, they could help stabilise markets until shipments resume through the Strait of Hormuz. Notably, Tuesday also saw some of the most intense airstrikes of the conflict. According to Reuters, Iran's Revolutionary Guards said Tehran would not allow "one litre" of Middle Eastern oil to reach the US or its allies while attacks continue. Meanwhile, US Secretary of Energy Chris Wright briefly claimed on X that the US Navy had escorted an oil tanker through the Strait of Hormuz but later deleted the post. The White House later confirmed no such escort had occurred. The Pentagon reported destroying multiple vessels near the strait, including 16 minelayers, and issued another warning to Tehran against deploying explosives in the area.
In Norway, February core inflation fell to 3.0% y/y from 3.37% in January, aligning with analyst consensus but exceeding Norges Bank's December projection of 2.6%. Headline inflation registered at 2.7% y/y, slightly above Norges Bank's forecast of 2.6%. Details revealed corrections to January's sharp jump in services ex. rent, which were largely one-offs. Overall, the release provides relief after last month's inflation surprise, with little evidence of core inflation accelerating further. While hikes now appear less likely, views on the probability of rate cuts will probably diverge. We see a cut in September as the most likely scenario.
In the US, NFIB's small business optimism index remained fairly steady in February (98.8; Jan. 99.3). Firms reported slightly lower uncertainty, improving business outlook and modestly lower price plans. Hiring plans declined, but at the same, realized employment changes were more positive than before. Similarly, ADP's weekly private sector jobs estimate continued to show improving jobs growth at 15.5k per week, up from 12k two weeks earlier.
In Sweden, January's consumption indicator stabilised at +0.7% m/m and +2.8% y/y, supported by broad-based growth across key aggregates. This followed December's volatile figures (-3.7% m/m/+0.5% y/y) and stable retail sales performance. Meanwhile, the GDP indicator remained weak at -1.1% m/m and +0.6% y/y, reflecting declines in private sector production, particularly in construction and manufacturing, while services remained flat. New orders fell, as indicated by PMI data, primarily in the export industry but also domestically, though from high levels. Production data continues to be influenced by strong defence spending in Q4.
In Denmark, February CPI inflation edged lower to 0.7% from 0.8% in January. Food prices declined 0.3% m/m, continuing a downward trend, while rents saw their annual increase at 1.8% m/m, slightly higher than last year. Energy prices showed mixed developments, with electricity rising sharply by 8.8% as expected, but gas prices only increasing 5.2%, less than forecast.
Equities: European equities rallied yesterday, with Stoxx 600 up 2% and OMX Nordic nearly 3%, more than recouping Monday's losses. US trading choppier, influenced heavily by the twists and turns in the oil price, and eventually closing somewhat lower (S&P500 -0.2%). US futures are somewhat higher today.
Within equities, tech leadership continued, and growth/momentum stocks did particularly well. This is interesting, as it is a trend shift from most of this year, with value outperforming growth with almost 10% YTD before the Iran attacks. It gets even more interesting considering that the US 10y even rose a few basis points yesterday. Tech, consumer discretionary and real estate were among the winners in the US session while defensives (utilities, health care) underperformed. Value cyclicals like banks and industrials were also weak.
Tech comeback is likely to continue today following a strong set of earnings from Oracle. Oracle has more than halved this year following massive AI capex programs, but they are sure monetizing it so far with cloud revenues growing 44% in the quarter. The moves in the oil price are still heavily impactful on markets, but with oil nearing 80 dollars, the impact from further declines will have less influence. As such, the recent tech appetite will be tested; whether Iran was a temporary distraction from the AI disruption theme or if this new leadership can be sustained.
FI and FX: Brent crude hit a new, recent low following reports that the US Navy escorted an oil tanker through the Strait of Hormuz, which were later denied. A decision on the IEA proposal is expected today, which would constitute the largest release of oil reserves in history, which could provide some temporary relief. EUR/USD remains about unchanged below 1.1650 from yesterday's open. 2Y Bund yields declined about 6bp and 2Y US Treasury yields pulled back 2bp over yesterday's trading session. The inflation print out of Norway matched analyst expectations at 3.0% y/y with details revealing few real surprises, with EUR/NOK ending the day largely unchanged. The SEK continues to trade with risk sentiment and after a very brief visit below 10.60 EUR/SEK climbed higher through the latter half of yesterday's session, as sentiment softened somewhat. Turning to the data, we forecast today's US February CPI at 2.5% y/y in both headline and core terms, slightly above consensus, but do not expect the release to significantly affect market pricing.
EUR/AUD Daily Outlook
Daily Pivots: (S1) 1.6228; (P) 1.6347; (R1) 1.6426; More...
EUR/AUD accelerates lower today and breaks through 138.2% projection of 1.8554 to 1.7245 from 1.8160 at 1.6351. Intraday bias remains on the downside for 161.8% projection at 1.6042 next. For now, near term outlook will remain bearish as long as 1.6594 support holds, in case of recovery.

In the bigger picture, fall from 1.8554 medium term top is seen as reversing the whole up trend from 1.4281 (2022 low). Deeper decline should be seen to 61.8% retracement of 1.4281 to 1.8554 at 1.5913, which is slightly below 1.5963 structural support. For now, risk will stay on the downside as long as 55 D EMA (now at 1.6911) holds, even in case of strong rebound.

EUR/GBP Daily Outlook
Daily Pivots: (S1) 0.8642; (P) 0.8653; (R1) 0.8665; More…
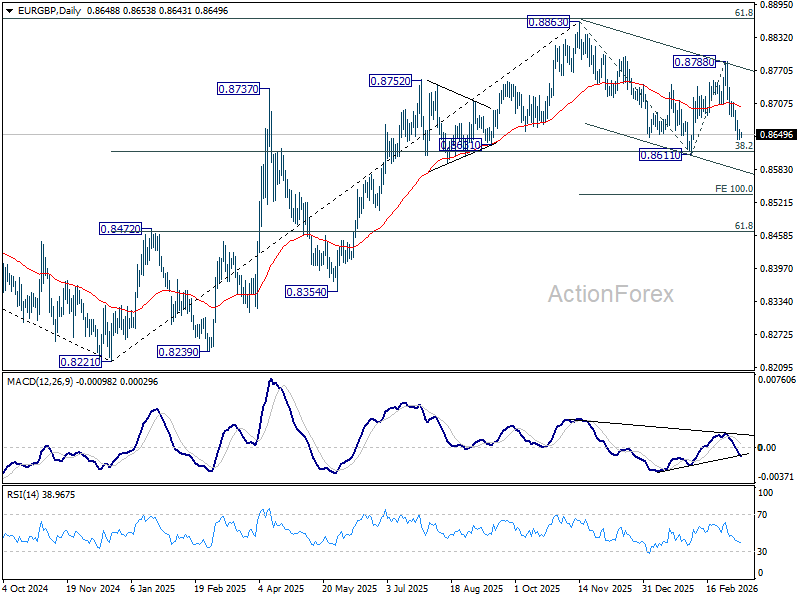
Intraday bias in EUR/GBP remains on the downside for 0.8611 support. Firm break there will resume the whole fall from 0.8863, and target 100% projection of 0.8863 to 0.8611 from 0.8788 at 0.8536. On the upside, above 0.8676 minor resistance will turn intraday bias neutral again first.

In the bigger picture, current development revived the case that whole rise from 0.8221 (2024 low) has completed at 0.8863, after rejection by 61.8% retracement of 0.9267 (2022 high) to 0.8221 at 0.8867. Sustained trading below 38.2% retracement of 0.8821 to 0.8863 at 0.8618 will confirm this case, and bring deeper fall to 61.8% retracement at 0.8466 at least. For now, medium term outlook is neutral at best as long as 0.8863 resistance holds.
GBP/JPY Daily Outlook
Daily Pivots: (S1) 211.64; (P) 212.03; (R1) 212.46; More...
GBP/JPY's rebound from 207.20 resumed by breaking through 212.10 and intraday bias is back on the upside for retesting 214.98 high. Firm break there will resume larger up trend. On the downside, though, break of 209.15 will extend the corrective pattern from 214.98 with another falling leg, and target 207.20 support.
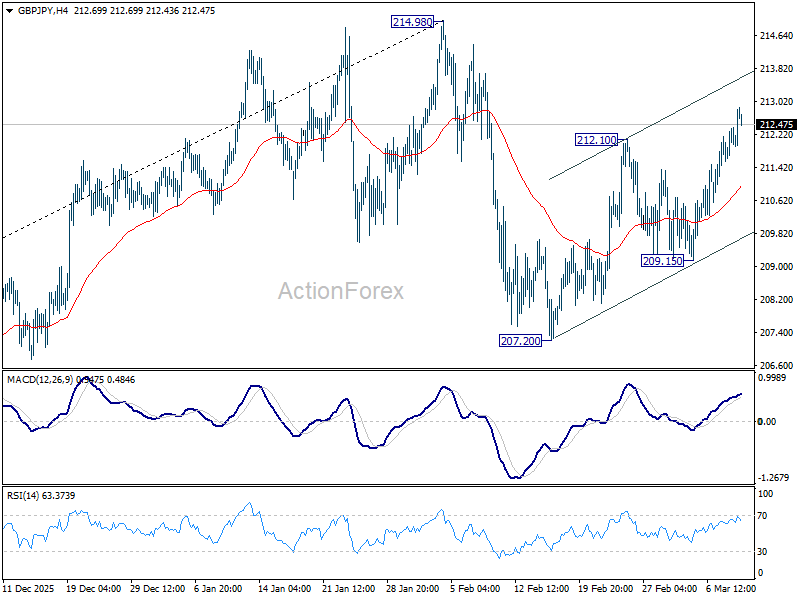
In the bigger picture, up trend from 123.94 (2020 low) is still in progress. Firm break of 214.98 will target 61.8% projection of 148.93 (2022 low) to 208.09 (2024 high) from 184.35 at 220.90. This will remain the favored case as long as 55 W EMA (now at 202.80) holds, even in case of another deep pullback.

EUR/JPY Daily Outlook
Daily Pivots: (S1) 183.10; (P) 183.45; (R1) 183.84; More...
Intraday bias in EUR/JPY remains neutral first. On the upside, above 184.75 will resume the rebound from 180.78 to retest 186.86 high. Firm break there will confirm larger up trend resumption. On the downside, 182.00 will target 180.78. Firm break there will indicate that fall from 186.86 is already correcting whole up rise from 154.77.

In the bigger picture, a medium term top could be in place at 186.86 and some more consolidations could be seen. Nevertheless, the larger up trend from 114.42 (2020 low) remains intact. Firm break of 186.86 will pave the way to 78.6% projection of 124.37 (2022 low) to 175.41 (2025 high) from 154.77 at 194.88 next.

EUR/CHF Daily Outlook
Daily Pivots: (S1) 0.9023; (P) 0.9039; (R1) 0.9057; More....
Intraday bias in EUR/CHF stays neutral and more consolidations could be seen first. Outlook will stay bearish as long as 0.9149 resistance holds. On the downside, below 0.8979 will extend the larger down trend to 100% projection of 0.9347 to 0.9092 from 0.9149 at 0.8894.

In the bigger picture, down trend from 0.9928 (2024 high) is still in progress. Next target is 61.8% projection of 1.1149 to 0.9407 from 0.9928 at 0.8851. Outlook will stay bearish as long as 0.9394 resistance holds, in case of rebound.

EUR/USD Daily Outlook
Daily Pivots: (S1) 1.1590; (P) 1.1628; (R1) 1.1650; More….
Intraday bias in EUR/USD stays neutral for the moment, and more consolidations could be seen. Further decline is expectred with 1.1740 support turned resistance intact. On the downside, break of 1.1506 will resume the fall from 1.2081 and target 38.2% retracement of 1.0176 to 1.2081 at 1.1353 next.

In the bigger picture, a medium term top should be in place at 1.2081 on bearish divergence condition in D MACD. Sustained trading below 55 W EMA (now at 1.1500) should confirm rejection by 1.2 key cluster resistance level. That would also raise the chance that whole up trend from 0.9534 (2022 low) has completed as a three wave corrective bounce too. For now, medium term outlook is neutral at best as long as 1.2081 holds, even in case of rebound.

GBP/USD Daily Outlook
Daily Pivots: (S1) 1.3392; (P) 1.3438; (R1) 1.3463; More...
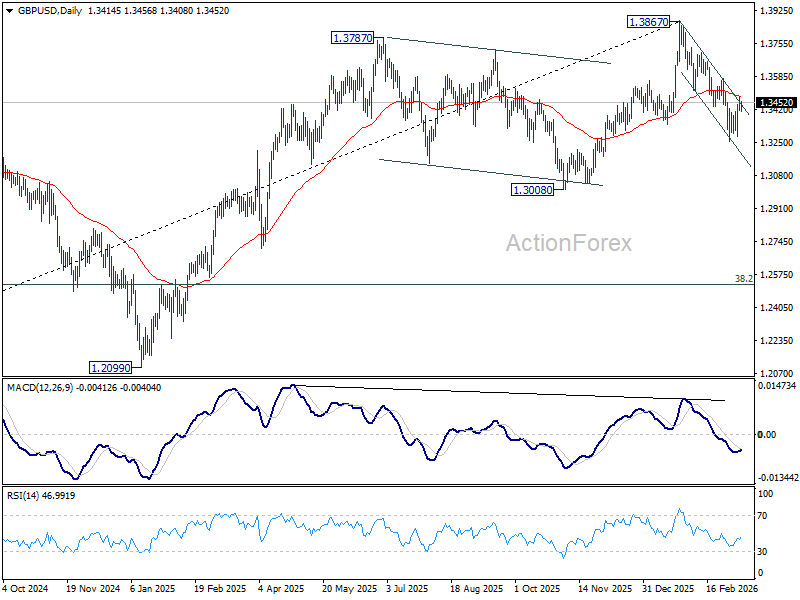
Intraday bias in GBP/USD remains neutral at this point. With 1.3574 resistance intact, further decline is still in favor. On the downside, below 1.3252 will extend the decline from 1.3867 to 1.3008 structural support. Decisive break there will carry larger bearish implications.

In the bigger picture, considering bearish divergence condition in both D and W MACD, a medium term top should be in place from 1.3867. Firm break of 1.3008 support will argue that fall from 1.3867 is at least corrective the whole rise from 1.0351 (2022 low) with risk of bearish reversal. That would open up further decline to 38.2% retracement of 1.0351 to 1.3867 at 1.2524. For now, medium term outlook will be neutral at best as long as 1.3867 resistance holds, or under further development.
USD/JPY Daily Outlook
Daily Pivots: (S1) 157.44; (P) 157.84; (R1) 158.44; More...
Intraday bias in USD/JPY remains neutral and more consolidations could be seen. On the upside, above 158.89 will extend the rise from 152.07 to 159.44 resistance. Decisive break there will target 161.94 high next. However, considering bearish divergence condition in 4H MACD, firm break of 156.44 support will argue that the rebound has completed, and turn bias back to the downside for 152.07 support. Overall, price actions from 159.44 are viewed as a near term consolidation pattern. Outlook will remain bullish as long as 38.2% retracement of 139.87 to 159.44 at 151.96 holds.
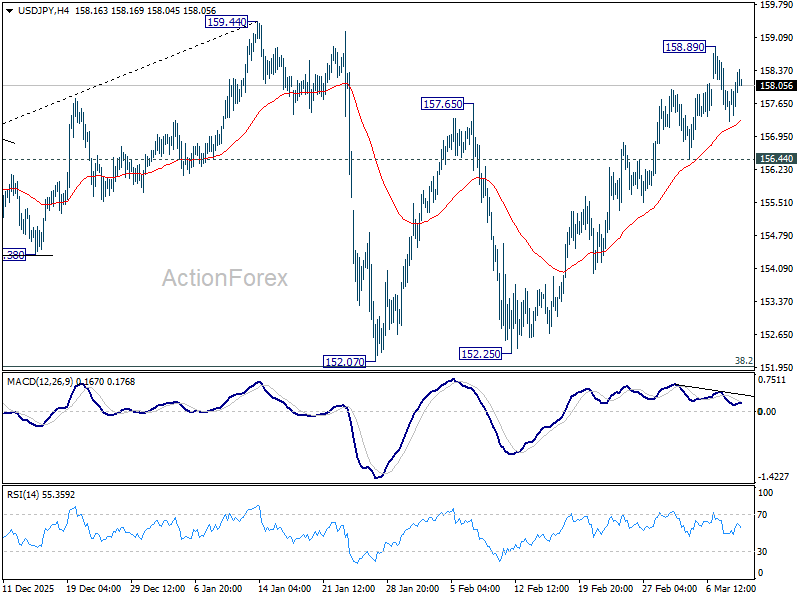
In the bigger picture, outlook is unchanged that corrective pattern from 161.94 (2024 high) should have completed with three waves at 139.87. Larger up trend from 102.58 (2021 low) could be ready to resume through 161.94. This will remain the favored case as long as 55 W EMA (now at 152.16) holds. However, sustained break of 55 W EMA will argue that the pattern from 161.94 is extending with another falling leg.

USD/CHF Daily Outlook
Daily Pivots: (S1) 0.7758; (P) 0.7775; (R1) 0.7804; More….
Range trading continues in USD/CHF and intraday bias remains neutral. On the downside, break of 0.7671 support will revive near term bearishness and bring retest of 0.7603 low. Decisive break there will resume larger down trend. On the upside, though, break of 0.7877 will bring stronger rally to 0.8039 resistance next.
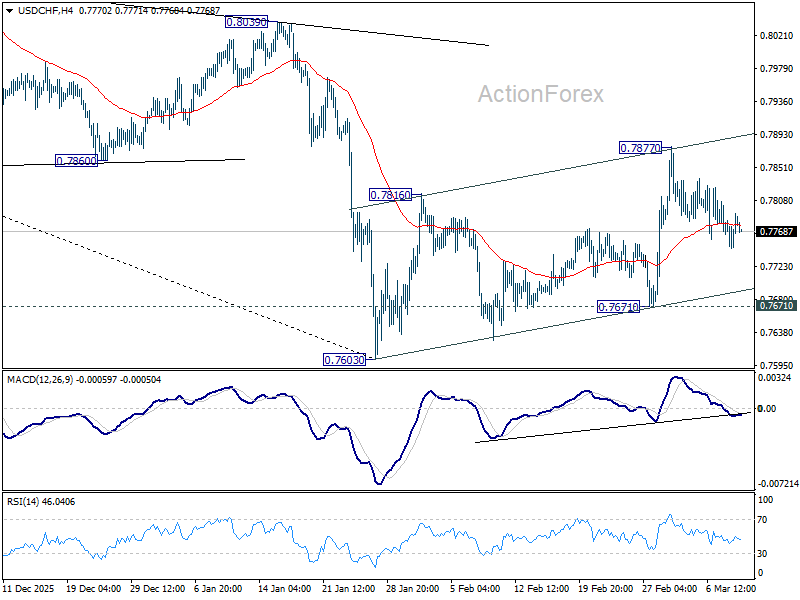
In the bigger picture, a medium term bottom could be in place at 0.7603 on bullish convergence condition in D MACD, Firm break of 0.8039 resistance will argue that it's at least correcting the down trend from 0.9002. Stronger rebound would then be seen to 38.2% retracement of 0.9200 to 0.7603 at 0.8213. However, break of 0.7603 will resume the down trend to 100% projection of 1.0146 (2022 high) to 0.8332 from 0.9200 at 0.7382.
