Sample Category Title
Can US Inflation Data Turn the Tide in the Dollar?
With the Fed's final rate increase now likely in the rear-view mirror and the markets pricing in decent chances for the central bank to cut rates by July, the spotlight will fall squarely on the next round of US inflation data out on Wednesday. Forecasts point to a slowdown in core CPI, although business surveys signaled the opposite. As for the dollar, it has been trading 'heavy' lately and it is doubtful whether even an upside surprise in this dataset can change that.
Sluggish dollar
The dollar has been under intense selling pressure this year, despite mounting signs that the US economy has started to regain momentum. It's been one-way traffic, with FX traders placing more emphasis on negative news and overlooking positive developments. The greenback seems unable to rally on stronger data, but any disappointment tends to inflict damage.
Behind this asymmetric reaction function lies speculation about Fed rate cuts. Even though the Fed has raised rates with incredible speed, market pricing suggests the next move will be a cut. A total of 70bps of rate reductions are priced in by December, which is striking given the persistence of inflationary pressures.
Most likely, this pricing reflects the problems in the banking system. Investors are betting the Fed will ride to the rescue soon by lowering rates, and will be forced to tolerate a period of higher inflation to avoid a cascade of bank failures. Because of this speculation, the dollar has lost some of its interest rate advantage.
Another factor has been the cheerful mood in equity markets. The dollar often acts like a safe-haven, so the stunning rally in stocks has diminished demand for the reserve currency. It is probably not a coincidence that the dollar index topped in late September, a couple of weeks before the stock market bottomed.
Upside risks from CPI?
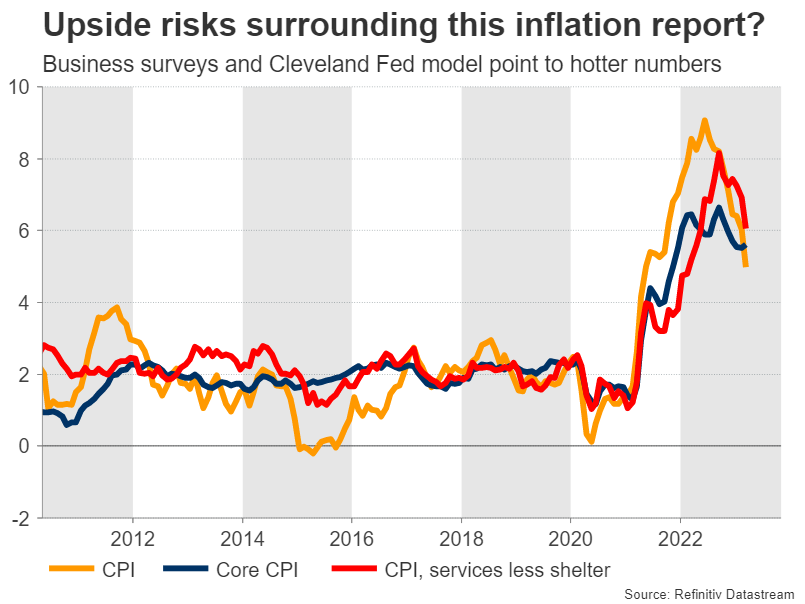
Turning to this week's data releases, the ball will get rolling on Wednesday with the latest CPI inflation report. Forecasts suggest the headline CPI rate remained unchanged at 5.0% in April, while the core rate is expected to have ticked down to 5.5%, from 5.6% previously.
As for any surprises, the risks seem tilted towards a hotter-than-expected report. The S&P Global services PMI showed that companies raised their selling prices at the fastest pace since August, taking advantage of stronger demand. Similarly, the Cleveland Fed Inflation Nowcast model points to a CPI rate of 5.19% in April and a core rate of 5.56%, both higher than official forecasts.
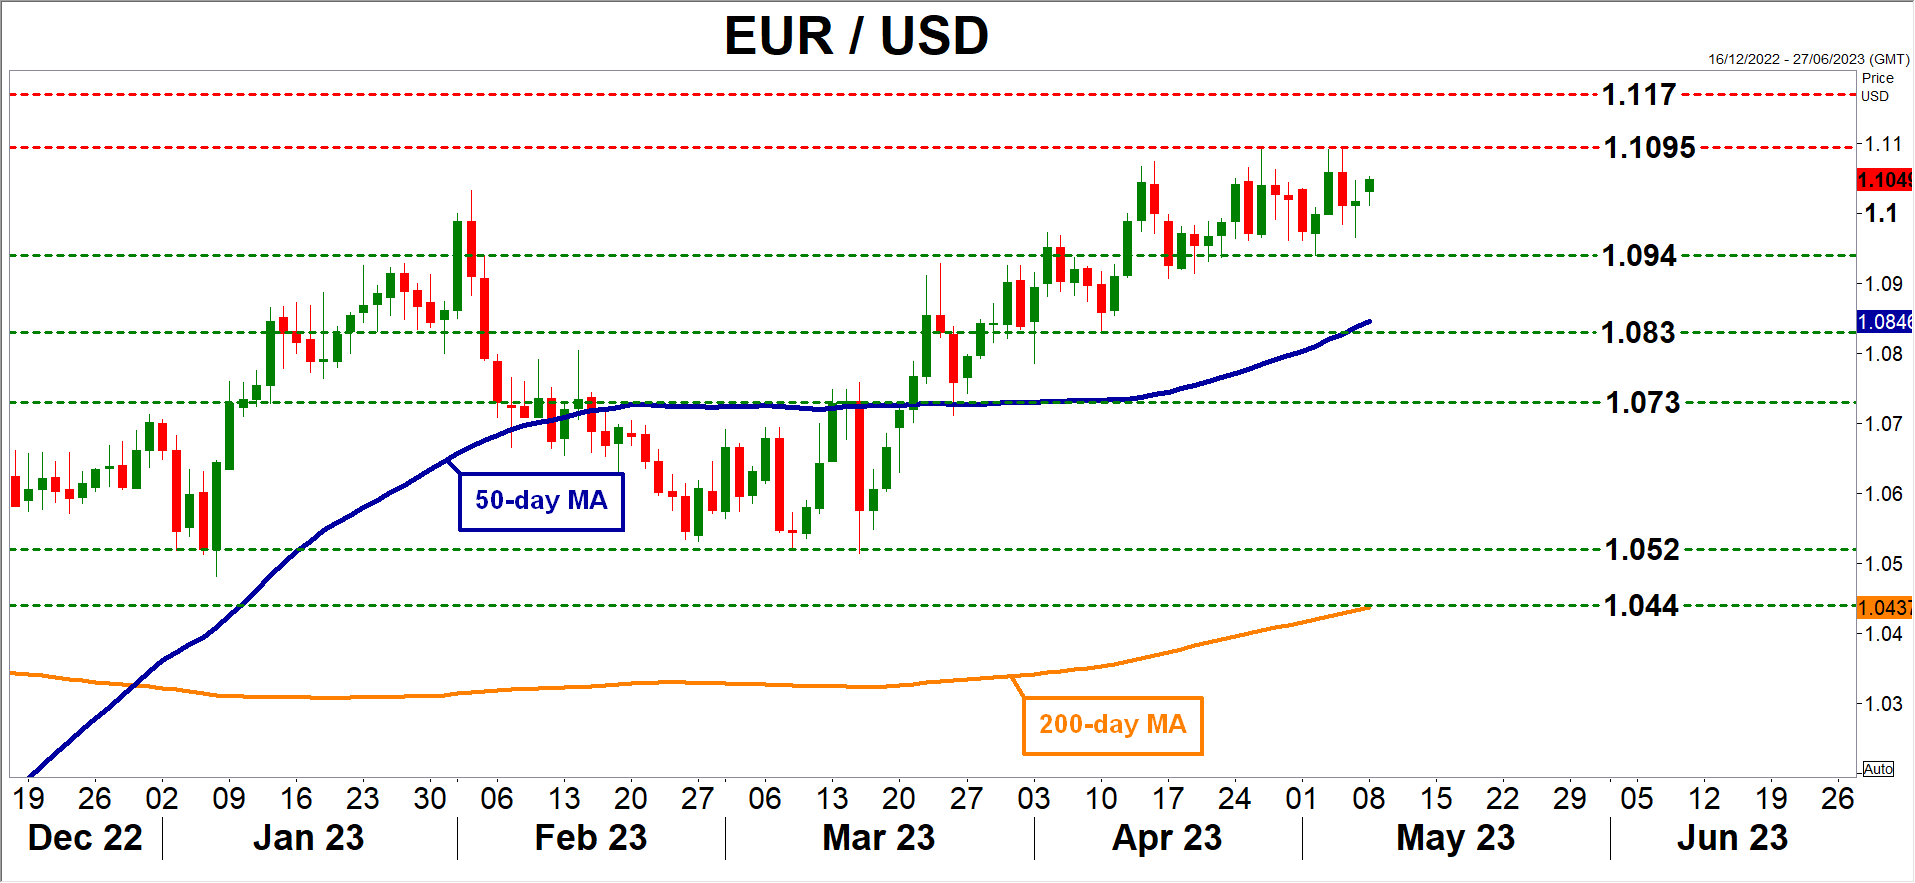
If indeed the report exceeds expectations, investors might unwind some rate cut bets, helping to breathe life back into the dollar. Taking a look at euro/dollar, such an outcome might push the pair lower, with the first obstacle for the bears likely to be the 1.0940 zone.
On the other hand, a surprisingly cold CPI report could propel the pair higher, turning the focus towards the recent highs near 1.1095. Note that data on producer prices will be released on Thursday, ahead of the University of Michigan consumer sentiment report on Friday.
Dollar needs risk aversion to shine
In the big picture, it is doubtful whether even an upside inflation surprise will change the dollar's fortunes. For now, investors seem confident that banking troubles will override inflation concerns at the Fed.
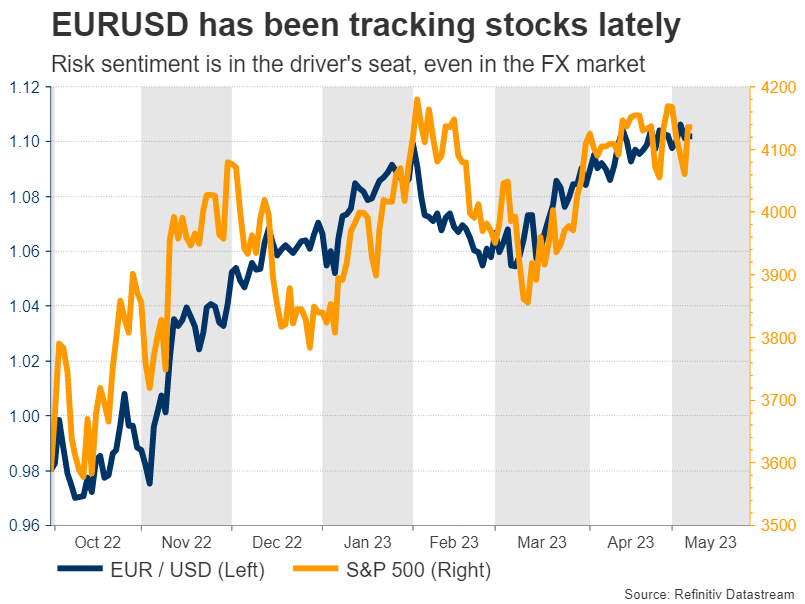
Instead, the dollar's best chance for a sustainable comeback probably lies with risk sentiment. Specifically, a selloff in stock markets could help boost the dollar through the safe-haven channel, considering that pairs like euro/dollar and sterling/dollar have a strong correlation with the S&P 500 this year.
From a chart perspective, the 'line in the sand' in euro/dollar is the 1.1095 level, which rejected a couple of advances recently. If that is violated, it would signal a trend continuation, dashing hopes of an immediate recovery in the dollar.
FTSE 100 Drops 108 Points in 5 Days Despite Strong Pound
If ever there was glaring evidence that the stock of large cap companies which are listed on the London Stock Exchange are completely uninfluenced by the highly liquid currency markets, this week’s FTSE 100 performance is it.
In fact, even a sudden increase in the value of the Pound, Britain’s sovereign currency, has not affected the performance of the basket containing the 100 most prestigious blue-chip companies listed on London’s premier trading venue.
During the past few days, and especially in the advent of the recent coronation of King Charles, the British Pound has been performing very well against its major peer, the US Dollar, rising to its highest point in over a year during the past few days.
The currency in which the 100 well established corporate giants whose stocks make up the FTSE 100 index report their metrics may well be Pounds, but despite the sudden optimism in the British economy, the FTSE 100 has been losing value.
Over the past five days, the FTSE 100 index has dropped by 108 points, resting at 7,765 at 10:00 BST today.
In fact, yesterday during the London trading session, the FTSE 100 dropped as low as 7,702 points, which is its lowest point in more than one month.
The FTSE 100 has languished a bit since the middle of March, when it dropped significantly to 7,335 by March 15, a far cry from the 8,001 points registered on February 20th, which was a euphoric moment for shareholders of British companies and traders alike, as the 8,000-point threshold had been broken.
It was just two years ago when the airwaves were awash with superlatives after the FTSE 100 index broke the 7,000-point mark. To see it go up by another 1,000 points in February 2023 was remarkable to say the least.
For now, those days are gone, and whilst the Pound goes from strength to strength against its transatlantic rival major currency, the British corporations on the FTSE 100 are experiencing a lull.
Some analysts are laying the blame at the door of very generic sets of circumstances such as the potential increase in interest rates that may be implemented by the Bank of England on Thursday this week.
Yes, that would perhaps cause extra costs for corporations which would have to pay more to service their commercial borrowings, but surely that would also affect private individuals, and therefore influence the Pound downwards? The Pound is stronger than it has been for a while, so consumer confidence remains high.
One of the components of the FTSE 100 index is sportswear retailer JD Sports, which is currently a subject of potential acquisition by French giant Groupe Courir for an expected £520 million, however that alone would be unlikely to have this much of a dampening effect on the entire index.
There has been a slight slowdown in the growth of Chinese exports, but that did not stop a healthy trading session take place in the Asia Pacific time zone today, but the strong levels of trading activity did not raise the FTSE 100’s value in the early hours of the London session and later hours of the Asian session.
Perhaps there is some weight behind the conservative approach being assumed in the run up to the Bank of England’s interest rate announcements this Thursday.
WTI Oil: Oil Eases after Steep Recovery on Renewed Demand Concerns
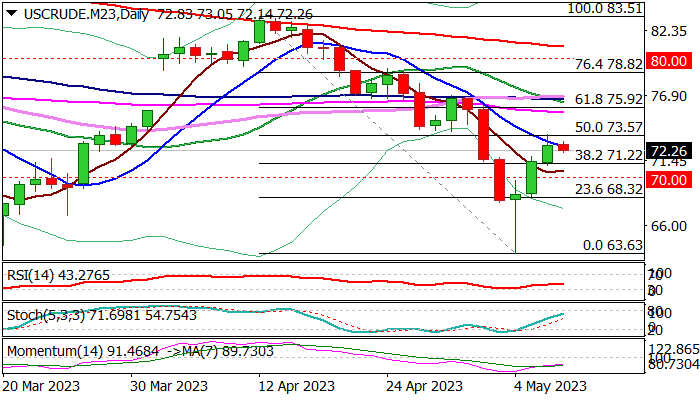
Strong rebound from new lowest since Dec 2021 ($63.63, May 4 low) in past three days is pausing on Tuesday after the action was capped by daily Kijun-sen and 50% retracement of $83.51/$63.63 fall.
Bulls lost traction on weak China’s data, as imports fell much below expectations and exports rose less than previous month, adding weaker economic outlook on concerns that post-Covid recovery may take more time that would sour the demand outlook.
Traders are also focused on US inflation data for April which will be key to the Fed’s next rate decision.
Oil prices could rise further if CPI remains around 5% consensus and core inflation does not ease significantly that would keep the US central bank on track for further tightening despite recent signals that the latest 25 basis points hike would be the last this year.
Technical picture in the daily chart has slightly improved on the latest acceleration higher, but overall picture remains bearish, as negative momentum is still strong and most of moving averages are still above the price.
Also, daily Ichimoku cloud which twists tomorrow and was so far magnetic, is thickening and increasing pressure.
Current easing is still holding within narrowing daily cloud (base lays at $71.96), ahead of Fibo supports at $71.29/22 (23.6% of $63.63/$73.66 upleg/broken Fibo 38.2% of $83.51/$63.63) which should ideally contain and mark a healthy correction ahead of fresh push higher.
Extended dips would face psychological $70 support and a breakpoint, as firm break here would signal an end of recovery phase and shift focus to the downside.
Res: 72.60; 73.66; 74.01; 75.92.
Sup: 71.96; 71.22; 70.00; 69.83.
ECB Kazimir: We will have to keep raising interest rates for longer than anticipated
ECB might need to keep raising interest rates for longer than initially anticipated, according to Governing Council member Peter Kazimir. His comments indicate an evolving stance within ECB as it grapples with stubbornly high inflation in the Eurozone.
"Based on today's data, we will have to keep raising interest rates for longer than anticipated," Kazimir stated. He suggested a slower pace of rate hikes, at 25 basis points increments, as a measured approach that allows for longer-term adjustments, should incoming data warrant it. "So, slowing down the pace to 25 bps is a step that will allow us to go gradually higher for longer, should that be necessary and warranted by incoming data," he explained.
Kazimir pointed to core inflation trends, rising wage pressures, and high-profit margins as factors necessitating vigilance and the continued pursuit of the ECB's current monetary policy trajectory. "The development of core inflation, the continued buildup of wage pressures, and high-profit margins call for vigilance and reconfirm the need to continue on our path," he said.
However, the true effectiveness of the ECB's measures and the trajectory of inflation towards the target will not be fully assessed until the September forecast. "Our September forecast will be the earliest date to answer how effective our measures are and whether inflation is moving towards the target," Kazimir added.
ECB Kazaks asserts need for further rate hikes
In face of high inflation, ECB Governing Council member Martins Kazaks has voiced his belief that further interest rate hikes will be necessary to contain it. His remarks counter market expectations for borrowing costs to be cut as early as next spring, a notion Kazaks has described as "significantly premature."
He outlined a dual strategy to bring the current inflation rate of 7% back to ECB's target of 2%. "The first is raising the rates and of course we don't know where the terminal rate is," he commented. "Another thing is keeping those rates at elevated and sufficiently restrictive levels."
Despite concerns about potential economic risks from higher interest rates, Kazaks emphasized that the risk of doing too little to counter inflation was far greater than the risk of over-tightening. "Persistently high inflation is a bigger problem for society than a relatively short and shallow recession," he warned.
Underlining the importance of effective policy response, Kazaks cautioned, "Failing to contain inflation would be a failure because then the policy response in the second go would then need to be much tighter."
GBPUSD Storms to a Fresh 11-Month High
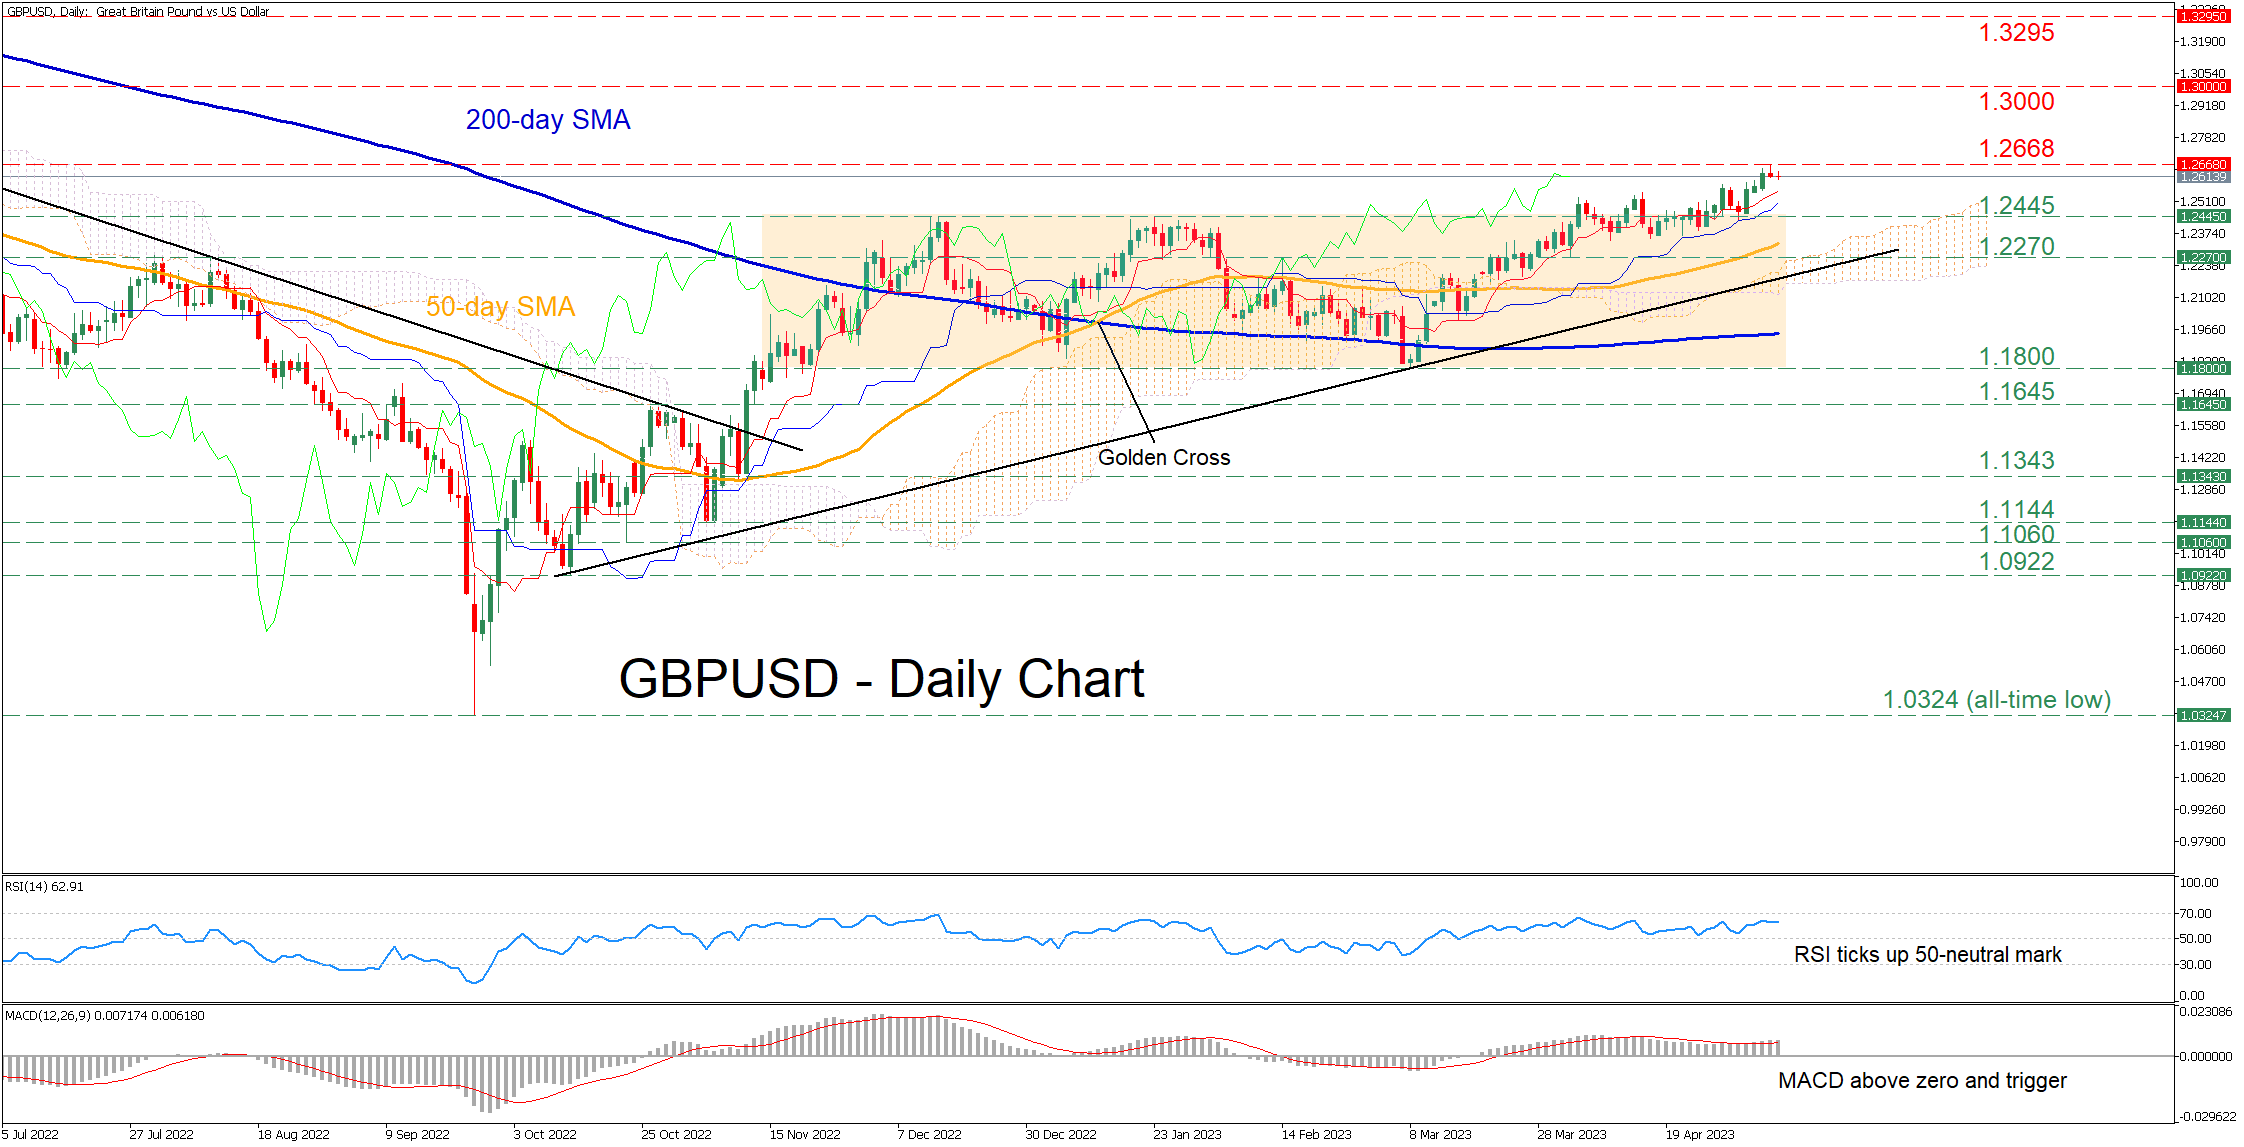
GBPUSD has been in a steady uptrend and recently managed to escape its rectangle pattern, which was in place since November 2022. In the previous daily session, the pair generated a fresh 11-month high of 1.2668 before paring some gains.
The momentum indicators currently suggest that near-term risks are tilted to the upside. Specifically, the RSI has flatlined above its 50-neutral mark, while the MACD histogram is strengthening above both zero and its red signal line.
If bullish pressures intensify, the price could attempt to post a fresh higher high, surpassing the 1.2668 region. Violating that zone, the pair could ascend towards levels not seen in the past year, where the 1.3000 psychological mark could prove to be a tough obstacle for the bulls to overcome. Further advances might then come to a halt at the March 2022 peak of 1.3295.
Alternatively, should the pair experience a pullback, the previous resistance of 1.2445 could serve as initial support. If that floor collapses, the spotlight could turn to 1.2270 before the March low of 1.1800 appears on the radar. Even lower, the 1.1645 hurdle might provide downside protection.
In brief, GBPUSD has been edging higher in the short-term, creating a structure of higher highs and higher lows. However, traders should not rule out a temporary downside correction before the uptrend extends higher.
EURJPY Pauses Bullish Action; Support at 20-SMA
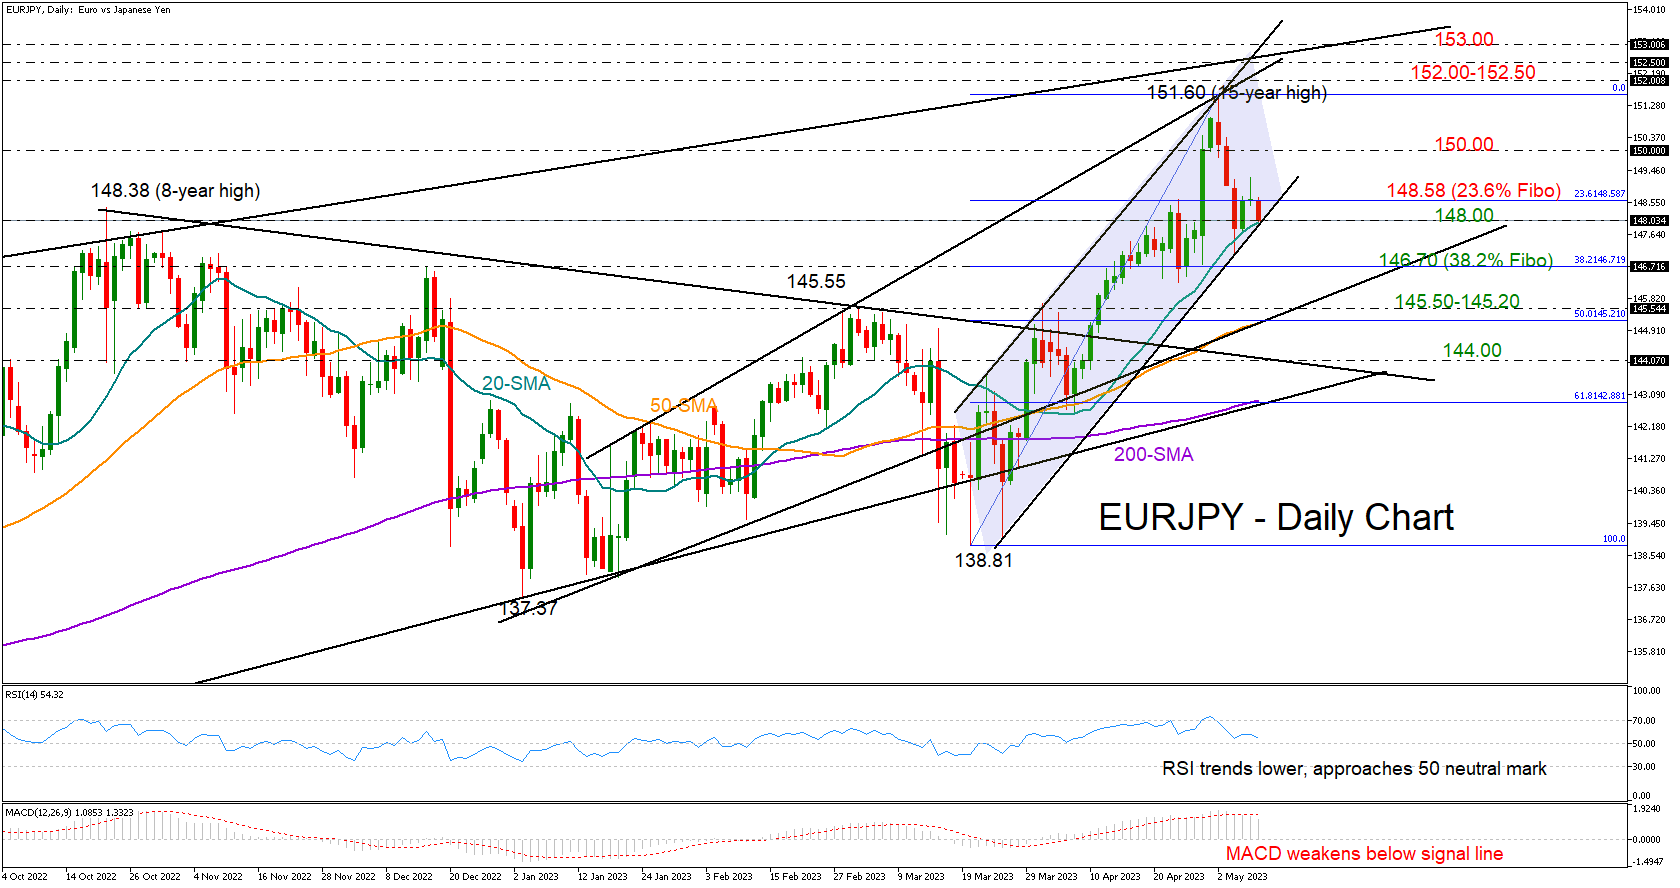
EURJPY pivoted higher after its three-day downfall from the 15-year high of 151.60 paused near the 20-day simple moving average (SMA) at 147.78.
The recovery mode, however, stalled immediately on Monday as the bulls could not preserve strength above the 23.6% Fibonacci retracement of the 138.81-151.60 upleg at 148.58 despite rising as high as 149.25.
With the RSI marking new lower lows in the bullish area, and the MACD easing below its red signal line, the odds are in favor of the bears. Yet only an extension below the upward-sloping channel and the 20-day SMA at 148.00 could activate fresh selling towards the 38.2% Fibonacci of 146.70. Another step lower could press the price aggressively towards the 145.55-145.20 constraining zone formed by the ascending line from January 18 and the 50% Fibonacci of 145.20. A steeper decline could take a halt near the broken resistance trendline from October 2022 at 144.00.
Alternatively, the price may attempt to cross back above the 148.58 border. If efforts prove successful this time, the spotlight will shift to the 150.00 psychological mark and then to the 151.60 top. The resistance line, which blocked the latest rally in the market, could next come into view around 152.00, while slightly higher, the long-term ascending line from August 2020 may attract greater attention near somewhere between 152.50 and 153.00.
In brief, although EURJPY is facing discouraging technical signals at the moment, it may escape a bearish phase if the 20-day SMA sustains a strong footing under the price.
Nikkei 225: Bulls Showing Signs of Resilience
- Japanese stock market has continued to outperform against the rest of the world.
- Positive earnings momentum from Japanese corporations is providing support.
- BoJ Governor Ueda has sounded optimistic about the current upward inflationary trend in Japan.
The Japanese stock market has continued to show resilience despite the current heightened risk of global stagflation and rising geopolitical tensions. The benchmark Nikkei 225 and MSCI Japan have recorded a month-to-date return of +1.30% and +0.95% for May respectively at this time of the writing outperformed the US S&P 500 (-0.75%), MSCI Asia Ex Japan (+0.57%), MSCI Emerging Markets (+0.72%) and STOXX Europe 600 (+0.06%).
Strategic and tactical reasons that explained the potential outperformance of the Japanese stock market against the rest of the world have been highlighted in our previous article.
Earnings momentum is supporting several TOPIX-17 Sectors
In today’s Asian session, the Nikkei 255 has added a further intraday rally of +1.00% on the backdrop of upbeat and better-than-expected corporate earnings of steelmakers and shipping companies which has reinforced the 3-month rolling outperformance of the TOPIX Steel & Non-Ferrous Sector (+12.30%) and Transportations & Logistic Sector (+10.64%) that enable these sectors to rank 3rd and 6th positions among the 17 TOPIX sectors.
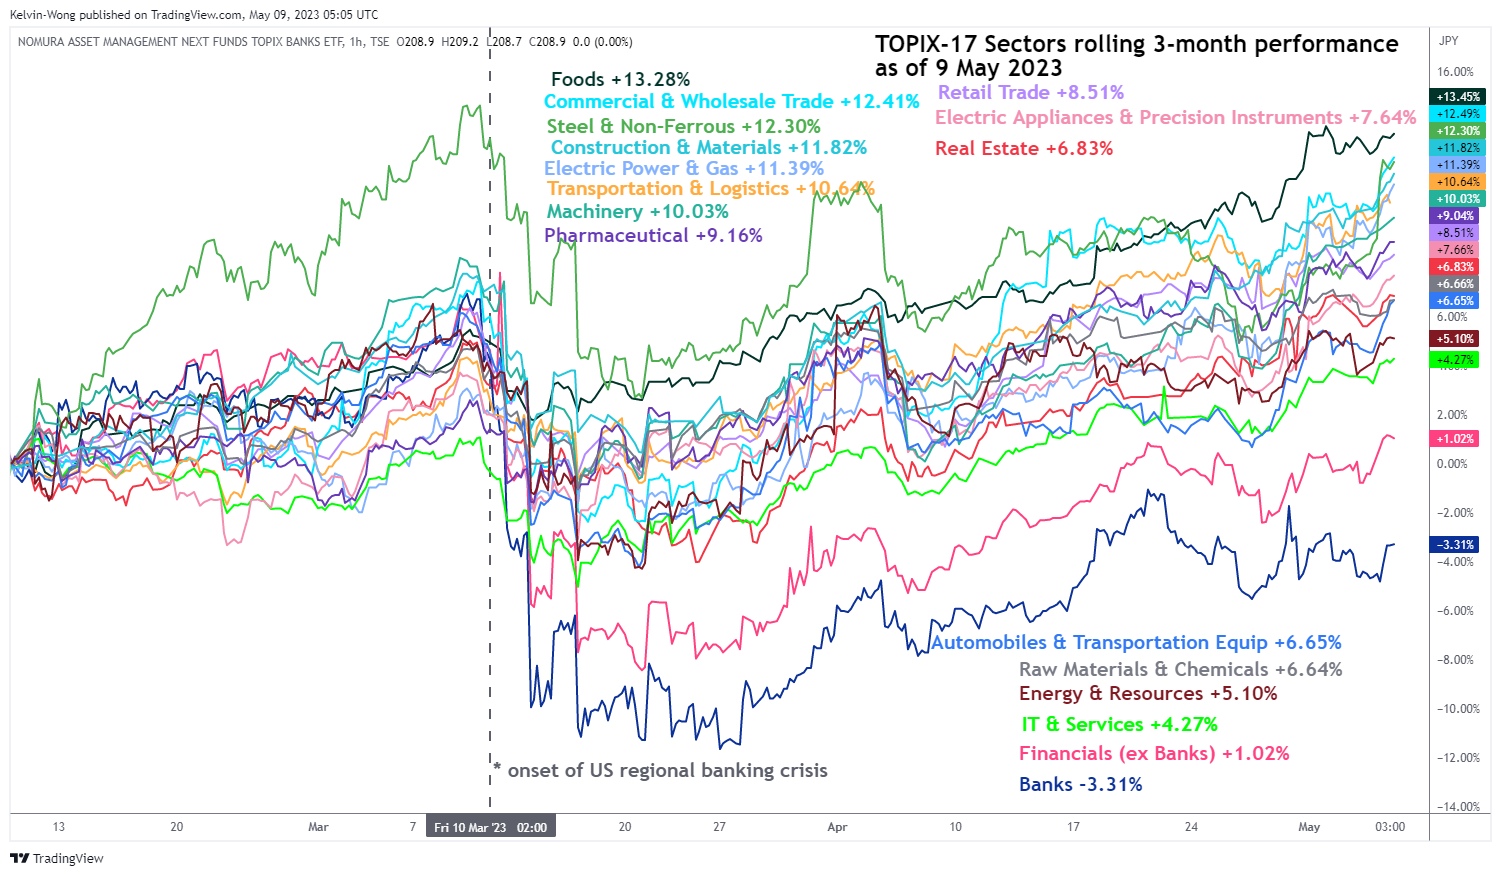
Fig 1: TOPIX-17 Sectors 3-month rolling performances as of 9 May 2023 (Source: TradingView, click to enlarge chart)
Also, the finalized April reading of the Jibun Bank Japan Services PMI has been revised up to a record high of 55.4 from its preliminary print of 55.0; it also marked the 8th consecutive month of expansion in the services sector with new orders growing the most in over 15 years amid greater spending on travel, leisure, and tourism. These latest data observations suggest that Japan’s domestic internal economic growth is showing potential signs of sustainable recovery.
Expansion in Japan’s Services PMI is moving in tandem with inflation
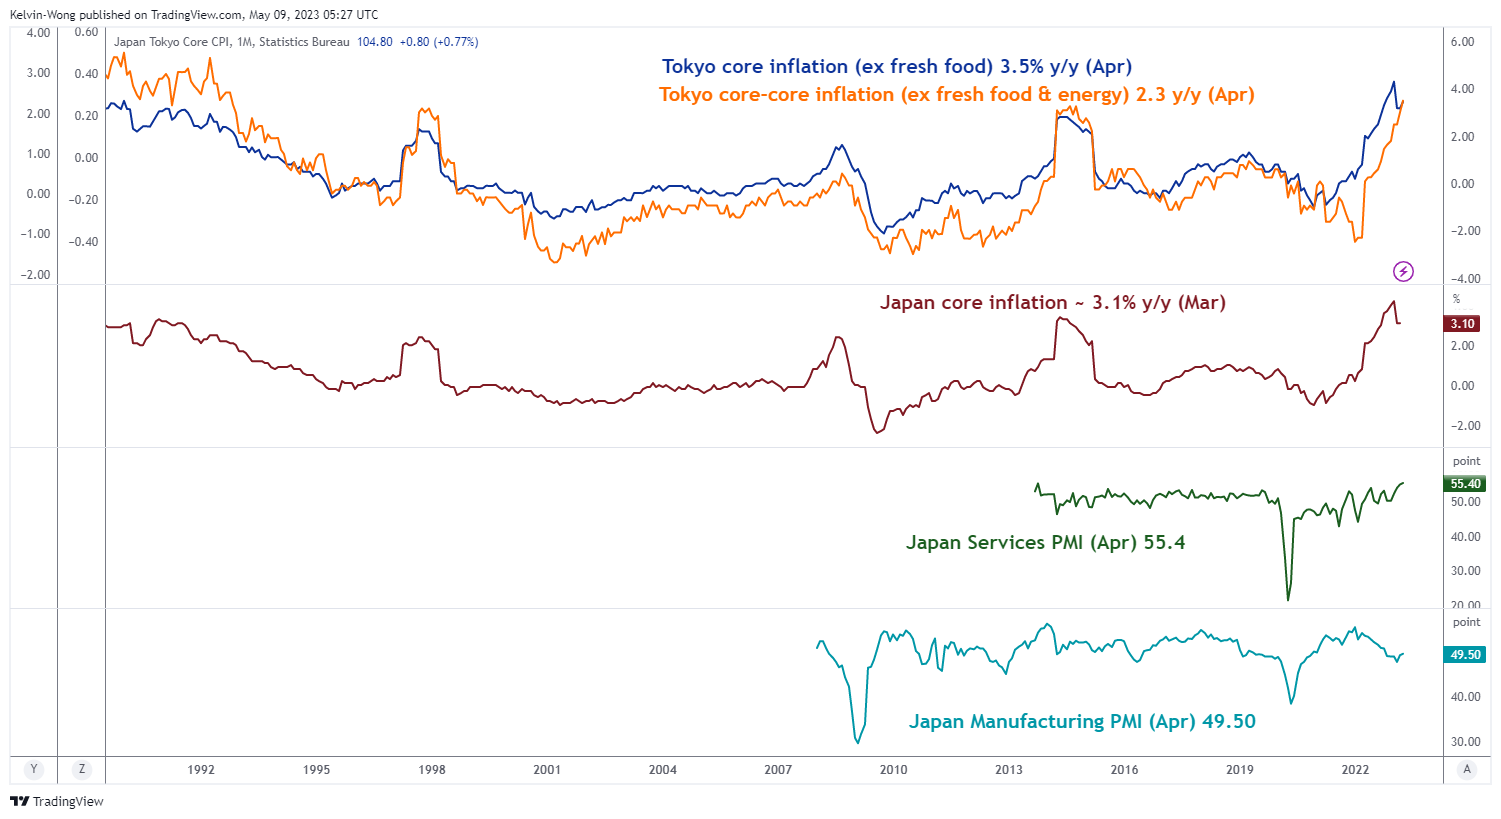
Fig 2: Japan inflation, manufacturing & services PMIs as of Mar & Apr 2023 (Source: TradingView, click to enlarge chart)
Also, the rise in the services sectors’ activities has coincided closely with the leading Tokyo inflationary data (core & core-core) that has continued to grow and surpassed the Bank of Japan (BoJ)’s 2% inflation target for the 11th consecutive month. Thus, the urgency of the BoJ to normalize its current ultra-easy monetary policy stance has quickened its “pressure” which in turn may lead to further anticipation of Japanese corporate investors’ overseas capital flow back to the domestic Japanese financial markets in the search for better yields on a hedged currency basis.
BoJ’s Ueda sounded “optimistic” about the current trend of Japan’s inflation
BoJ Governor Ueda made an upbeat parliamentary speech on the prospects of Japan’s inflation situation earlier today.
He has mentioned that Japan’s economic growth has picked up and inflationary expectations remain at high levels, seeing some positive signs of an inflation trend that implied the current pace of inflationary growth is sustainable.
Added that BoJ will end its 10-year Japanese Government Bond (JGB) yield curve control programme and start to shrink its balance once the 2% inflation target has been met in a sustainable and stable manner.
However, Ueda highlighted several uncertainties in growth such as whether the recent surge in wage growth can be sustained and spread to smaller and medium-sized corporations.
Overall, BoJ Ueda’s latest speech which came on the latest backdrop of positive macro data and earnings releases for Japanese corporates seems to be skewed toward an increase in optimism that Japan may soon emerge from its decade-plus long deflationary spiral and increase the prospects of bringing forward the normalization of BoJ’s current ultra-easy monetary policy.
Hence, it may create a positive feedback loop back into the Japanese stock market at least in the short to medium term. Next up, we will have the earnings results from the two heavyweights; Toyota Motor Corp on Wednesday and SoftBank Corp on Thursday to provide further clues on whether Japan’s current positive earnings momentum can be maintained.
Japan 225 Technical Analysis – Short-term uptrend intact
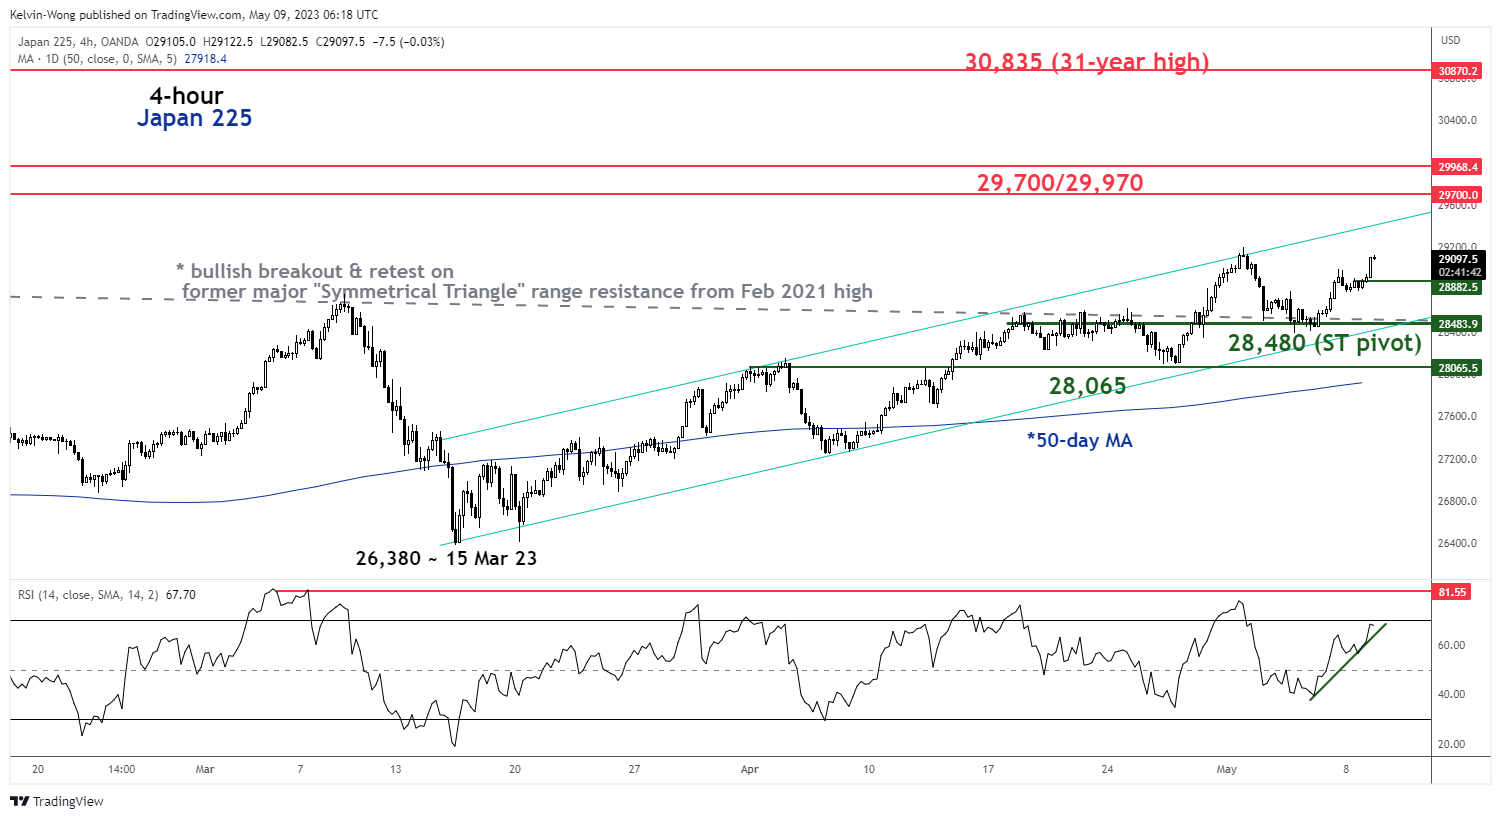
Fig 3: Japan 225 trend as of 9 May 2023 (Source: TradingView, click to enlarge chart)
The Japan 225 Index (a proxy for the Nikkei 225 futures) has staged the expected bullish breakout from its major “Symmetrical Triangle” range resistance in place since 14 September 2021 as highlighted in our previous article.
Interestingly, the price actions of the Index have managed to retest the former “Symmetrical Triangle” range resistance now turns pull-back support at 28,480 on 3 May 2023 and staged a rebound thereafter.
Current price actions have evolved into a short-term ascending channel in place since its 15 March 2023 low of 26,380. In addition, the 4-hour RSI oscillator has continued to exhibit upside momentum and has not yet reached a prior extreme overbought level of 81.55%.
The next resistance to watch in the short-term will be at 29,700/29.970 (the upper boundary of the short-term ascending channel, swing high areas of 4 Nov/16 Nov 2021 & a cluster of Fibonacci extension levels)
However, a break below the 28,480 key short-term pivotal support may jeopardize the bullish tone to expose the next support coming in at 28,065 which also confluences closely with the upward-sloping 50-day moving average.
EUR/USD: A Completed Skewed Triangle Gives a Signal of Further Growth
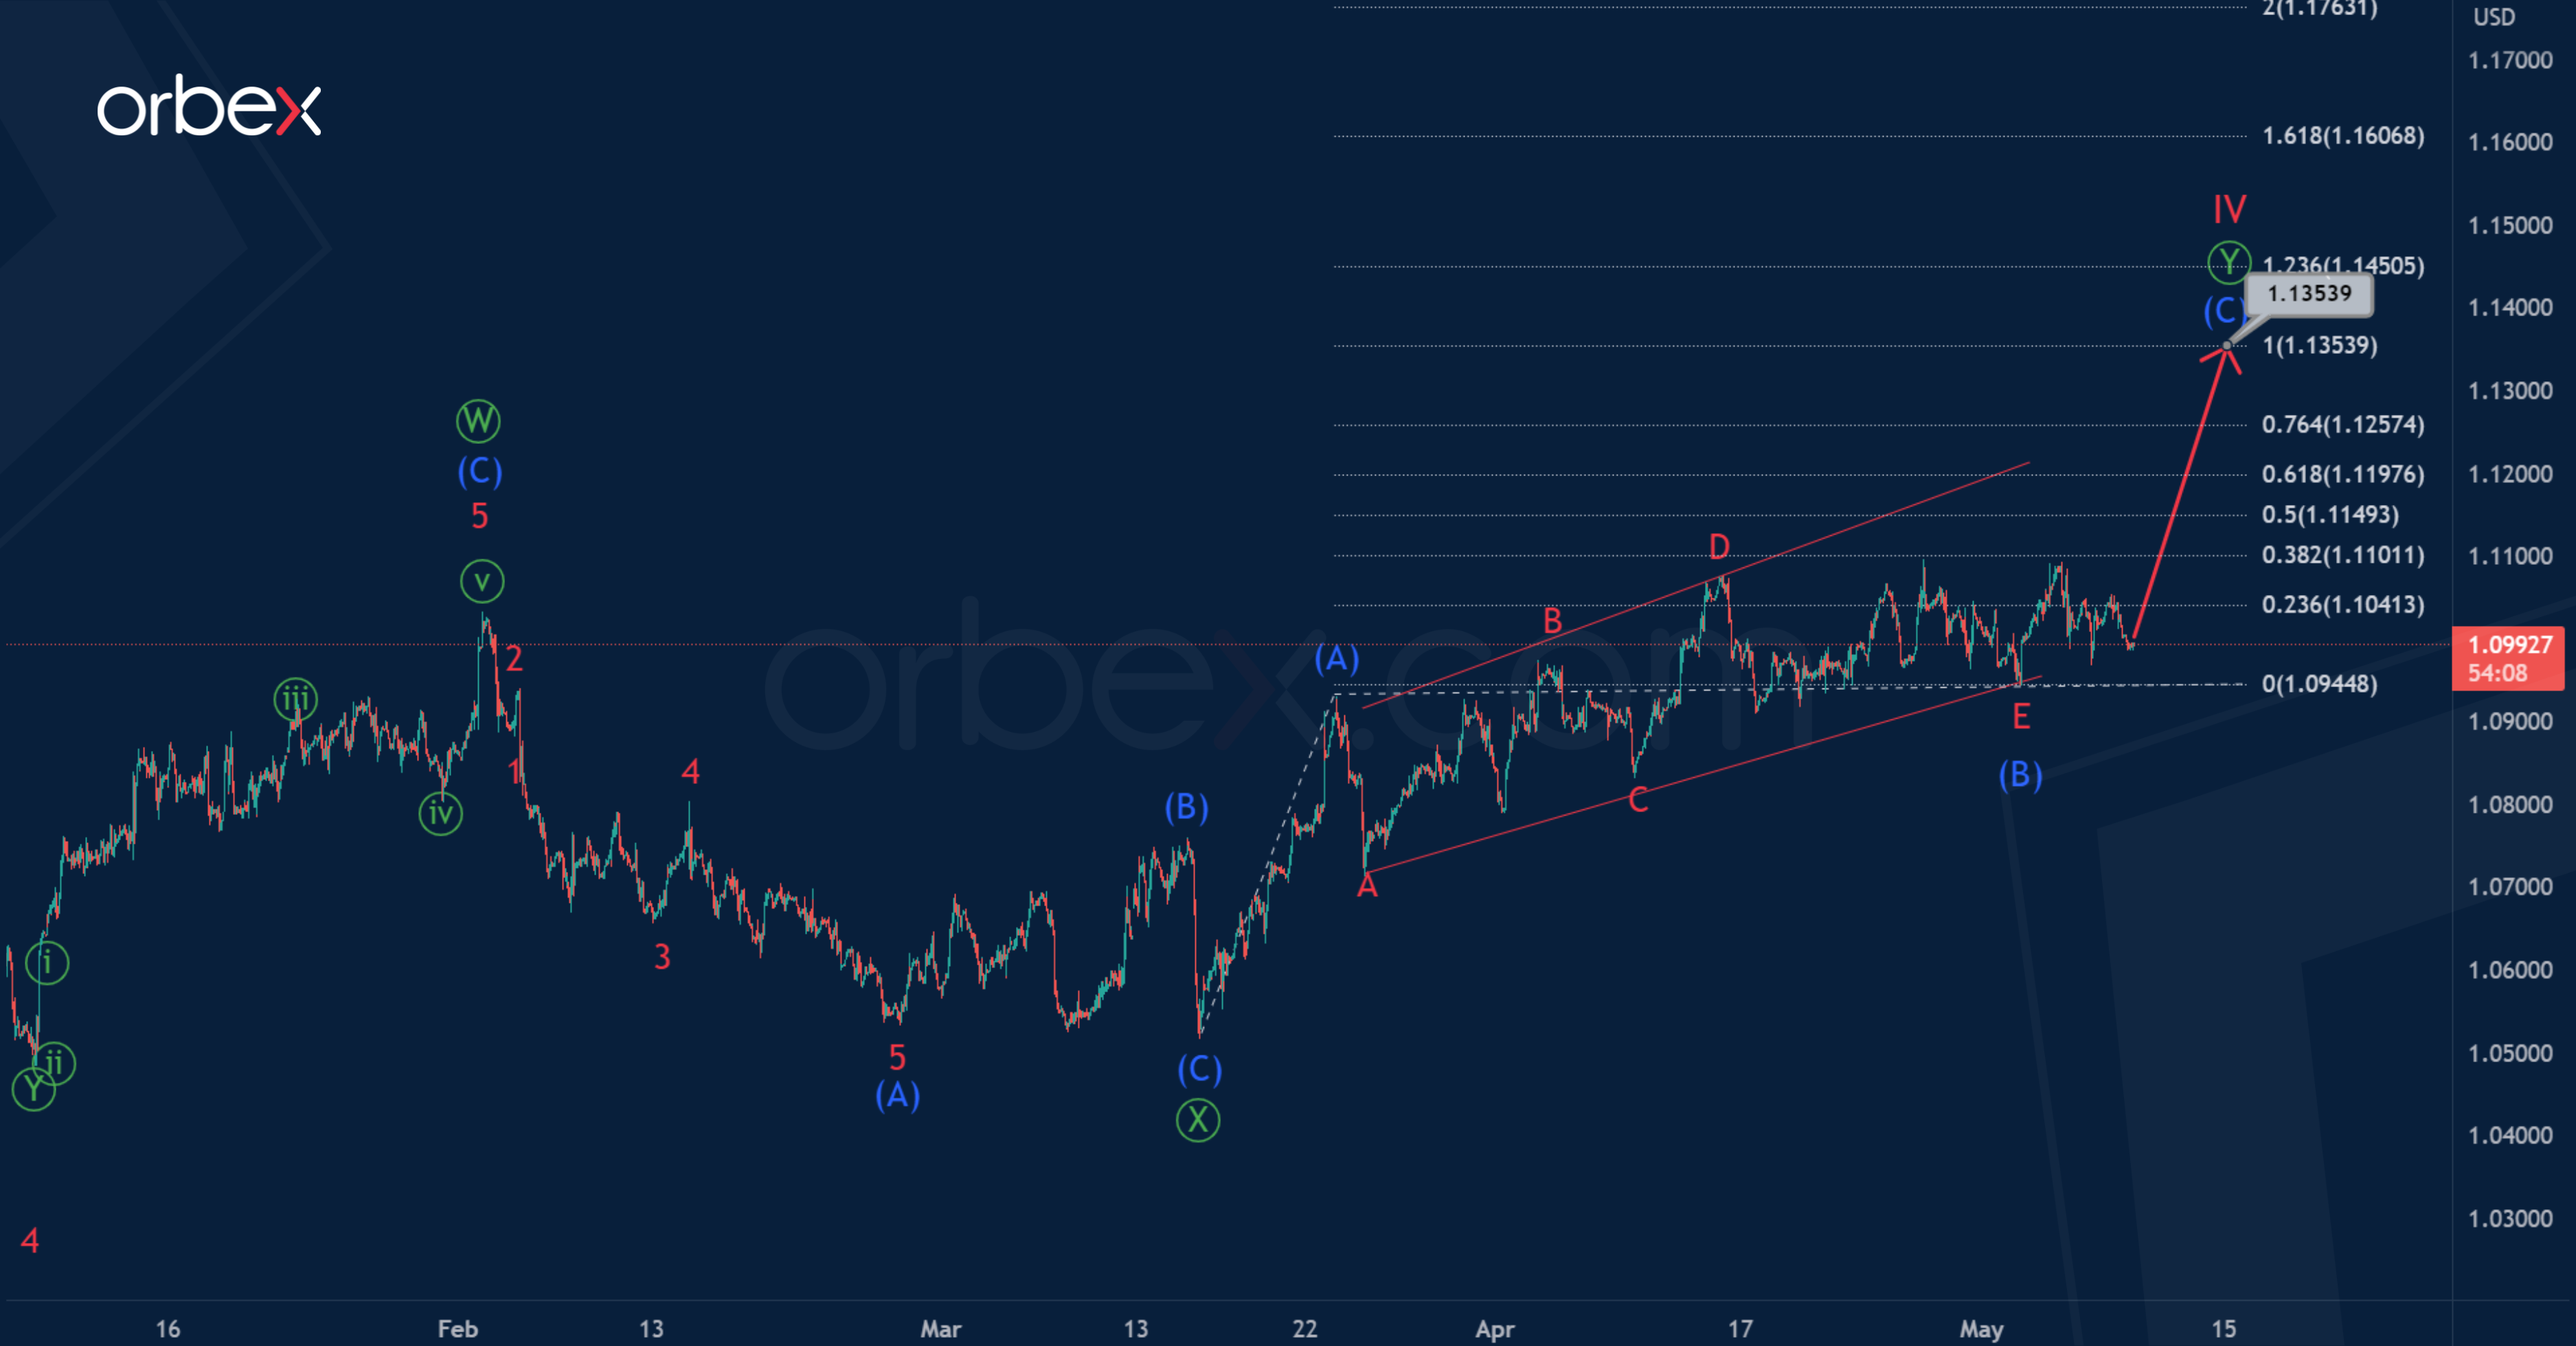
For the EURUSD pair, in the long term, we can observe the formation of a correction wave IV inside a large impulse. Cycle correction IV, most likely, takes the form of a primary double zigzag.
The actionary leg and the bearish corrective intervening wave are completed. The final actionary wave may be under development.
Like the previous primary waves, can take the form of an intermediate zigzag (A)-(B)- (C). The first impulse (A) and correction (B) in the form of a skewed triangle are fully completed. In the near future, we expect growth in the potential impulse (C) to 1.135. At that level, this impulse will be equal to wave (A).
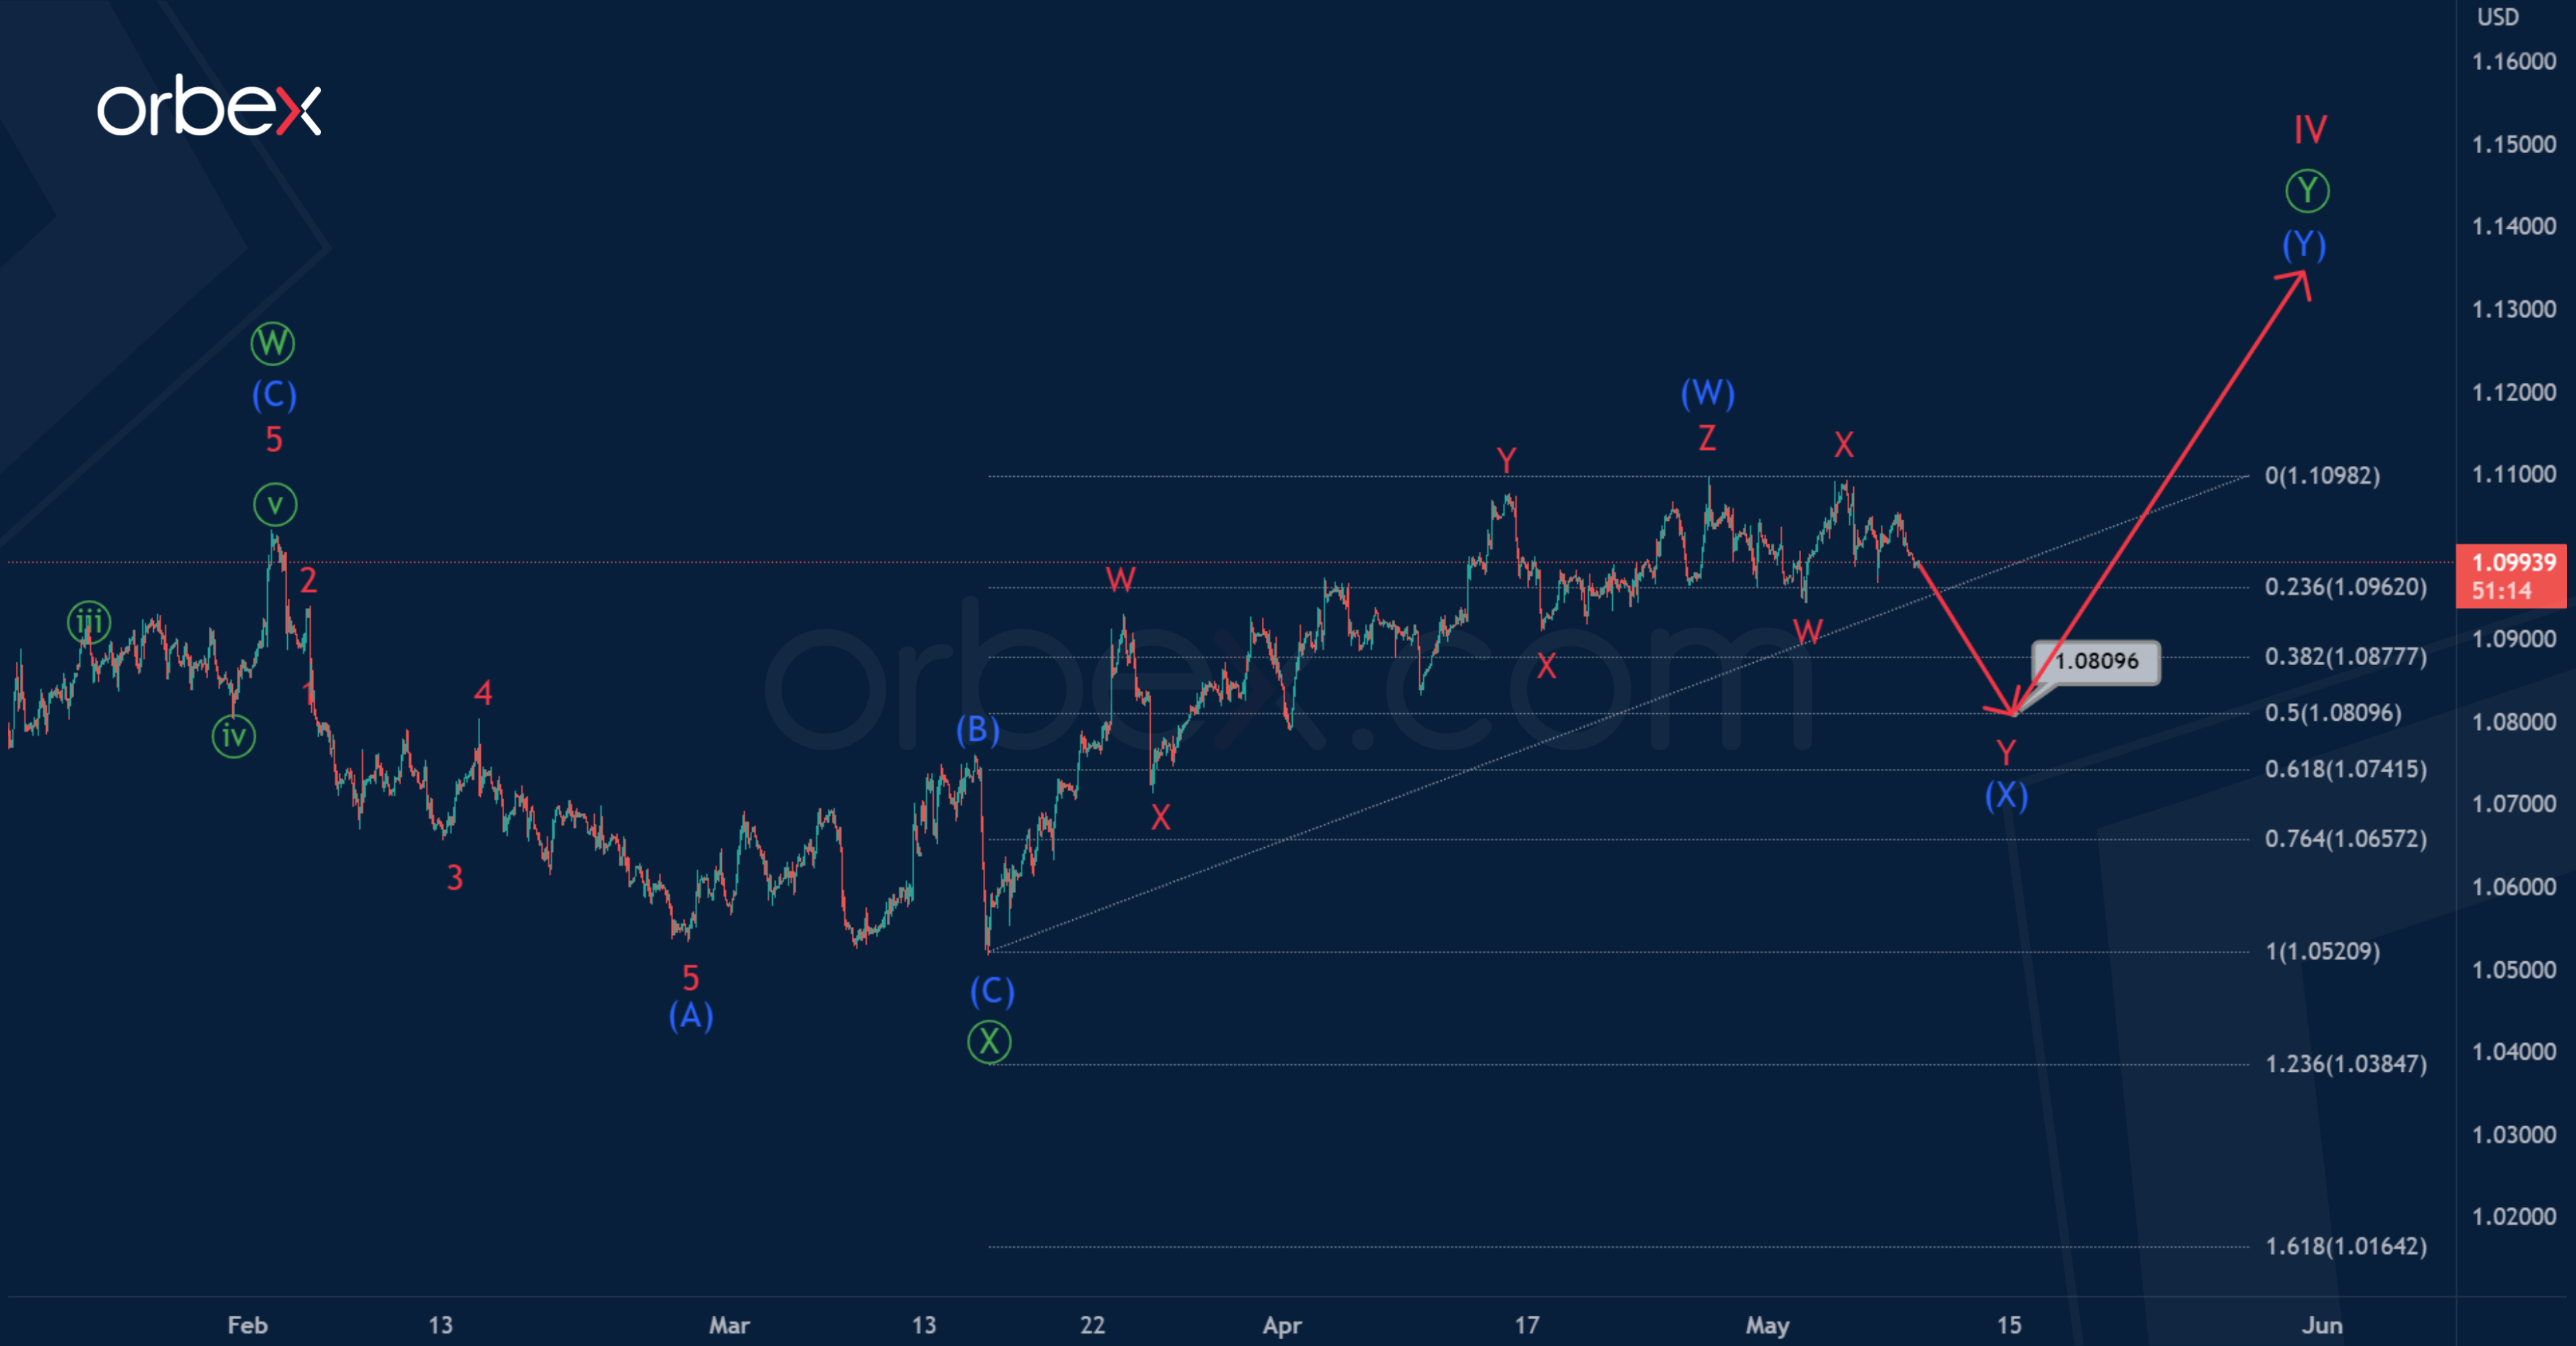
An alternative scenario suggests that the primary wave is not a simple zigzag, but a double one. It is marked with sub-waves (W)-(X)-(Y).
The intermediate wave (W) looks like a completed triple zigzag. Currently, an intermediate wave (X) may be in the process of construction, which may take the form of a minor double zigzag W-X-Y.
In the near future, the price may go down to 1.080. At that level, wave (X) will be at 50% along the Fibonacci lines of wave (W).
USD Recoups Some Losses
USD/CHF tries to hold its ground
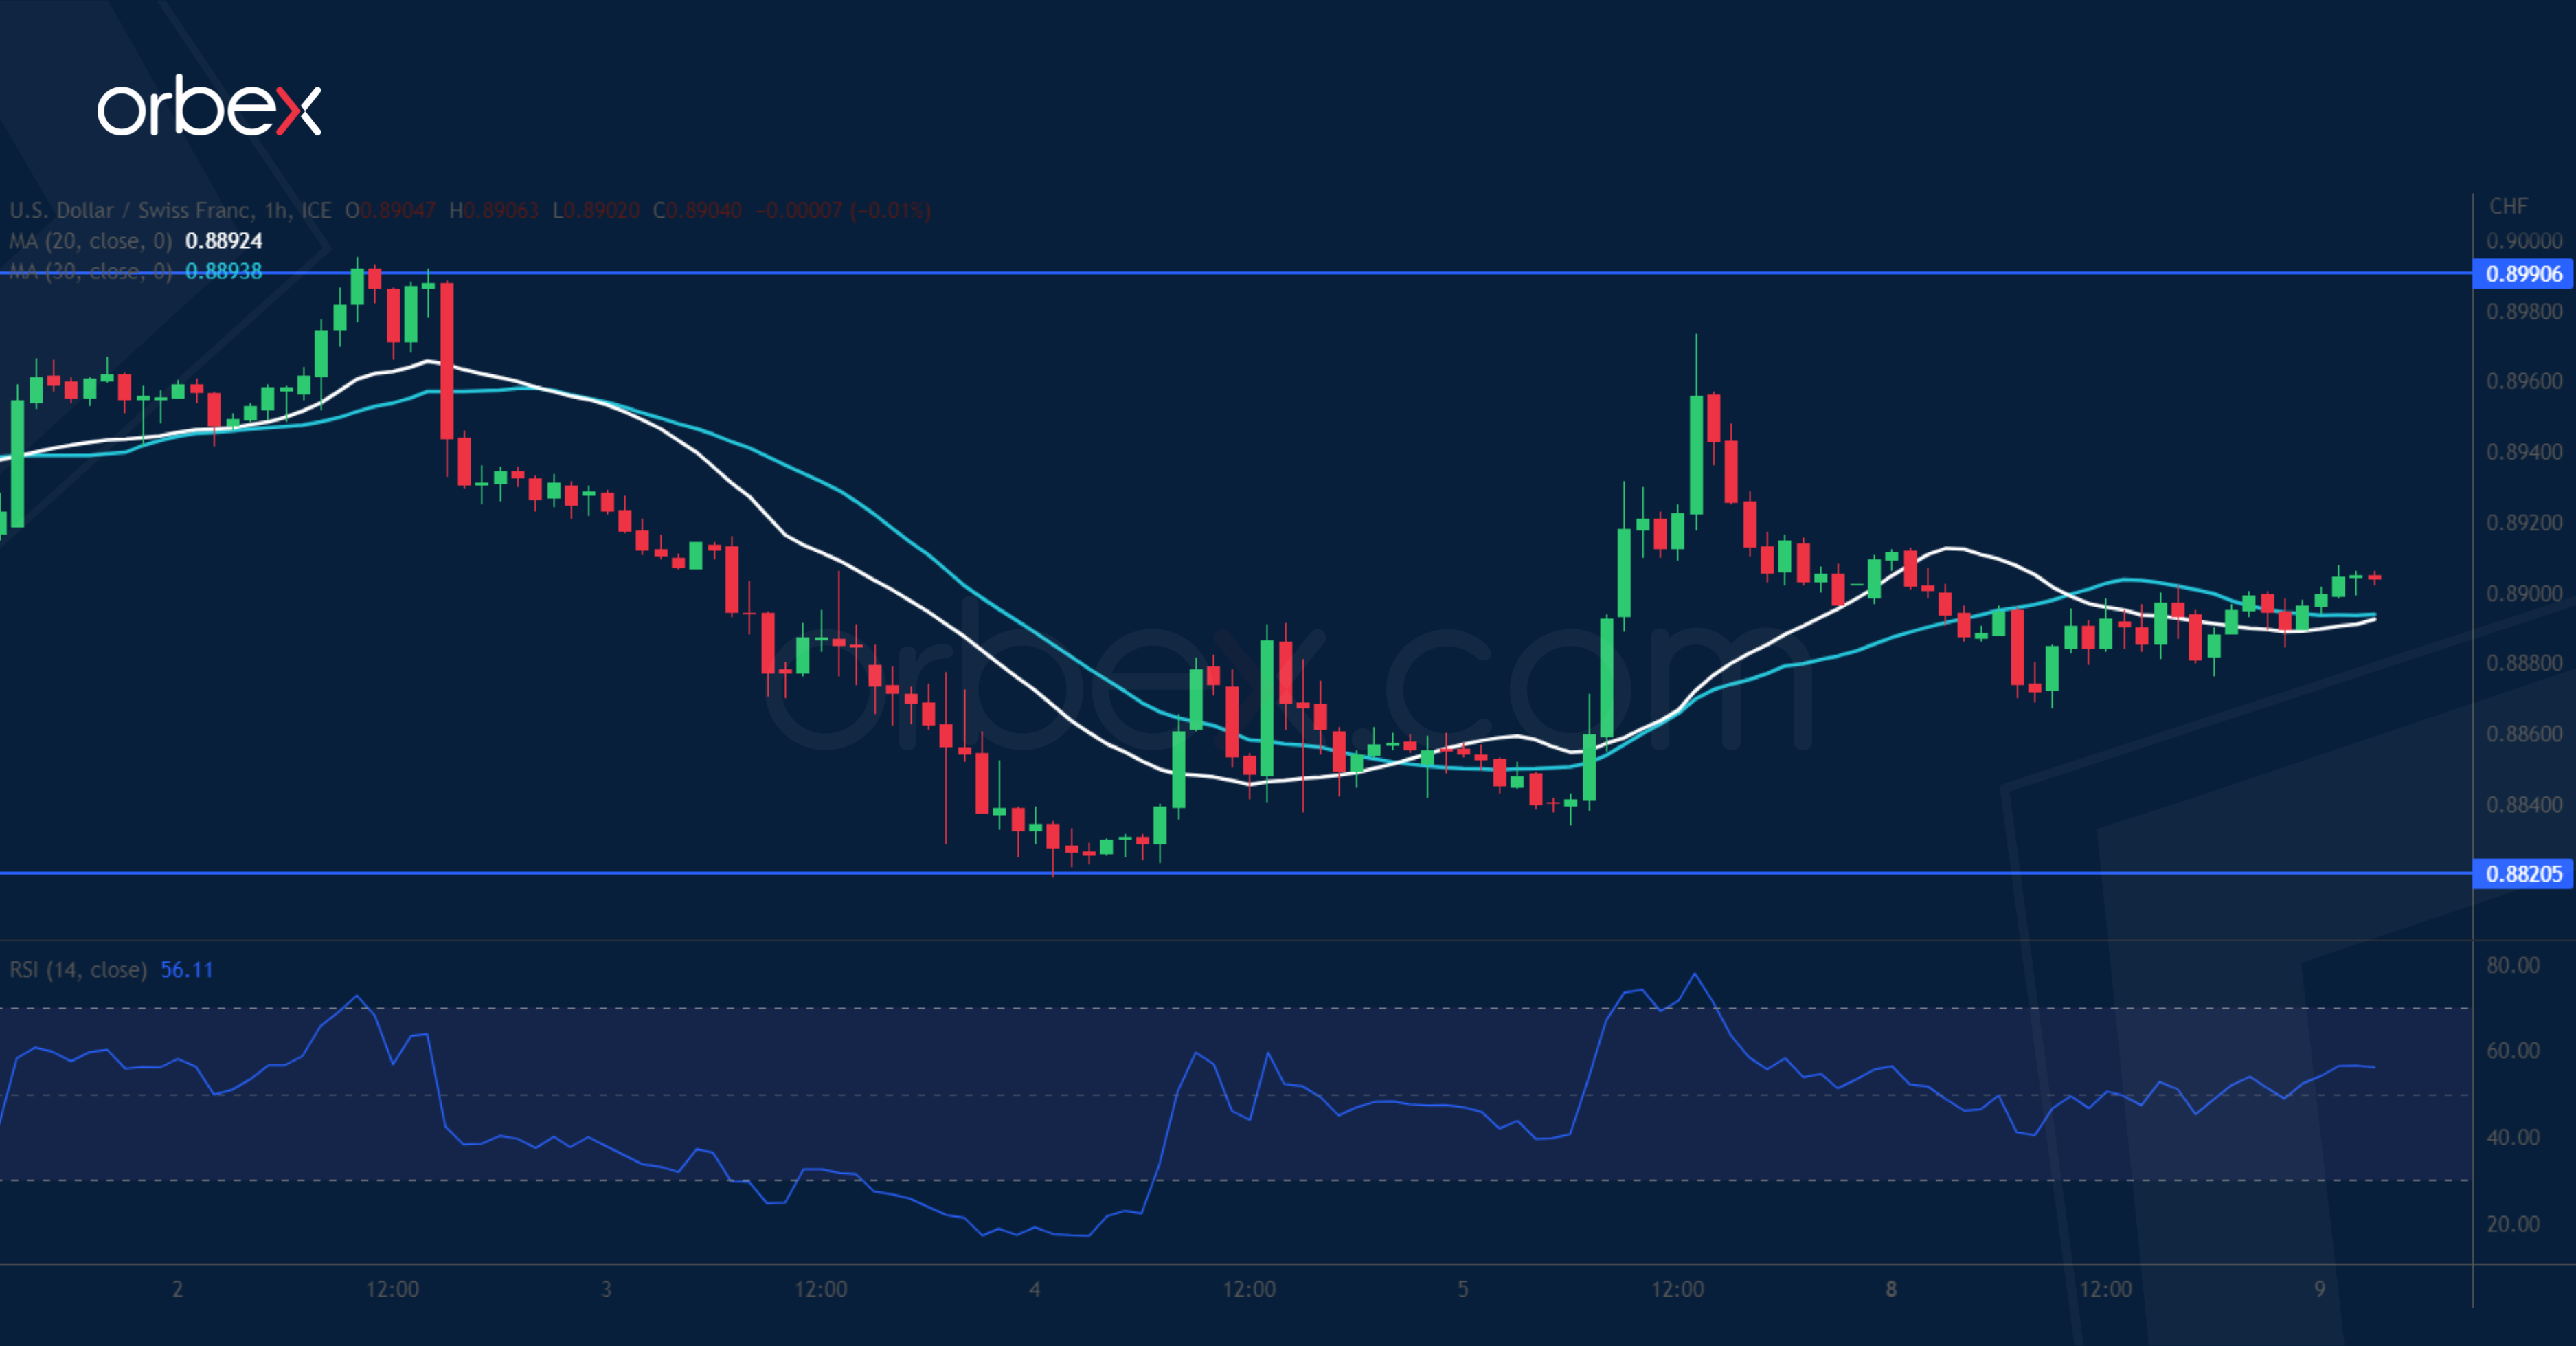
The US dollar steadies as traders await US inflation data in April. Latest rebounds have so far met stiff selling pressure with new swing lows encouraging the bears to add onto their short positions. 0.8990 is a fresh supply zone where offers have kept the greenback in check. A bullish close would break the downward momentum and help the pair start to build a base near its 28-month lows. 0.8820 is the immediate support and its breach would force bargain hunters out and send the price to January 2021’s low of 0.8760.
EUR/GBP drifts lower
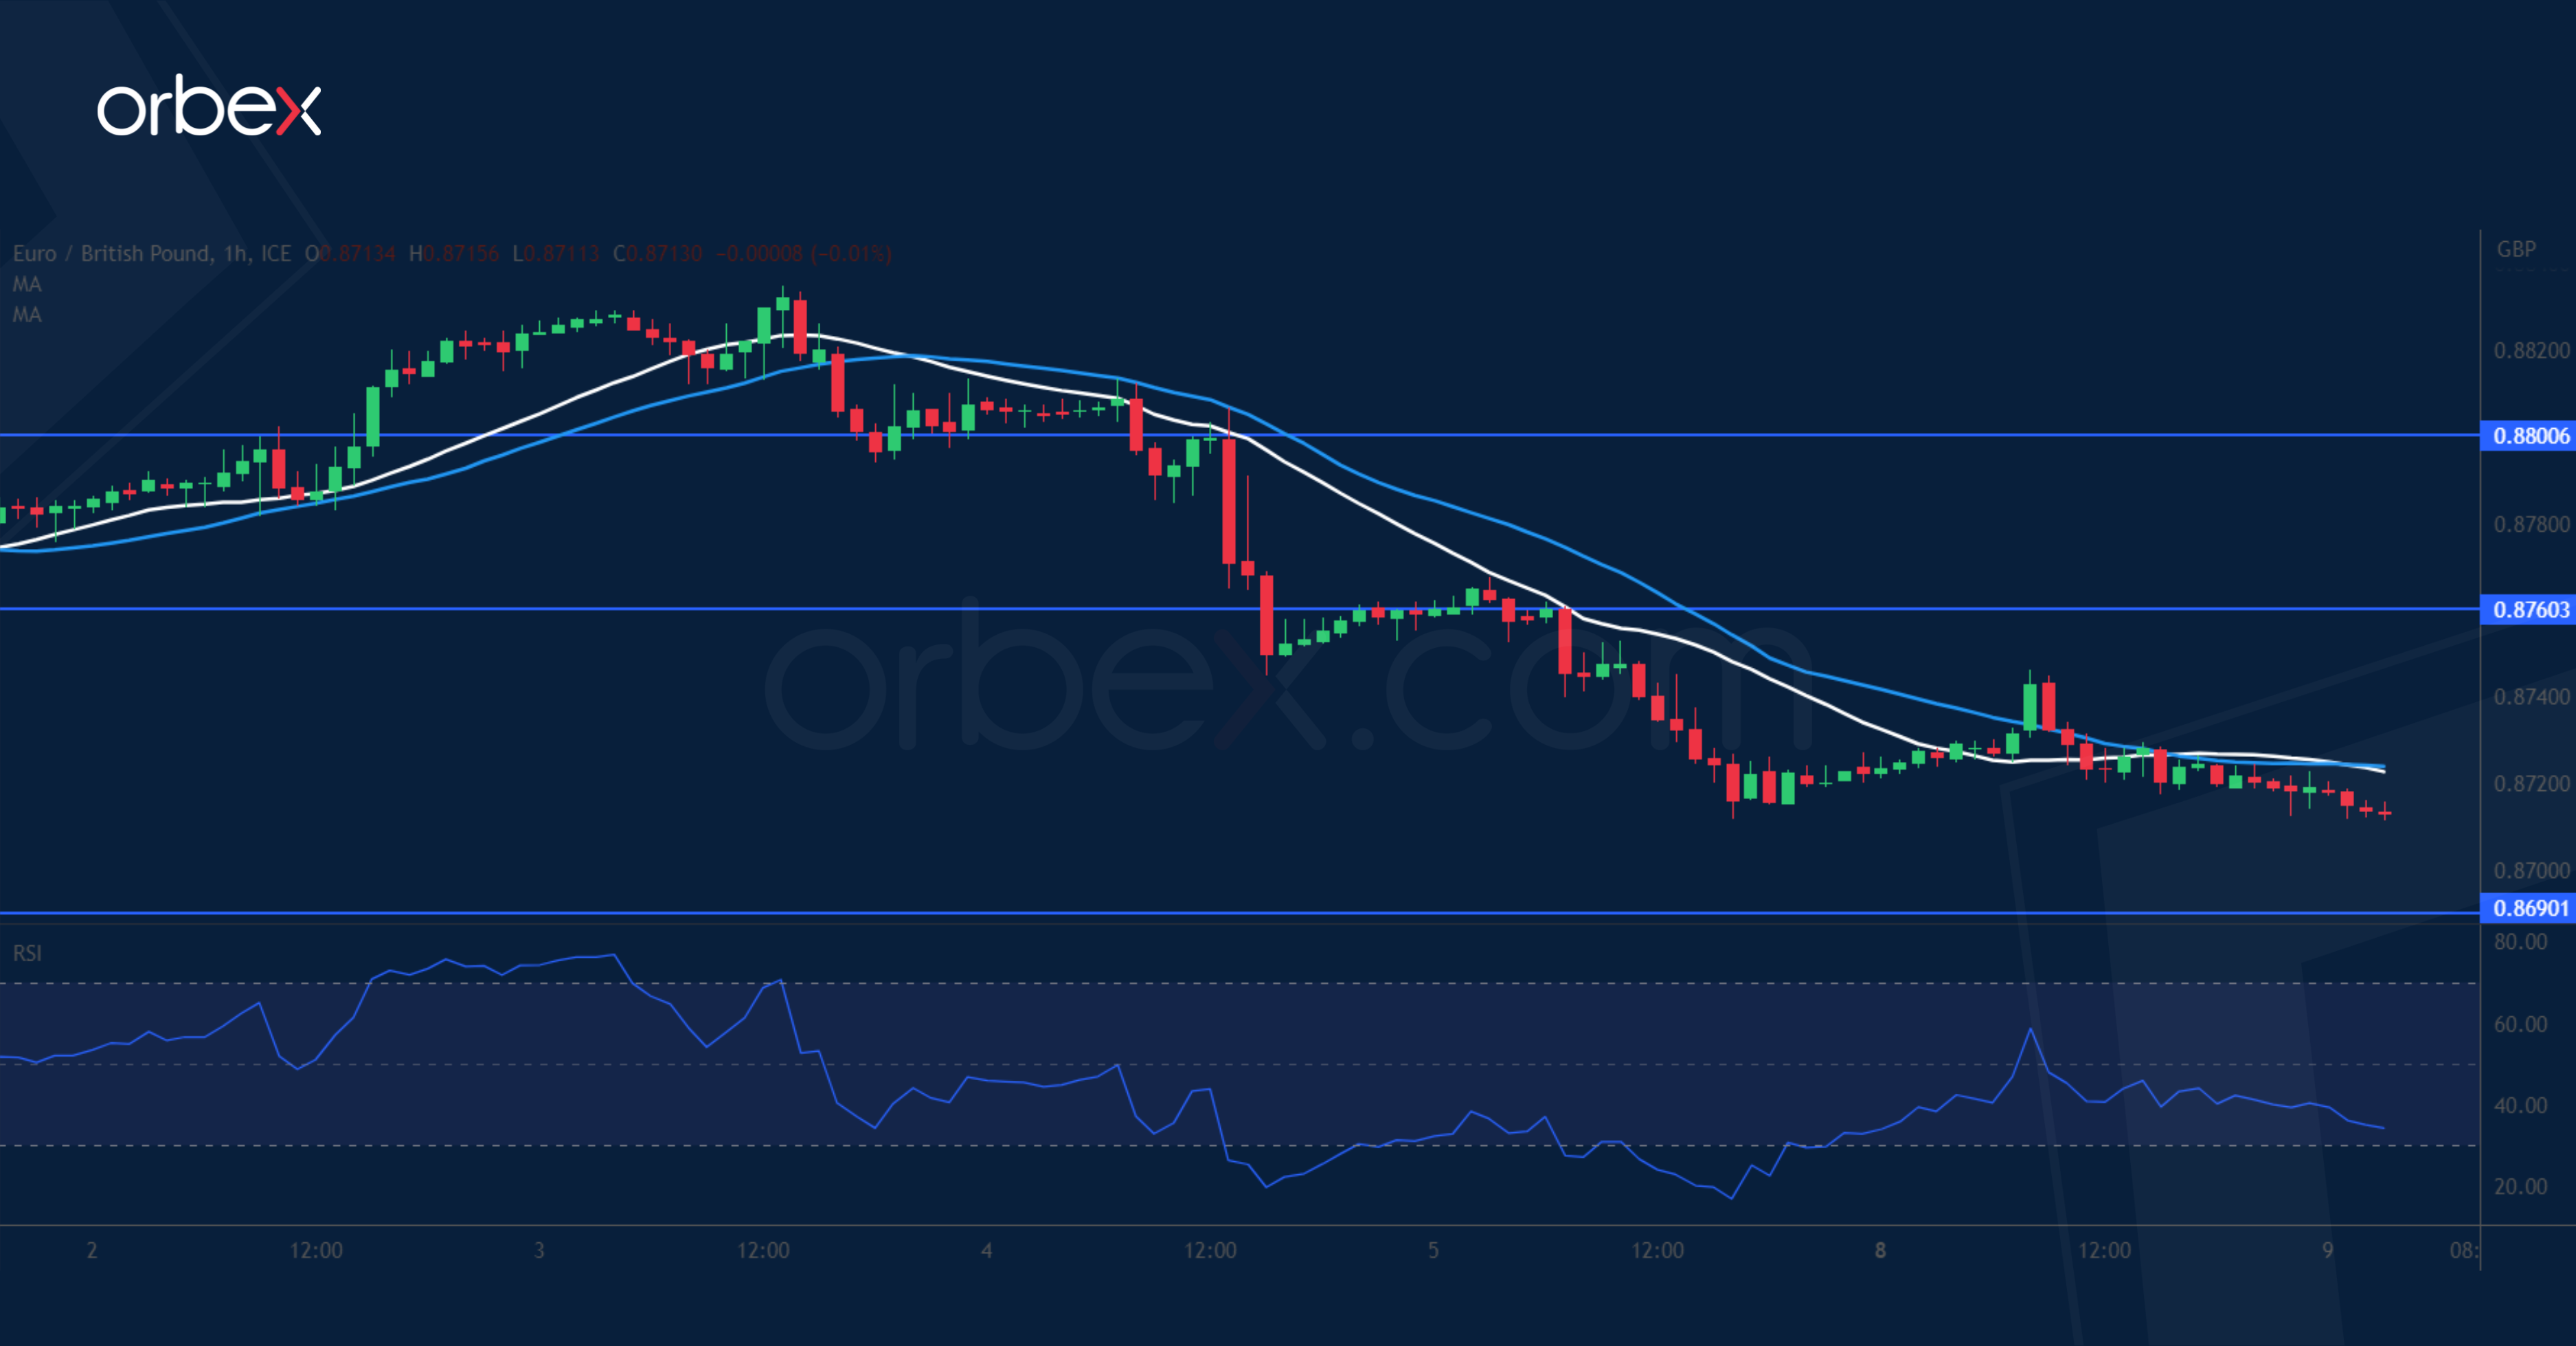
The pound rallies ahead of an expected Bank of England rate increase. A drop below April’s low of 0.8730 has put the bulls on the defensive after a previous bounce off 0.8760 failed to contain the sell-off. More profit-taking by the buy side could weaken demand in the medium-term and make the pair vulnerable to a bearish reversal. 0.8690 is the next level to see if any meaningful buying interest would emerge again. On the upside, 0.8760 has turned into a resistance and only a close above 0.8800 would improve sentiment.
DAX 40 tests resistance
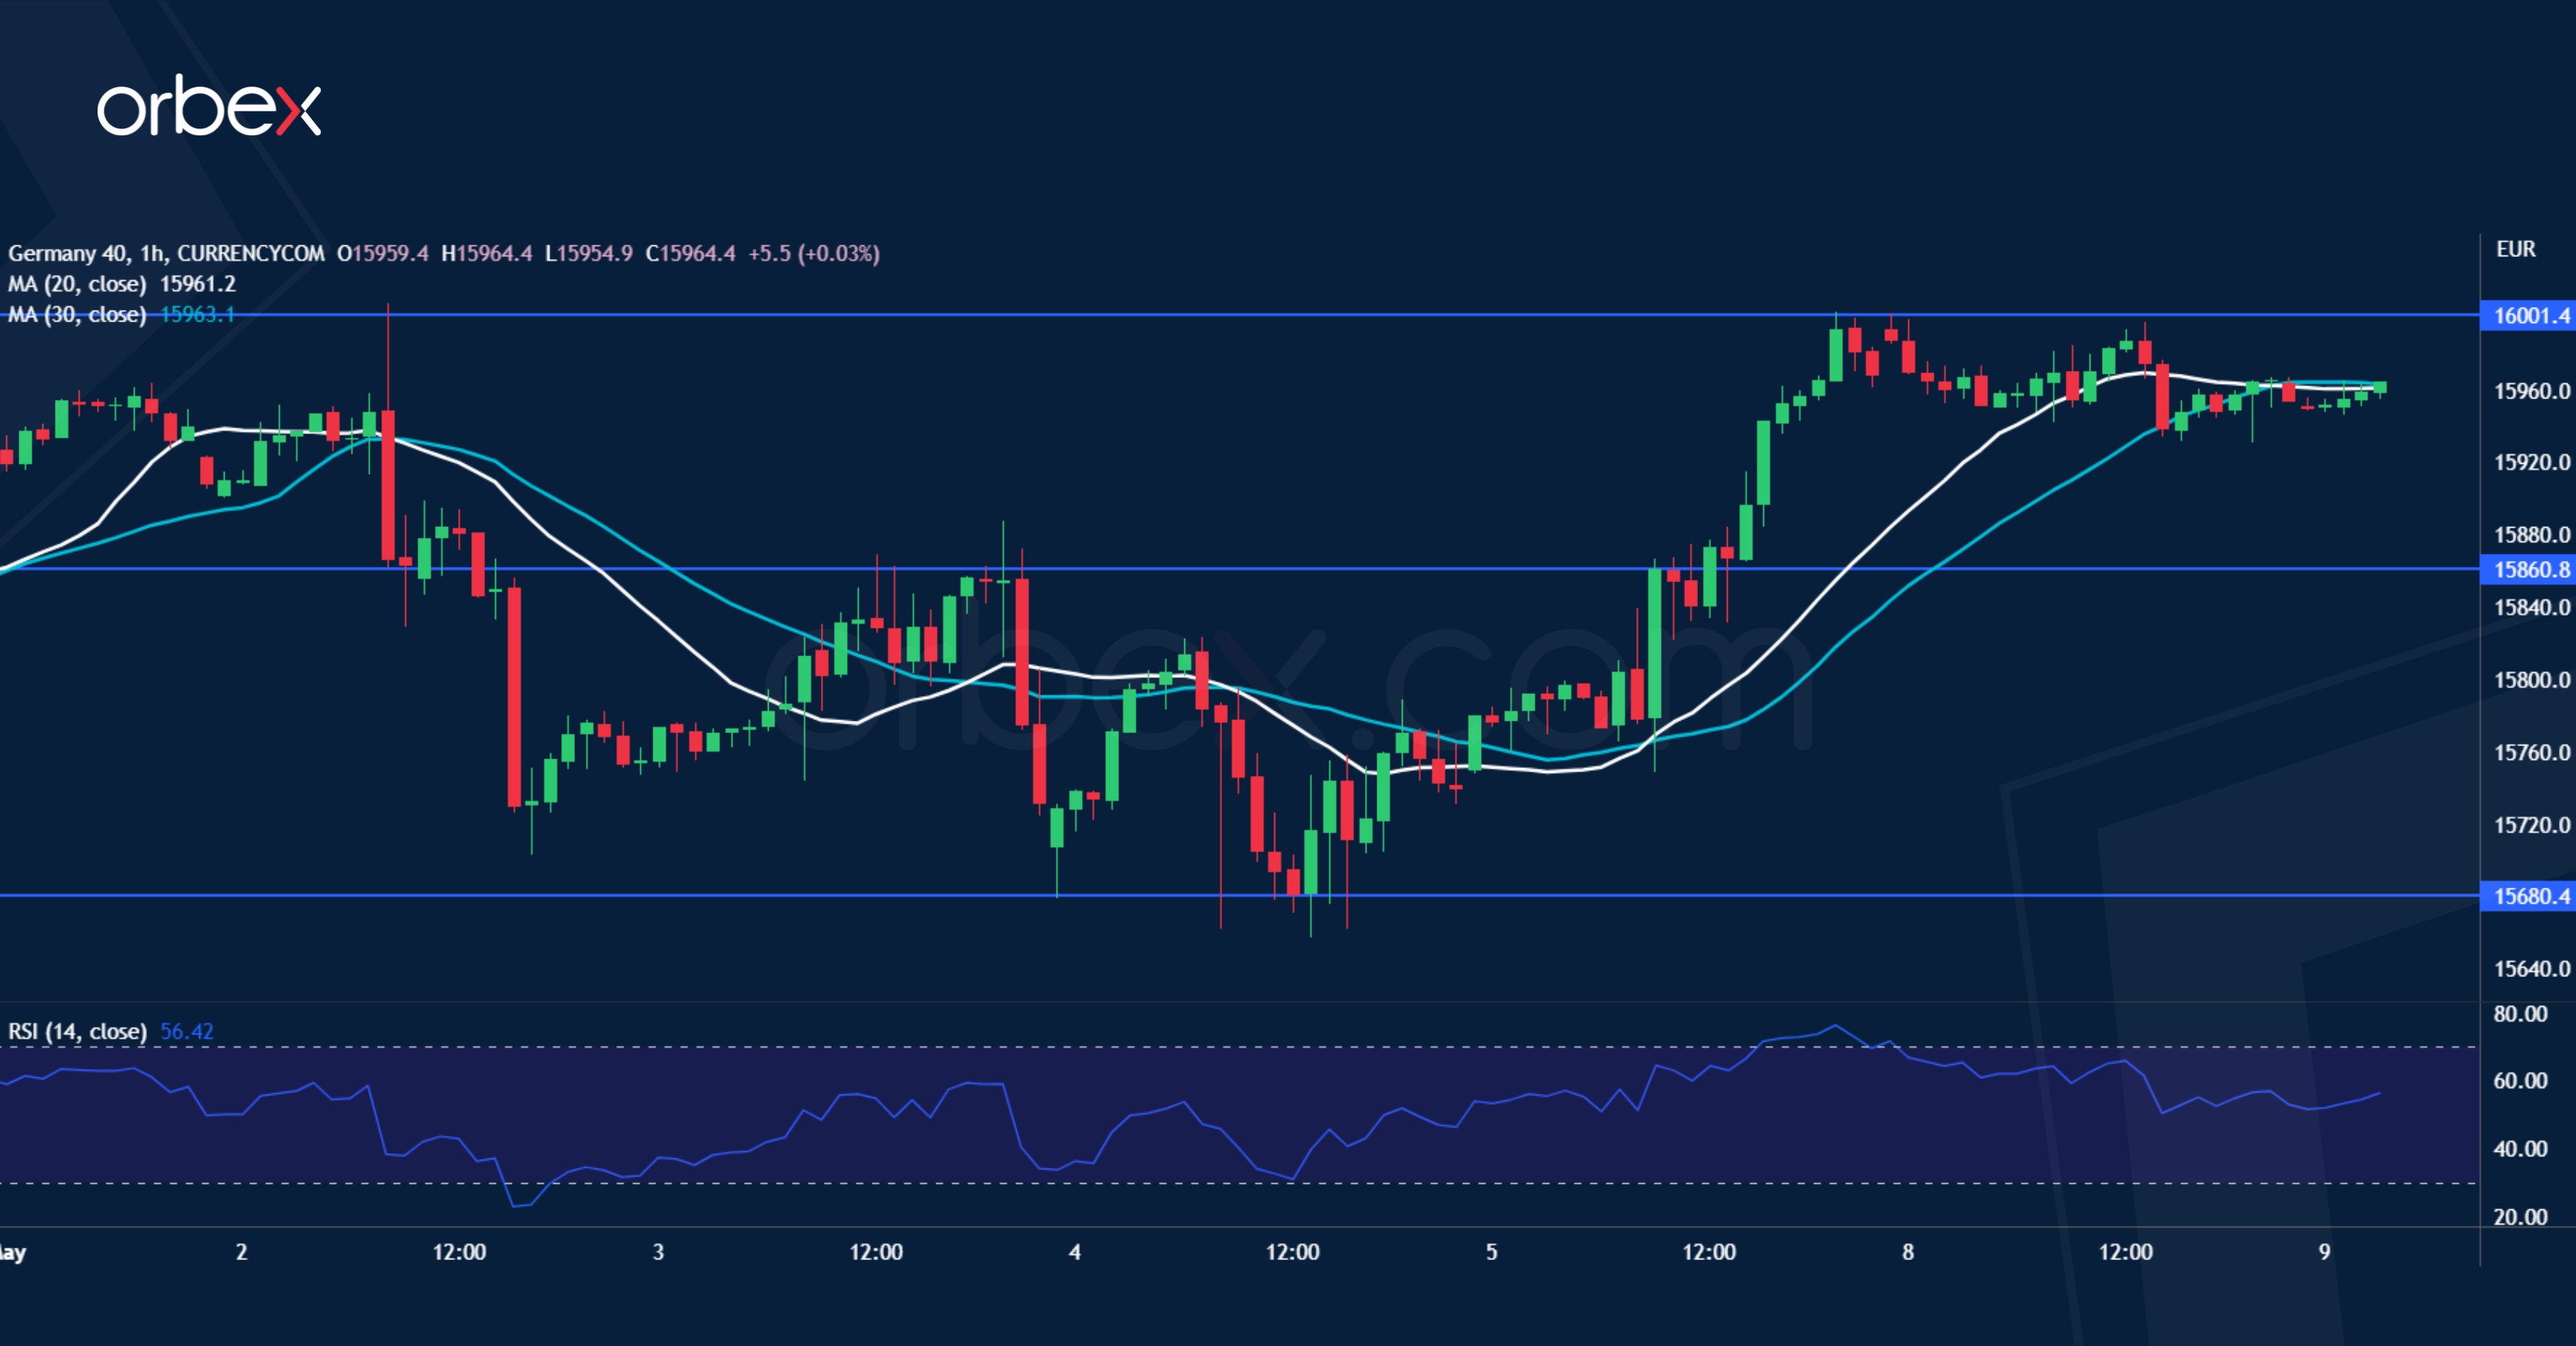
The Dax 40 takes a breather after lacklustre German industrial production. A pop above 15860 then the recent peak of 15960 has put the index back on track after it found solid support over the 30-day SMA (15680). This confirms that the market mood remains optimistic and the consolidation was merely an opportunity for the bulls to stake in with 15860 becoming a fresh support. The psychological level of 16000 would be a formality before the price retests the all-time high of 16300 from January 2022.