Sample Category Title
US consumer inflation in focus as investors gauge Fed’s next move
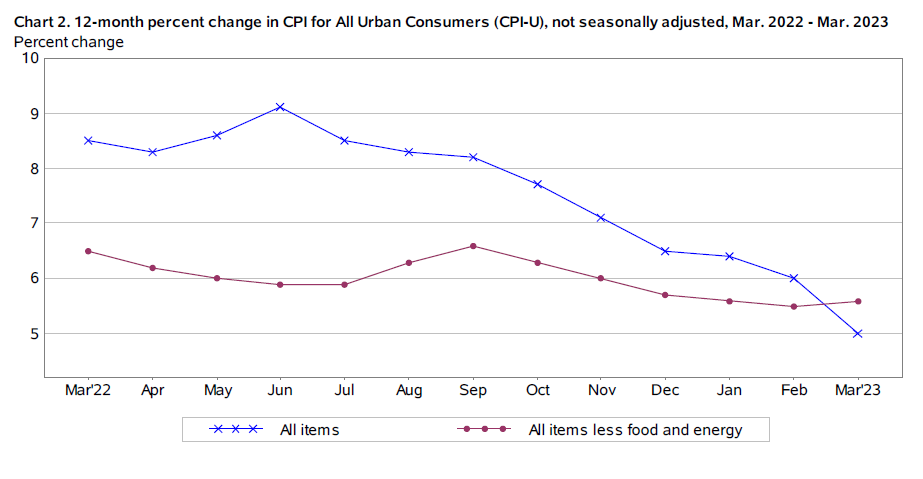
Today's spotlight is on US consumer inflation data, which is expected to show that headline CPI remained unchanged at 5.0% yoy in April, after falling for nine straight months. Core CPI, which excludes volatile food and energy prices, is predicted to slightly drop from 5.6% yoy to 5.5% yoy. Both the trajectory of inflation and unfolding regional bank issues in the US will play a critical role in Fed decision-making about the peak interest rate in the current cycle (if it hasn't been reached yet) and the timing of the first rate cut.
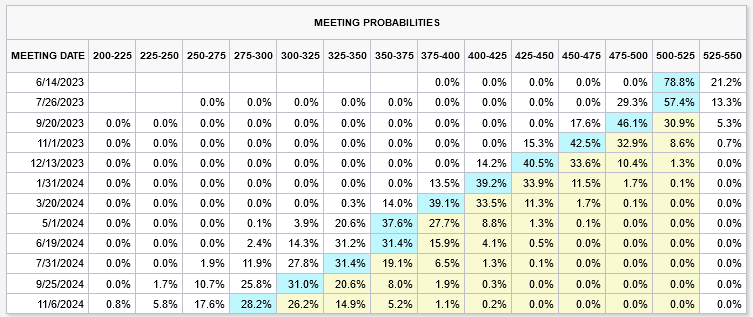
Current fed funds futures data suggests a 78.8% probability that Fed will maintain interest rate at 5.00-5.25% following FOMC meeting on June 14. There's a 21.2% chance of an additional 25bps hike to 5.25-5.50%. Notably, there's a 63.8% likelihood of a rate cut beginning in September, marking the start of a potential loosening cycle.
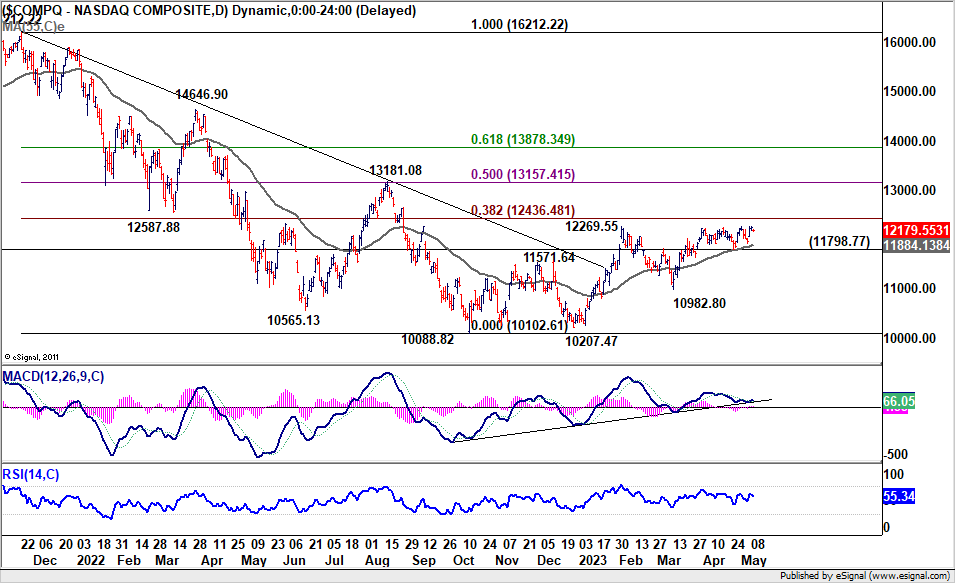
Despite these uncertainties, investor sentiment remains relatively resilient, with major stock indexes preserving their near-term bullish trajectories. NASDAQ, for instance, is expected to continue rallying as long as 11798.77 support level holds. The key test, however, will be 8.2% retracement of 16212.22 to 10088.82 at 12436.48. Decisive break above this level could trigger further rallies towards 13181.08 cluster resistance level (50% retracement at 13157.41) and possibly beyond.
Conversely, if NASDAQ breaks below 11798.77 support level, it would suggest a rejection by 12436.48 Fibonacci resistance level, possibly triggering a deeper decline towards 10982.80 and potentially retesting 10088.82 low.
As always, these movements in risk sentiment will likely have a correlated impact on currency market trends.
Bitcoin Price At Risk of Downside Break, US CPI Next
Key Highlights
- Bitcoin price started a fresh decline below $29,000.
- BTC traded below a key contracting triangle with support at $28,200 on the 4-hour chart.
- EUR/USD failed to climb further higher and corrected gains.
- The US Consumer Price Index is likely to remain at 5% in April 2023 (YoY).
Bitcoin Price Technical Analysis
Bitcoin price struggled to clear the $30,000 resistance zone. BTC/USD formed a short-term top near $29,650 and started a fresh decline.
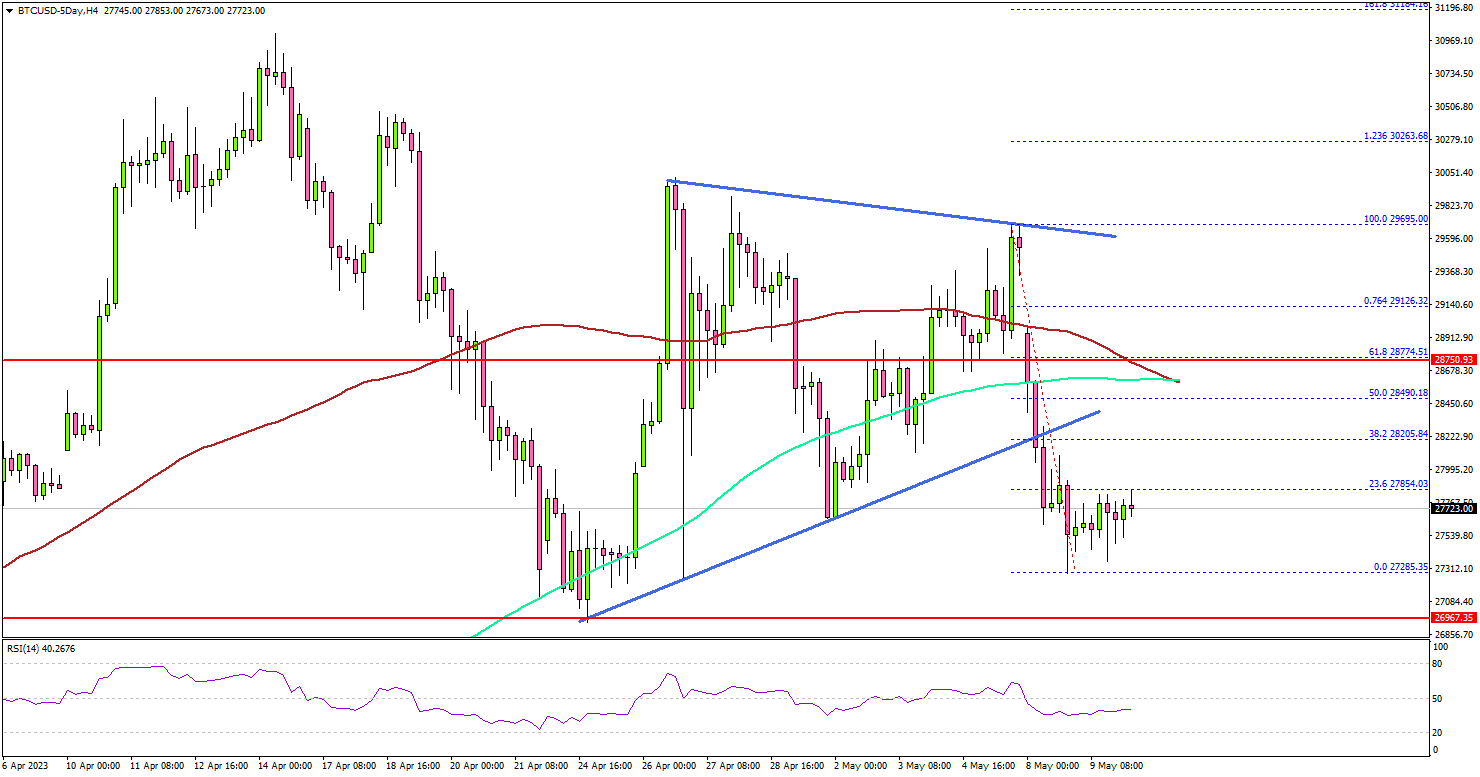
Looking at the 4-hour chart, the price declined below the $29,200 and $29,000 support levels. There was a move below the $28,500 support, the 100 simple moving average (red, 4 hours), and the 200 simple moving average (green, 4 hours).
Besides, BTC traded below a key contracting triangle with support at $28,200 on the same chart. The price is now showing bearish signs and might soon revisit the $27,000 support.
If there is a downside break and a close below $27,000, bitcoin might start another decline in the coming days toward $26,000 or even $25,500.
On the upside, the price is facing resistance near the $28,200 level. The first major resistance is near the $28,750 level (a multi-touch zone) and the 100 simple moving average (red, 4 hours).
A successful close above the $28,750 level might spark another bullish wave. In the stated case, the price may perhaps rise toward the $30,000 level.
Economic Releases
- US Consumer Price Index for April 2023 (MoM) – Forecast +0.4%, versus +0.4% previous.
- US Consumer Price Index for April 2023 (YoY) – Forecast +5%, versus +5% previous.
- US Consumer Price Index Ex Food & Energy for April 2023 (YoY) – Forecast +5.5%, versus +5.6% previous.
ECB Schnabel: Tightening to continue until clear sustained decline in core inflation
ECB Executive Board member Isabel Schnabel reaffirmed the bank's commitment to stringent measures to restore inflation to 2% target during an event in Frankfurt yesterday. Citing current data, she stated, "there is no doubt that we have to do more to bring inflation back to our 2% target in a timely manner."
Schnabel emphasized ECB's readiness to "raise rates decisively until it becomes clear that core inflation is also declining on a sustained basis." This stance aligns with recent remarks by ECB President Christine Lagarde, who Schnabel notes, "has made it absolutely clear that the slowdown in rate hikes is not an indication that we’ll stop raising rates any time soon."
Contrary to market expectations for potential rate cuts this year, Schnabel argued such predictions were "highly unlikely for the foreseeable future," pointing to the likelihood of prolonged high rates.
She observed that inflation momentum in Eurozone remained high for all items except energy, and price pressures were spreading across most consumption basket components. Despite the fading supply-side shocks from bottlenecks and energy prices, Schnabel highlighted the strength of the labor market, the uptick in wage growth, and high corporate profit margins. These factors underline the complex economic the ECB must navigate to achieve its inflation target.
Fed Williams: Not my baseline to cut interest rates this year
New York Fed President John Williams maintained a hawkish stance on Fed's monetary policy, asserting the necessity of persisting with rate hikes to control surging inflation.
"We haven't said we are done raising rates," Williams stated yesterday, emphasizing that future decisions would be data-driven, aligning with Fed's goals. He stressed, "We've made incredible progress" on tackling inflation, but left the door open for further policy tightening, saying, "if additional policy firming is appropriate, we'll do that."
Williams projected that a restrictive monetary policy stance would be necessary for an extended period to curb inflation from 4% to the targeted 2%. He denied any likelihood of rate cuts in the current year, quashing speculations of such a move. He said, "I do not see in my baseline forecast any reason to cut interest rates this year."
Addressing the inflation conundrum, Williams declared price pressures "too high" and acknowledged a discrepancy between demand and supply, with the former outpacing the latter. He noted signs of a "gradual cooling in the demand for labor," as well as for certain goods and commodities, yet emphasized that these were outweighed by the overall demand-supply mismatch.
Dollar Struggles at the ‘Game-Changing’ Level
For the second month, the Dollar Index finds support from declines in the 101 area. Dollar bulls are defending critical levels in the major currency pairs, which could significantly increase the psychological pressure on the US currency. The resolution of this situation is likely to come from politics and macroeconomic data.
The Dollar Index has been hovering around the 101.30 level for the past four weeks. Attempts to break above 102 have been met with increased selling, but the sellers aren’t picking up the declines below 101 either.
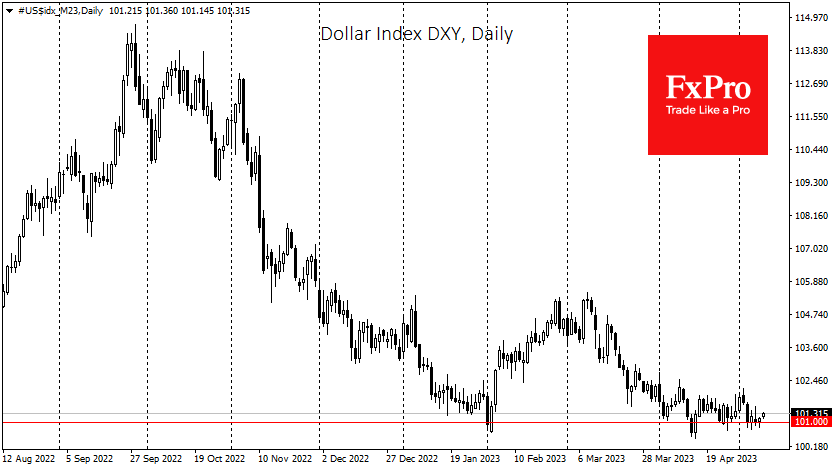
The 101 area of the Dollar Index appears to be more important than the round 100 level, as the Dollar’s rally in the first half of 2020 was halted near this level, apart from a brief spike on the unexpected first lockdowns.
The same level 13 months ago triggered an acceleration of dollar inflows and became a game-changing switch in the currency market. The new switch promises to be as important as last year’s, so it will unlikely be quick and easy.
Moreover, this change is going to take much work. Between 2006 and 2014, the area of 89 for DXY was a similar historical resistance. It then became an insurmountable support from which the Dollar was called upon in the recessions of 2018 and 2021.
The more localised picture remains on the sell side of the Dollar. The DXY reversed its decline at the end of September last year on signals that the Fed would slow the pace of rate hikes and pause soon. The rally from February to March was based on hawkish inflation data and expectations that the final rate would be higher than initially expected.
The banking problems nailed the Dollar to support at 101 as markets put an imminent reversal of a rate cut back on the agenda. Last week’s employment data and the Fed’s decision did not change market expectations meaningfully.
However, tomorrow’s inflation data for April may do so. Reading well below 5% YoY would allow the Fed to talk more about outperforming inflation and stop raising rates. On the other hand, a sudden acceleration will lead to a pullback in the Dollar as the markets anticipate more rate hikes in June.
Sunset Market Commentary
Markets
European stock markets faced broad-based selling pressure from the start today despite muted sessions on WS yesterday and Asia (excluding late Chinese swoon) overnight. We pick out the real estate sector which suffers both from yesterday’s US warning on commercial real estate and after Swedish commercial landlord SBB postponed a dividend and scrapped plans to sell shares after being junked by S&P this weekend on concerns over its liquidity position. Stalling/declining housing prices, rising interest rates and tighter lending standards and unfavorable redemption profiles weigh on the sector globally. Main European equity indices currently cede around 1%. This negative risk sentiment influences other markets in absence of relevant economic data. Hawkish ECB comments fail to inspire as well as more moderate governors outweighed the real hawks last week. Latvian ECB governor Kazaks repeated the mantra that quite some ground needs to covered and that further rate increases will be necessary to tame inflation. More specifically he doesn’t assume rate hikes to end in July and he definitely pushed back against premature rate cuts in the spring of next year. “Persistently high inflation is a bigger problem for society than a relatively short and shallow recession. Failing to contain inflation would be a failure because then the policy response in the second go would then need to be much tighter.” This pretty much sums our view as well. Current market pricing of a 3.6% policy rate peak with rate cuts early 2024 is way too conservative. ECB Kazimir linked last week’s slowdown from 50 bps rate hikes to 25 bps increments to the possibility to go higher for longer. ECB Nagel revealed himself as supporter of a bigger rate hike last week with ECB Vujcic and Lane talking more generally about ongoing inflationary pressures. German yield changes currently range between roughly -1 bp for the shorter tenors and +1 bp for the longer tenors. US yields add around 1.6 bps for the 2-yr and are broadly flat further down the curve. The dollar extends its momentum from yesterday with EUR/USD sliding from 1.10 to 1.0950. EUR/GBP copies the move lower, attacking the 0.8720 support zone and even the 0.87 big figure. The UK currency currently trades at its strongest level since December last year in the run-up to Thursday’s Bank of England policy meeting. UK gilts significantly underperformed today with yields 5.5 bps (30-yr) to 7 bps (2-yr) higher.
News & Views
The Australian government forecasts a budget surplus of A$ 4.2bn for the fiscal year ending in June. It would be the first surplus since 2008/2009. According to Treasurer Chalmers, the result is due to the government returning 82% of extra revenue windfall to the budget from lower unemployment, stronger jobs and wage growth and higher prices of key exports/commodities. However, the budget is expected to return to a A$ 13.9bn deficit in the FY 2023-24 (0.5% of GDP), rising further to A$ 35.1bn and A$ 36.6 bn over the following years. The deficit, amongst others, comes as the government takes measures to mitigate the impact of higher energy prices. The energy support is expected to ease inflation over the coming year by 0.75%. The government also sees a further structural rise in defense spending over the coming years while also spending on hospitals, health care and interest rate payments are expected to increase. The budget assumes growth to slow to 1.5% in 2023/24 before rebounding to 2.25% in 2024/25. This will result in a rise in an unemployment rate of 4.25% by mid-2024 and 4.5% mid-2025. Inflation is expected to slow from 6% this FY to 3.25% and 2.75% in FX 2023/24 and 2024/25 respectively. The Aussie dollar is losing modest ground today at AUD/USD 67.6, but his move occurred before the budget release.
Czech real industrial production (WDA) rose in March by 1.7% M/M and 2.2% Y/Y. The Y/Y increase in production was mostly influenced by manufacture of motor vehicles, increasing 42% Y/Y (10% M/M). A lower comparison basis and an improvement of supplies of components supported activity. Production in several other industries decreased Y/Y, with the highest negative contribution coming from electricity, gas, steam and air conditioning supply. A decrease also continued in manufacture of other non-metallic mineral products, chemical industry and mining and quarrying, in which production decreased by a fifth Y/Y. The value of new industrial orders declined 1.7% Y/Y. Construction activity decreased by 0.9% M/M (-6% Y/Y). The CNB last week upwardly revised its 2023 growth forecast from -0.3% (Feb) to 0.5%. The koruna today extended its post CNB rebound, trading near EUR/CZK 23.35.
Oil Market Outlook
Oil prices rebounded slightly on Friday but are still expected to show losses for the week due to concerns about slowing growth in the US and China. US crude futures rose 2.7% to $70.41 per barrel, while the Brent contract increased by 2.5% to $74.33 per barrel. However, the Brent contract is more than 6% lower for the week, and the Nymex contract has fallen by over 8%. The market remains negative, suggesting there could be more downside in the near term, though support near $70 per barrel is expected. Despite the downturn, the crude market is still expected to be in deficit over the second half of 2023, which should drive prices up. Let's now go over to the charts to decipher whatever the price action has in store.
USDCAD - Daily Timeframe
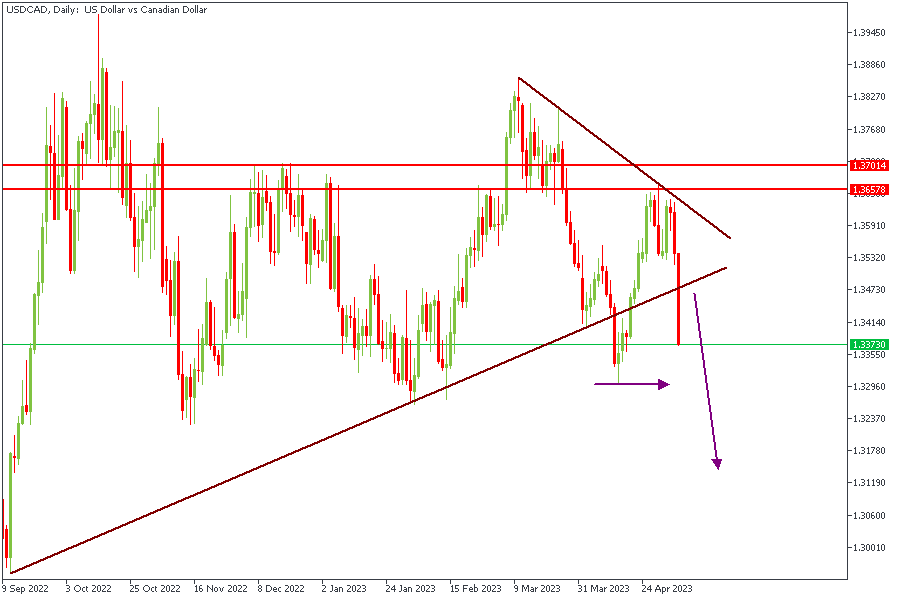
USDCAD on the daily timeframe has just recently broken below the resistance trendline of a wedge pattern. The most recent low has been marked with a horizontal arrow, and I expect the price to create a new low that would be lower than that area. What this means is that the Canadian may get stronger, leading to higher Oil prices.
Analysts’ Expectations:
- Direction: Bearish
- Target: 1.32795
- Invalidation: 1.34540
XTIUSD - Daily Timeframe
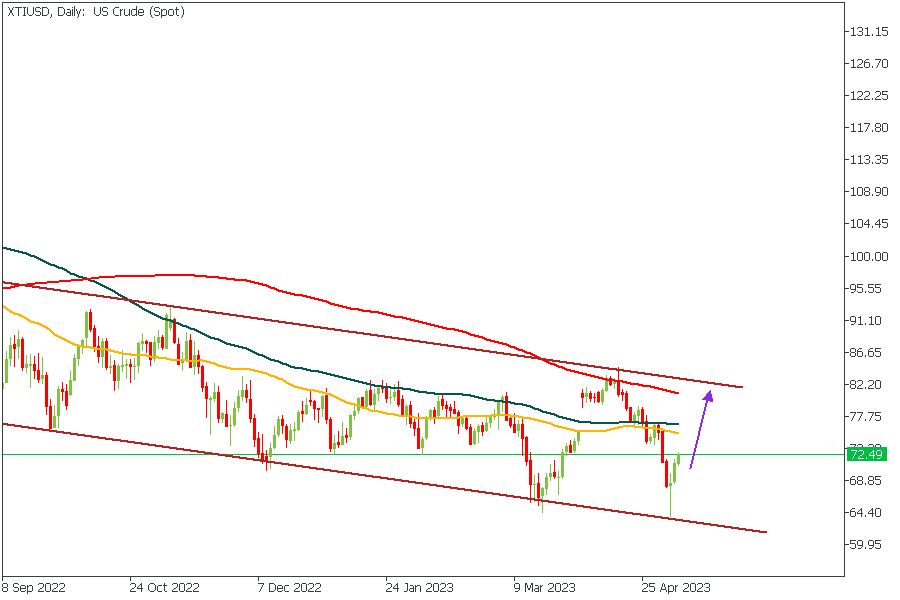
US Crude, as seen in the chart above, is trading within a descending channel, with a recent rejection of the trendline support of the same channel. Price will apparently head for the 200-period moving average, but I'll also cautiously watch for reactions from the 100 MA.
Analysts’ Expectations:
- Direction: Bullish
- Target: $77.04
- Invalidation: $69.58
XBRUSD - Daily Timeframe
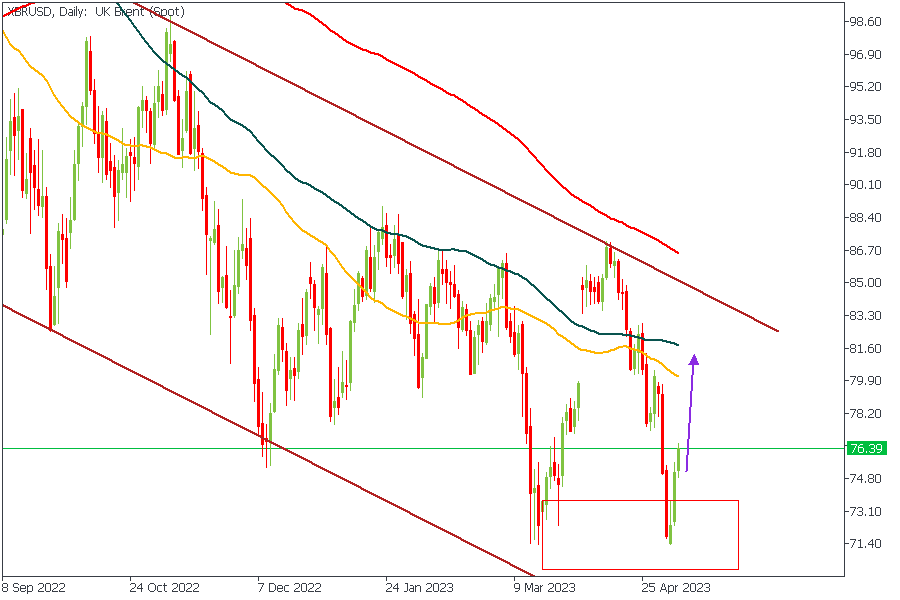
Brent (XBRUSD) has recently bounced off the drop-base-rally demand zone within the descending channel it has been riding in for almost a year. The price action suggests that the price is in search of a strong resistance that may be capable of pushing prices lower; in the meantime, however, I think we're bullish until that resistance level is found - possibly at the 100-day moving average.
Analysts’ Expectations:
- Direction: Bearish
- Target: $80.86
- Invalidation: $74.71
CONCLUSION
The trading of CFDs comes at a risk. Thus, to succeed, you have to manage risks properly. To avoid costly mistakes while you look to trade these opportunities, be sure to do your due diligence and manage your risk appropriately.
JP225 Index Retests 16-month High
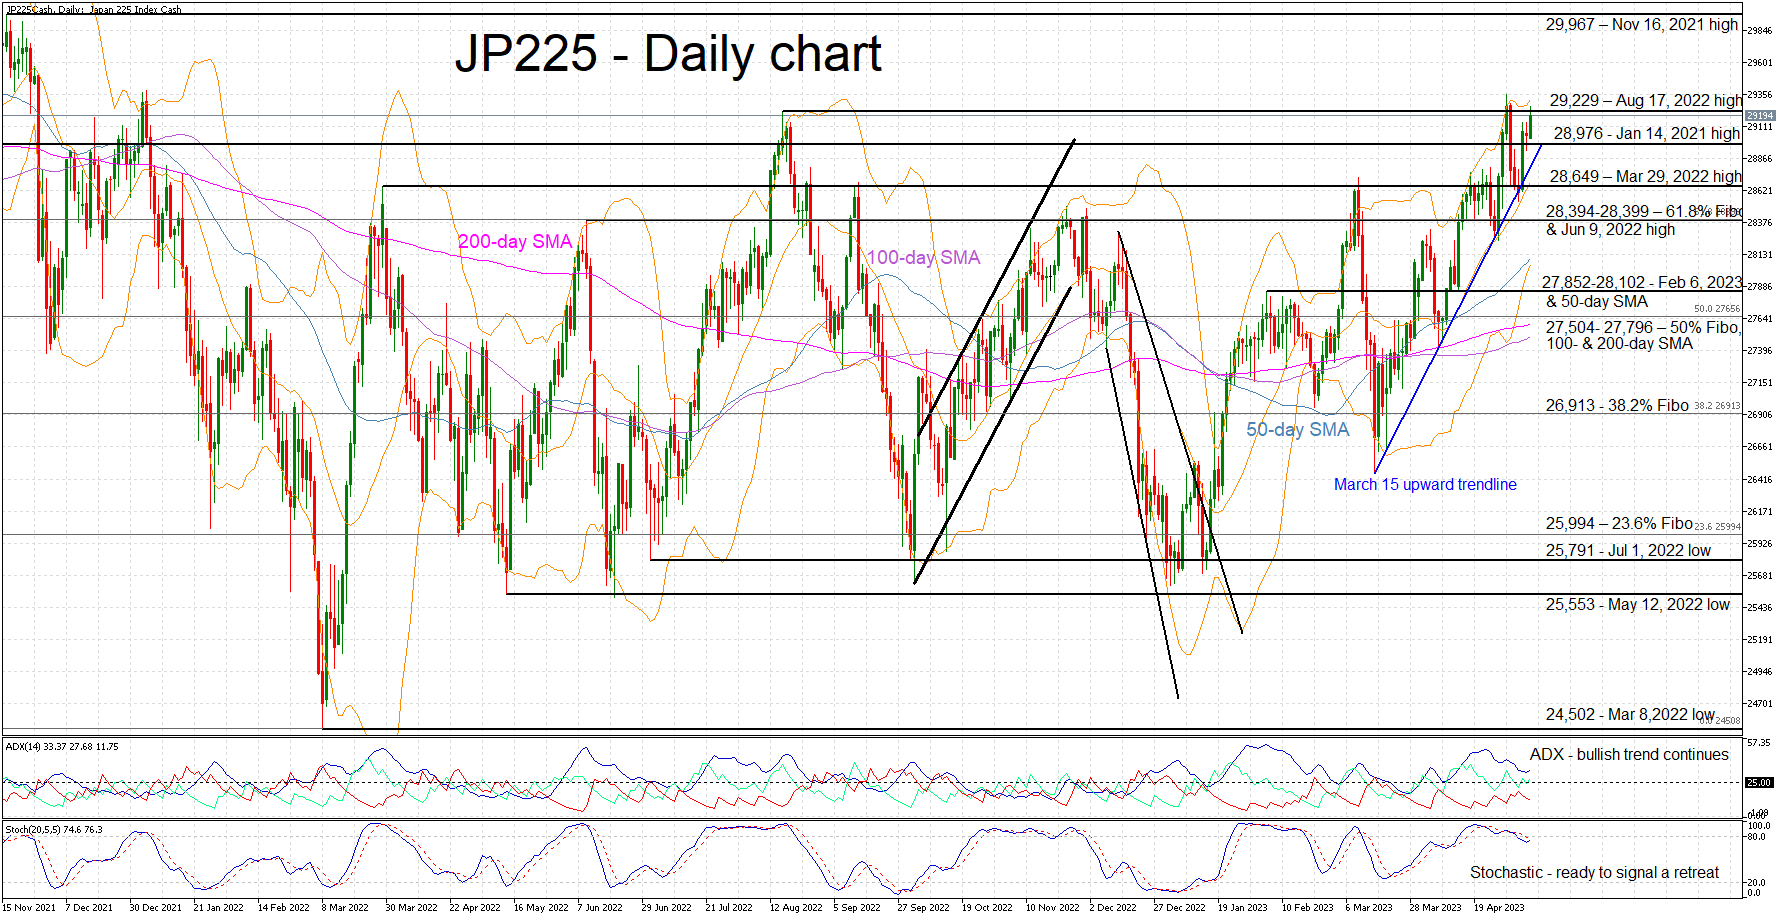
The JP225 cash index is edging higher today, a tad below the May 1, 2023 print of 29,352, which is the highest traded level for 16 months. Despite the aggressive rally since the March 15 low, the bulls seem to be still hungry for higher highs even though the momentum indicators are sending mixed signals.
While the Average Directional Movement Index (ADX) appears to be stabilizing at decent levels signaling a bullish trend, the stochastic oscillator has broken below its overbought territory. It is now testing the resistance set by its moving average (MA) and the next move is key for market sentiment. A failure to break above its MA could be perceived as a strong bearish signal.
Should this be the case, a retest of the January 14, 2021 and March 29, 2022 high at 28,976 and 28,649 respectively will come first. The busy 28,394-28,399 area, defined by the 61.8% Fibonacci retracement level of the September 14, 2021 – March 8, 2022 downtrend and the June 9, 2022 high, would then come into play.
If the bulls decide to ignore the mixed technical signs, they will most likely have another go at the crucial 29,229 level. The path appears to be clear then until the 29,967 level set by the November 16, 2021 high.
To conclude, JP225 index bulls seem ready for a higher high, but the market appears to be extra fragile. A bearish move from the stochastic can quickly turn the sentiment in favour of the bears.
EUR/USD Mid-Day Outlook
Daily Pivots: (S1) 1.0985; (P) 1.1019; (R1) 1.1039; More...
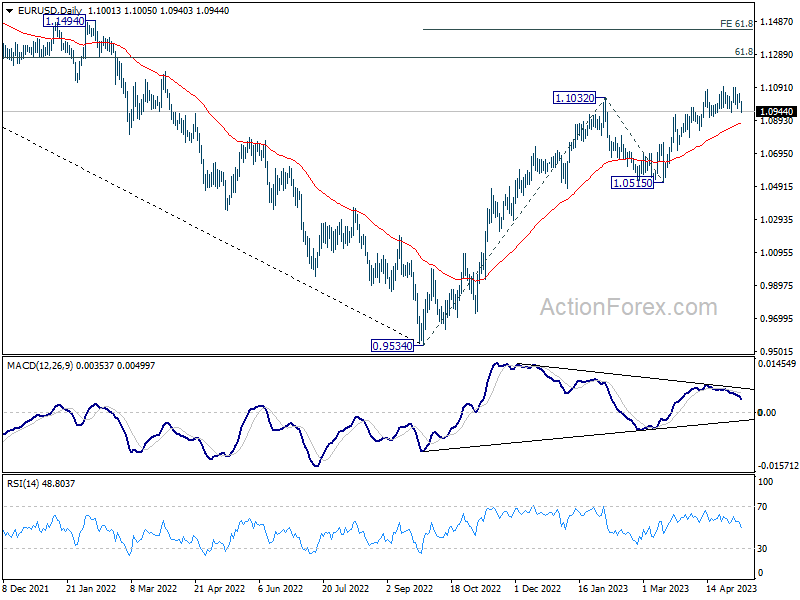
EUR/USD dips notably today but stays above 1.0908 support. Intraday bias remains neutral for the moment. Further rally could still be seen with 1.0908 support intact. On the upside, firm break of 1.1094 will resume larger up trend to 1.1273 fibonacci level. Break there will target 61.8% projection of 0.9534 to 1.1032 from 1.0515 at 1.1441 However, considering bearish divergence condition in 4H MACD, break of 1.0908 support will indicate short term topping and turn bias back to the downside.
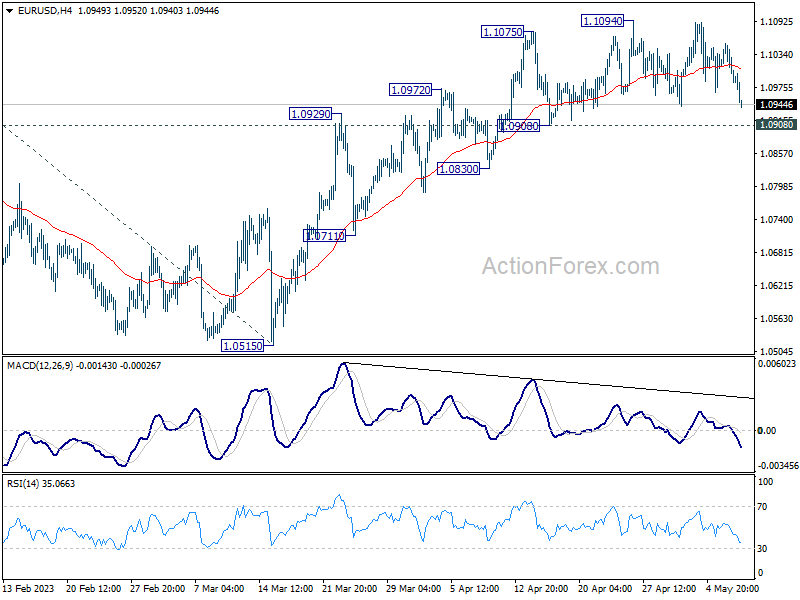
In the bigger picture, rise from 0.9534 (2022 low) is in progress for 61.8% retracement of 1.2348 (2021 high) to 0.9534 at 1.1273. Sustained break there will solidify the case of bullish trend reversal and target 1.2348 resistance next (2021 high). This will now remain the favored case as long as 1.0515 support holds, even in case of deeper pull back.