

Sample Category Title
EUR/USD Daily Outlook
Daily Pivots: (S1) 1.0932; (P) 1.0970; (R1) 1.0999; More...
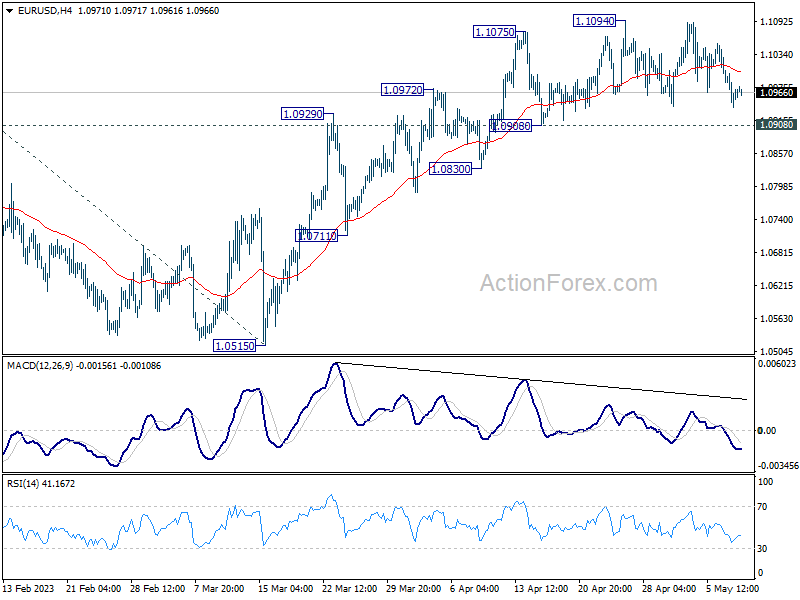
EUR/USD is extending the consolidation form 1.1094 and intraday bias remains neutral at this point. Further rally could still be seen with 1.0908 support intact. On the upside, firm break of 1.1094 will resume larger up trend to 1.1273 fibonacci level. Break there will target 61.8% projection of 0.9534 to 1.1032 from 1.0515 at 1.1441 However, considering bearish divergence condition in 4H MACD, break of 1.0908 support will indicate short term topping and turn bias back to the downside.
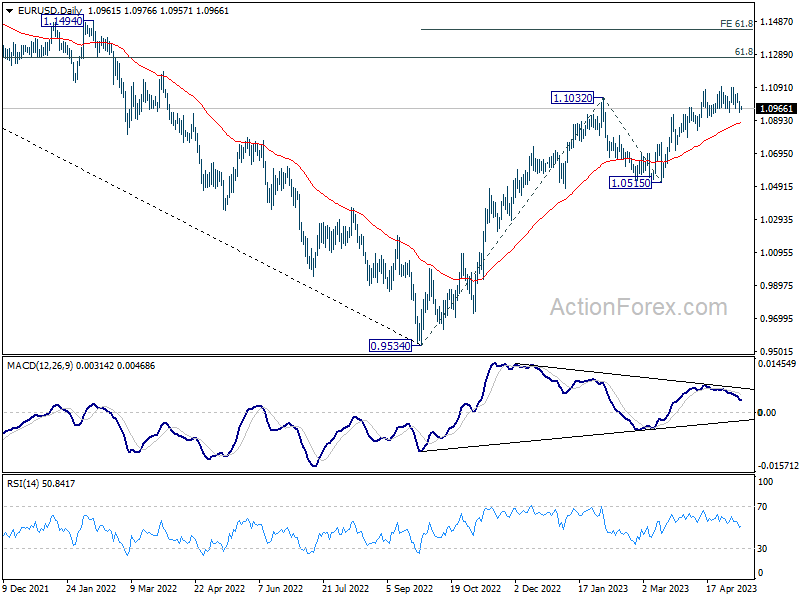
In the bigger picture, rise from 0.9534 (2022 low) is in progress for 61.8% retracement of 1.2348 (2021 high) to 0.9534 at 1.1273. Sustained break there will solidify the case of bullish trend reversal and target 1.2348 resistance next (2021 high). This will now remain the favored case as long as 1.0515 support holds, even in case of deeper pull back.
GBP/USD Daily Outlook
Daily Pivots: (S1) 1.2587; (P) 1.2613; (R1) 1.2648; More...
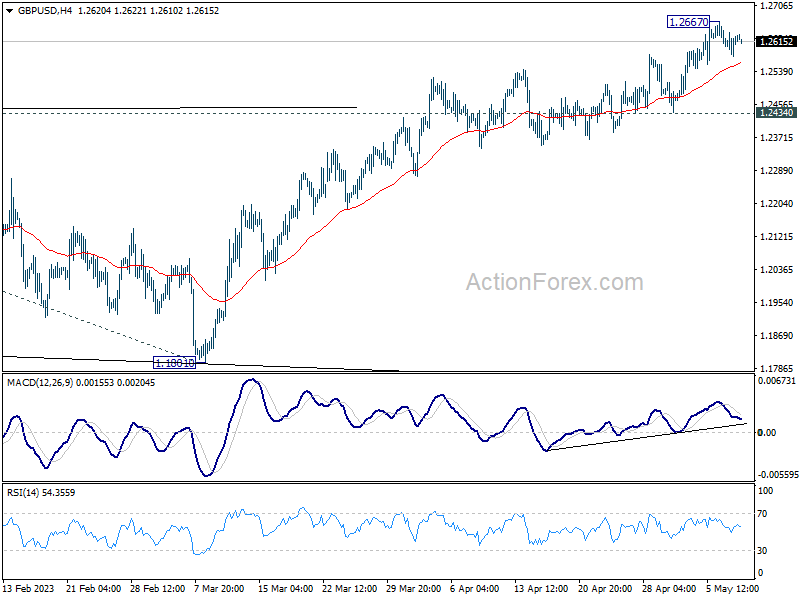
GBP/USD is extending the consolidation from 1.2667 and intraday bias remains neutral. Near term outlook will stay bullish as long as 1.2434 support holds. Break of 1.2667 will resume larger up trend to 1.2759 fibonacci level first. Firm break there will target 61.8% projection of 1.0351 to 1.2445 from 1.1801 at 1.3095.
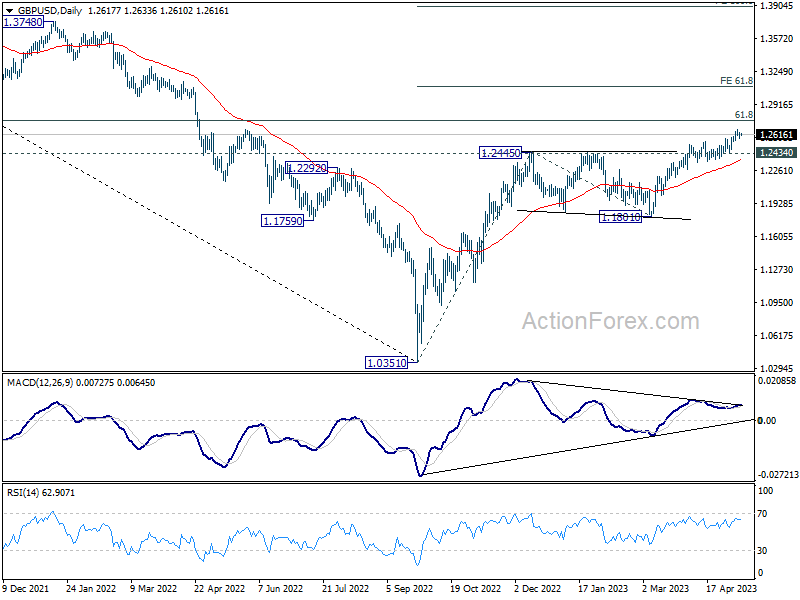
In the bigger picture, the rise from 1.0351 medium term term bottom (2022 low) is in progress for 61.8% retracement of 1.4248 (2021 high) to 1.0351 at 1.2759. Sustained break there will add to the case of long term bullish trend reversal. Further break of 61.8% projection of 1.0351 to 1.2445 from 1.1801 at 1.3095 could prompt upside acceleration to 100% projection at 1.3895. For now, this will remain the favored case as long as 1.1801 support holds, even in case of deep pull back.
USD/CHF Daily Outlook
Daily Pivots: (S1) 0.8881; (P) 0.8912; (R1) 0.8936; More...
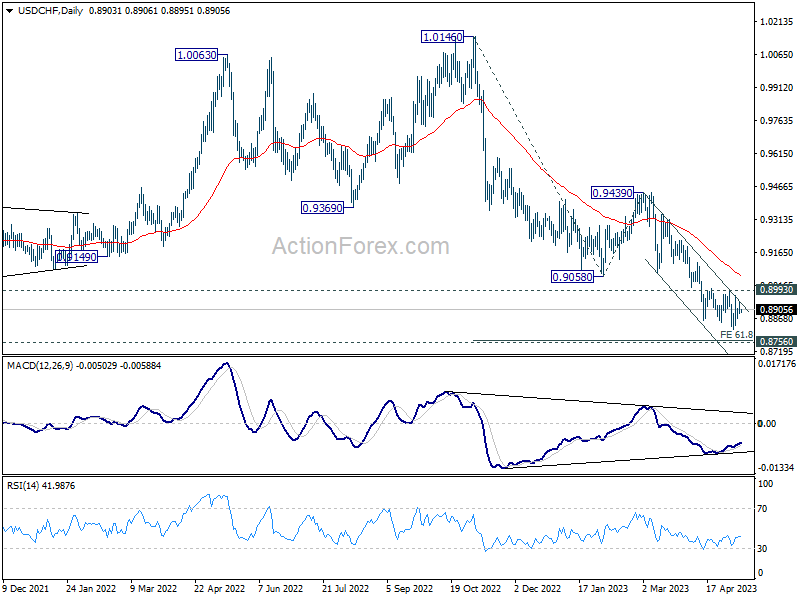
Intraday bias in USD/CHF remains neutral and outlook is unchanged for now. While down trend from 1.0146 could still extend lower, strong support should be seen from 61.8% projection of 1.0146 to 0.9058 from 0.9439 at 0.8767, which is close to 0.8756 long term support, to bring rebound, at least on first attempt. On the upside, break of 0.8993 resistance will indicate short term bottoming, on bullish convergence condition in 4H MACD, and turn bias back to the upside for stronger rebound.
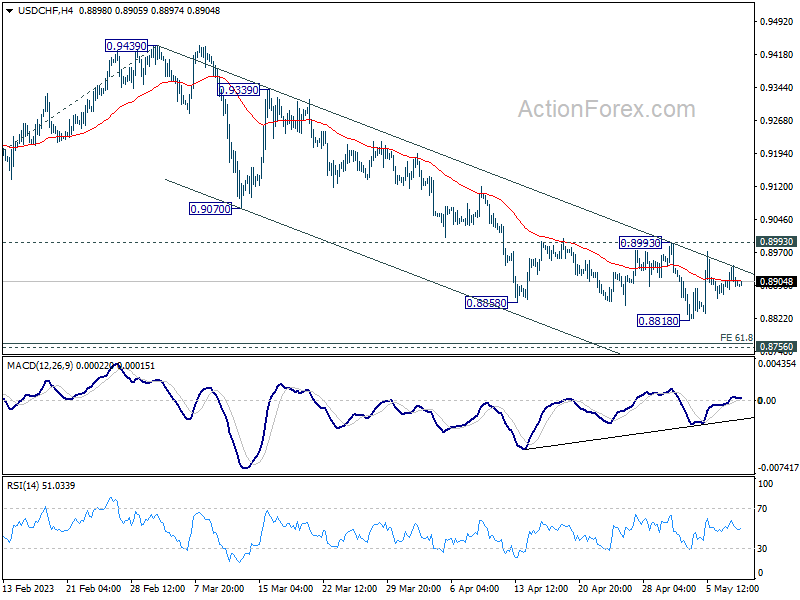
In the bigger picture, fall from 1.1046 (2022 high) is seen as a leg in the long term range pattern from 1.0342 (2016 high). So, downside should be contained by 0.8756 to bring reversal. Sustained break of 0.9058 support turned resistance will be the first sign of medium term bottoming. However, decisive break of 0.8756 will carry larger bearish implications.
USD/JPY Daily Outlook
Daily Pivots: (S1) 134.85; (P) 135.11; (R1) 135.49; More...
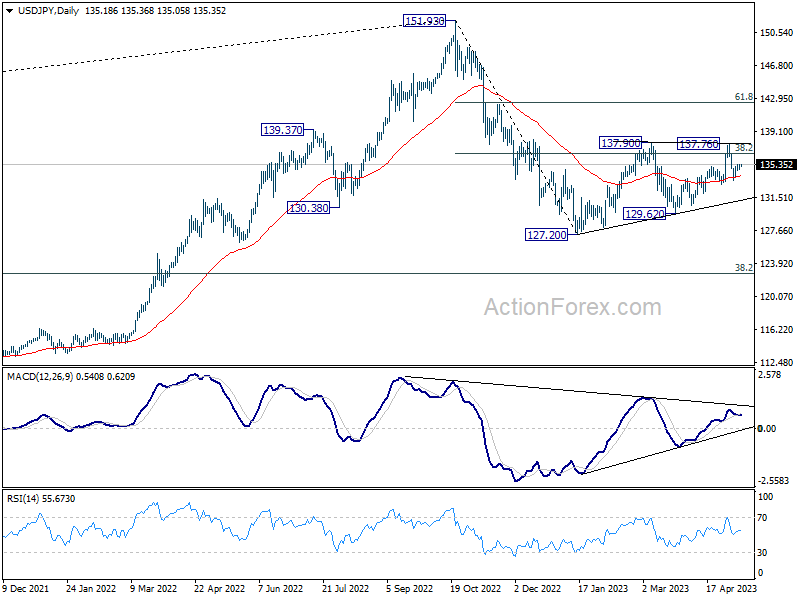
Outlook in USD/JPY remains unchanged and intraday bias stays neutral. With 135.68 minor resistance intact, deeper decline is mildly in favor. Fall from 137.76 is seen as the third leg of the pattern from 137.90. Below 133.48 will target 133.00 first, break will target 129.62 support. Still, as long as 129.62 holds, larger rebound from 127.20 is still in favor to resume at a later stage. On the upside, above 135.68 minor resistance will turn bias back to the upside for 137.76/90 instead.
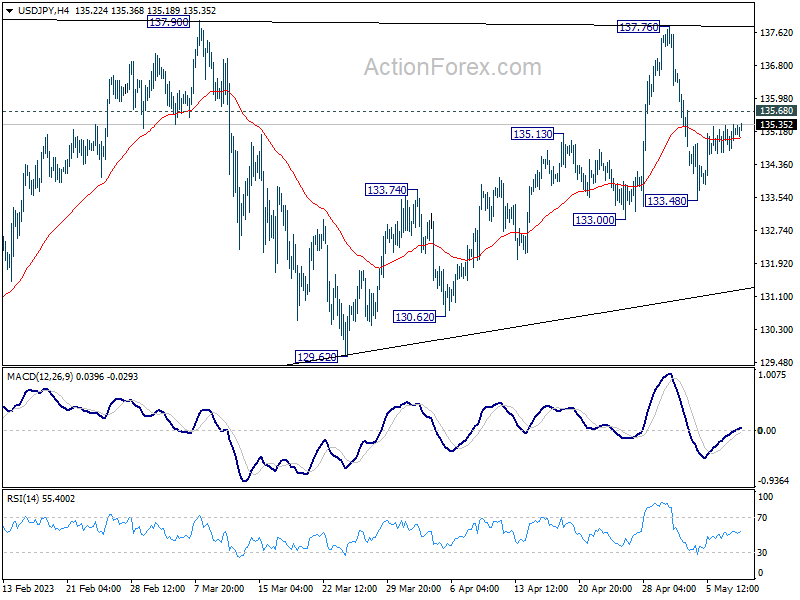
In the bigger picture, price actions from 151.93 high are currently seen as a corrective pattern to the long term up trend. The first leg should have completed at 127.20. Rebound from there is seen as the second leg. Sustained break of 38.2% retracement of 151.93 to 127.20 at 136.34 will bring stronger rebound to 61.8% retracement at 142.48. Meanwhile, break of 129.62 will argue that the third leg is starting through 127.20 low.
USD/CAD Daily Outlook
Daily Pivots: (S1) 1.3364; (P) 1.3385; (R1) 1.3405; More....
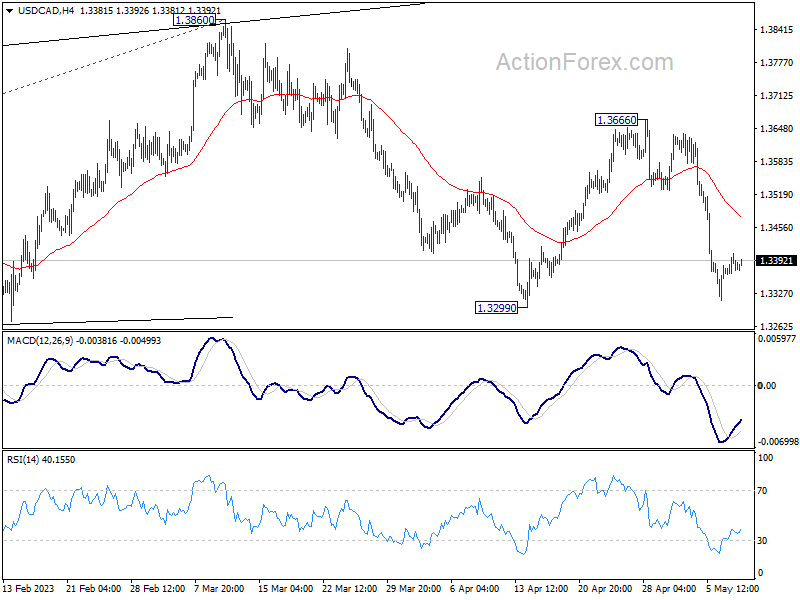
Intraday bias in USD/CAD is turned neutral as it recovered ahead of 1.3299 support. Further fall is mildly in favor. Firm break of 1.3299 will extend the corrective pattern from 1.3976 lower to 100% projection of 1.3976 to 1.3224 from 1.3860 at 1.3395 next. nevertheless, sustained trading above 55 4H EMA (now at 1.3475) will bring stronger rebound back to 1.3666 resistance instead.
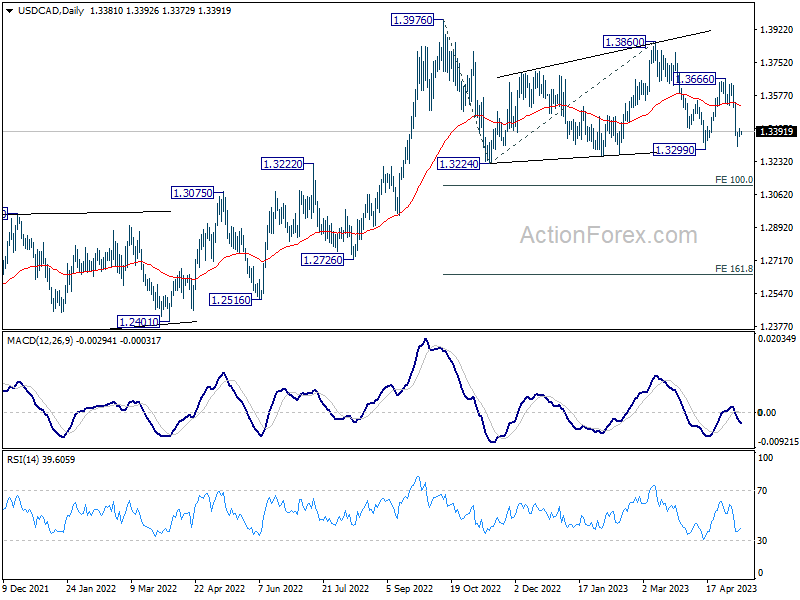
In the bigger picture, as long as 55 W EMA (now at 1.3315) holds, up trend from 1.2005 (2021 low) is still in favor to resume through 1.3976 at a later stage. However, sustained trading below the EMA and 38.2% retracement of 1.2005 to 1.3976 at 1.3233 will raise the chance of bearish reversal. Deeper should then be seen to 61.8% retracement at 1.2758 next.
Technical Outlook and Review
DXY:
The DXY chart is currently showing a bullish momentum overall, but a short-term drop to the 1st support level is possible before a rise to the 1st resistance level.
Currently, the DXY chart is seeing a multi-swing low support level at 101.02, which is a strong reason for its potential to be a good support level. Additionally, there is a swing low support level at 100.82, further reinforcing the strength of the support levels.
On the other hand, the 1st resistance level at 101.79 is a multi-swing high resistance level, which coincides with a 61.80% Fibonacci retracement. This makes it a strong level of resistance, suggesting that if the price were to rise to this level, it may struggle to break through.
The 2nd resistance level at 102.26 is another multi-swing high resistance level, adding to the potential resistance that the price may face if it were to rise further.
EUR/USD:
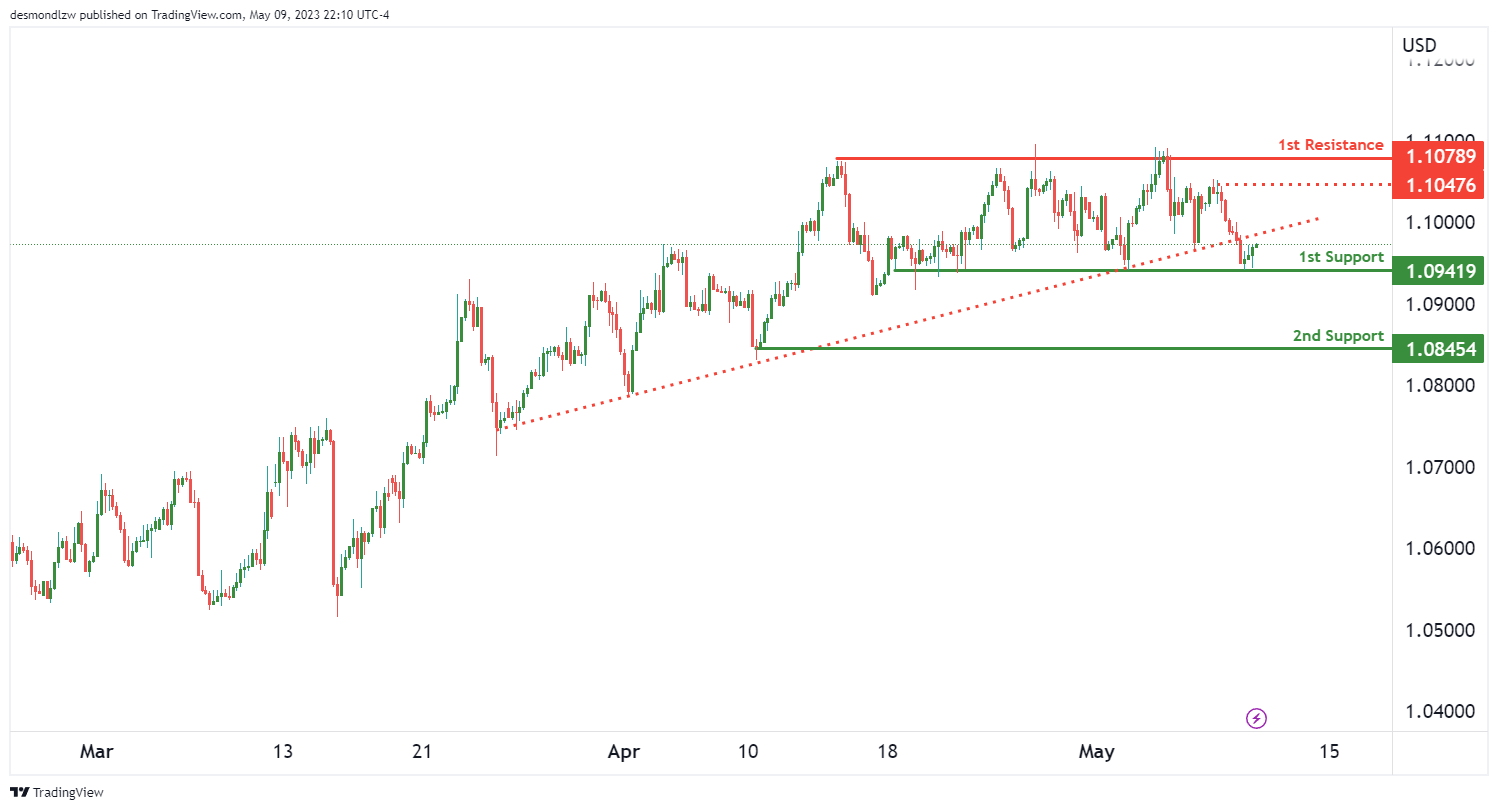
The EUR/USD chart is currently showing a bearish momentum overall, with the price having broken below an ascending support line, triggering a potential bearish move.
The 1st support level at 1.0941 is a multi-swing low support level, making it a strong level of support. Additionally, there is a swing low support level at 1.0945, which further reinforces the strength of the support levels.
However, the potential for a bearish break off the 1st support level may see the price drop towards the 2nd support level.
On the resistance side, there is a multi-swing high resistance level at 1.1078, which is a strong level of resistance that the price may struggle to break through. Additionally, there is an intermediate resistance level at 1.1047, which is another multi-swing high resistance level adding to the potential resistance that the price may face.
GBP/USD:
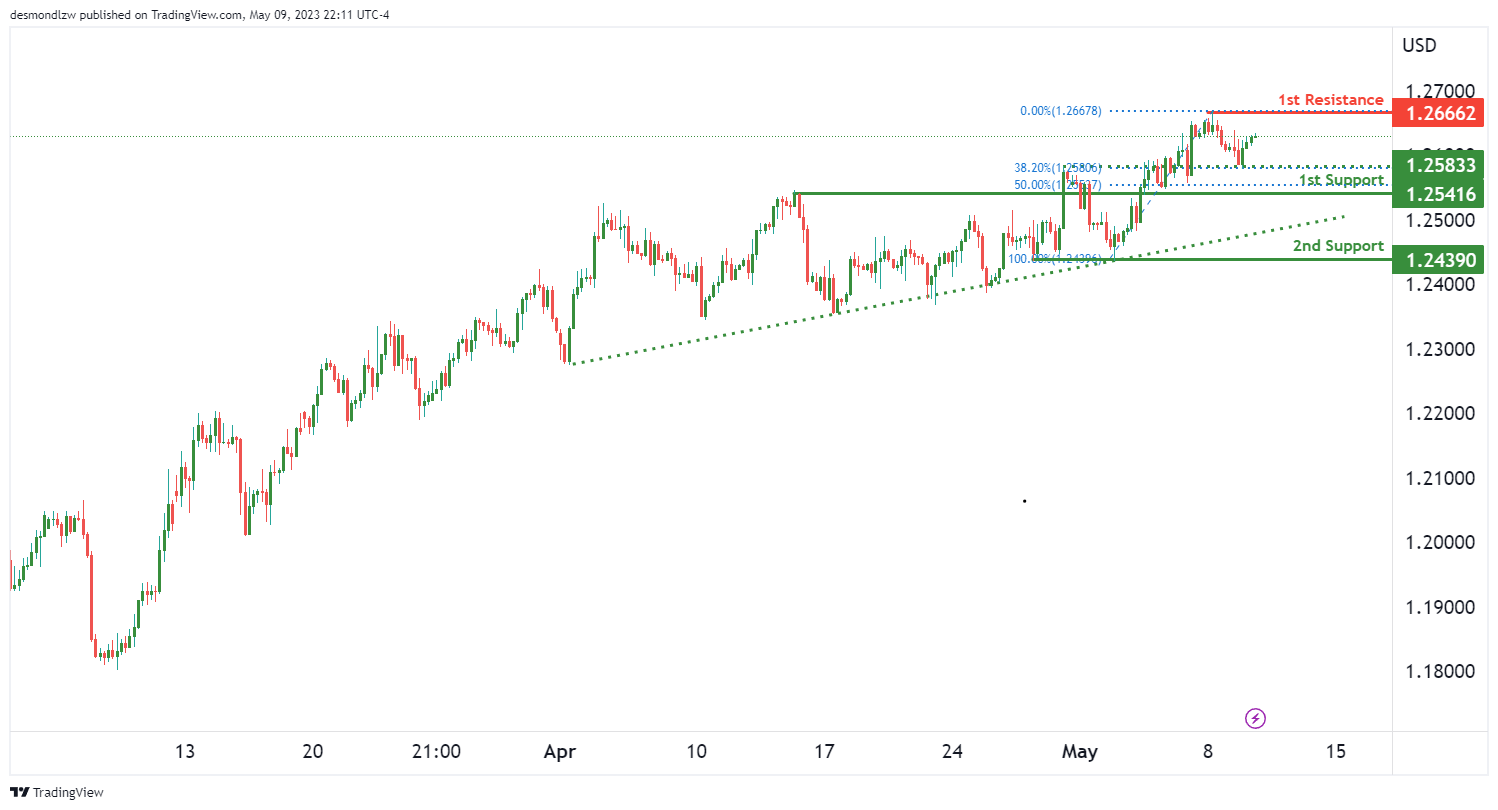
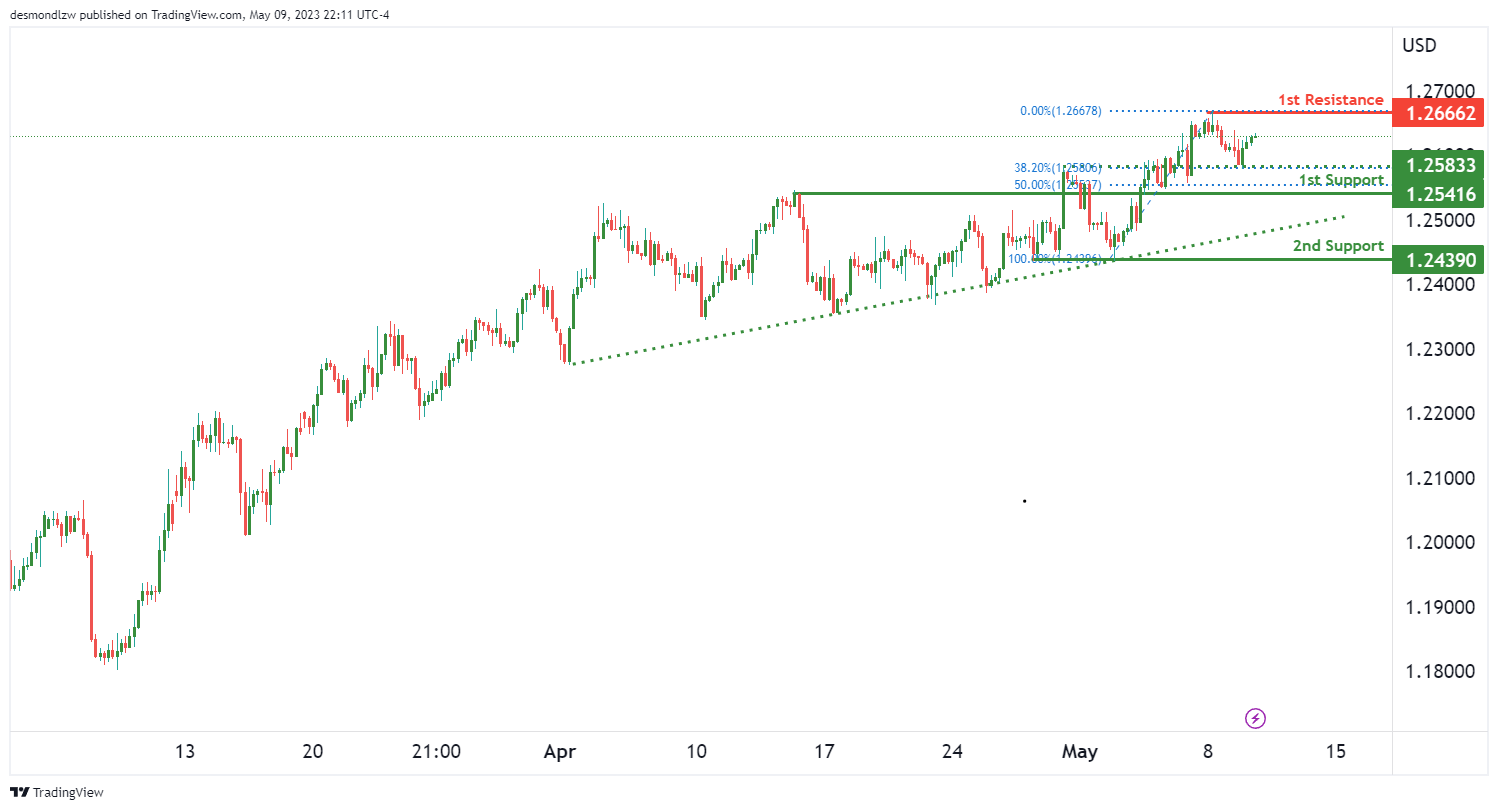
The GBP/USD chart is currently showing a bullish momentum overall, with the price being above a major ascending trend line, which suggests that further bullish momentum may be on the cards.
The 1st support level at 1.2541 is an overlap support level, with a 50% Fibonacci retracement, making it a strong level of support. Additionally, there is a multi-swing low support level at 1.2439, which further reinforces the strength of the support levels.
On the resistance side, there is a swing high resistance level at 1.2662, which is a strong level of resistance that the price may struggle to break through. Furthermore, there is an intermediate support level at 1.2583, which is an overlap support level, coinciding with a 38.20% Fibonacci retracement and adding to the potential support that the price may face.
The potential for a bullish continuation towards the 1st resistance level is seen, given the strong momentum of the chart.
It is important to note that the current price is above the major ascending trend line, suggesting that further bullish momentum may be expected.
USD/CHF:
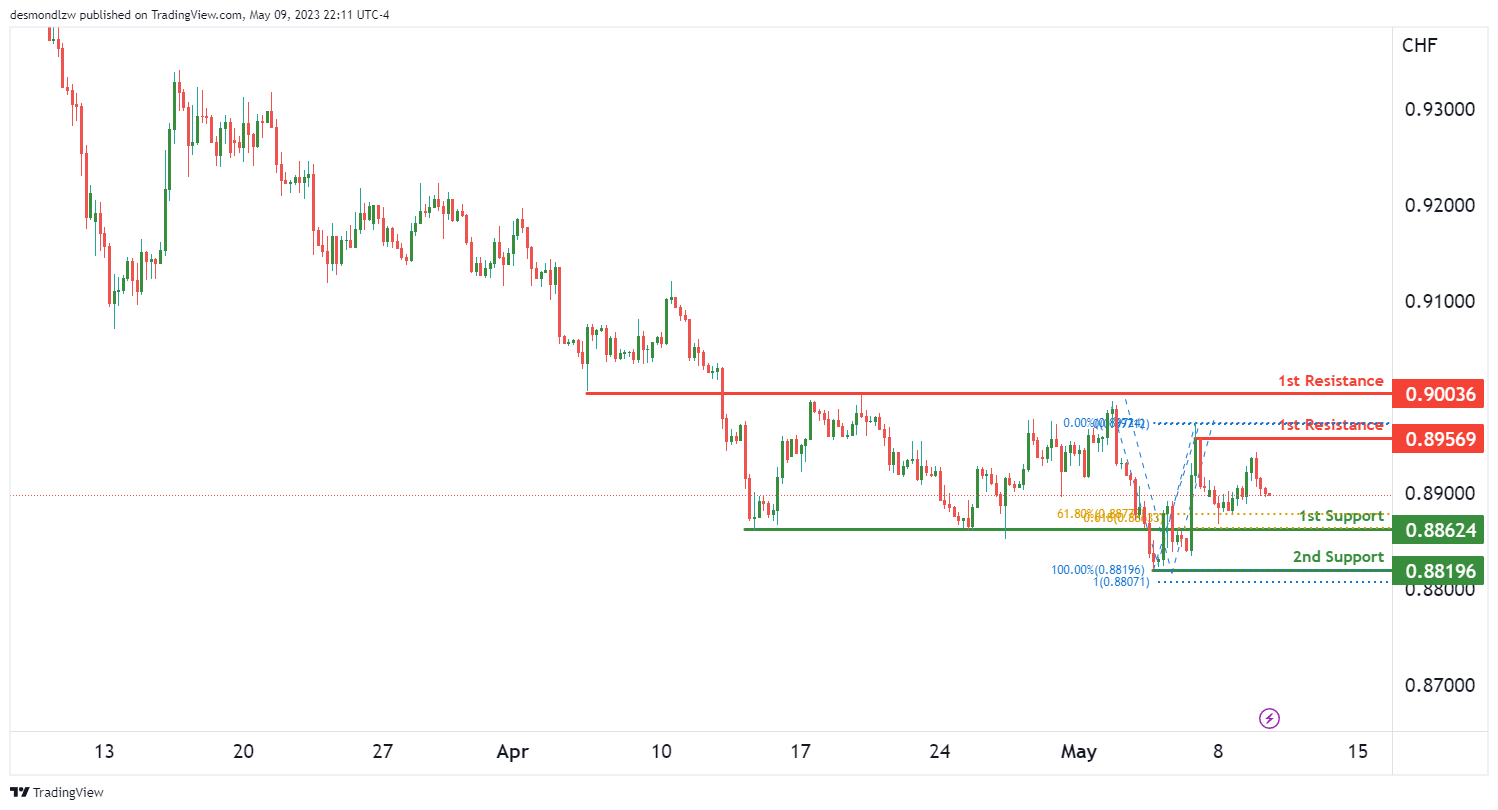
The USD/CHF chart is currently showing a bearish momentum overall, with the potential for a continuation towards the 1st support level.
The 1st support level at 0.8862 is an overlap support level, with a 61.80% Fibonacci retracement and a 61.80% Fibonacci projection, making it a strong level of support due to Fibonacci confluence. Additionally, there is a multi-swing low support level at 0.8819, which further reinforces the strength of the support levels, as it is a 100% Fibonacci projection.
On the resistance side, there is a swing high resistance level at 0.8959, which is a strong level of resistance that the price may struggle to break through. Furthermore, there is an overlap resistance level at 0.9003, which adds to the potential resistance that the price may face.
The potential for a bearish continuation towards the 1st support level is seen, given the strong momentum of the chart.
USD/JPY:
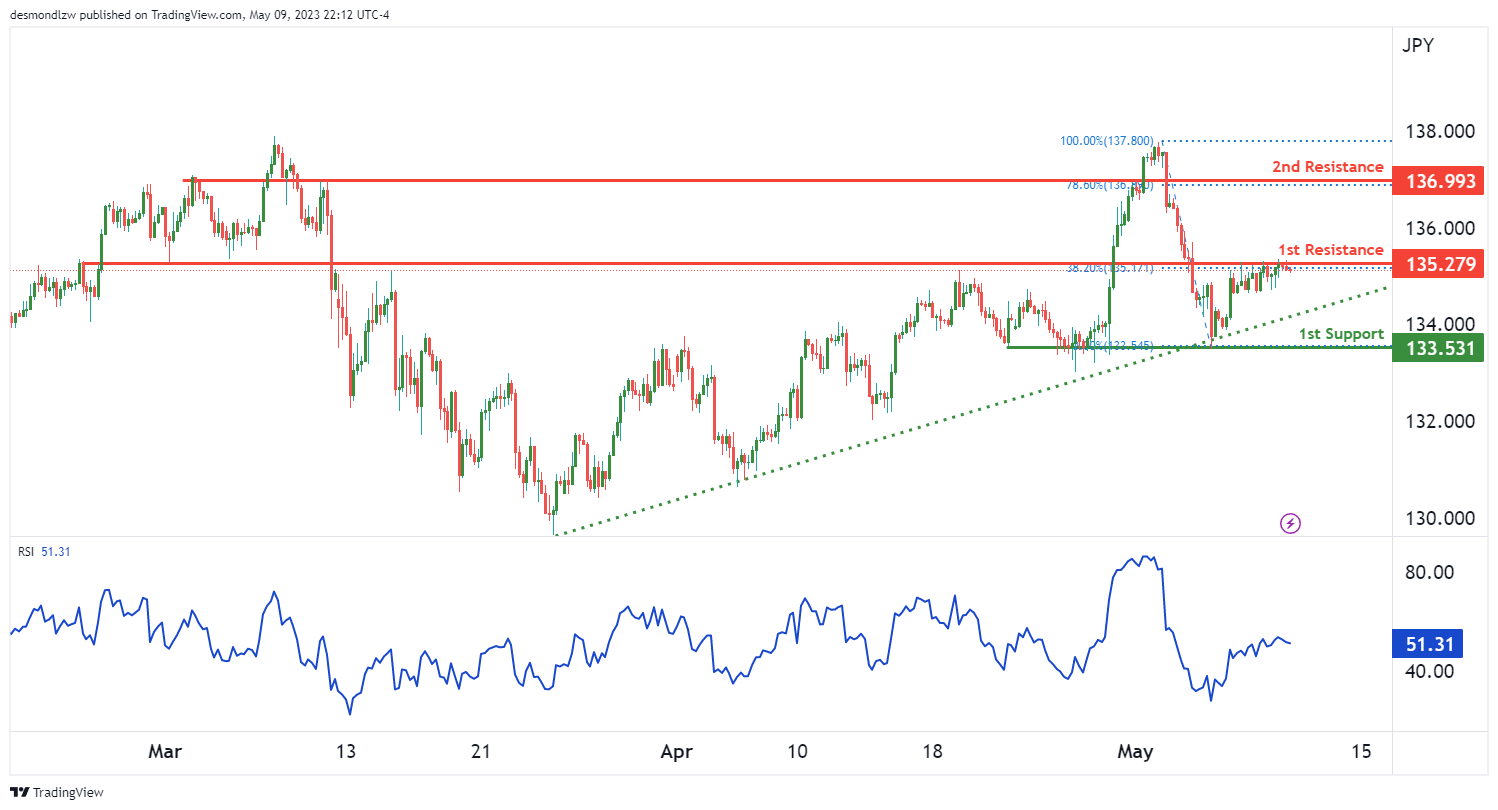
The USD/JPY chart is currently showing a bullish momentum overall, with the price being above a major ascending trend line, which suggests that further bullish momentum may be on the cards.
The 1st support level at 133.53 is a multi-swing low support level, making it a strong level of support.
On the resistance side, there is an overlap resistance level at 135.27, which is a strong level of resistance that the price may struggle to break through. Furthermore, there is another overlap resistance level at 136.99, which is a strong level of resistance and coincides with a 78.60% Fibonacci retracement.
The potential for a bullish break through of the 1st resistance level and a rise towards the 2nd resistance level is seen, given the strong momentum of the chart.
It is important to note that the current price is above the major ascending trend line, suggesting that further bullish momentum may be expected.
AUD/USD:
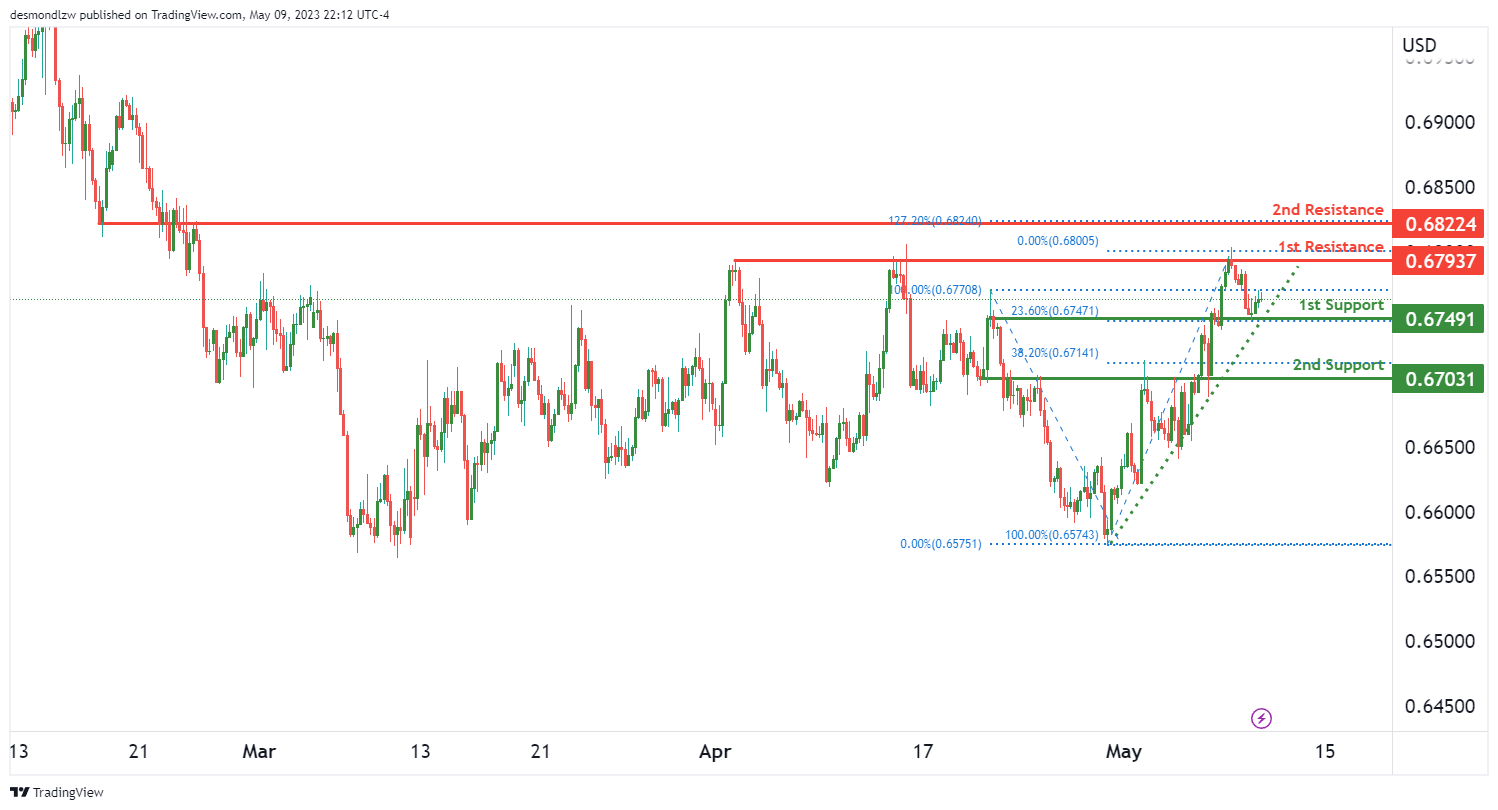
The AUD/USD chart is currently showing a bullish momentum overall, with the price being above a major ascending trend line, which suggests that further bullish momentum may be on the cards.
The 1st support level at 0.6749 is an overlap support level, with a 23.60% Fibonacci retracement, making it a strong level of support. Additionally, there is another overlap support level at 0.6703, which coincides with a 38.20% Fibonacci retracement and adds further to the potential support that the price may face.
On the resistance side, there is a multi-swing high resistance level at 0.6793, which is a strong level of resistance. Furthermore, there is an overlap resistance level at 0.6822, which coincides with a 127.20% Fibonacci extension and adds to the potential resistance that the price may face.
The potential for a bullish continuation towards the 1st resistance level is seen, given the strong momentum of the chart.
It is important to note that the current price is above the major ascending trend line, suggesting that further bullish momentum may be expected.
NZD/USD
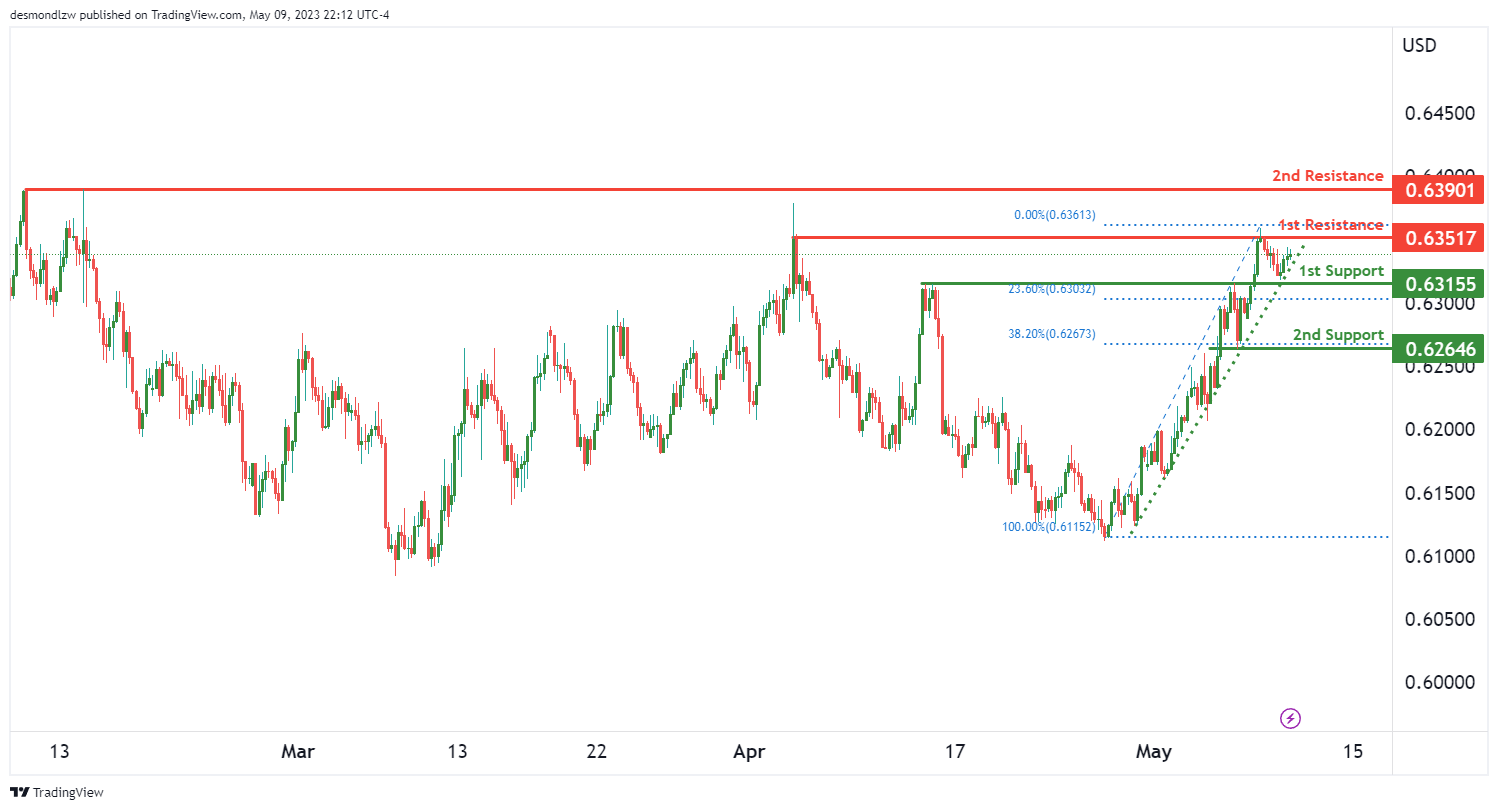
The NZD/USD chart is currently showing a bullish momentum overall, with the price being above a major ascending trend line, which suggests that further bullish momentum may be on the cards.
The 1st support level at 0.6315 is an overlap support level, with a 23.60% Fibonacci retracement, making it a strong level of support. Additionally, there is another overlap support level at 0.6264, which coincides with a 38.20% Fibonacci retracement and adds further to the potential support that the price may face.
On the resistance side, there is a multi-swing high resistance level at 0.6351, which is a strong level of resistance. Furthermore, there is an overlap resistance level at 0.6390, which adds to the potential resistance that the price may face.
The potential for a bullish continuation towards the 1st resistance level is seen, given the strong momentum of the chart.
It is important to note that the current price is above the major ascending trend line, suggesting that further bullish momentum may be expected.
USD/CAD:
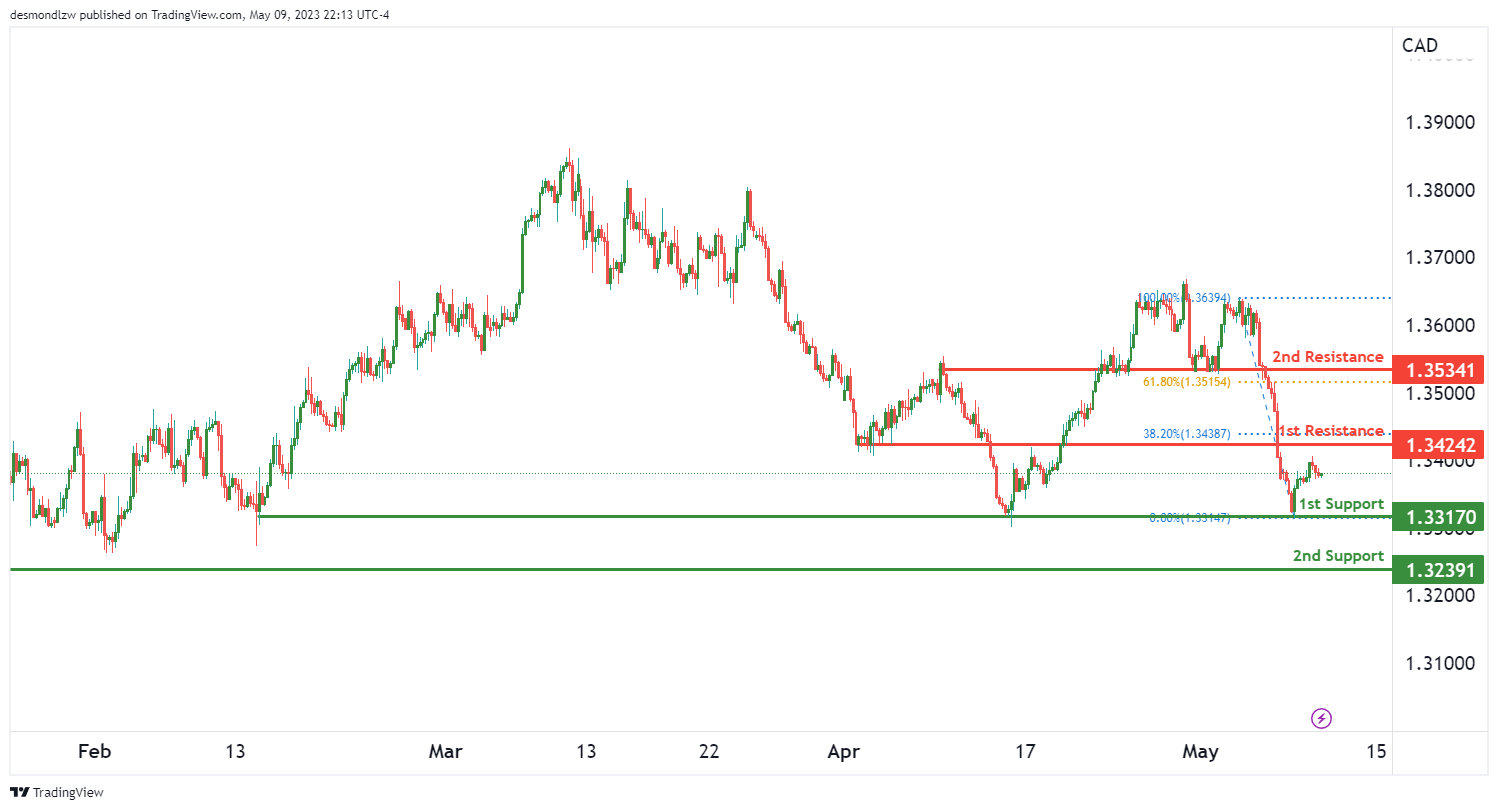
The USD/CAD chart is currently showing a bullish momentum overall, with a potential for a bullish continuation towards the 1st resistance level.
The 1st support level at 1.3317 is a multi-swing low support level, making it a strong level of support. Additionally, there is an overlap support level at 1.3239, which adds further to the potential support that the price may face.
On the resistance side, there is an overlap resistance level at 1.3424, which coincides with a 38.20% Fibonacci retracement and is a strong level of resistance. Furthermore, there is a pullback resistance level at 1.2534, which coincides with a 61.80% Fibonacci retracement and adds to the potential resistance that the price may face.
The potential for a bullish continuation towards the 1st resistance level is seen, given the bullish momentum of the chart.
It is important to note that the current momentum of the chart is bullish, suggesting that further bullish momentum may be expected.
DJ30:
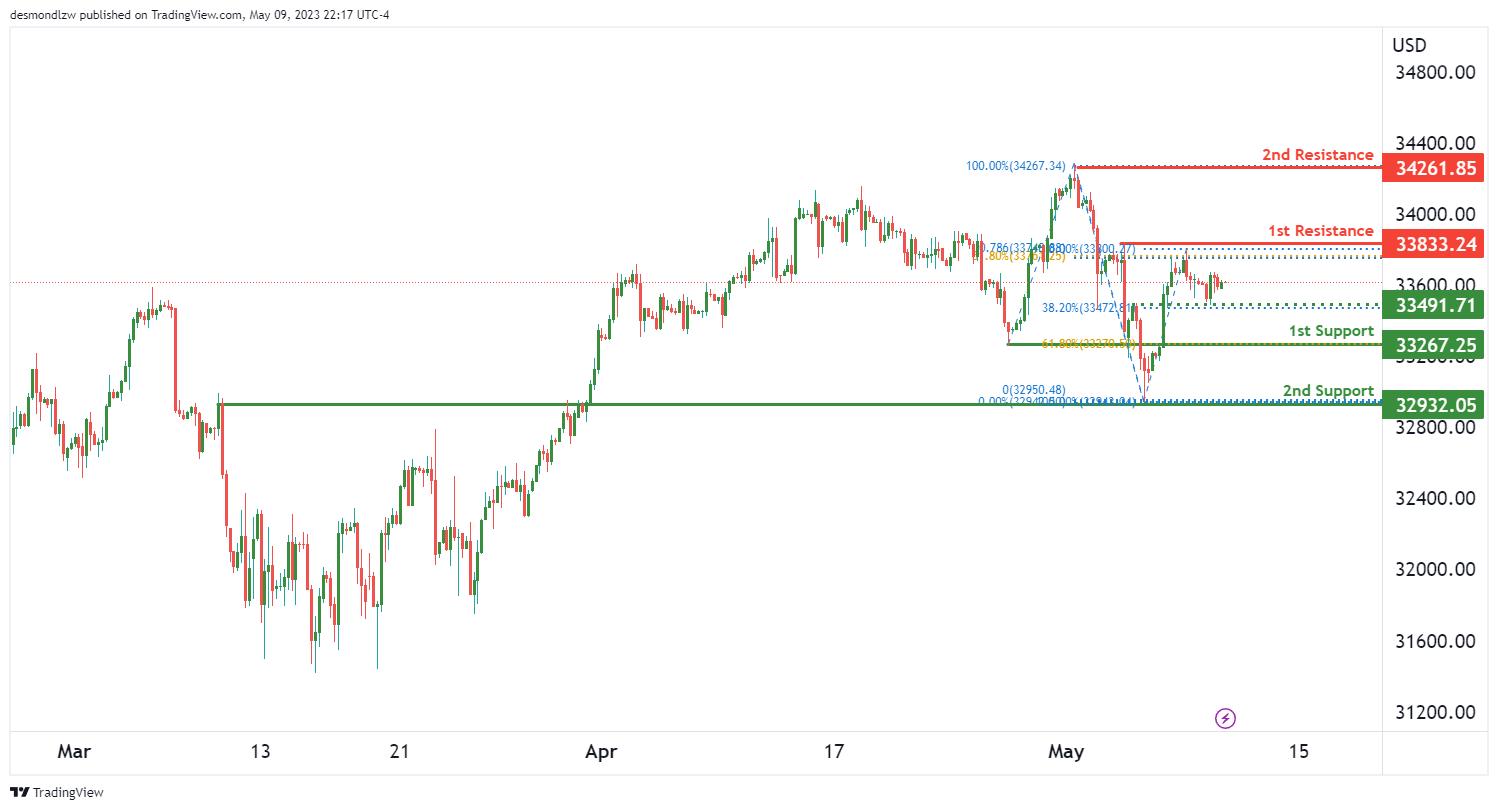
The DJ30 chart is currently showing a neutral momentum overall, with the potential for fluctuations between the 1st resistance and 1st support level.
The 1st support level at 33267.25 is a pullback support level, with a 61.80% Fibonacci retracement, making it a strong level of support. Additionally, there is an overlap support level at 32932.05, which adds further to the potential support that the price may face.
On the resistance side, there is a multi-swing high resistance level at 33833.24, which is a strong level of resistance. Furthermore, there is a swing high resistance level at 34261.85, which adds to the potential resistance that the price may face.
It is important to note that there is an intermediate support level at 33491.71, which coincides with a 38.20% Fibonacci retracement, and may act as a potential support level in case of a fluctuation.
Given the current neutral momentum of the chart, it is likely that the price may fluctuate between the support and resistance levels.
GER30:
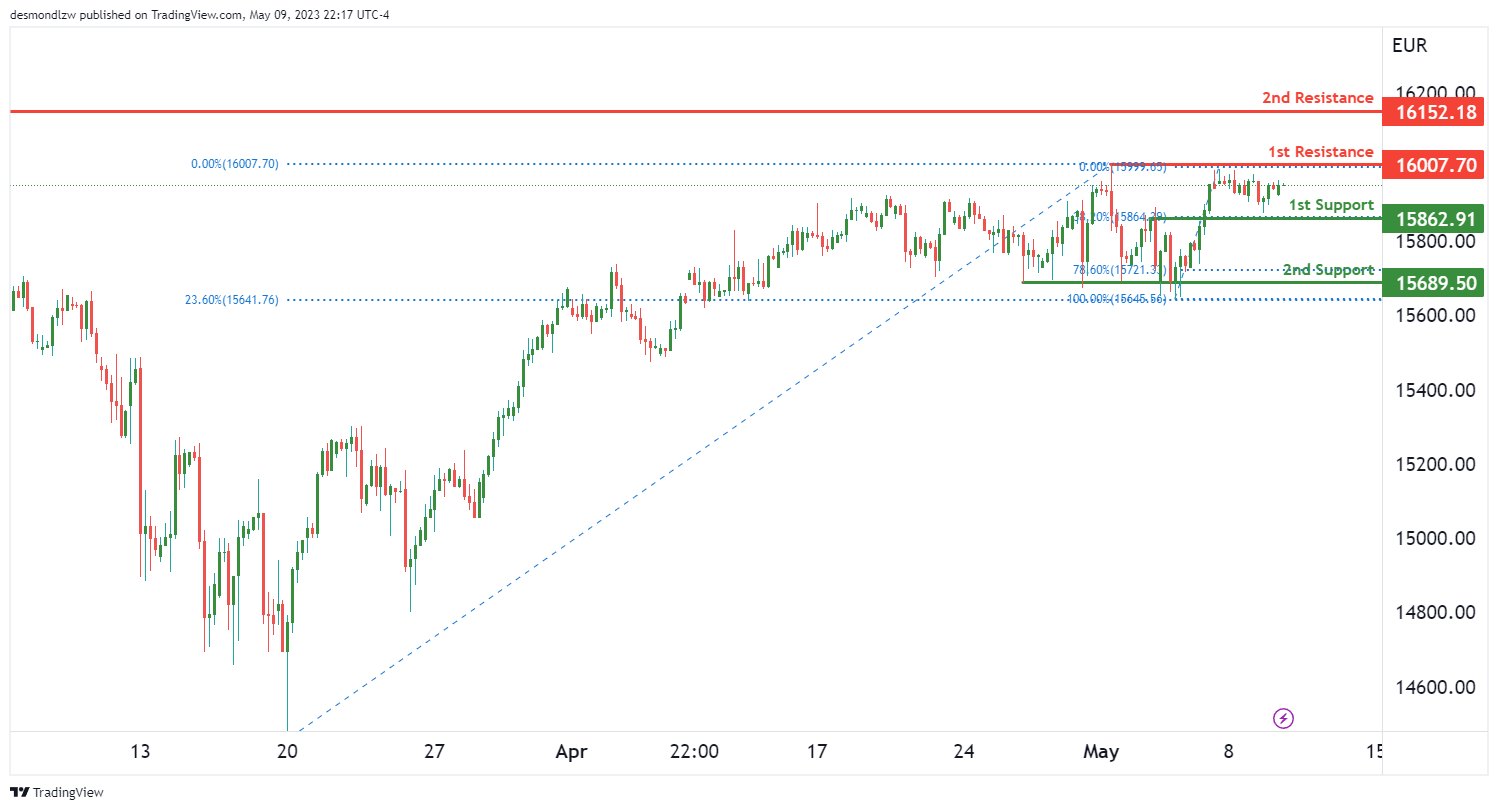
The GER30 chart is currently showing a neutral momentum overall, with the potential for fluctuations between the 1st resistance and 1st support level.
The 1st support level at 25862.91 is an overlap support level, coinciding with a 38.20% Fibonacci retracement. This makes it a strong level of support. Additionally, there is a multi-swing low support level at 15689.50, which has a 78.60% Fibonacci retracement and a 23.60% Fibonacci retracement, creating a Fibonacci confluence that further reinforces the level of support.
On the resistance side, there is a multi-swing high resistance level at 26007.70, which is a strong level of resistance. Furthermore, there is a swing high resistance level at 16152.18, which adds to the potential resistance that the price may face.
Given the current neutral momentum of the chart, it is likely that the price may fluctuate between the support and resistance levels.
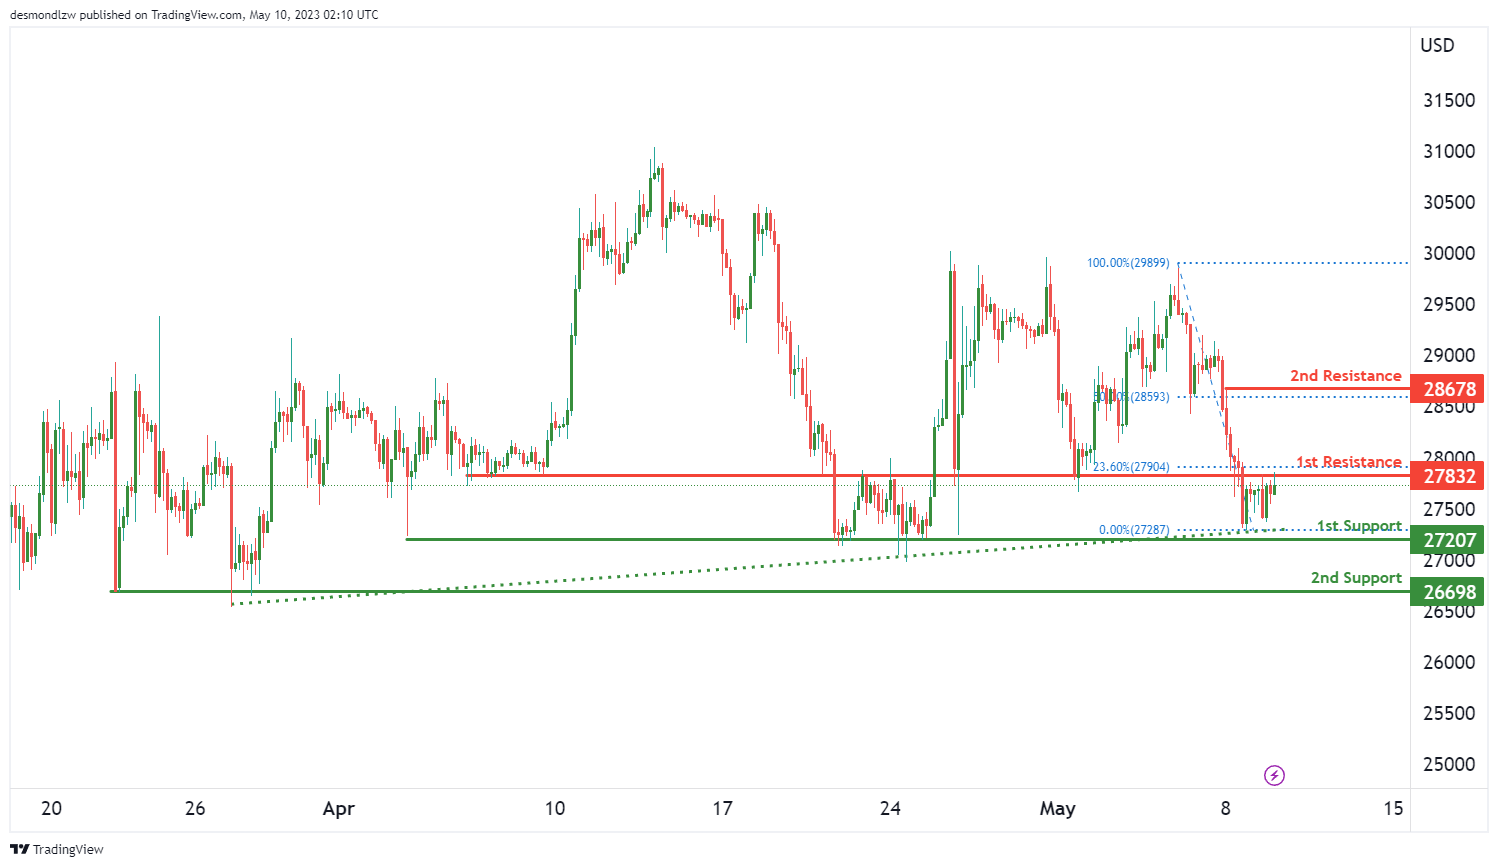
BTC/USD:
The overall momentum of the BTC/USD chart is bullish, with price currently above a major ascending trend line, suggesting that further bullish momentum is on the cards.
In the short term, price could potentially make a bullish break through of the 1st resistance at 27832 and rise to the 2nd resistance at 28678.
However, if price were to drop, the first support level is at 27207, which is a multi-swing low support. If price were to drop below this level, it could move towards the 2nd support at 26698, which is also a multi-swing low support.
It’s worth noting that the 1st resistance level is an overlap resistance and has a 23.60% Fibonacci retracement lining up with it. If price were to break through this level, it could potentially rise towards the 2nd resistance at 28678, which is a swing high resistance and coincides with a 50% Fibonacci retracement.
US500
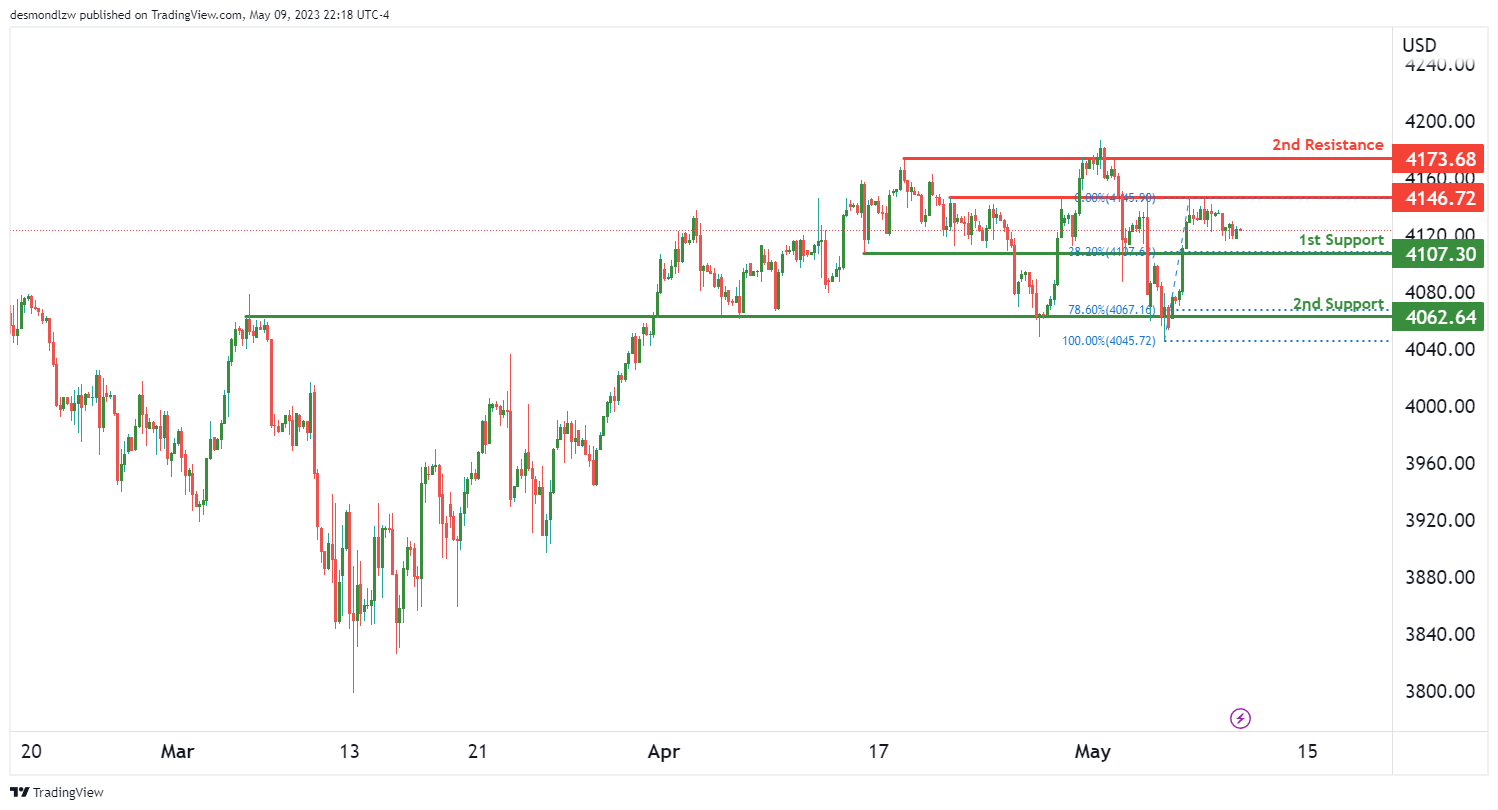
The US500 chart is currently showing bearish momentum, with potential for the price to continue dropping towards the first support level. The chart’s overall trend is bearish, with factors contributing to the momentum being a break below the ascending trend line. The price could potentially make a bearish continuation towards the first support level.
The first support level is at 4107.30 and is a good level for support as it is an overlap support and has a 38.20% Fibonacci retracement lining up with it. The second support level at 4062.64 is another good support level as it is also an overlap support and has a 78.60% Fibonacci retracement lining up with it.
In terms of resistance levels, the first resistance level is at 4146.72 and is a good level for resistance as it is an overlap resistance. The second resistance level at 4173.68 is another good resistance level as it is a multi-swing high resistance.
ETH/USD:
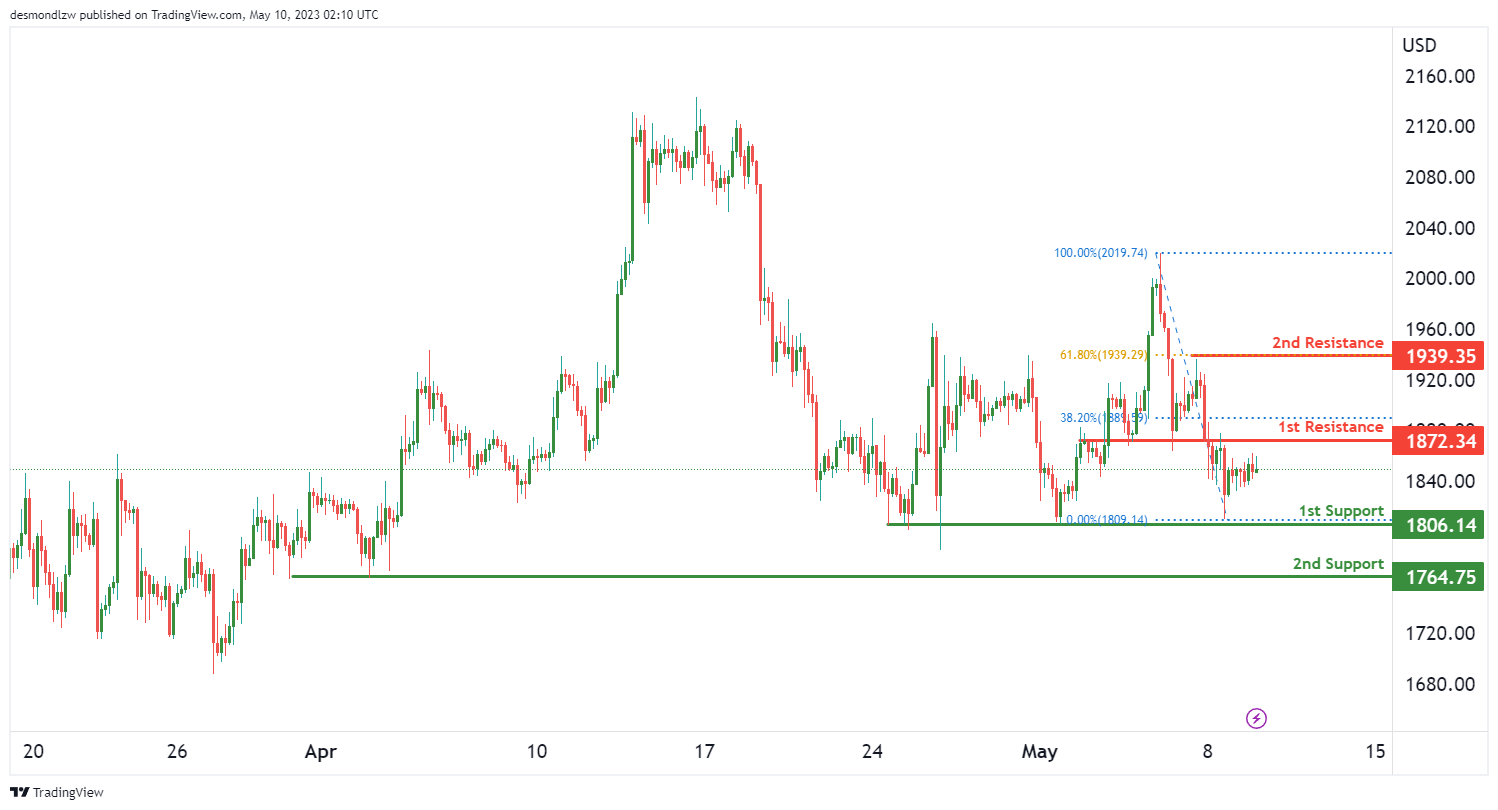
The overall momentum of the ETH/USD chart is currently neutral. However, price could potentially fluctuate between the 1st resistance and 1st support level. This suggests that there may be trading opportunities available in the cryptocurrency market.
The 1st support level is at 1806.14, which is a multi-swing low support. The 2nd support level is at 1764.75, which is another multi-swing low support. These levels could potentially act as good support levels in case the price drops.
On the other hand, the 1st resistance level is at 1872.34, which is an overlap resistance and also marks the 38.20% Fibonacci retracement level. The 2nd resistance level is at 1939.35, which is a multi-swing high resistance and also marks the 61.80% Fibonacci retracement level. These levels could potentially act as good resistance levels in case the price rises.
WTI/USD:
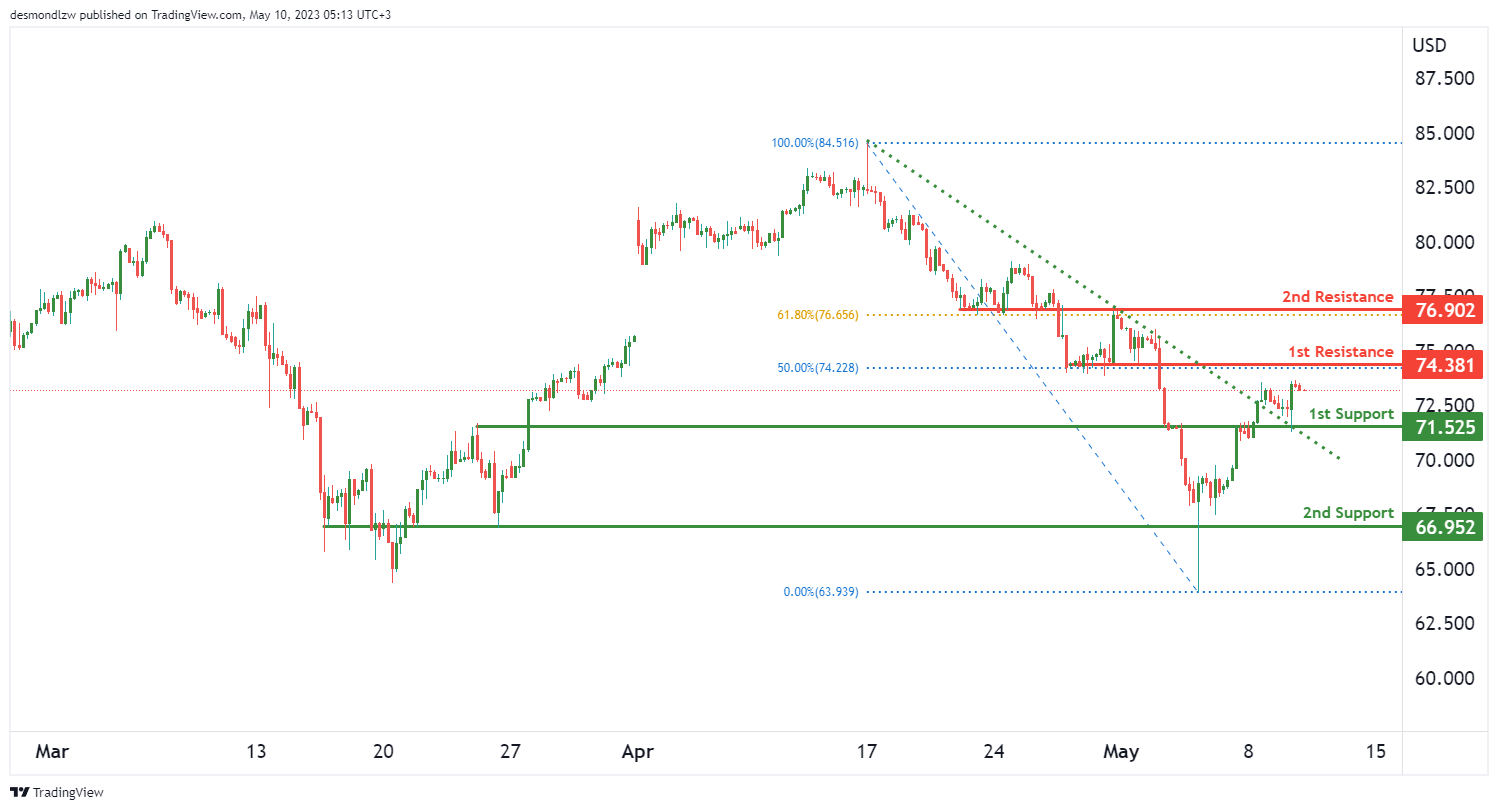
The price of WTI crude oil has been showing a bullish momentum on the chart. This is due to the fact that the price has broken above a descending resistance line, which has triggered a potential bullish move. As such, the price could potentially make a bullish continuation towards the 1st resistance level.
The 1st support level for WTI crude oil is at 71.52. This level is a good support because it is an overlap support, indicating that it has acted as both support and resistance in the past. The 2nd support level is also at 71.52 and is another overlap support.
The 1st resistance level is at 74.38. This level is a good resistance because it is a pullback resistance and also coincides with the 50% Fibonacci retracement level. This indicates that there may be selling pressure at this level. The 2nd resistance level is at 76.90 and is also an overlap resistance. It coincides with the 61.80% Fibonacci retracement level, which adds further confluence to this level.
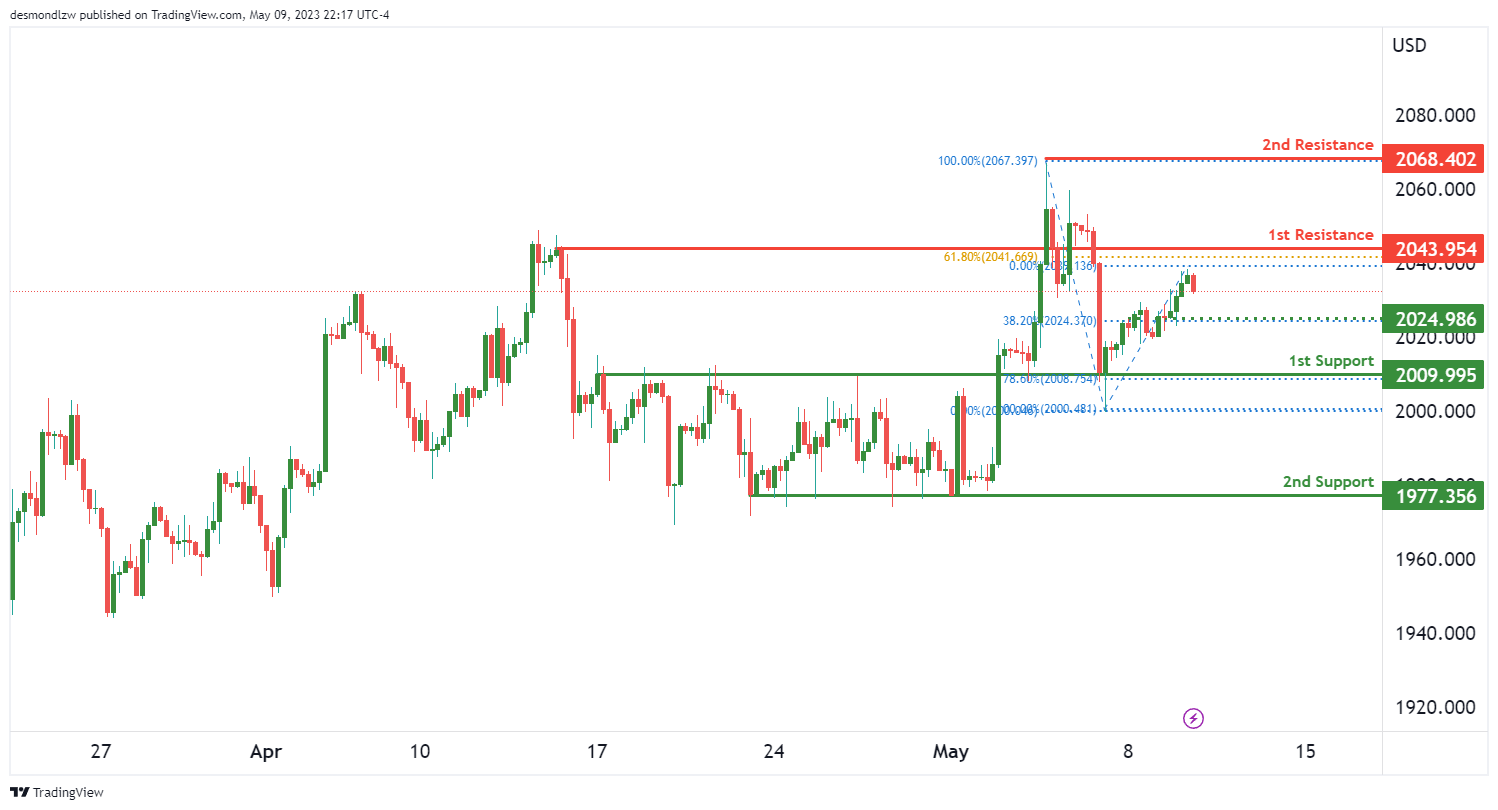
XAU/USD (GOLD):
Gold, represented by XAU/USD, has been in a bearish momentum, indicating that sellers have been in control of the market. The price has the potential to continue dropping towards the first support level.
The first support level is at 2009.99, which is an overlap support level and coincides with the 78.60% Fibonacci retracement level. This level has been tested multiple times in the past and has held as a strong support level.
The second support level is at 1977.35, which is a multi-swing low support level. This level has also been tested multiple times in the past and has held as a strong support level.
On the other hand, the first resistance level is at 2043.95, which is a pullback resistance level and coincides with the 61.80% Fibonacci retracement level. This level has been tested multiple times in the past and has held as a strong resistance level.
The second resistance level is at 2068.40, which is a swing high resistance level. This level has also been tested multiple times in the past and has held as a strong resistance level.
If the price manages to break through the first resistance level, it could potentially rise towards the second resistance level. However, the overall bias remains bearish, and a continuation of the downward trend towards the support levels is more likely.
An intermediate support level at 2024.98, which is an overlap support level coinciding with the 38.20% Fibonacci retracement level, could provide a temporary pause in the downward trend.
AUD/USD Daily Report
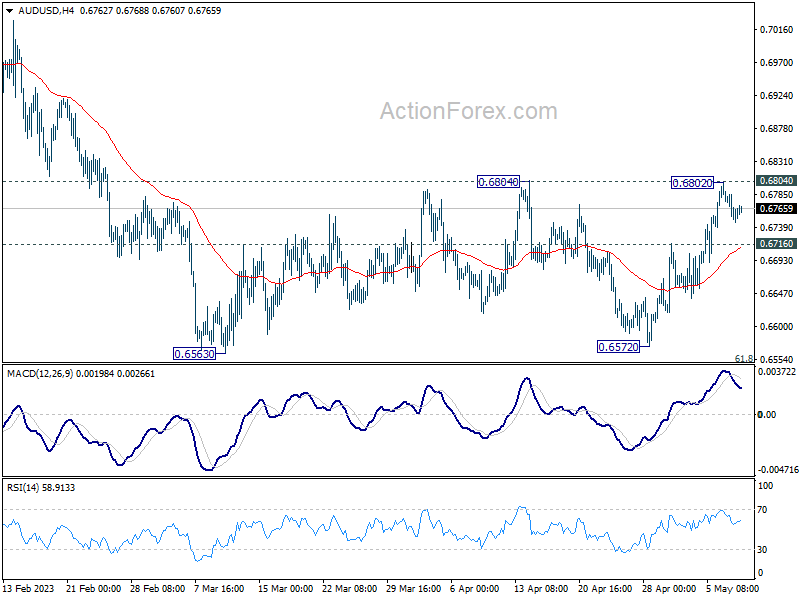
Daily Pivots: (S1) 0.6744; (P) 0.6766; (R1) 0.6786; More...
Intraday bias in AUD/USD is turned neutral with current retreat. On the upside, decisive break of 0.6804 resistance will indicate completion of whole fall from 0.7156, and turn near term outlook bullish for retesting this high. However, break of 0.6716 minor support will indicate rejection by 0.6804. That would retain near term bearishness, and turn bias back to the downside for retesting 0.6563/72 support zone, with prospect of resuming the whole decline from 0.7156.
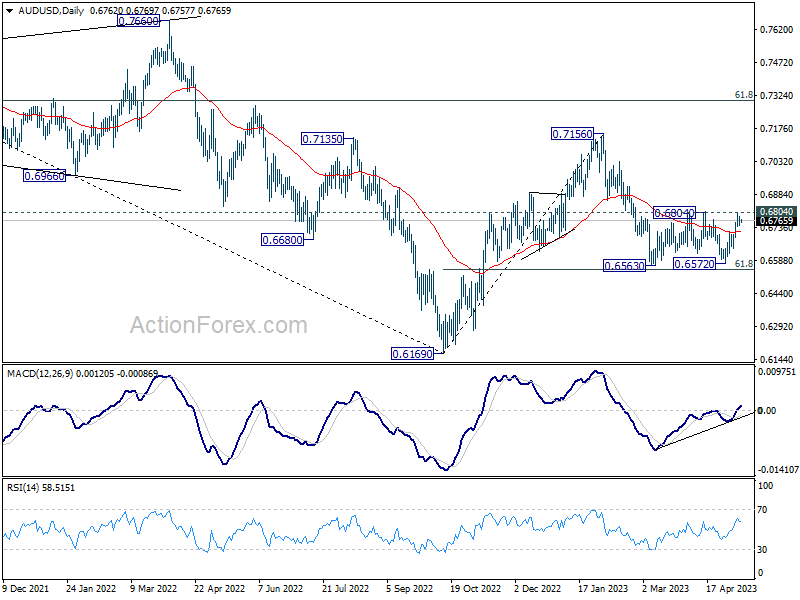
In the bigger picture, as long as 61.8% retracement of 0.6169 to 0.7156 at 0.6546 holds, the decline from 0.7156 is seen as a correction to rally from 0.6169 (2022 low) only. Another rise should still be seen through 0.7156 at a later stage. However, sustained break of 0.6546 will raise the chance of long term down trend resumption through 0.6169 low.
Dollar Mixed Ahead of US Consumer Inflation Data, Stocks Resilient
Dollar is trading mixed in Asian session today as market participants eagerly anticipate April's consumer inflation data from the US. The much-anticipated meeting between US President Joe Biden and Republican House Speaker Kevin McCarthy unfolded as expected, with no resolution on the government's self-imposed USD 31.4T debt limit. This issue, if unresolved, could plunge the country into an unprecedented default in as few as three weeks. However, both parties agreed to continue discussions and reconvene on Friday.
At this time, New Zealand and Australian dollars remain the week's strongest performers. However, their upward momentum appears to be stalling at resistance levels against the greenback and Euro. Despite consistent hawkish remarks from ECB officials, Euro remains the weakest performer. Japanese Yen follows closely, trailed by Canadian dollar. Sterling is showing mixed performance as traders maintain a holding pattern in anticipation of tomorrow's BoE rate decision.
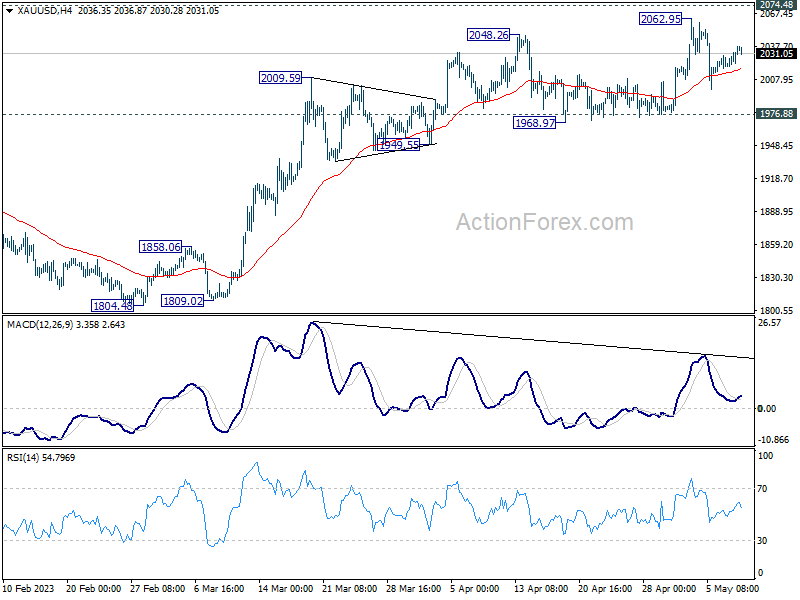
From a technical standpoint, it appears that gold isn't quite ready to shatter 2074.48 record high yet. It's likely to see another fall in the consolidation from 2062.95. Yet, as long as 1,976.88 support level holds, near-term outlook remains bullish, with an eventual upside breakout anticipated. However, given bearish divergence condition in the 4H MACD, firm break of 1976.88 could trigger deeper near term correction.
In Asia, at the time of writing, Nikkei is down -0.52%. Hong Kong HSI is down -0.72%. China Shanghai SSE is down -1.40%. Singapore Strait Times is up 0.12%. Japan 10-year JGB yield is down -0.0069 at 0.418. Overnight, DOW dropped -0.17%. S&P 500 dropped -0.46%. NASDAQ dropped -0.63%. 10-year yield closed flat at 3.521.
Fed Williams: Not my baseline to cut interest rates this year
New York Fed President John Williams maintained a hawkish stance on Fed's monetary policy, asserting the necessity of persisting with rate hikes to control surging inflation.
"We haven't said we are done raising rates," Williams stated yesterday, emphasizing that future decisions would be data-driven, aligning with Fed's goals. He stressed, "We've made incredible progress" on tackling inflation, but left the door open for further policy tightening, saying, "if additional policy firming is appropriate, we'll do that."
Williams projected that a restrictive monetary policy stance would be necessary for an extended period to curb inflation from 4% to the targeted 2%. He denied any likelihood of rate cuts in the current year, quashing speculations of such a move. He said, "I do not see in my baseline forecast any reason to cut interest rates this year."
Addressing the inflation conundrum, Williams declared price pressures "too high" and acknowledged a discrepancy between demand and supply, with the former outpacing the latter. He noted signs of a "gradual cooling in the demand for labor," as well as for certain goods and commodities, yet emphasized that these were outweighed by the overall demand-supply mismatch.
ECB Schnabel: Tightening to continue until clear sustained decline in core inflation
Executive Board member Isabel Schnabel reaffirmed the bank's commitment to stringent measures to restore inflation to 2% target during an event in Frankfurt yesterday. Citing current data, she stated, "there is no doubt that we have to do more to bring inflation back to our 2% target in a timely manner."
Schnabel emphasized ECB's readiness to "raise rates decisively until it becomes clear that core inflation is also declining on a sustained basis." This stance aligns with recent remarks by ECB President Christine Lagarde, who Schnabel notes, "has made it absolutely clear that the slowdown in rate hikes is not an indication that we'll stop raising rates any time soon."
Contrary to market expectations for potential rate cuts this year, Schnabel argued such predictions were "highly unlikely for the foreseeable future," pointing to the likelihood of prolonged high rates.
She observed that inflation momentum in Eurozone remained high for all items except energy, and price pressures were spreading across most consumption basket components. Despite the fading supply-side shocks from bottlenecks and energy prices, Schnabel highlighted the strength of the labor market, the uptick in wage growth, and high corporate profit margins. These factors underline the complex economic the ECB must navigate to achieve its inflation target.
US consumer inflation in focus as investors gauge Fed's next move
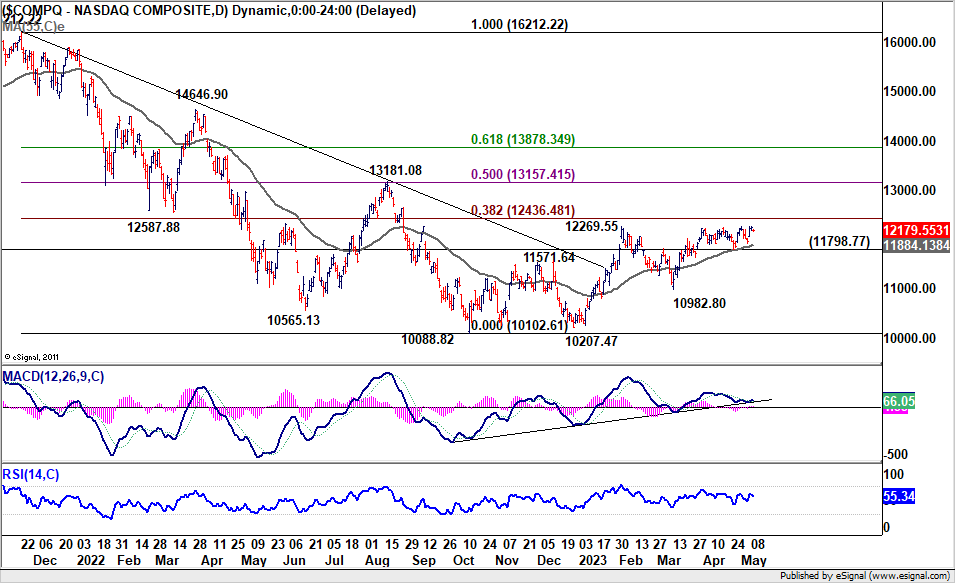
Today's spotlight is on US consumer inflation data, which is expected to show that headline CPI remained unchanged at 5.0% yoy in April, after falling for nine straight months. Core CPI, which excludes volatile food and energy prices, is predicted to slightly drop from 5.6% yoy to 5.5% yoy. Both the trajectory of inflation and unfolding regional bank issues in the US will play a critical role in Fed decision-making about the peak interest rate in the current cycle (if it hasn't been reached yet) and the timing of the first rate cut.
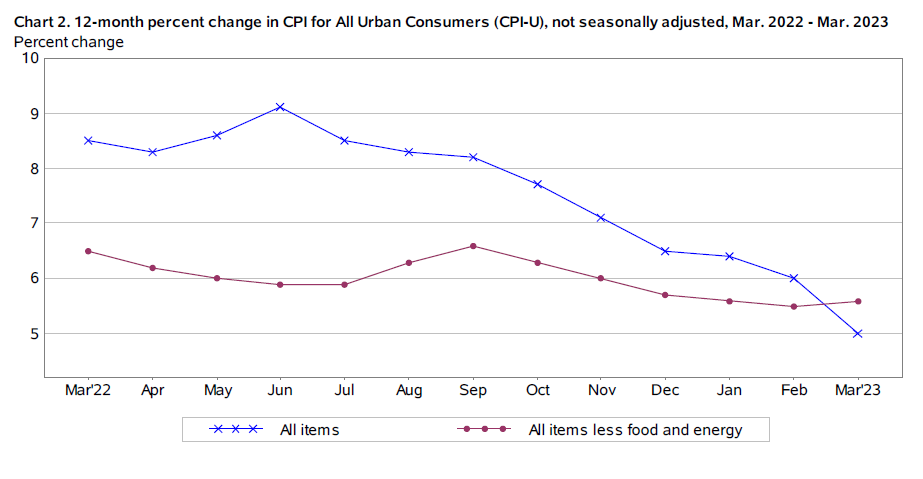
Current fed funds futures data suggests a 78.8% probability that Fed will maintain interest rate at 5.00-5.25% following FOMC meeting on June 14. There's a 21.2% chance of an additional 25bps hike to 5.25-5.50%. Notably, there's a 63.8% likelihood of a rate cut beginning in September, marking the start of a potential loosening cycle.
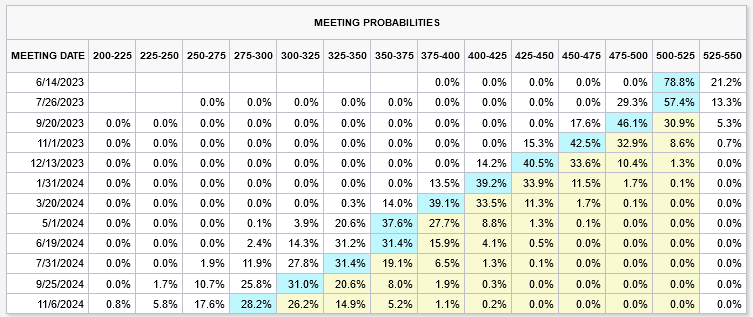
Despite these uncertainties, investor sentiment remains relatively resilient, with major stock indexes preserving their near-term bullish trajectories. NASDAQ, for instance, is expected to continue rallying as long as 11798.77 support level holds. The key test, however, will be 8.2% retracement of 16212.22 to 10088.82 at 12436.48. Decisive break above this level could trigger further rallies towards 13181.08 cluster resistance level (50% retracement at 13157.41) and possibly beyond.
Conversely, if NASDAQ breaks below 11798.77 support level, it would suggest a rejection by 12436.48 Fibonacci resistance level, possibly triggering a deeper decline towards 10982.80 and potentially retesting 10088.82 low.
As always, these movements in risk sentiment will likely have a correlated impact on currency market trends.
Elsewhere
Germany will release April CPI final, together with Italy industrial output in European session.
AUD/USD Daily Report
Daily Pivots: (S1) 0.6744; (P) 0.6766; (R1) 0.6786; More...
Intraday bias in AUD/USD is turned neutral with current retreat. On the upside, decisive break of 0.6804 resistance will indicate completion of whole fall from 0.7156, and turn near term outlook bullish for retesting this high. However, break of 0.6716 minor support will indicate rejection by 0.6804. That would retain near term bearishness, and turn bias back to the downside for retesting 0.6563/72 support zone, with prospect of resuming the whole decline from 0.7156.
In the bigger picture, as long as 61.8% retracement of 0.6169 to 0.7156 at 0.6546 holds, the decline from 0.7156 is seen as a correction to rally from 0.6169 (2022 low) only. Another rise should still be seen through 0.7156 at a later stage. However, sustained break of 0.6546 will raise the chance of long term down trend resumption through 0.6169 low.
Economic Indicators Update
| GMT | Ccy | Events | Actual | Forecast | Previous | Revised |
|---|---|---|---|---|---|---|
| 05:00 | JPY | Leading Economic Index Mar P | 97.90% | 98.00% | ||
| 06:00 | EUR | Germany CPI M/M Apr F | 0.40% | 0.40% | ||
| 06:00 | EUR | Germany CPI Y/Y Apr F | 7.20% | 7.20% | ||
| 08:00 | EUR | Italy Industrial Output M/M Mar | 0.20% | -0.20% | ||
| 12:30 | CAD | Building Permits M/M Mar | 2.30% | 8.60% | ||
| 12:30 | USD | CPI M/M Apr | 0.40% | 0.10% | ||
| 12:30 | USD | CPI Y/Y Apr | 5.00% | 5.00% | ||
| 12:30 | USD | CPI Core M/M Apr | 0.30% | 0.40% | ||
| 12:30 | USD | CPI Core Y/Y Apr | 5.50% | 5.60% | ||
| 14:30 | USD | Crude Oil Inventories | -2.2M | -1.3M |
US consumer inflation in focus as investors gauge Fed’s next move
Today's spotlight is on US consumer inflation data, which is expected to show that headline CPI remained unchanged at 5.0% yoy in April, after falling for nine straight months. Core CPI, which excludes volatile food and energy prices, is predicted to slightly drop from 5.6% yoy to 5.5% yoy. Both the trajectory of inflation and unfolding regional bank issues in the US will play a critical role in Fed decision-making about the peak interest rate in the current cycle (if it hasn't been reached yet) and the timing of the first rate cut.
Current fed funds futures data suggests a 78.8% probability that Fed will maintain interest rate at 5.00-5.25% following FOMC meeting on June 14. There's a 21.2% chance of an additional 25bps hike to 5.25-5.50%. Notably, there's a 63.8% likelihood of a rate cut beginning in September, marking the start of a potential loosening cycle.
Despite these uncertainties, investor sentiment remains relatively resilient, with major stock indexes preserving their near-term bullish trajectories. NASDAQ, for instance, is expected to continue rallying as long as 11798.77 support level holds. The key test, however, will be 8.2% retracement of 16212.22 to 10088.82 at 12436.48. Decisive break above this level could trigger further rallies towards 13181.08 cluster resistance level (50% retracement at 13157.41) and possibly beyond.
Conversely, if NASDAQ breaks below 11798.77 support level, it would suggest a rejection by 12436.48 Fibonacci resistance level, possibly triggering a deeper decline towards 10982.80 and potentially retesting 10088.82 low.
As always, these movements in risk sentiment will likely have a correlated impact on currency market trends.
Bitcoin Price At Risk of Downside Break, US CPI Next
Key Highlights
- Bitcoin price started a fresh decline below $29,000.
- BTC traded below a key contracting triangle with support at $28,200 on the 4-hour chart.
- EUR/USD failed to climb further higher and corrected gains.
- The US Consumer Price Index is likely to remain at 5% in April 2023 (YoY).
Bitcoin Price Technical Analysis
Bitcoin price struggled to clear the $30,000 resistance zone. BTC/USD formed a short-term top near $29,650 and started a fresh decline.
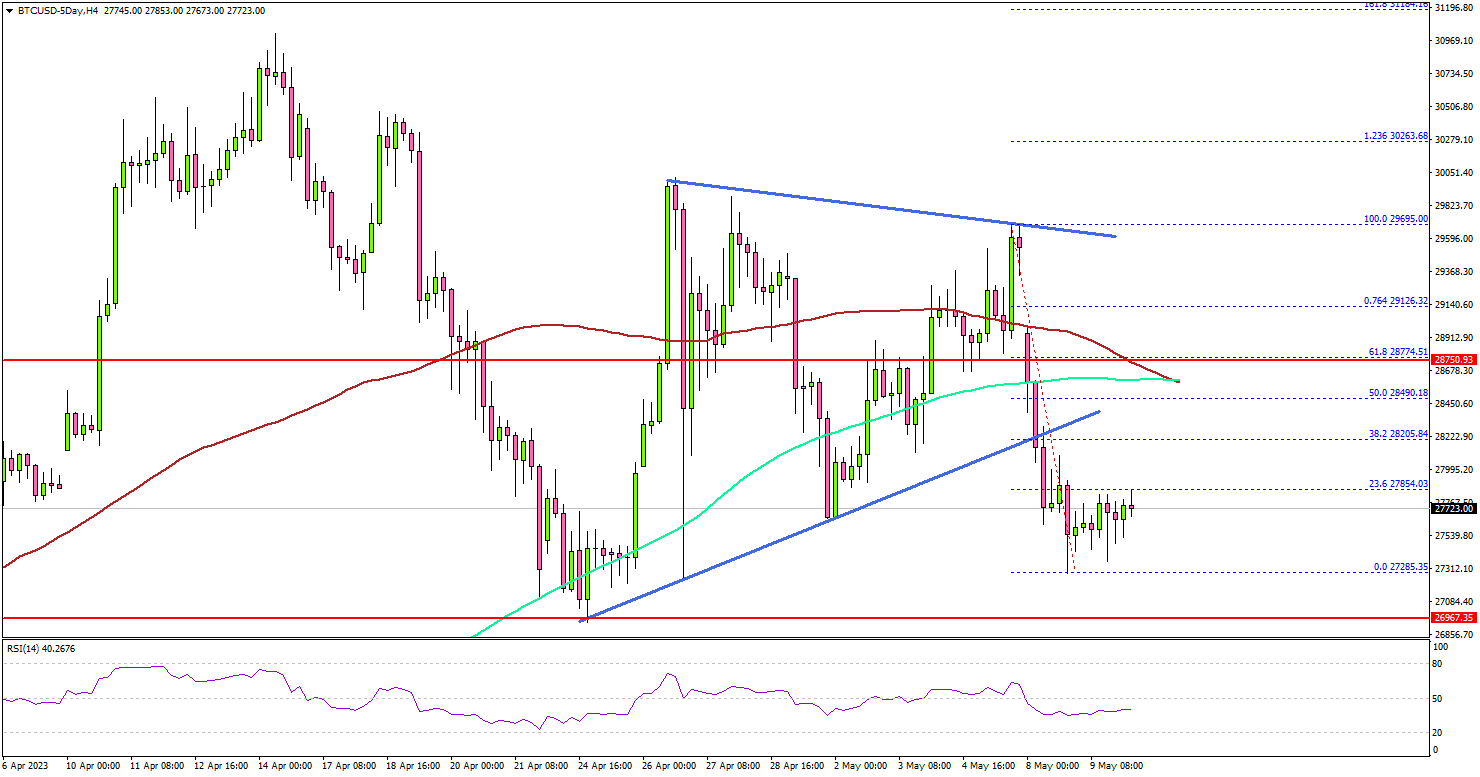
Looking at the 4-hour chart, the price declined below the $29,200 and $29,000 support levels. There was a move below the $28,500 support, the 100 simple moving average (red, 4 hours), and the 200 simple moving average (green, 4 hours).
Besides, BTC traded below a key contracting triangle with support at $28,200 on the same chart. The price is now showing bearish signs and might soon revisit the $27,000 support.
If there is a downside break and a close below $27,000, bitcoin might start another decline in the coming days toward $26,000 or even $25,500.
On the upside, the price is facing resistance near the $28,200 level. The first major resistance is near the $28,750 level (a multi-touch zone) and the 100 simple moving average (red, 4 hours).
A successful close above the $28,750 level might spark another bullish wave. In the stated case, the price may perhaps rise toward the $30,000 level.
Economic Releases
- US Consumer Price Index for April 2023 (MoM) – Forecast +0.4%, versus +0.4% previous.
- US Consumer Price Index for April 2023 (YoY) – Forecast +5%, versus +5% previous.
- US Consumer Price Index Ex Food & Energy for April 2023 (YoY) – Forecast +5.5%, versus +5.6% previous.