Sample Category Title
ECB Lagarde: We still have more ground to cover
ECB President Christine Lagarde said in a Nikkei interview, "we are determined to tame inflation, to bring it back to our 2% medium-term target in a timely manner." She acknowledged that "we have made a sizable adjustment already. But we still have more ground to cover".
Highlighting the importance of data, Lagarde said, "Our reaction function will be anchored in the inflation outlook, the dynamics of underlying inflation and the strength of monetary policy transmission, and this will dictate our decisions going forward."
She emphasized ECB's focus on headline inflation as the critical measure to ensure price stability. "That's our thermometer, that's what we are committed to doing," she stated.
However, Lagarde also pointed to the relevance of additional inflation measures. "Core" inflation is one such measure, but others exist, such as those that exclude more volatile items or focus more on domestic inflation pressures.
She explained, "It's to arrive at the 'heart' of inflation, the most persistent element in those price indexes that can help us understand where headline inflation is likely to settle in the medium term."
Lagarde cautioned that significant upside risks to inflation outlook still exist, and the path of inflation remains uncertain. Therefore, she stressed the need for the ECB to be "extremely attentive to those potential risks."
ECB Stournaras: We can’t yet say how many more rate hikes will happen
In an interview with Greece's Imerisia, ECB Governing Council member Yannis Stournaras indicated that while the end of the tightening cycle was in sight, it was not yet complete.
"We're close to the end," Stournaras remarked. But, "we're not there yet, so I agree with Madame Lagarde that we still have some distance to go."
Stournaras acknowledged the inherent uncertainty in projecting the number of additional rate hikes, with such decisions being heavily influenced by inflation forecasts, economic growth and the state of financial conditions.
"We can't yet say how many more rate hikes will happen," he said, tempering expectations for a concrete timeline. "As things stand today and if nothing dramatically changes, we can say that in 2023 rate hikes will end."
He also emphasized the persistence of current or potentially higher rates, a measure deemed necessary until inflation approaches the 2% target. "Rates will remain where they are today or higher for some time until inflation comes very close to the 2% target," he clarified.
ECB Nagel: We’re coming to the home stretch, but we need to stay stubborn
In an interview with Deutschlandfunk radio, Bundesbank President Joachim Nagel painted a cautiously optimistic picture of ECB's monetary policy landscape, implying that restrictive measures were beginning to bear fruit.
"We're coming to the home stretch in the sense that we are reaching the area in monetary policy that's considered restrictive," Nagel noted, suggesting that ECB's tightened policy stance was close to hitting its intended mark. He asserted his confidence that the monetary policy was indeed manifesting its effect.
However, he was quick to emphasize that ECB's task was far from complete. "But we are not done hiking yet," he added, "There is still work to be done on core inflation."
Nagel emphasized the importance of staying the course with the current monetary policy, urging persistence. "We need to stay stubborn," he said, reinforcing his commitment to seeing the central bank's measures through.
Addressing concerns about the potential impact of the ongoing banking sector upheaval in the US on German banks, Nagel sought to allay fears. "German banks are in a fundamentally solid position," he assured, indicating that he did not share the prevailing apprehensions over the stability of German banks.
BoJ Ueda: Too early to discuss exit strategy from massive stimulus
In an address to parliament today, BoJ Governor Kazuo Ueda stressed that it is premature to debate the specifics about exit strategy from the substantial stimulus program, which includes unloading its extensive holdings of exchange-traded funds.
He asserted that the central bank will discuss the exit strategy from its ultra-accommodative monetary policy and communicate this to the public only when conditions favor achieving stable inflation.
Governor Ueda pointed out that BoJ's ETF purchases have significantly contributed to bolstering consumption and capital expenditure. "We buy ETFs as part of our massive stimulus programme," he stated, suggesting that these purchases are critical components of Japan's broader economic stimulus efforts.
NZDUSD in Crucial Battle Area ahead of US CPI
NZDUSD is trading at a critical area ahead of the US CPI inflation data, challenging the resistance trendline, which connects all the highs from April’s peak at 0.6343, for the third consecutive day.
May’s upturn raised optimism for a bullish trend reversal as a double bottom pattern became more visible. Adding to the bright outlook is the clear positive trajectory in the RSI and the MACD, which point to constructive sessions ahead.
Nevertheless, only a clear extension above 0.6345-0.6375 would confirm a bullish market structure in the short-term picture, likely driving the price sharply up to the 0.6500-0.6550 important resistance zone. Should the pair resume its October-January uptrend above 0.6550, the next target might be the crucial long-term descending trendline from February 2021 seen at 0.6620.
In the event the price slips below the nearby support of 0.6330, the 23.6% Fibonacci retracement of the 0.5510-0.6536 upleg could immediately add a footing near 0.6288. A break below that base would put the double bottom pattern into question, likely extending the bearish wave towards the 0.6200-0.6140 region, where the simple moving averages (SMA) and the 38.2% Fibonacci level are placed. Another negative correction may threaten a downtrend resumption below the March low of 0.6083 and towards the 50% Fibonacci of 0.6020.
All in all, NZDUSD seems to be testing a make-or-break zone. A sustainable move above the 0.6345-0.0.6375 region could trigger an exciting rally, while a step below 0.6288 may renew selling pressures.
Tehcnicals Looks Bearish for USD, But Waiting US CPI Confirm the Breakdown
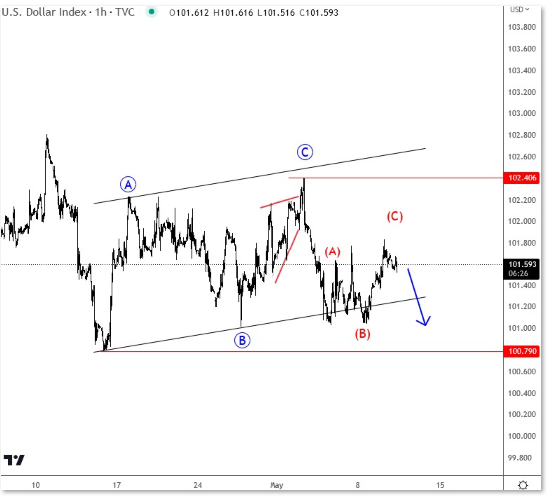
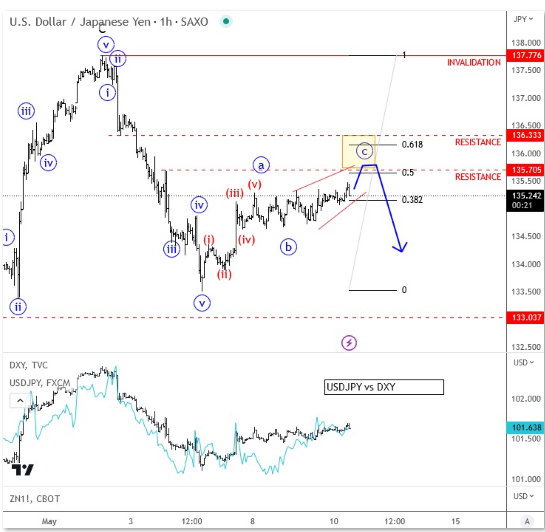
Today, its a big day, we will get the US CPI data out from, which are expected with 5%, number that may deifnde next bull/bear move for the USD. If data is going to be above 5% then expect dollar to rally as FED will have room to lift rates further after strong jobs on Friday. If data willbe well below 5% then I think dollar will fall further, which is somehow technically expected based on the latest Elliott wave development. Looking at DXY, we see three waves up to 102.40, and now another minor (A)-(B)-(C) rally from the lower channel support line. Break below the trendline will liekly make a room for a push to a new low and that's when I think USDJPY can fall as well. I will have a close eye on USDJPY for potential shorts, still this week if US CPI data will confirm the technicals of course. Waiting for now.
Sticky CPI May Challenge Fed Pause
The incoming US inflation report is set to be a major telltale sign on the Fed’s next move. Today’s top tier data release warrants the market’s collective focus, even as US debt limit talks as well as regional banking fears continue to simmer in the background.
Economists predict that April’s headline CPI will rise at a 5% year-on-year clip, matching the prior month’s figure. Core CPI is expected to have eased slightly to 5.5%, relative to March’s 5.6%.
If either headline or core inflation greatly exceed forecasts, that should unnerve expectations that the Fed will soon pause this rate hike cycle. The prospects of yet another US rate hike in June should translate into a knee-jerk boost for the US dollar, while likely pulling equities and gold lower.
Should the CPI figures show that inflationary pressures have eased substantially, that should all but confirm that US rates have reached their peak. Such confirmation should prompt the S&P 500 as well as bullion to revisit recent highs, while dragging the Dollar Index back closer to the psychologically-important 100 line.
EUR/USD Dips Again While USD/CHF Turns At Risk of Fresh Decline
EUR/USD started a fresh decline from the 1.1050 resistance. USD/CHF is moving lower and might decline further toward the 0.8860 support.
Important Takeaways for EUR/USD and USD/CHF Analysis Today
- The Euro started a fresh decline from the 1.1050 resistance against the US Dollar.
- There is a major bearish trend line forming with resistance near 1.1000 on the hourly chart of EUR/USD at FXOpen.
- USD/CHF is showing a few bearish signs below the 0.8930 resistance zone.
- There is a key bearish trend line forming with resistance near 0.8925 on the hourly chart at FXOpen.
EUR/USD Technical Analysis
On the hourly chart of EUR/USD at FXOpen, the pair faced rejection near the 1.1050 level. The Euro started a fresh decline from the 1.1053 high against the US Dollar.
There was a move below the 50-hour simple moving average at 1.1000. The pair tested the 1.0945 support. A low is formed near 1.0941 and the pair is now correcting losses. There was a recovery wave above the 23.6% Fib retracement level of the recent decline from the 1.1053 swing high to the 1.0941 low.
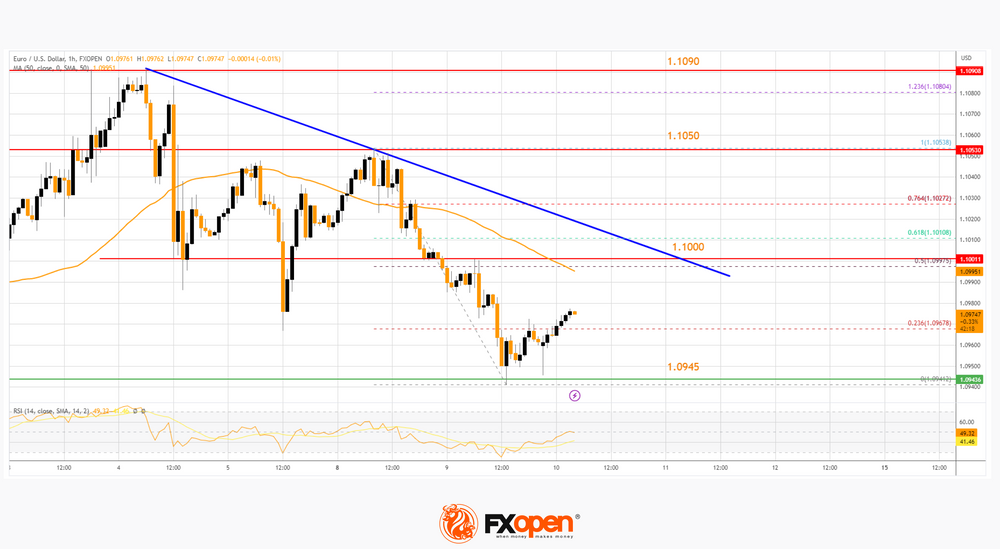
The first major resistance is near the 50-hour simple moving average at 1.1000. It coincides with a major bearish trend line and the 50% Fib retracement level of the recent decline from the 1.1053 swing high to the 1.0941 low.
An upside break above the 1.1000 level might send the pair toward the 1.1050 resistance. The next major resistance is near the 1.1090 level. Any more gains might open the doors for a move toward the 1.1120 level.
If there is no move above 1.1050, the pair might start a fresh decline. On the downside, immediate support on the EUR/USD chart is seen near 1.0945.
The next major support is near the 1.0920 level. A downside break below the 1.0920 support could start a steady decline toward the 1.0865 level.
USD/CHF Technical Analysis
On the hourly chart of USD/CHF at FXOpen, the pair started a decent increase from the 0.8820 support. The US Dollar gained climbed above the 0.8885 resistance zone before the bears appeared.
The pair failed to clear the 0.8930 resistance zone. The pair is now moving lower below the 50% Fib retracement level of the recent increase from the 0.8867 swing low to the 0.8942 high. It is trading below the 50-hour simple moving average and RSI is declining.
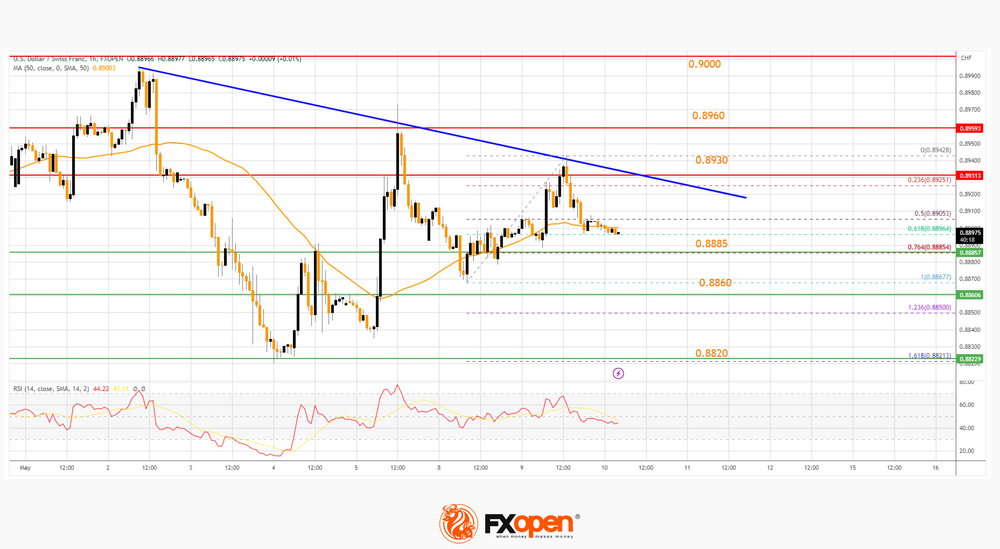
On the downside, immediate support on the USD/CHF chart is near the 76.4% Fib retracement level of the recent increase from the 0.8867 swing low to the 0.8942 high at 0.8885.
The next major support is near the 0.8860 level. Any more losses may possibly open the doors for a move toward the 0.8820 level or even 0.8800 in the coming days.
On the upside, the pair is now facing resistance near a key bearish trend line at 0.8930. The next major resistance is near the 0.8960 level. If there is a clear break above the 0.8960 resistance zone, the pair could start another increase. In the stated case, it could test 0.9000.
Gold Technical: Bounced Higher from Key Short-term Support
- Gold (XAU/USD) is holding above 2,000 key support ahead of US CPI.
- Short-term uptrend phase from the 19 April 2023 low remains intact.
- Next intermediate resistance at 2,075; its current all-time high.
In our previous article “Gold has not lost its glitter”, we have highlighted the key macro factors that may have a significant influence in driving the fundamentals and price actions behaviour of Gold (XAU/USD).
Right now, let’s decipher its latest developments through the lens of technical analysis as the release of the important US CPI inflation data for April looms later today.
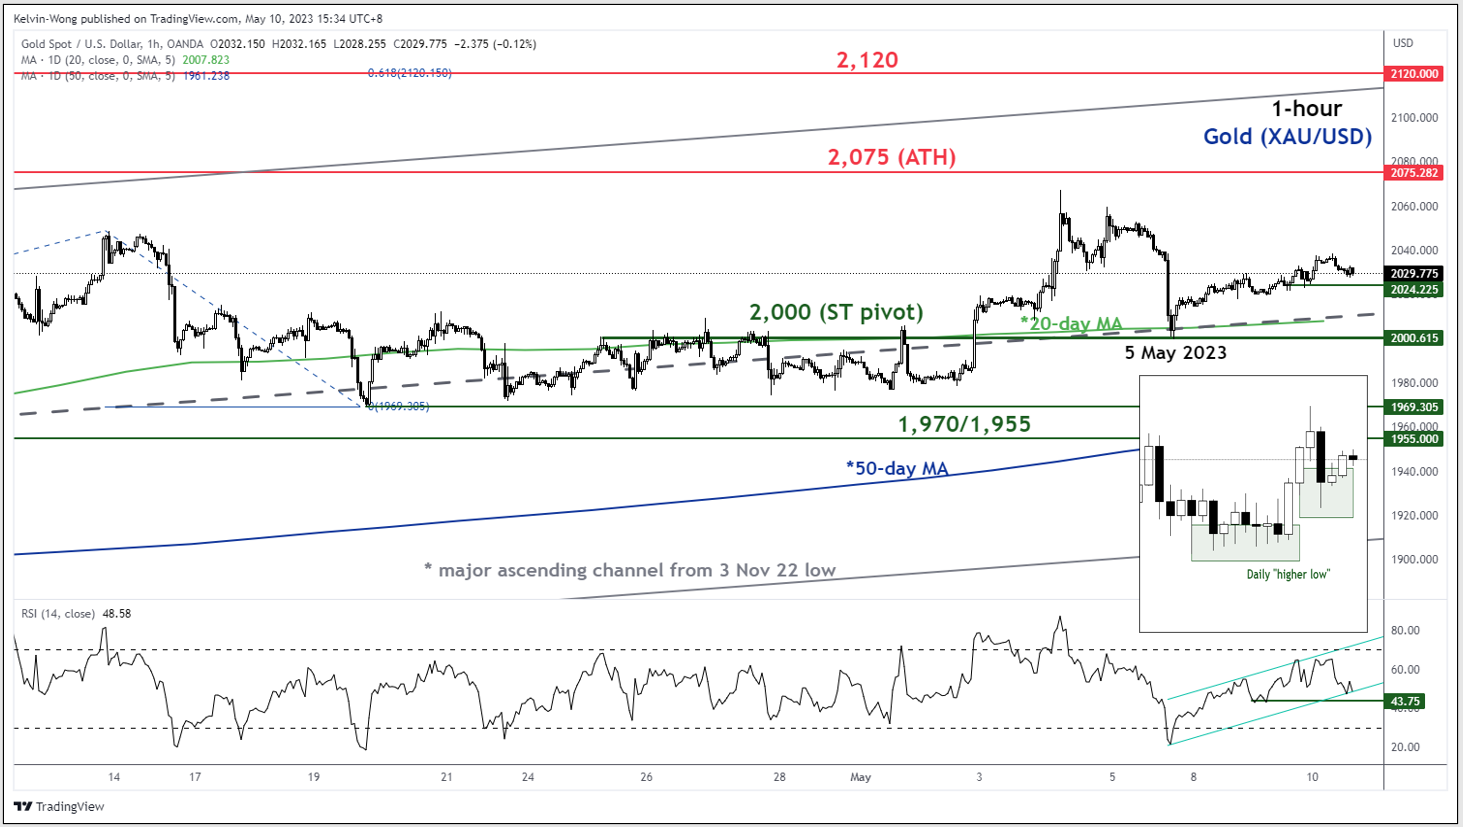
Fig 1: Gold (XAU/USD) trend as of 10 May 2023 (Source: TradingView, click to enlarge chart)
The technical picture for Gold (XAU/USD) is still skewed towards a short-term uptrend phase in place since the 19 April 2023 low of 1,969.
Recent price actions of XAU/USD have formed a daily “higher low” on 5 May 2023 after a retest on the median line of a major ascending channel in place since 3 November 2022 and an upward-sloping 20-day moving average now acting as a support at around 2,000.
In addition, the hourly RSI oscillator is still hovering above the corresponding support at the 43% level and has not hit its overbought zone (above 70%) during its prior up move from 5 May to 10 May 2023.
These observations suggest that the short-term bulls may be still in control above the 2,000 key short-term pivotal support with the next intermediate resistance to watch at 2,075 (current all-time high printed on 7 August 2020).
On the other hand, a break with an hourly close below 2,000 negates the bullish tone to expose the next support zone at 1,970/1,955 that also confluences closely with the upward-sloping 50-day moving average.
USDJPY Shows Recovery Signs after Sharp Pullback
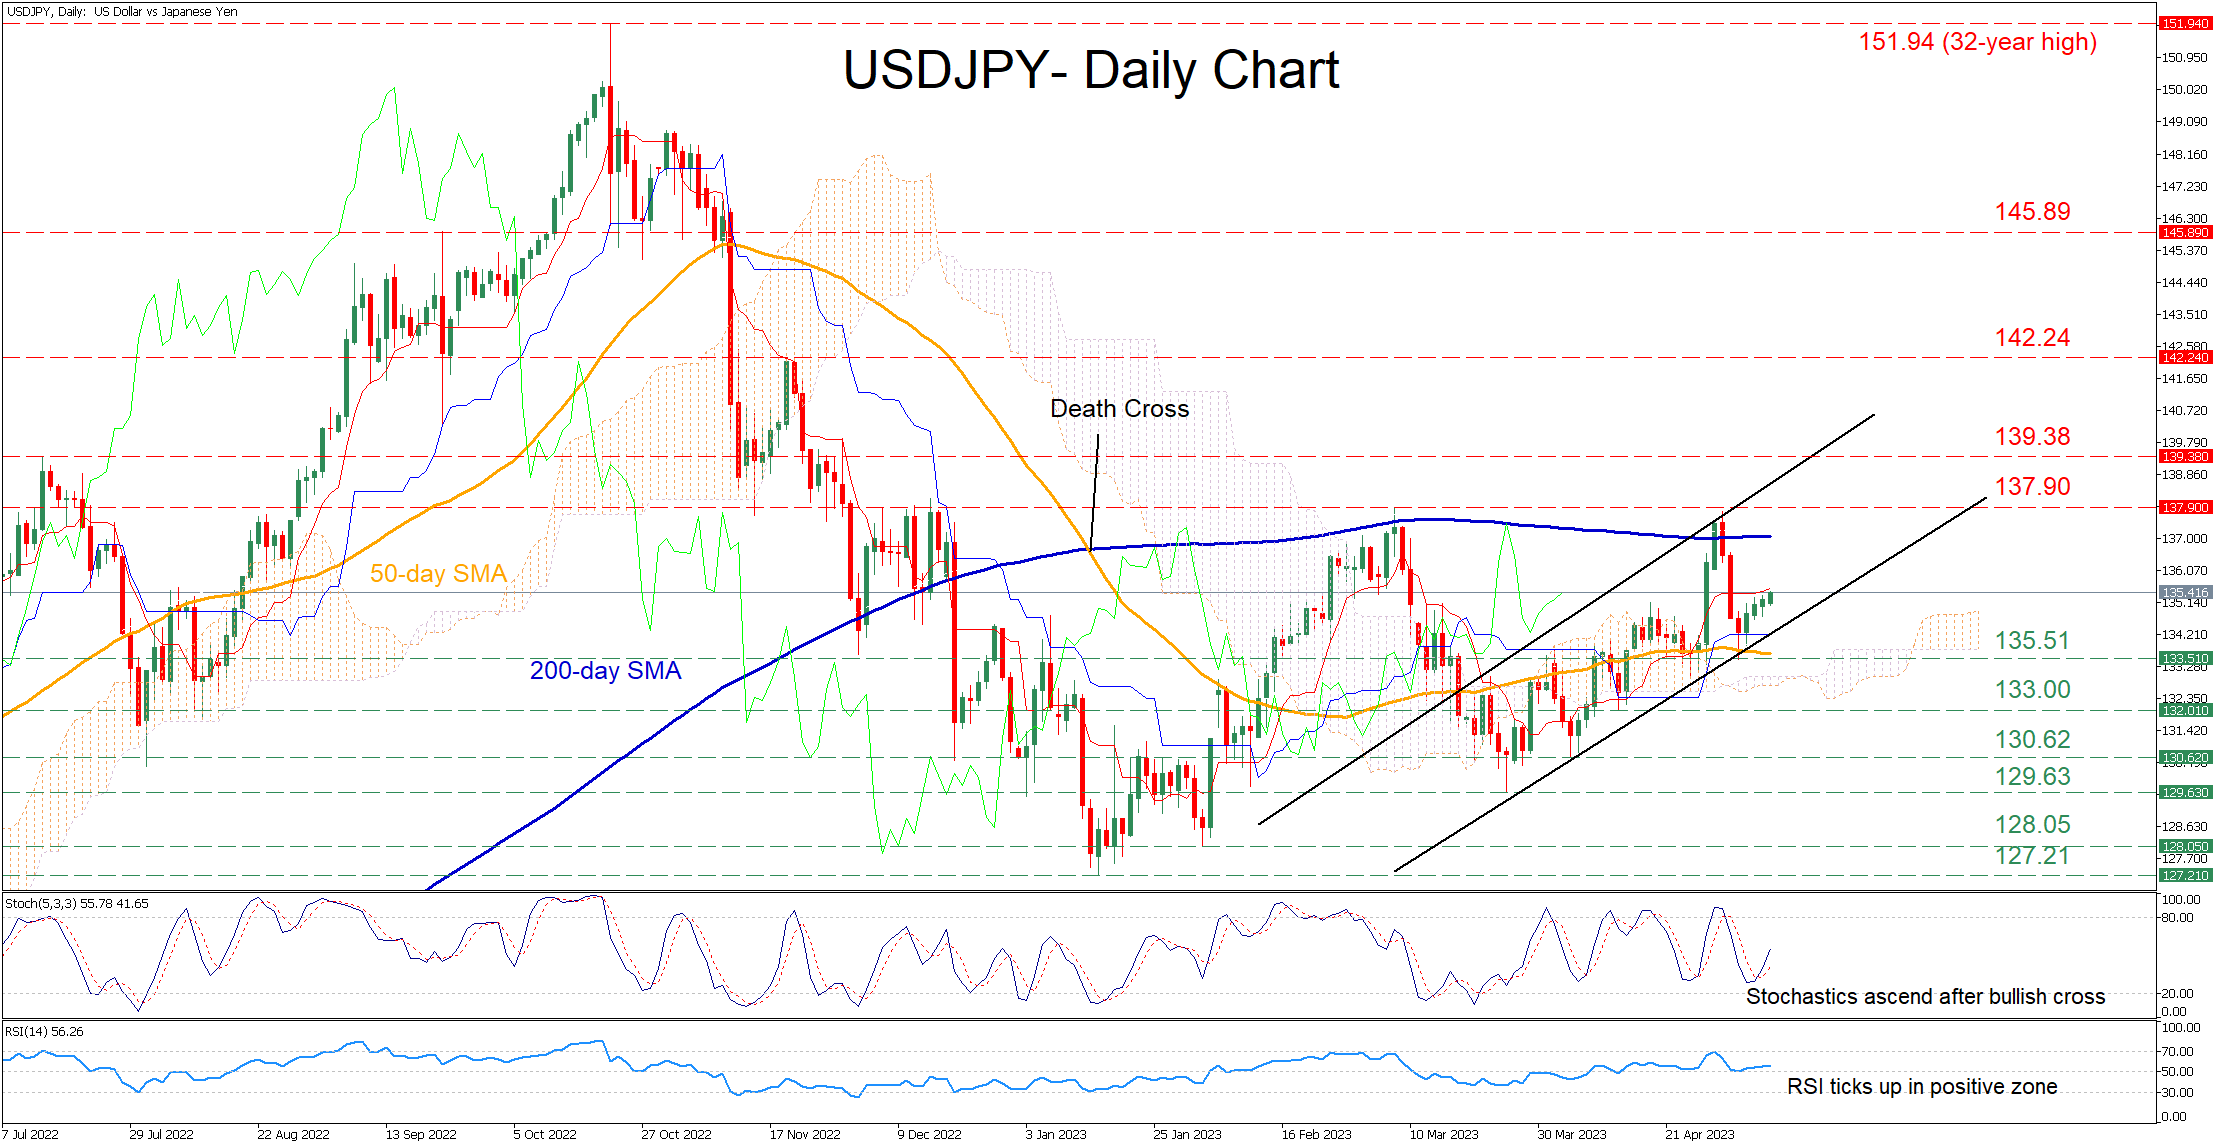
USDJPY has been trading within an upward sloping channel since mid-March, crossing above both its 50-day simple moving average (SMA) and the Ichimoku cloud. Even though the pair experienced a pullback after failing to extend its rally above the 200-day SMA, it has been steadily re-gaining ground in the last few daily sessions.
The momentum indicators currently suggest that bullish forces are in control. Specifically, the stochastic oscillator is ascending after posting a bullish cross, while the RSI is flatlining above its 50-neutral mark.
If buying pressures persist, initial resistance could be found at the 2023 high of 137.90. Surpassing that zone, the pair might ascend towards the July high of 139.38 before the November resistance of 142.24 comes under examination. Further advances could then cease at the 145.89 hurdle.
On the flipside, should the recent recovery fade, the price could reverse downwards to challenge the recent support of 135.51, which lies very close to the 50-day SMA. If that floor collapses, the bears may aim for 133.00 before attention shifts to the April bottom of 130.62. Failing to halt there, the March low of 129.63 could provide downside protection.
Overall, USDJPY seems to be rebounding after experiencing a moderate downside correction, with its ascending channel pattern remaining intact. However, a break above the double-top region of 137.90 is needed to turn the medium-term outlook back to bullish.