Sample Category Title
Gold Falls From Record High But 2,000 Remains Strong Support
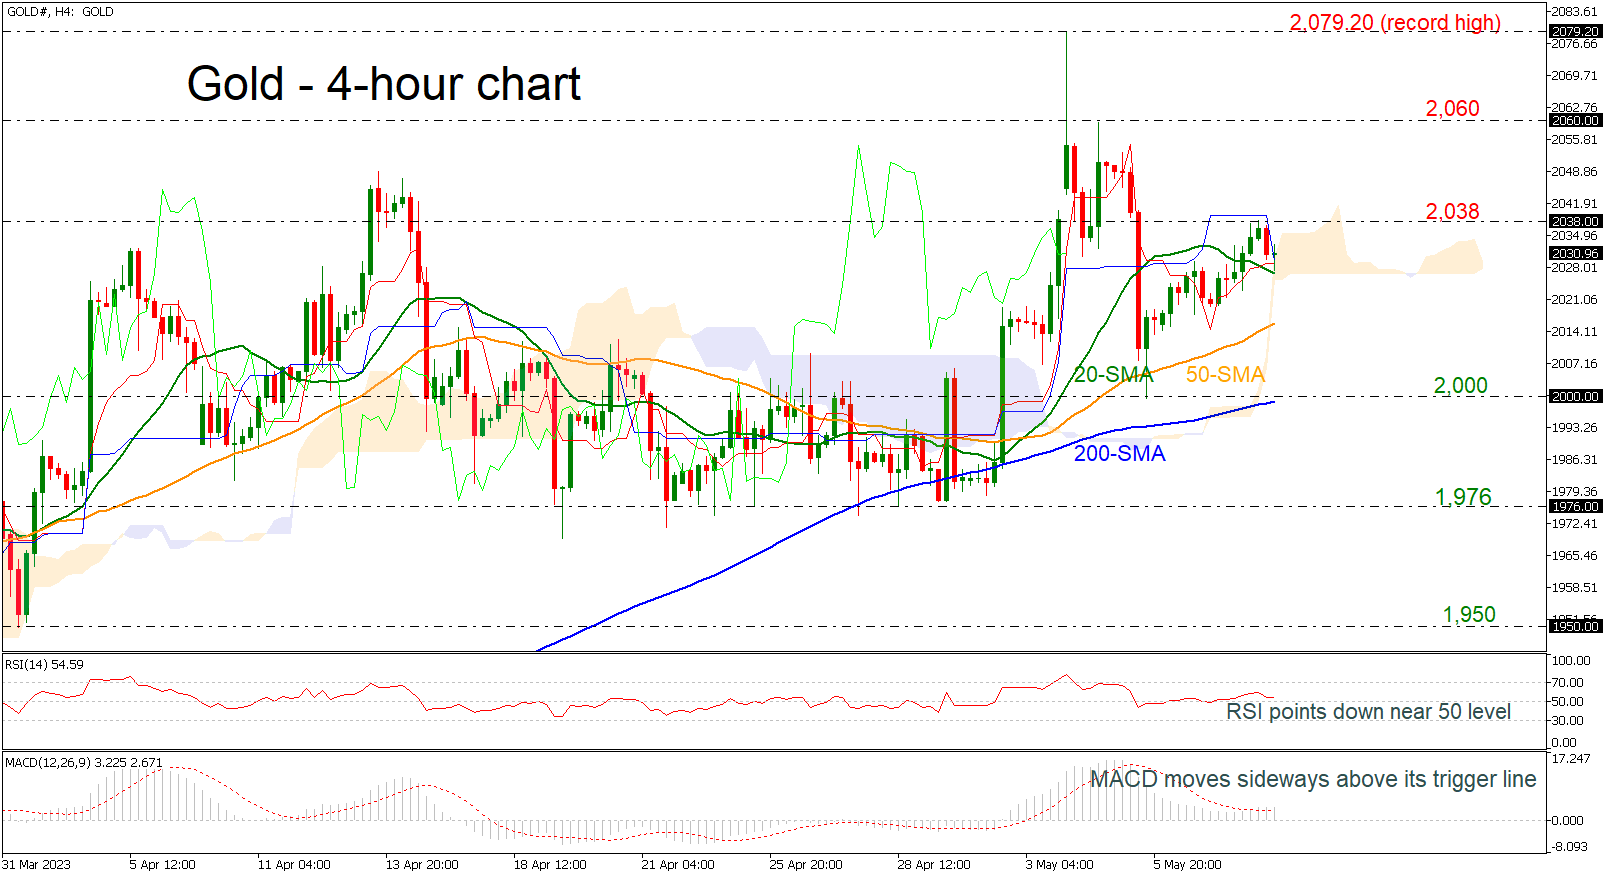
Gold is still developing well above the 2,000 round number, remaining strongly bullish but the short-term simple moving averages (SMAs) in the 4-hour chart suggest a potential downside correction. The RSI indicator is falling in the positive area, while the MACD is heading sideways near its trigger and zero lines.
An extension of the declining move may find support at the 50-period SMA at 2,015 ahead of the 2,000 psychological mark and the 200-period SMA. Any movements beneath the latter may open the way for a more negative structure until 1,976.
On the other hand, a climb above 2,038 could add to the optimism for another bullish wave until 2,060 and the previous record high of 2,079.20.
In a nutshell, the yellow metal is bullish in the long-term timeframe but if there is a drop below the 200-period SMA, it may switch the near-term view to neutral.
DXY: A Bearish Wave (Y) Has Started, Preparing to Sell
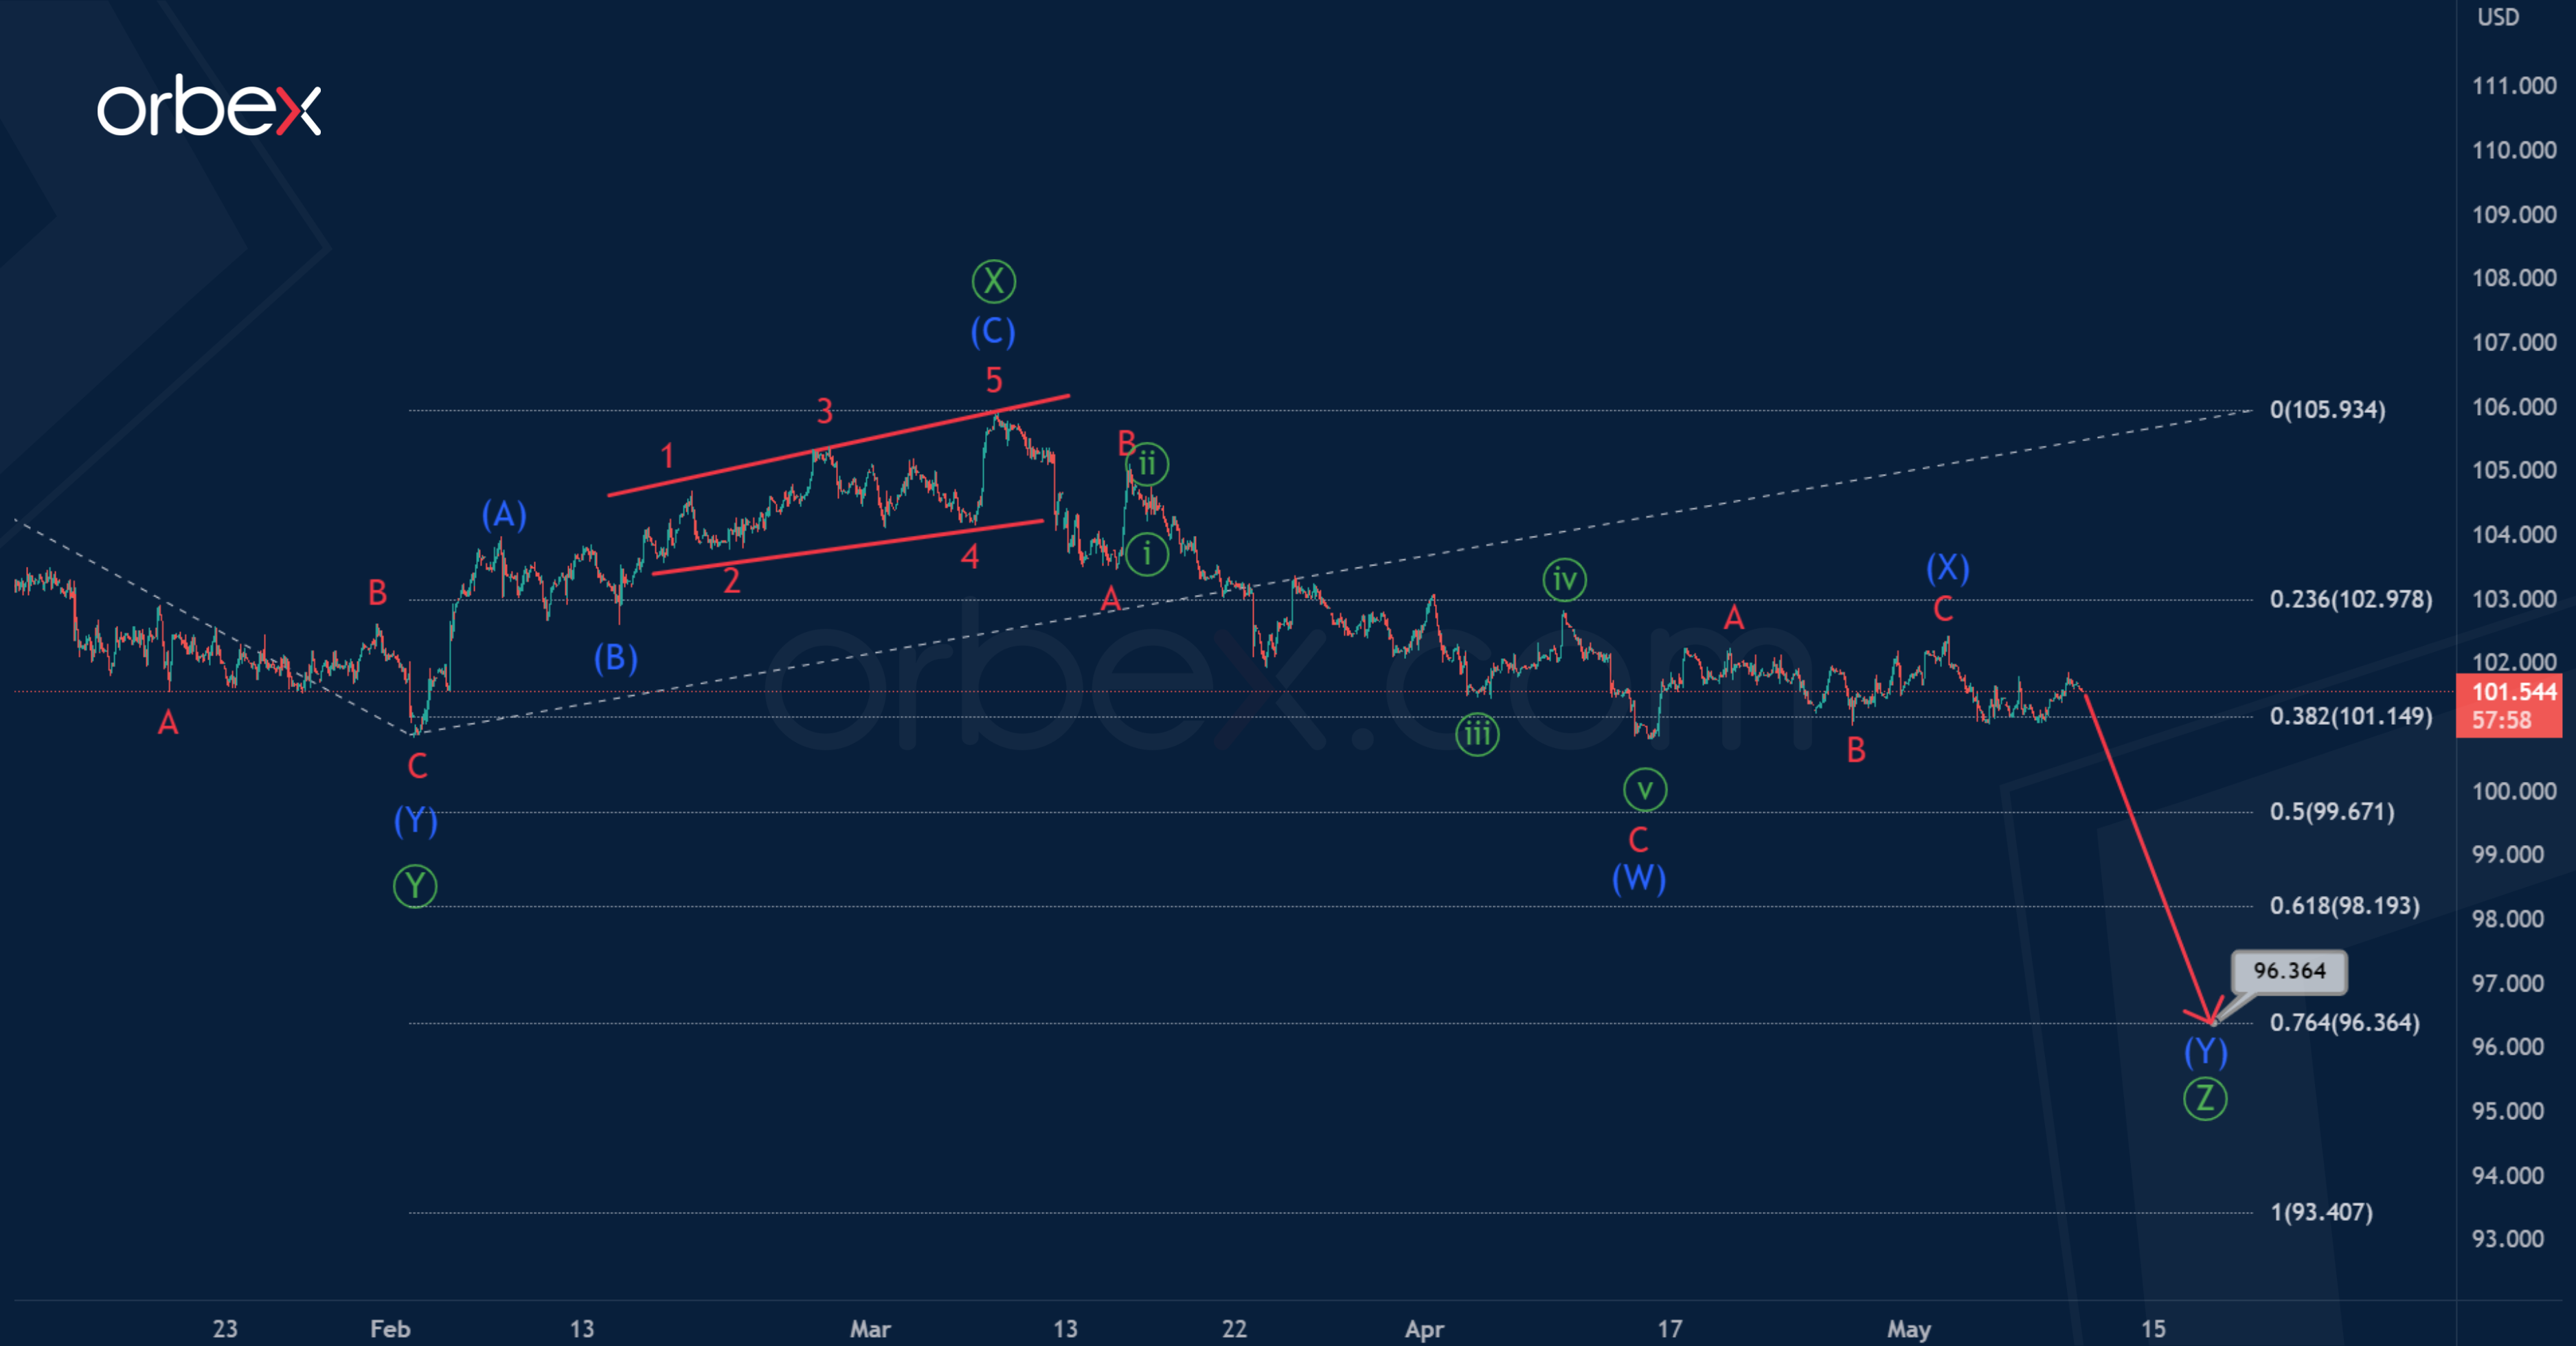
In the long term, the dollar index can form a triple zigzag pattern, which consists of primary sub-waves. At the moment, the sub-waves look complete. The second intervening wave is a standard zigzag.
Most likely, the price drop in the primary wave will continue in the next coming days. Judging by the internal structure, this wave can take the form of an intermediate double zigzag.
The end of the bearish pattern is expected near 96.364. At that level, primary wave will be at 76.4% of wave.
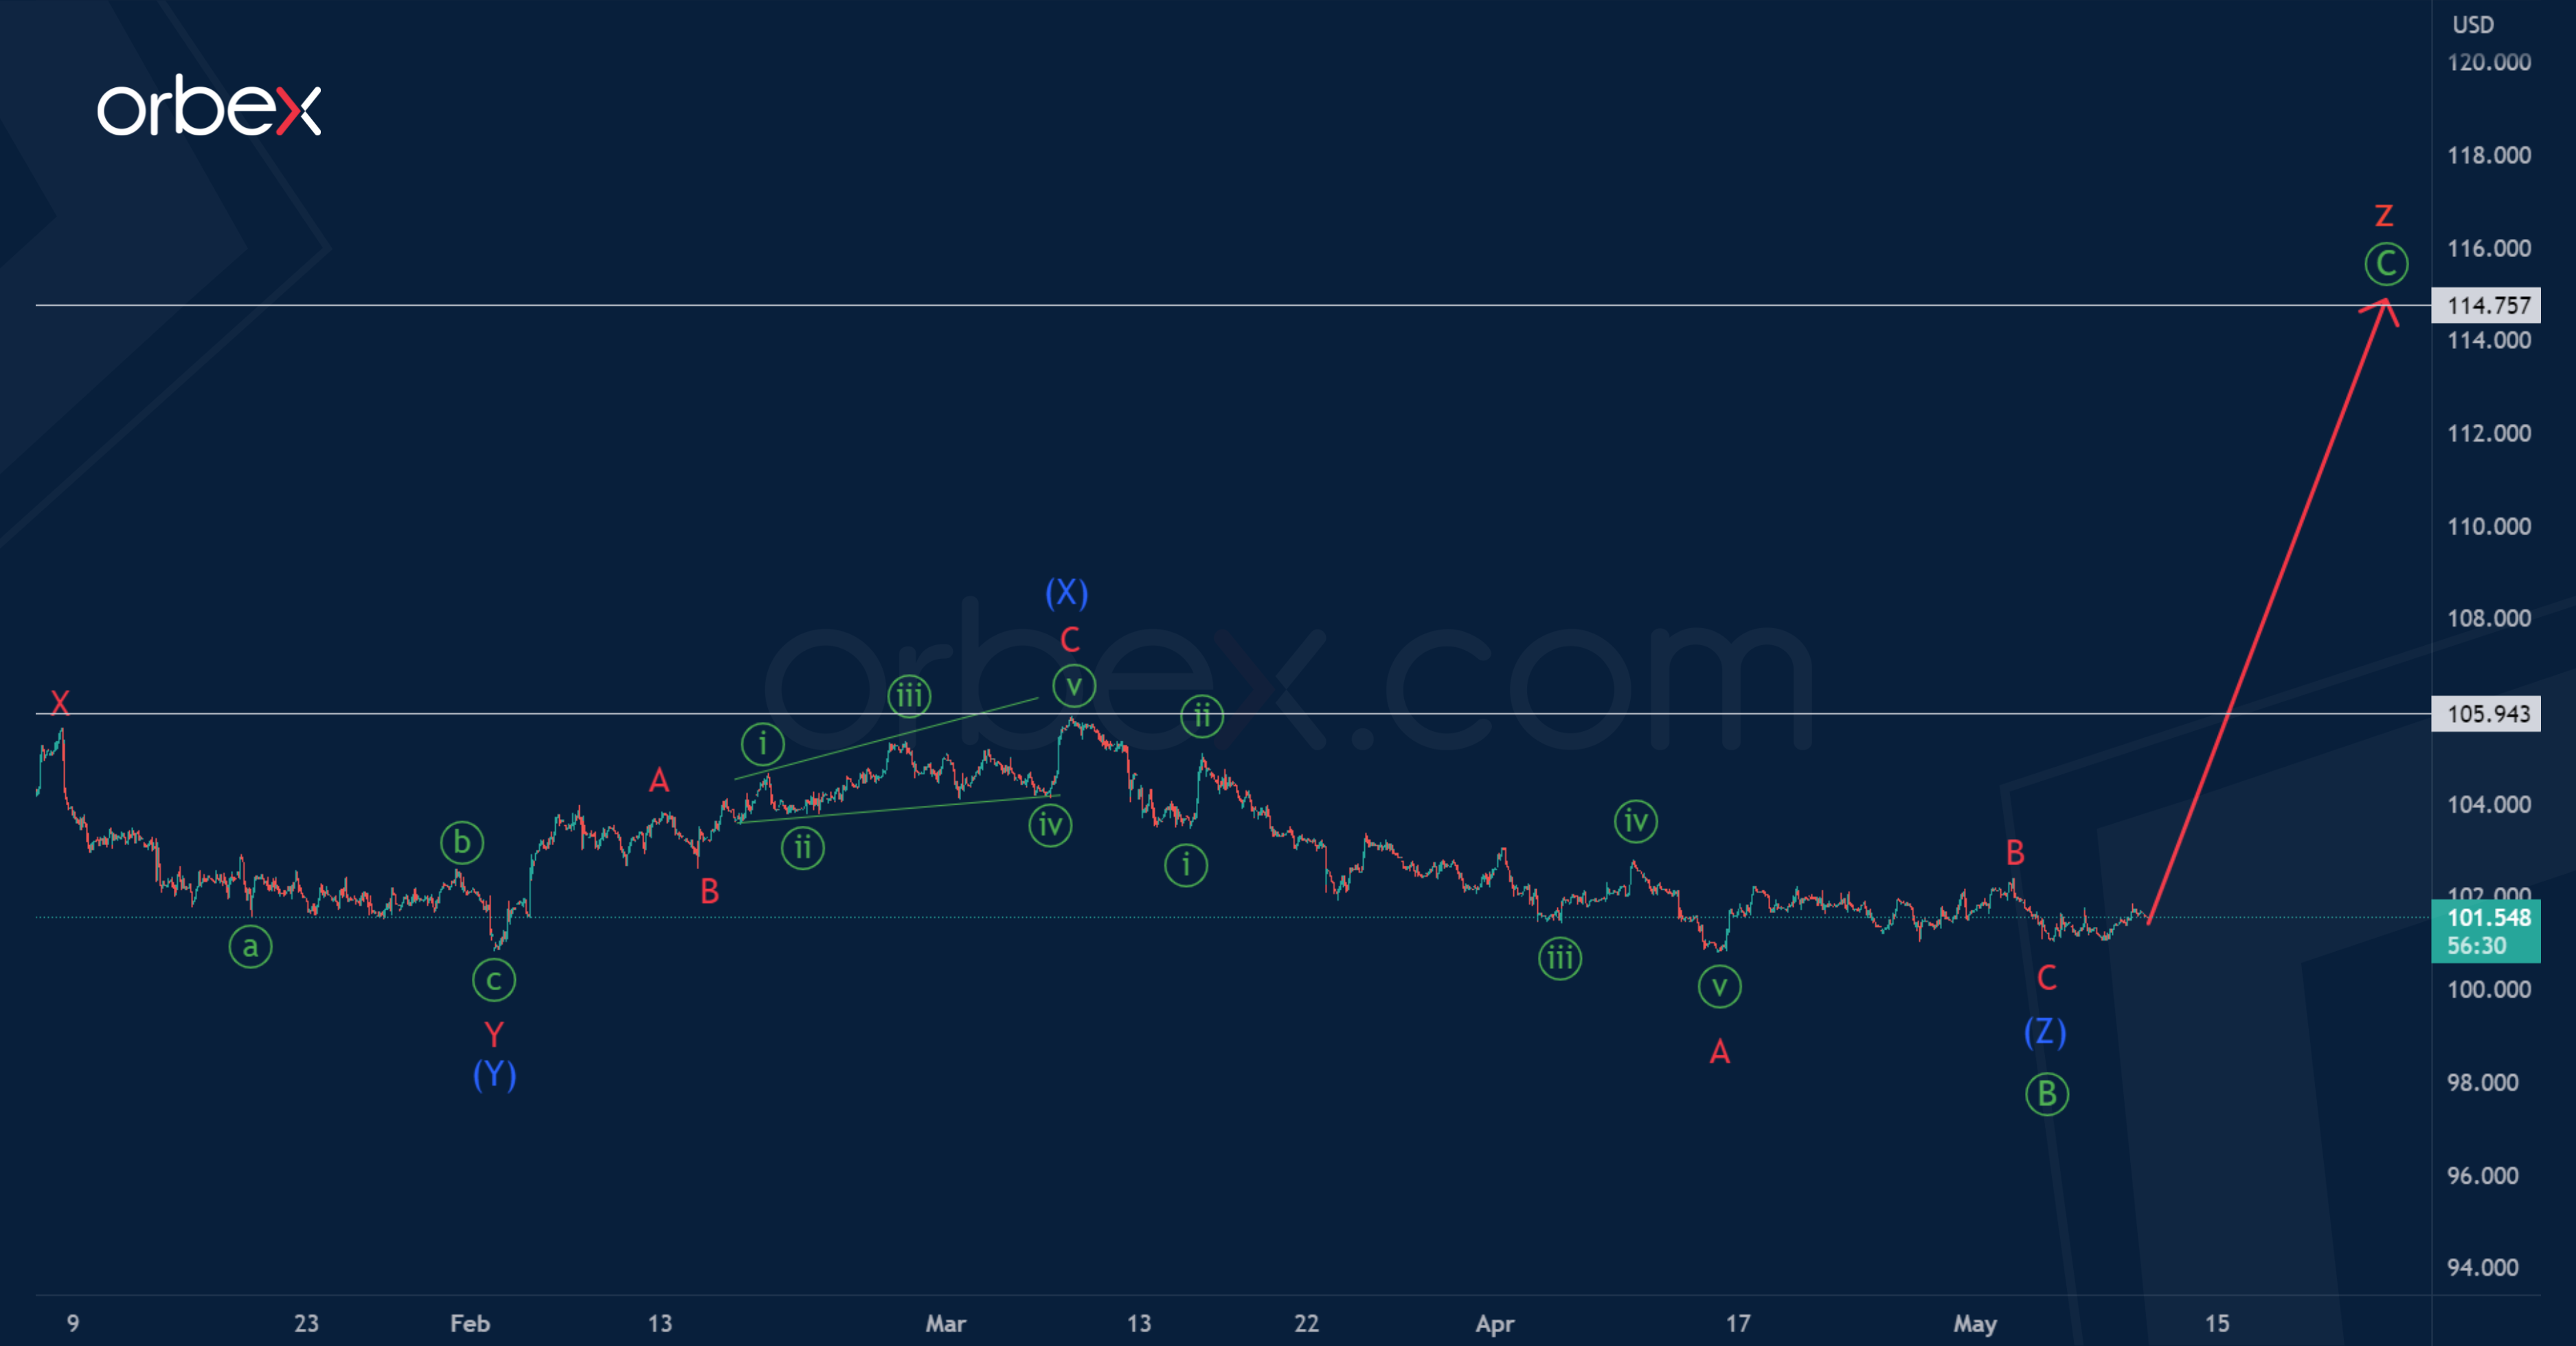
We propose to consider an alternative scenario in which a wave z is formed in a triple zigzag w-x-y-x-z.
The structure of the wave z is similar to the zigzag. In its composition, the first impulse and the correction in the form of an intermediate double zigzag have already been completed. The entire wave z can end near 114.75, that is, at the maximum of the primary impulse wave.
However, the first target where the bulls will go is the maximum of 105.94, which was marked by the intermediate intervening wave (X).
USD Looks to Break Out
EUR/USD awaits breakout
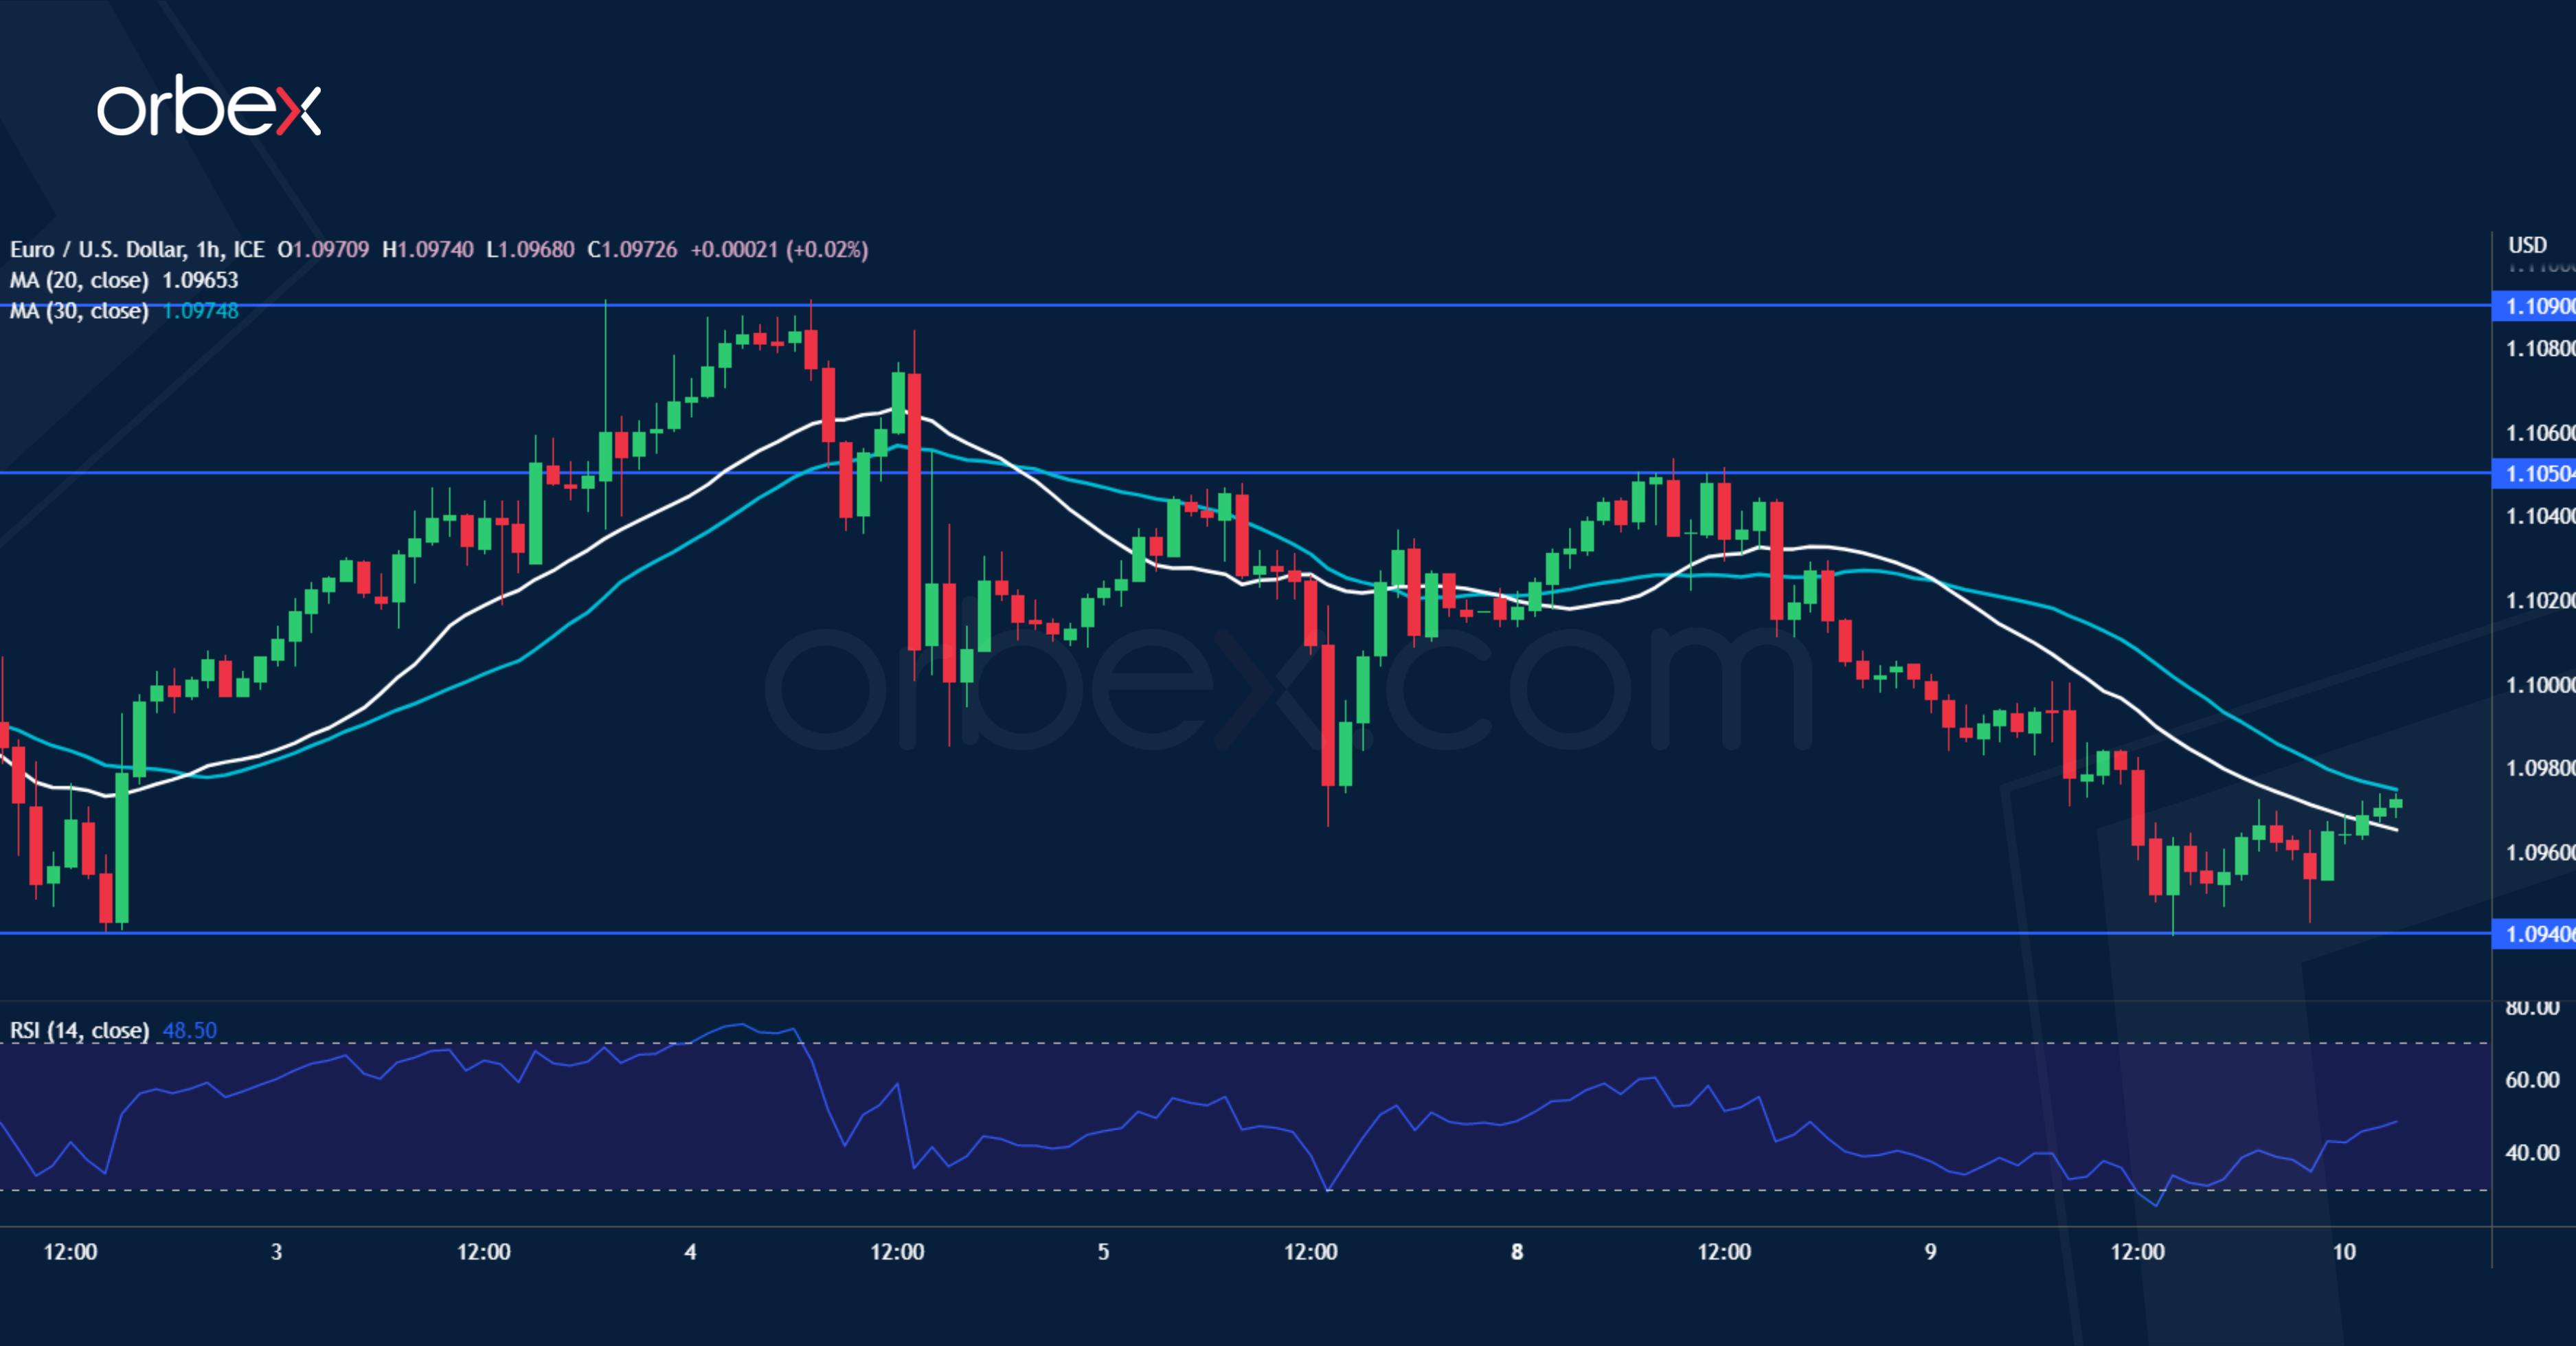
The US dollar stays rangebound as traders await the April CPI data. On the daily chart, the pair is grinding along the dynamic support from the 20 and 30-day SMAs. As sentiment remains upbeat from the medium-term perspective, the consolidation could be an opportunity to accumulate for the bulls before another leg of rally. A close above 1.1050 may attract momentum buyers and carry the single currency beyond 1.1100. On the downside, the demand zone 1.0910-1.0940 is key in keeping the bullish bias intact.
USD/CAD tests critical floor
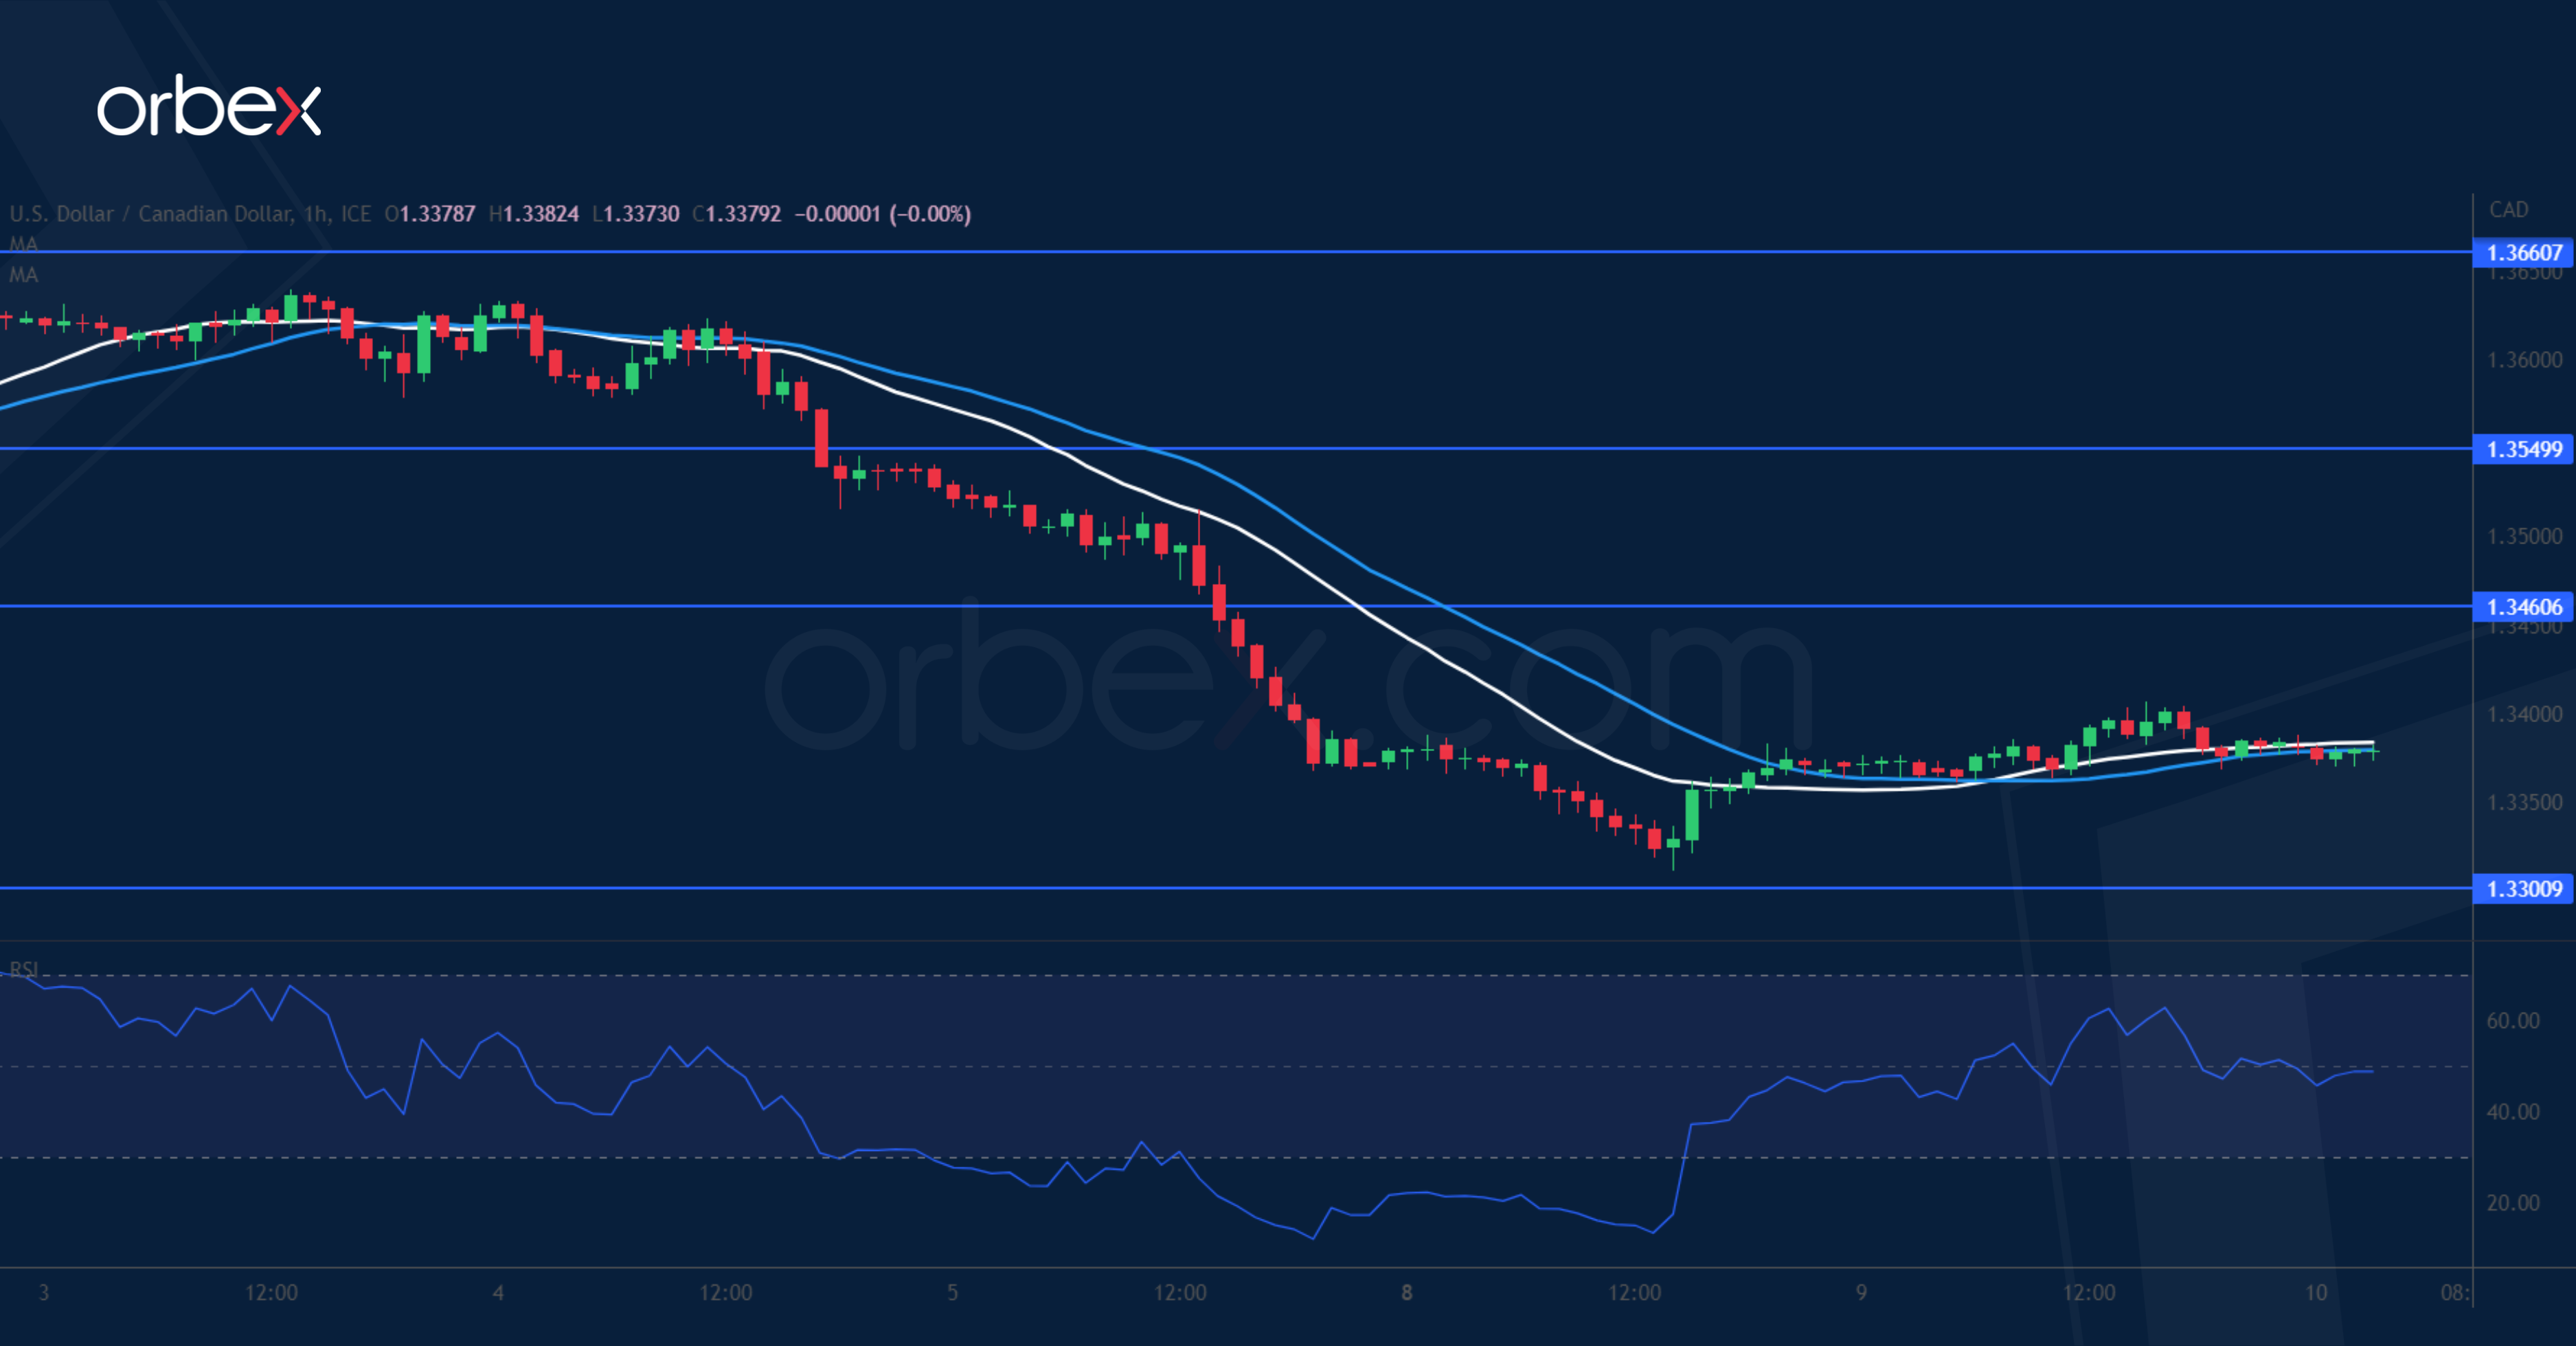
The Canadian dollar finds support from oil prices’ bounce as the US plans to replenish its strategic reserve. As the pair gave up all its recent gains, a retest of the critical floor of 1.3300 has put the buy side under renewed pressure. Its breach would force those who bought the dips to dump their positions and stir up volatility. The RSI’s oversold condition has led sellers to take some profit but may not be enough to trigger a bounce. 1.3460 is the first resistance and 1.3550 the major hurdle to lift before a recovery could take shape.
FTSE 100 goes into correction
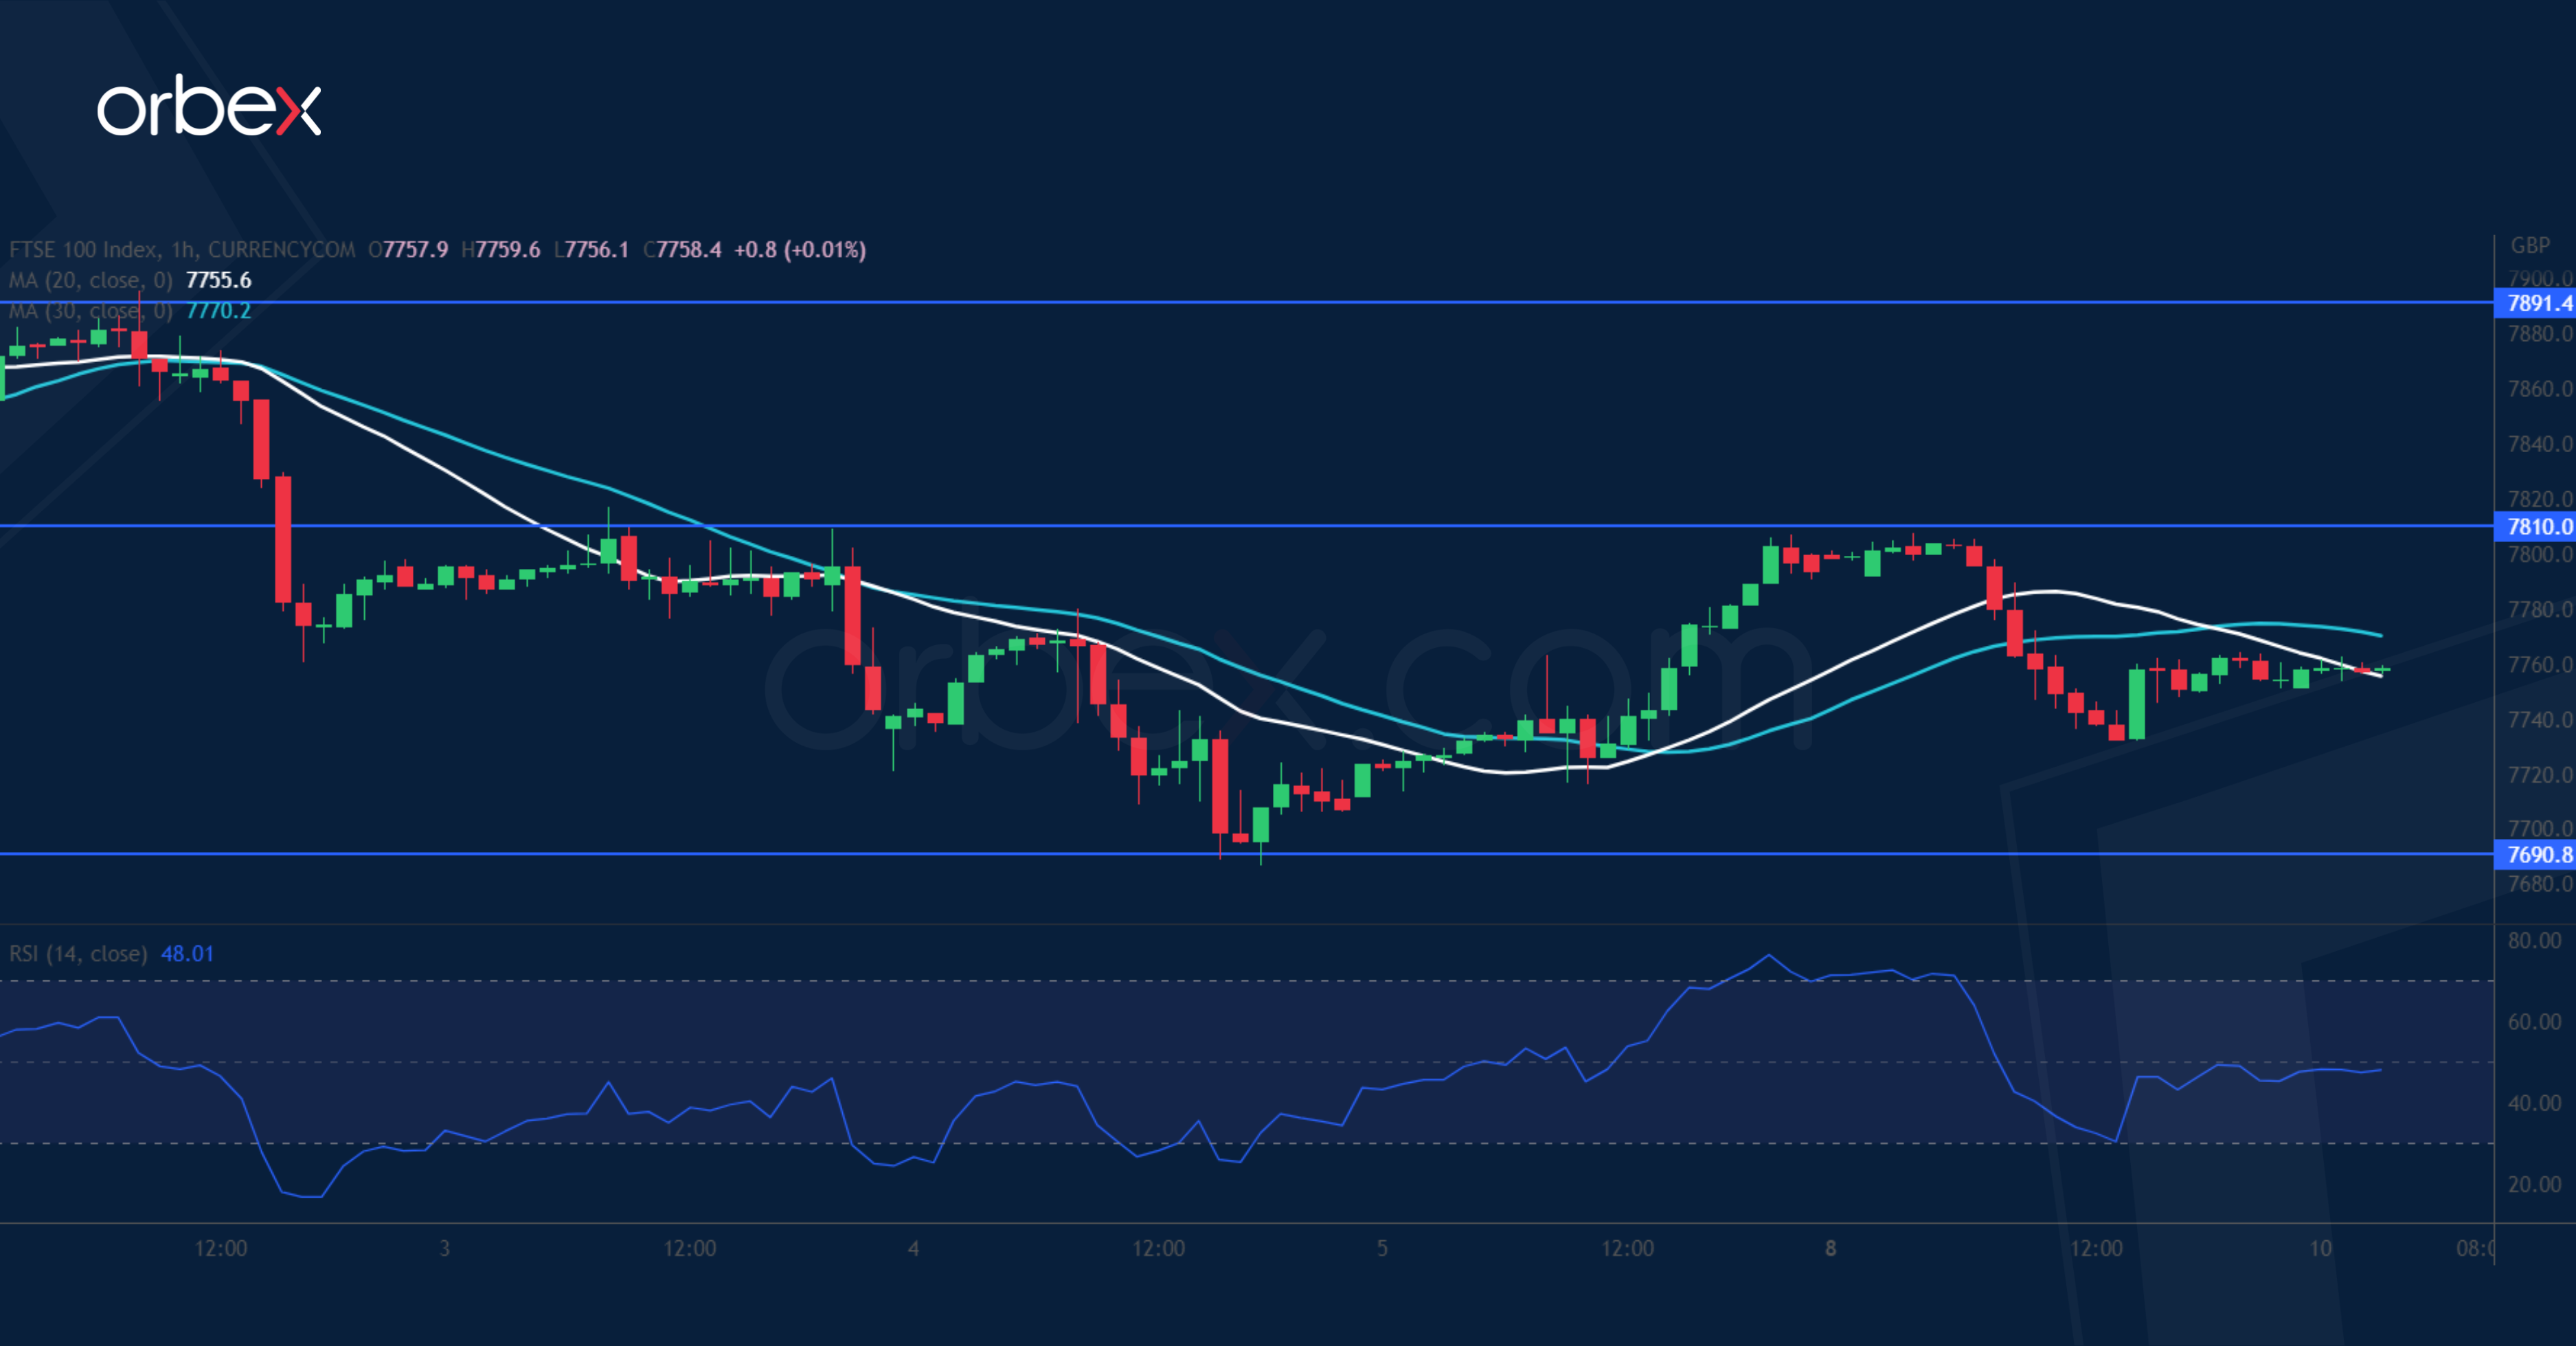
The FTSE 100 retreats as the market expects a 25 basis points rate hike from the BoE. The rally came to a halt in the supply zone 7930 from the March sell-off and the downward drift is a sign of exit by those who bought on the way up last month. Rebounds have so far been capped by stiff selling pressures with 7810 becoming a fresh resistance. A fall below the recent low of 7690 would attract more bears and extend the correction to the round number of 7600. 7890 is the key resistance to clear to resume the uptrend.
Is Inflation Good for Oil?
No one was naïve enough to expect an agreement on the US debt ceiling yesterday, when US President Joe Biden met Kevin McCarthy. But some hoped that there could be at least an extension of the debt ceiling to September, until the end of the current fiscal year, which would allow both parties to engage in deeper talks about what to do with the 2024 budget and the debt ceiling altogether.
But no
Biden and McCarthy couldn’t agree on much, but they agreed that there would be no extension to the debt ceiling.
Biden doesn’t want to push US to default – that would be a disaster – but he can’t agree on severe budget cuts either. His electors would be too angry. The leaders will meet again on Friday. Debt ceiling discussions will certainly extend toward the last minute, and the chances are that we see a last-minute goal to avert a possible US government default. Until then, uncertainty will loom, and risk appetite will likely remain limited.
US treasuries remain under a decent selling pressure especially on the short end of the yield curve as investors dump US short term papers due to the rising US default risk. The US 1-month bill yields around 5.60%, the US 2-year yield advanced past the 4% mark, the S&P500 slid 0.46%.
The US dollar popped higher on Tuesday, boosted by the rising US yields, but gold is certainly a better alternative for hedging a potential US default risk, as a potential default would clearly put pressure on growth prospects, Federal Reserve (Fed) expectations and weigh on the dollar as a result.
Gold is a better choice for hedging against rising tensions with China, as well, as Italian PM Meloni told McCarthy yesterday that she wants to exit the Chinese Belt and Road Initiative. The price of an ounce trades around the $2030 this morning and could find the force to test the $2080 offers to the upside and clear them. Upside potential extends to $2200 per ounce.
Similarly, the long end of the US yield curve could be an interesting refuge for risk averse investors, given that a potential US default would immediately send the Fed rate cut expectations to the moon, and would apply a decent pressure on the long end of the yield curve. US 10-year papers now yield around 3.50%. In case of a problem, we could see them fall all the way to 2.80/3%.
Looking at Bitcoin, it doesn’t seem to offer any relief to actual stress. The price of a coin is down below the $28K mark, and could remain under pressure, parallel to sentiment in tech stocks.
And US inflation?
The US will reveal a much-important update to its CPI today, and the data could also shake sentiment at today’s trading session.
Core inflation is expected to have slightly eased from 5.6% to 5.5% in April, headline inflation is seen steady at 5%, while we might see an uptick in monthly headline figure, to 0.4% from 0.1% printed a month earlier due to the spike in energy prices after OPEC cut production last month.
In all cases, whatever we see in US CPI report today, it’s important to note that inflation expectations are falling. The NFIB survey showed yesterday that there is a severe decline in the number of small companies that are expected to raise prices. That should, at some point, play in favour of slowing price pressures.
For today, a CPI report in line with expectations will keep focus on debt ceiling, but a report that diverges from expectations could give an extra spin to market pricing. A softer-than-expected CPI report should further fuel the Fed rate cut expectations into this fall and relieve a part of the positive pressure on US yields, whereas a stronger-than-expected read will hardly boost any hawkish bets at this stage. Concerns regarding the US regional banks and the unresolved debt ceiling issue hint that the Fed can no longer walk alone and hike rates. Therefore, a stronger inflation report would only hint at lower real returns on US denominated assets. The latter would weigh on the US dollar, help the EURUSD rebound past 1.10, and keep Cable upbeat near a long-term trend negative trend top.
Is inflation good for Oil?
One frequent question is how would oil react to inflation data. Is inflation good for oil prices, or is it bad?
Some argue that inflation is good for oil, because oil tends to perform well in periods of high inflation. This is true. But if oil performs better during periods of high inflation, it could be because higher oil causes higher inflation.
And the opposite – higher inflation is good for oil – may not be true.
There are two reasons
- If inflation is higher because of strong growth and robust demand, a period of high inflation could be supportive of oil.
- But today, we are mostly talking about a looming recession and tightening monetary conditions. In this context, higher inflation may not translate into better appetite for oil, if a scary inflation number fuels the hawkish Fed expectations.
The barrel of US crude is trading around $73pb this morning. The $75/76 range, which shelters the 50, 100-DMA, will likely act as a solid resistance to price advances.
In the medium run however, crude oil outlook remains neutral to positive, as tighter supply from OPEC and rising demand, especially due to the rebound in travel demand, should continue giving support to the bulls. But whether we would see levels above $80pb sustainably is yet to be seen.
The Big CPI Day Today
Market movers today
Today's key event will be US CPI for April. We look for a moderation in core CPI to 0.3% m/m down from 0.4% m/m and slightly below consensus expectation of 0.4% m/m. Focus will also be on the development in the services ex shelter component, which the Fed highlights as the key component to gauge underlying inflation pressure.
Any news regarding bank stress or the US debt limit also continues to be in focus.
In the Scandies we get inflation releases in both Norway and Denmark while the consumption and production value indicators are released in Sweden. For more information see the Nordic Macro section below.
The 60 second overview
Markets. While the end to last week and beginning to this week were characterised by risk on and green equity markets sentiment yesterday turned more nervous amid the recent rise in yields; the major equity indices ended in "red", the USD gained and commodities traded slightly on the back foot.
Markets are back in a wait-and-see mode not least ahead of today's US CPI print which could prove instrumental for the very short end of the USD rates curve amid markets second-guessing the outlook for H2 Fed rate cuts and the potential for yet another rate hike in June. That said, markets still price around 145bp worth of rate cuts from the Federal Reserve over the coming 12M.
US debt ceiling. Yesterday US President Joe Biden met with Congressional leaders on the topic of the US debt ceiling problem. Meanwhile, apart from a pledge to continue the negotiations there were little signs of concrete breakthroughs in the talks. We still think the so-called x-date is too far away to find a solution as both the Democrats and the Republicans have incentive to try and use their political leverage in the negotiations. While markets did little on the lack of progress yesterday we could well see the US debt ceiling increasingly turn a market driver by end-May as nervousness could pick up similar to 2011. It remains our clear base case that a solution will be found in the 11th hour, yet we highlight that the coming month is likely to be filled with political noise and posturing.
Oil. The recovery following last week's sell-off has started to lose steam albeit the oil curve did find some late support yesterday on the US administration reiterating plans of a rebuild of their strategic reserves later this year. Overall, the oil market has tracked sentiment in the equity market in recent sessions, which was down yesterday. The dollar was on the rise, which likely also held back a further rise in oil prices. The drop in China's import in April probably also feeds into recent growing demand concerns in the oil market and could be weighing on oil prices. Today the market will watch the weekly US inventory report and in particular how many strategic reserves US sold the past week.
Equities: Equities took a breather on Tuesday with most indices drifting into red. It was an uneventful session with few market drivers; regional banks are still not bouncing, positioning/valuation is back at average, on top of wait-and-see mode ahead of CPI. S&P 500 closed down -0.5% with sectors quite tightly bunched. Directionless is the word, with an odd mix of materials, health care and tech lagging. US futures are a notch higher this morning.
FI: Global bond yields rose modestly yesterday and ahead of the US CPI data for April released today. The consensus expectation is for a rise of 0.4% m/m and 5.5% y/y in the core CPI relative to 0.4% m/m and 5.6% y/y in March. Hence, the market is prepared for some solid US CPI data and if the data surprises on the downside we expect a solid positive reaction in the global bond market.
FX: Yesterday, EUR/USD moved below the 1.10 mark on the back of broad risk-off sentiment in markets. Likewise, EUR/GBP moved firmly below 0.87 and is currently trading at the lowest level since December 2022. EUR/SEK ended the day slightly lower but was overall relatively unfazed by the Riksbank minutes that were less dovish than expected. For NOK, the key release today will be release of Norwegian inflation.
Credit: Reflecting the weak overall sentiment, iTraxx Main widened by 2bp to 88bp while Xover widened 9bp to 459bp yesterday. In the Nordic markets the decision by Swedish property lender SBB to postpone its dividend payment and cancel its planned rights issue following the recent S&P downgrade to high-yield status put focus back on the challenges faced by the CRE sector.
Nordic macro
In Denmark we expect a big decline in CPI inflation in April to 5.3% from 6.7% in March. Energy prices will be the key driver as what looks like a decline in electricity and natural gas prices replaces the April price surge from last year in the inflation measure. The April 2022 increase in tobacco fees also exits the inflation measure which reduces inflation by another 0.1-0.2 percentage points. Food prices will be key to the outcome and uncertainty here is high. German food prices declined quite significantly in April, but they have also increased a lot more than Danish prices. We continue to expect an elevated price pressure here, although not nearly as big as what we saw in Q1.
Norwegian core inflation remains high, but no longer seems to be accelerating. However, looking beyond the aggregate figures, we can see that while the price of goods (including agricultural goods) have started to fall, prices of services are clearly still rising and import prices have now also started to climb sharply. This last factor is probably due to the NOK weakening seen since the autumn, and there is much to suggest that it will continue to do so for some time. Core inflation was likely also relatively high in April, and we believe it rose by 6.2% y/y in April.
In Sweden March consumption and production value indicators are released at 08.00 CET. Considering that we already have the Q1 GDP indicator, these two will only add colour to that figure. We believe it will illustrate the increasing division between the production and demand sides of the economy. The Swedish market will also take a special look at the April inflation data in Norway and Denmark as these may have implications for the Swedish ditto released Monday 15th.
GBP/JPY Daily Outlook
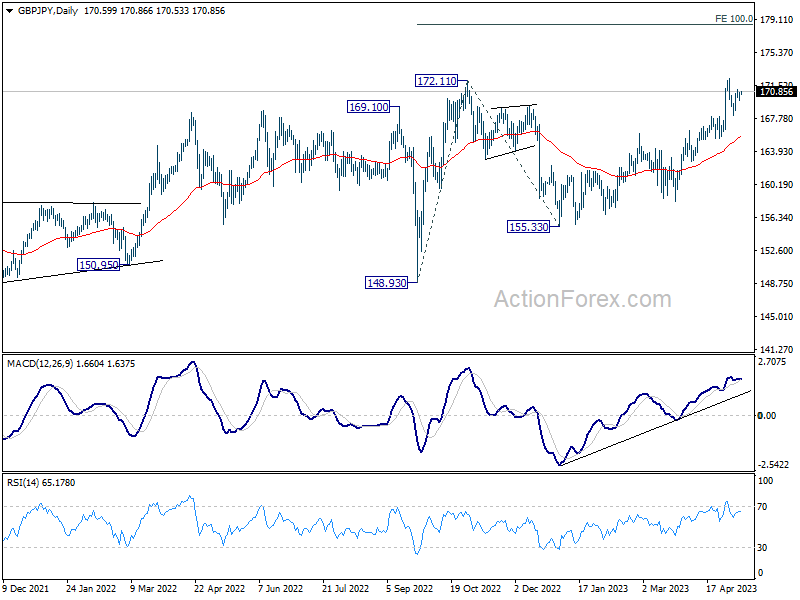
Daily Pivots: (S1) 170.12; (P) 170.42; (R1) 170.98; More...
Intraday bias in GBP/JPY remains neutral as consolidation from 172.30 is still extending. Further rally is in favor with 167.95 resistance turned support intact. On the upside, break of 172.30 will resume larger up trend to 100% projection of 148.93 to 172.11 from 155.33 at 178.51. Nevertheless, firm break of 167.95 should confirm short term topping, and turn bias back to the downside for deeper pull back to 165.40 support instead.
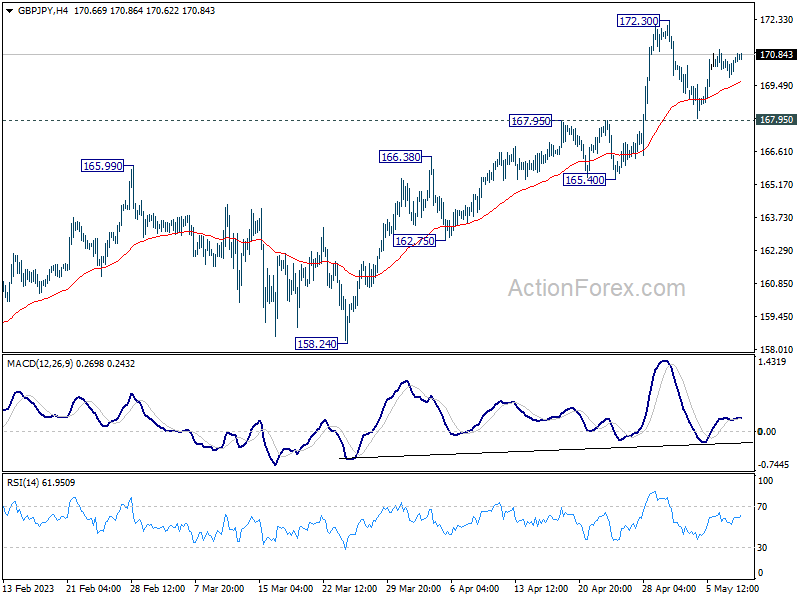
In the bigger picture, based on current momentum, up trend from 123.94 (2020 low) is likely ready to resume. Next target is 161.8% projection of 122.75 (2016 low) to 156.59 (2018 high) from 123.94 at 178.69. This will now remain the favored case as long as 165.40 support holds, in case of retreat.
EUR/JPY Daily Outlook
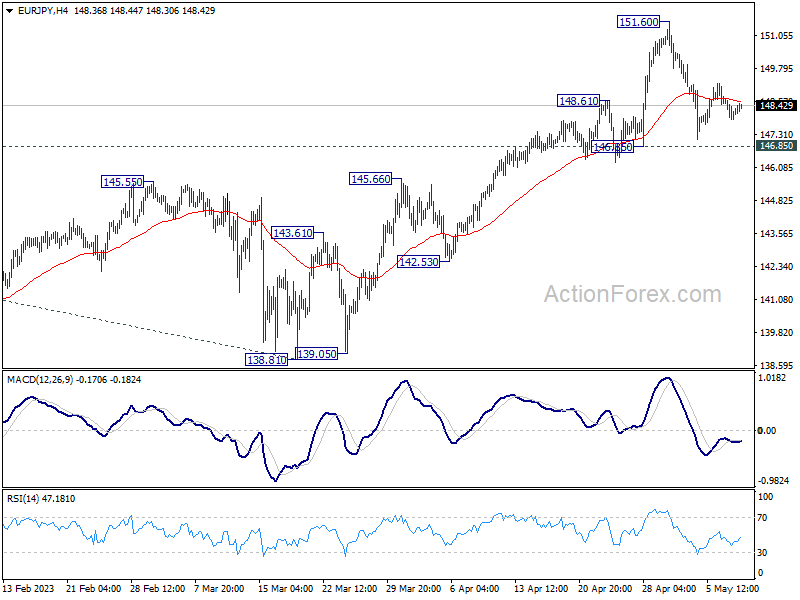
Daily Pivots: (S1) 147.85; (P) 148.29; (R1) 148.68; More....
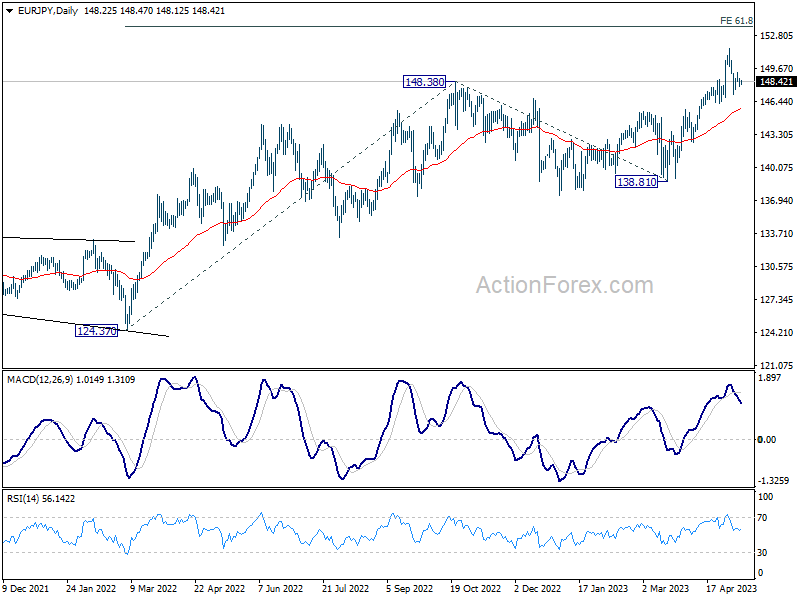
Intraday bias in EUR/JPY stays neutral at this point as range trading continues. Further rise is still expected with 146.85 support intact. On the upside, break of 151.60 will resume larger up trend to 153.64 projection level. Nevertheless, firm break of 146.85 will confirm short term topping and turn bias to the downside for deeper pull back.
In the bigger picture, current development indicates that rise from 114.42 (2020 low) is in progress. Next target is 61.8% projection of 124.37 to 148.38 from 138.81 at 153.64. Sustained break there will pave the way to 100% projection at 162.82. For now, medium term outlook will remain bullish as long as 138.81 support holds, even in case of deep pull back.
EUR/GBP Daily Outlook
Daily Pivots: (S1) 0.8669; (P) 0.8696; (R1) 0.8713; More...
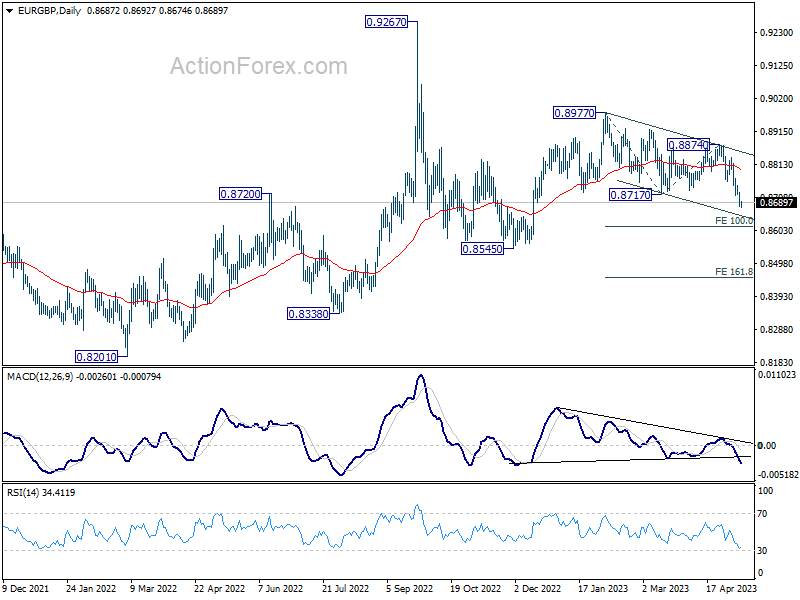
EUR/GBP's choppy decline from 0.8977 is in progress. Intraday bias stays on the downside for 100% projection of 0.8977 to 0.8717 from 0.8874 at 0.8614. Firm break there will pave the way to 161.8% projection at 0.8453. On the upside, above 0.8745 minor resistance will turn intraday bias neutral first. But outlook will remain cautiously bearish as long as 0.8874 resistance holds.
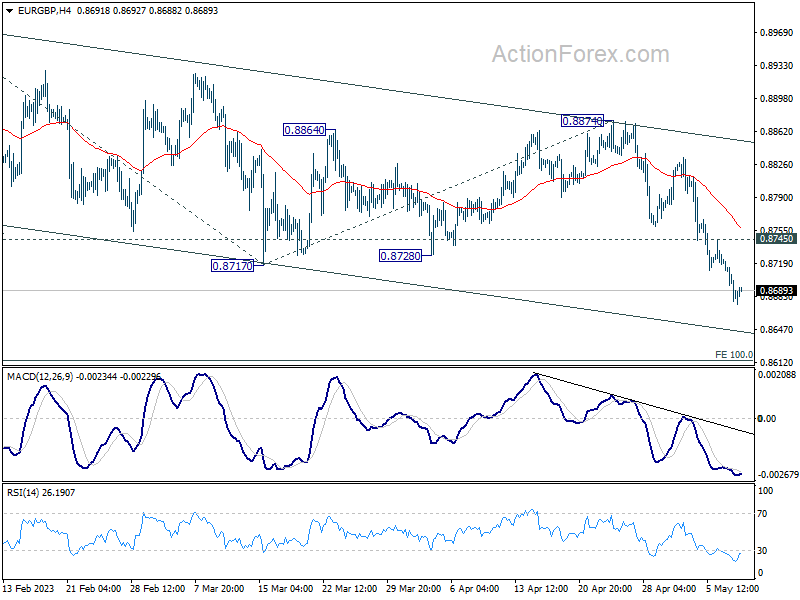
In the bigger picture, current development argues that whole decline from 0.9267 (2022 high) is still in progress. This is part of the long term range pattern from 0.9499 (2020 high). Deeper fall would be seen to 0.8338 support, or further to 0.8201. This will now remain the favored case as long as 0.8874 resistance holds.
EUR/AUD Daily Outlook
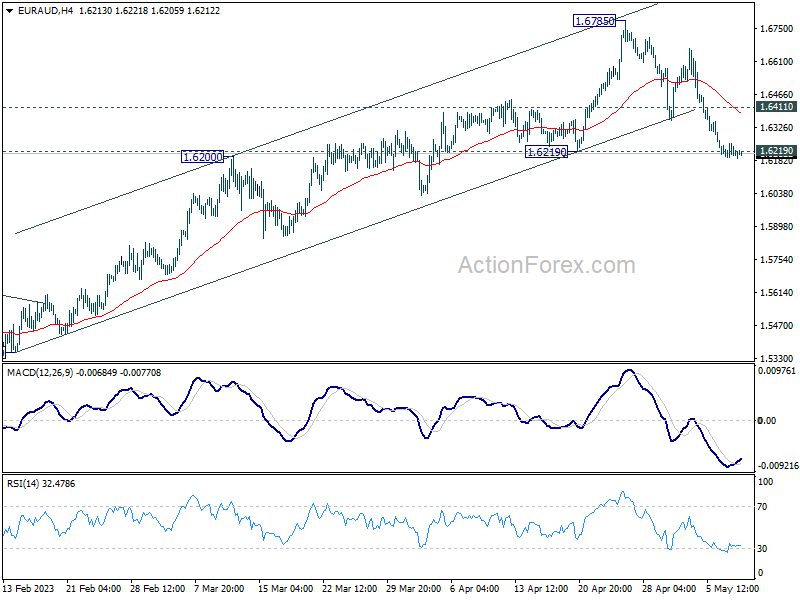
Daily Pivots: (S1) 1.6185; (P) 1.6221; (R1) 1.6246; More...
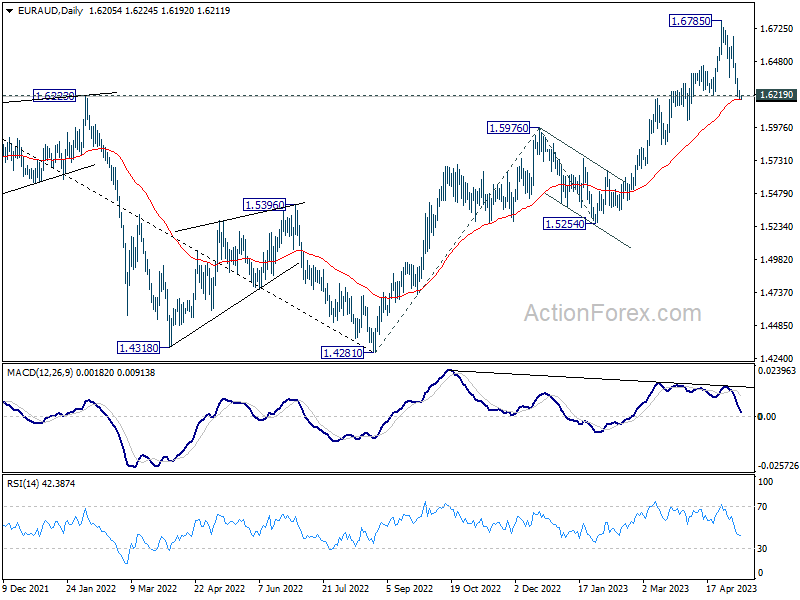
Focus stays on 1.6219 support in EUR/AUD. Considering bearish divergence condition in D MACD, decisive break of 1.6219 will argue that it's already in correction to whole up trend from 1.4281. Deeper decline would then be seen towards 1.5254/5976 support zone instead. Meanwhile, rebound from current level, followed by 1.6411 minor resistance will retain near term bullishness, and turn bias back to the upside for retesting 1.6785 resistance instead.
In the bigger picture, the solid break of 1.6434 resistance argues that whole down trend from 1.9799 (2020 high) has completed at 1.4281 (2022 low). Further rise should be seen to 61.8% retracement of 1.9799 to 1.4281 at 1.7691 next. For now, outlook will stay bullish as long as 1.5976 resistance turned support holds, even in case of deep pull back.
EUR/CHF Daily Outlook
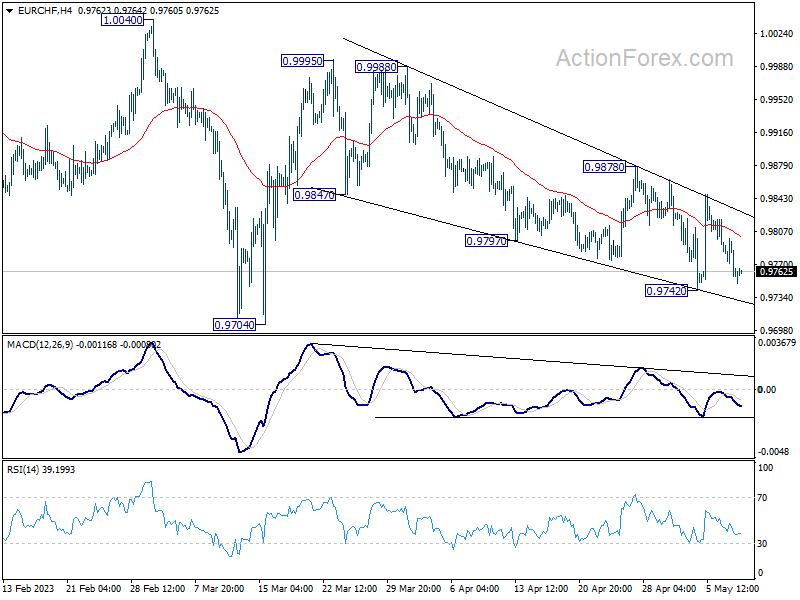
Daily Pivots: (S1) 0.9746; (P) 0.9774; (R1) 0.9788; More...
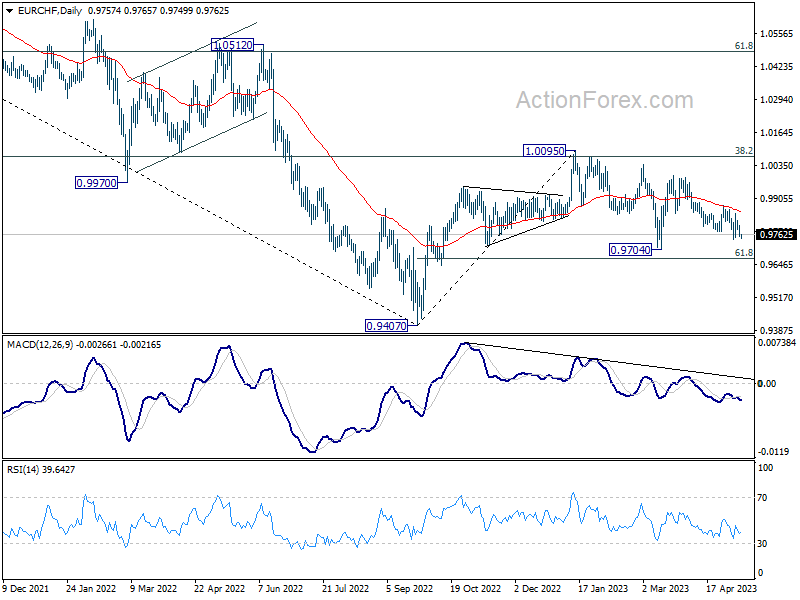
No change in EUR/CHF's outlook and intraday bias remains neutral first. Fall from 0.9995 is a correction to rise from 0.9704 only. Break of 0.9878 resistance will indicate that such correction has completed and target 0.9995. Firm break there should confirm that larger corrective decline from 1.0095 has completed at 0.9704 too.
In the bigger picture, prior rejection by 55 W EMA (now at 0.9971) and 38.2% retracement of 1.1149 to 0.9407 at 1.0072 suggests that medium term outlook is staying bearish. That is, down trend from 1.2004 is not completed yet and is in favor to resume through 0.9407 at a later stage. However, decisive break of 1.0095 resistance will raise the chance of bullish trend reversal. Rise from 0.9407 should then target 1.0505 cluster resistance (2020 low at 1.0505, 61.8% retracement of 1.1149 to 0.9407 at 1.1484).