Sample Category Title
Australia sees second consecutive quarter of falling retail sales volume amidst rising living costs
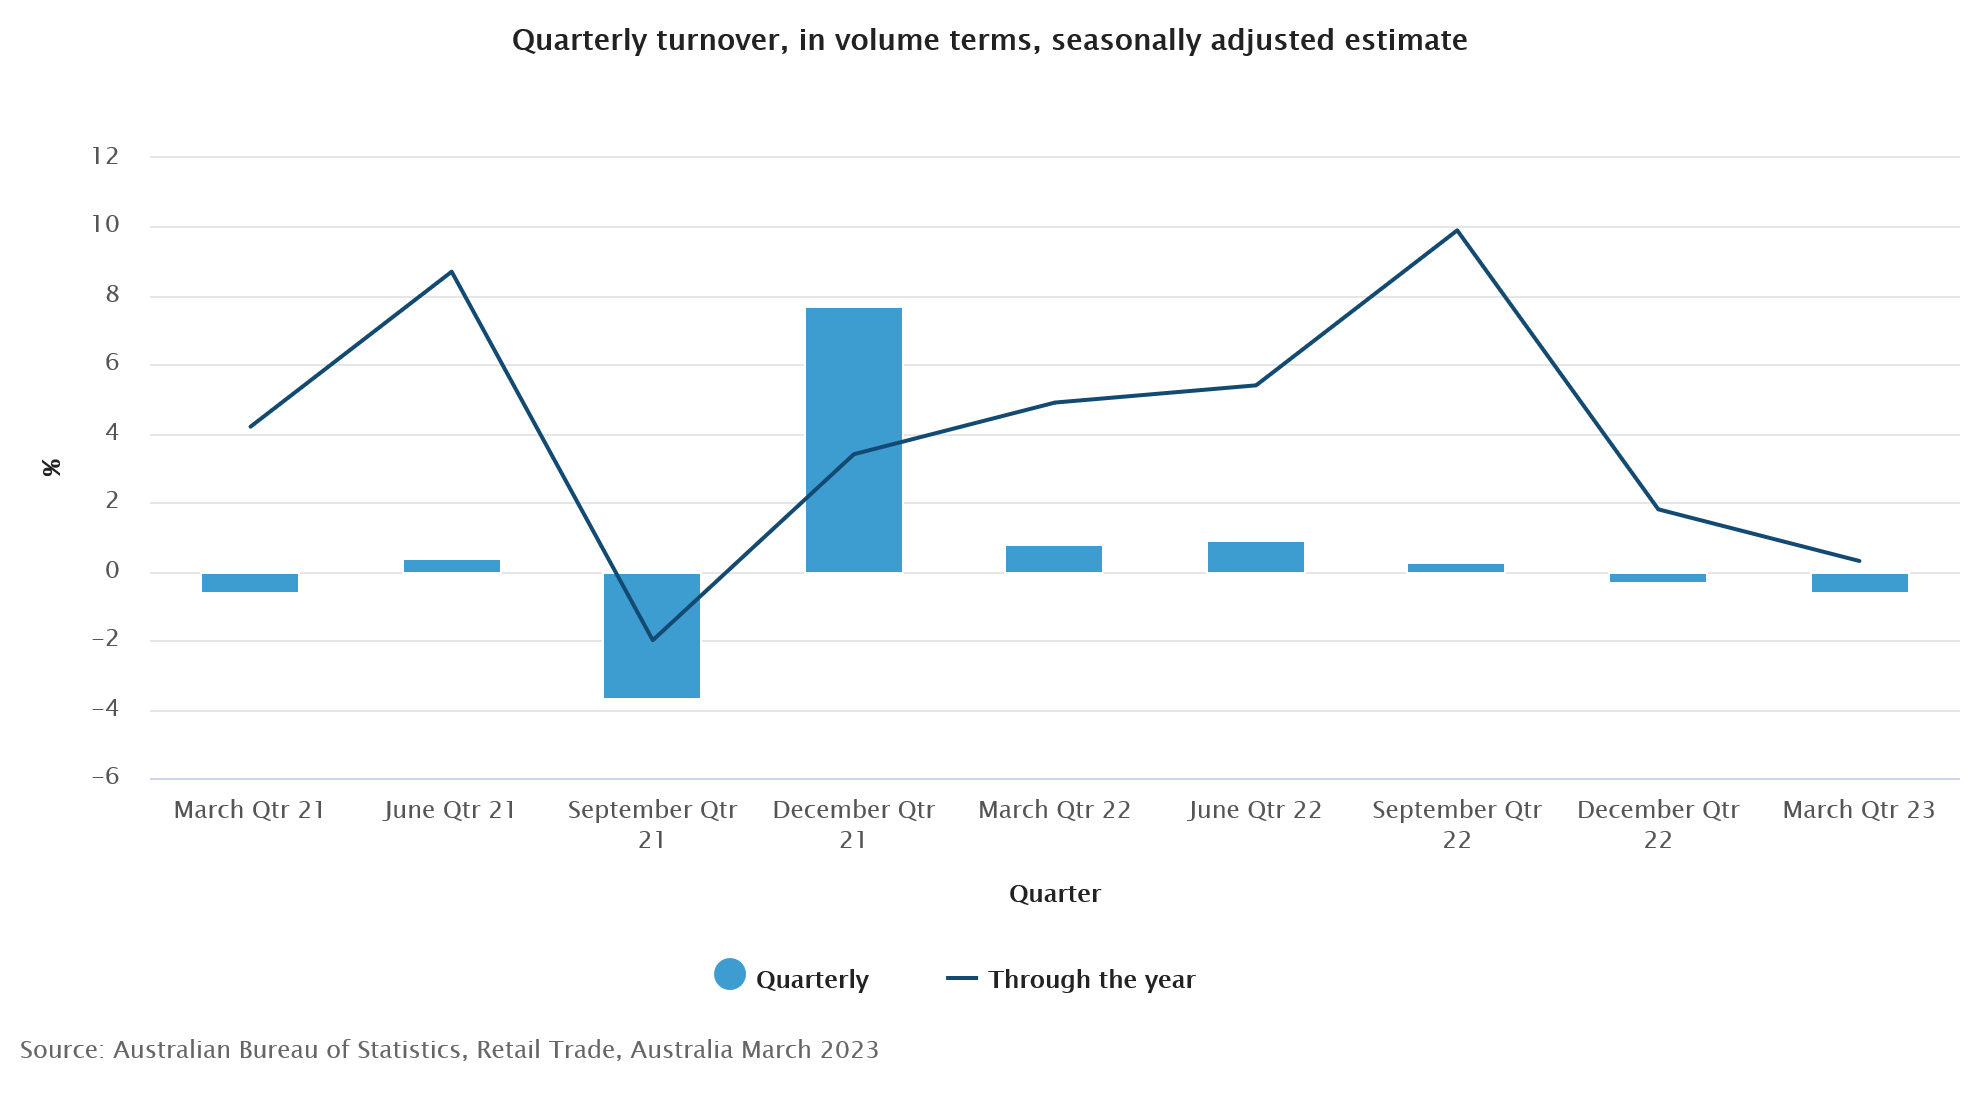
Australia's retail sales volume declined by -0.6% qoq to AUD 96.17 billion in Q1 2023. Through the year, sales volume only managed to register a modest 0.3% yoy growth in the quarter.
ABS's head of retail statistics, Ben Dorber, noted that this marked the second consecutive quarter of falling retail sales volumes, primarily influenced by mounting cost of living pressures that continue to burden household spending.
"Outside of the COVID-19 pandemic period, this is the largest fall in retail sales volumes since the September quarter of 2009," Dorber stated, underlining the gravity of the situation.
Meanwhile, retail prices growth has slowed to 0.6% qoq in Q1. "Retail prices rose for the sixth straight quarter, but price growth this quarter is the smallest since September 2021," Dorber added.
He attributed the slowdown in price growth mainly to discounts on clothing and larger household items such as furniture and electronic goods. However, he noted that food retailing prices continued their upward trajectory.
China exports rose 8.5% yoy in Apr, exports to Russia surged 153% yoy
China's April exports outperformed expectations, growing by 8.5% yoy to reach USD 295.4B. This marked the second consecutive month of growth, exceeding anticipated 8.0% yoy. However, imports dropped by -7.9% yoy to USD 205.2B, falling short of expected 0.0% yoy. As a result, trade surplus widened from USD 88.2B to USD 90.2B, significantly surpassing the forecasted USD 69.0B.
Breaking down the numbers, exports to EU experienced a modest growth of 3.7% yoy, while imports from the bloc saw a slight decrease of -0.12% yoy. Trade with the US reflected a downturn, with exports dropping by -6.5% yoy and imports declining by -3.1% yoy.
Trade relations with ASEAN region were mixed, with exports increasing by 4.49% yoy, while imports fell by -6.25% yoy. Meanwhile, trade with Russia exhibited a significant surge. Chinese exports to Russia skyrocketed by a staggering 153.09% yoy, and imports also rose, though at a more modest rate of 8.06% yoy.
BoJ Ueda sees position signs in trend inflation
BoJ Governor Kazuo Ueda pointed to encouraging signs in trend inflation during a recent parliamentary session. "We're seeing some positive signs in trend inflation, including inflation expectations," Ueda said. He added that once the BOJ could foresee inflation stably and sustainably meeting their 2% target, they would "abandon yield curve control and then move towards shrinking the bank's balance sheet."
Ueda also spoke about the upcoming monetary policy review, stating it would critically examine the benefits and side effects of past monetary policies. The review process will include workshops with private academics. However, the governor clarified that the central bank did not have any preconceived notions about how the review could influence future monetary policy decisions.
"We will take necessary policy steps at each of our rate reviews, with an eye on financial and price developments, even while we conduct the review," Ueda stated.
Elliott Wave Suggests Short Term Bullish Outlook in GBPJPY
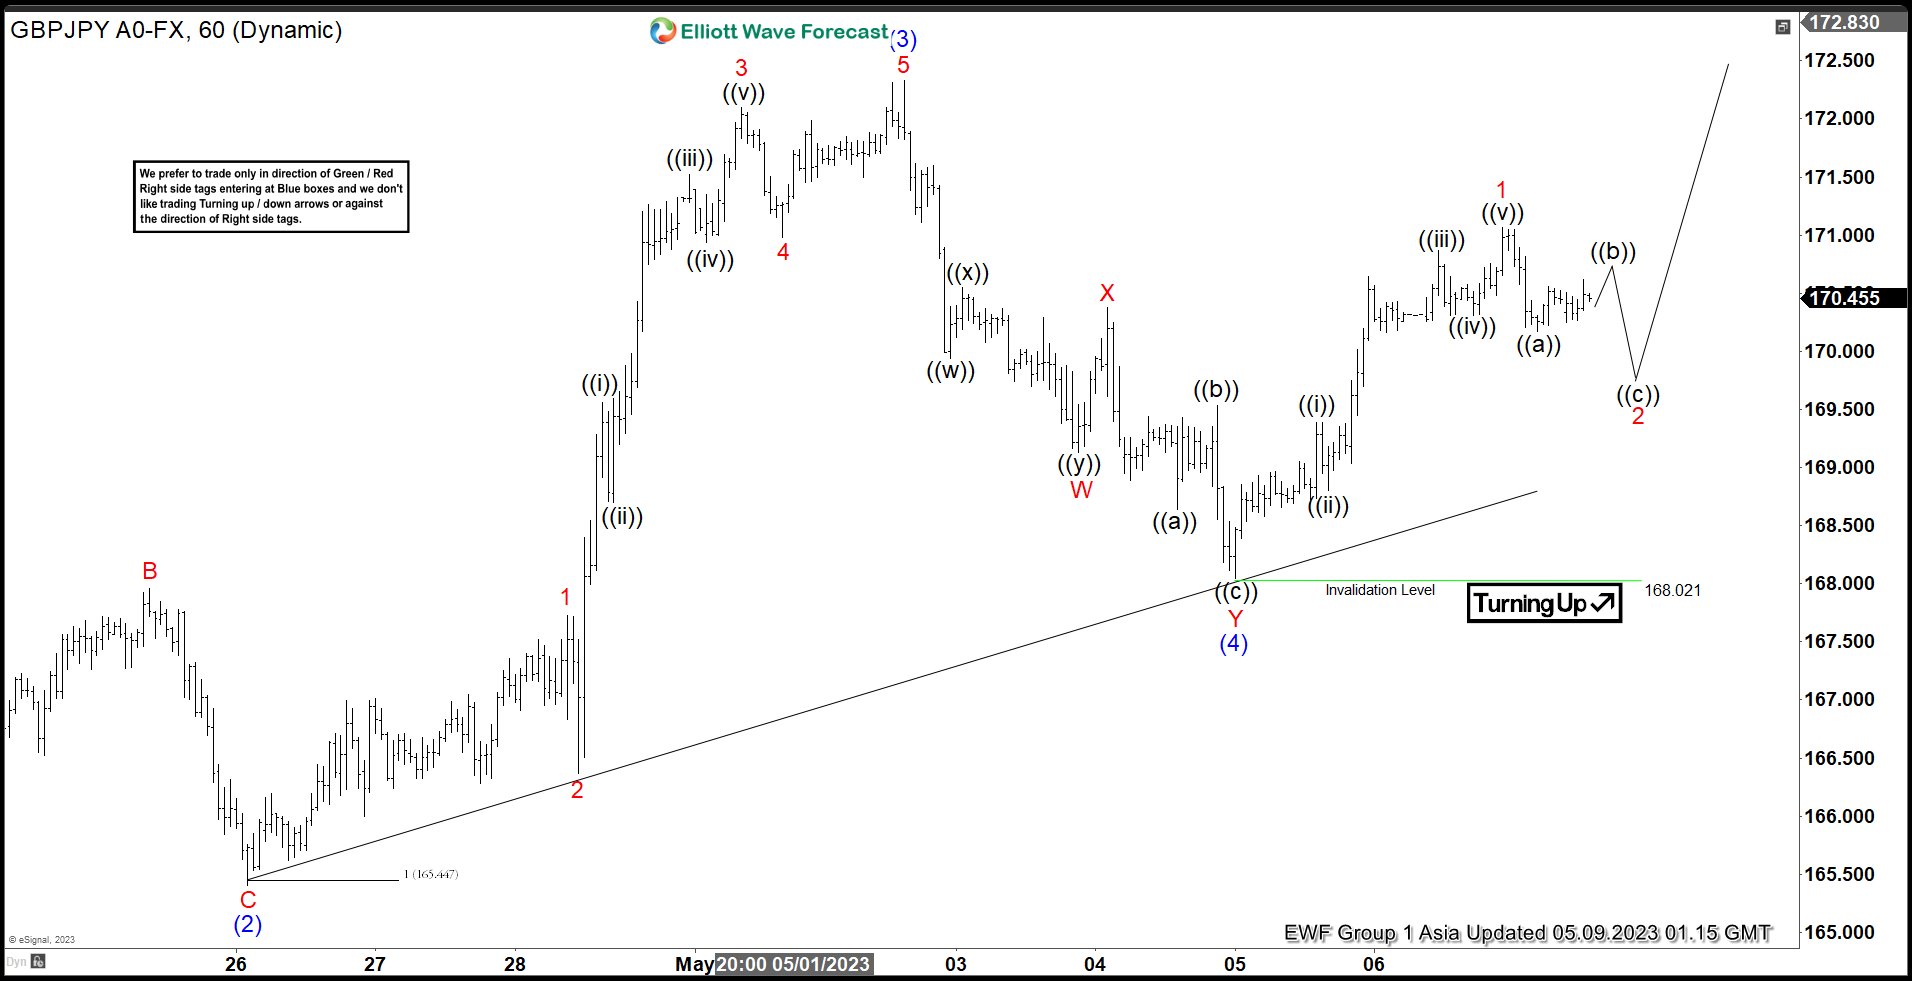
Cycle from 1.3.2023 low is in progress as a 5 waves impulsive Elliott Wave structure. Short Term Elliott Wave Chart below shows that wave (2) ended at 165.4 and pair resumes higher in wave (3). Internal subdivision of wave (3) unfolded as another impulse in lesser degree. Up from wave (2), wave 1 ended at 167.72 and pullback in wave 2 ended at 166.37. Pair resumes higher again in wave 3 towards 172.09 and dips in wave 4 ended at 170.98. Final leg wave 5 ended at 172.33 which completed wave (3). Dips in wave (4) took the form of a double three Elliott Wave structure. Down from wave (3), wave ((w)) ended at 169.94, wave ((x)) ended at 170.54, and wave ((y)) ended at 169.13. This completed wave W. Rally in wave X then ended at 170.37.
Pair resumes lower in wave Y with internal subdivision as a zigzag. Down from wave X, wave ((a)) ended at 168.63, wave ((b)) ended at 169.53, and wave ((c)) ended at 168.02. This completed wave Y of (4). Pair has turned higher again wave (5) as an impulse. Up from wave (4), wave ((i)) ended at 169.387 and dips in wave ((ii)) ended at 168.8. Wave ((iii)) ended at 170.87, pullback in wave ((iv)) ended at 170.3, and final wave ((v)) ended at 171.07 which completed wave 1. Pair is now correcting cycle from 5.5.2023 low in 3, 7, or 11 swing within wave 2 before the rally resumes again. Down from wave 1, wave ((a)) ended at 170.17 and wave ((b)) ended at 170.61. Expect wave ((c)) lower resume and as far as pivot at 168.02 low stays intact, pair should resume higher again afterwards.
GBPJPY 1 Hour Elliott Wave Chart
GBPJPY Elliott Wave Video
https://www.youtube.com/watch?v=pRHJH1pmQSA
USDX Forecasting The Decline After Elliott Wave Double Three
Hello fellow traders. In this technical article we’re going to take a look at the Elliott Wave charts charts of Dollar index published in members area of the website. As our members know USDX has recently made recovery against the 105.87 peak that has unfolded as Elliott Wave Double Three Pattern. It made clear 7 swings from the lows and completed correction near the extreme zone. In further text we’re going to explain the Elliott Wave pattern and forecast
Before we take a look at the real market example, let’s explain Elliott Wave Double Three pattern.
Elliott Wave Double Three Pattern
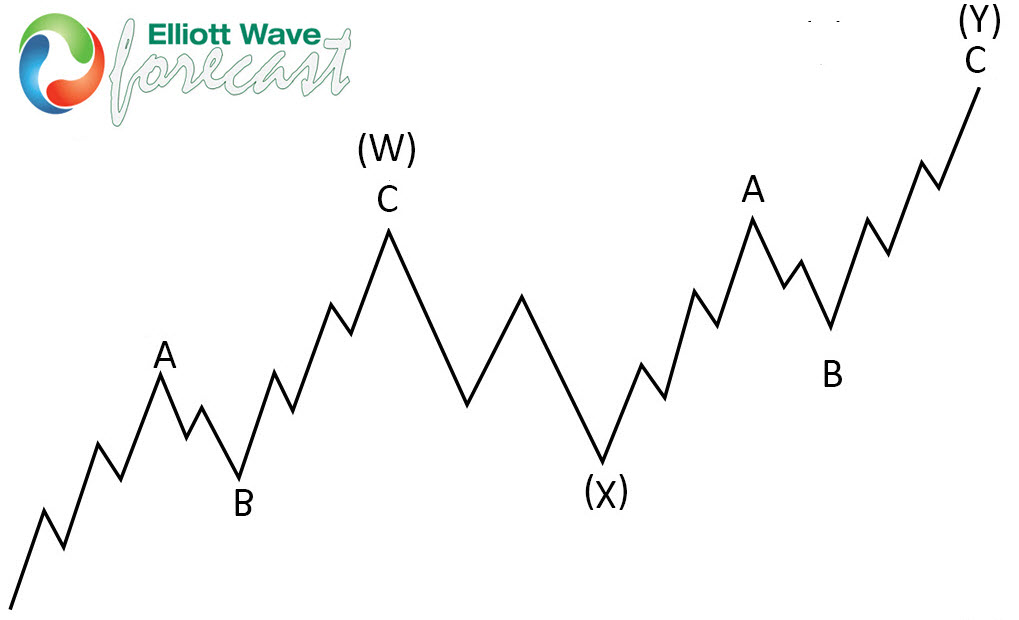
Double three is the common pattern in the market , also known as 7 swing structure. It’s a reliable pattern which is giving us good trading entries with clearly defined invalidation levels.
The picture below presents what Elliott Wave Double Three pattern looks like. It has (W),(X),(Y) labeling and 3,3,3 inner structure, which means all of these 3 legs are corrective sequences. Each (W) and (Y) are made of 3 swings , they’re having A,B,C structure in lower degree, or alternatively they can have W,X,Y labeling.
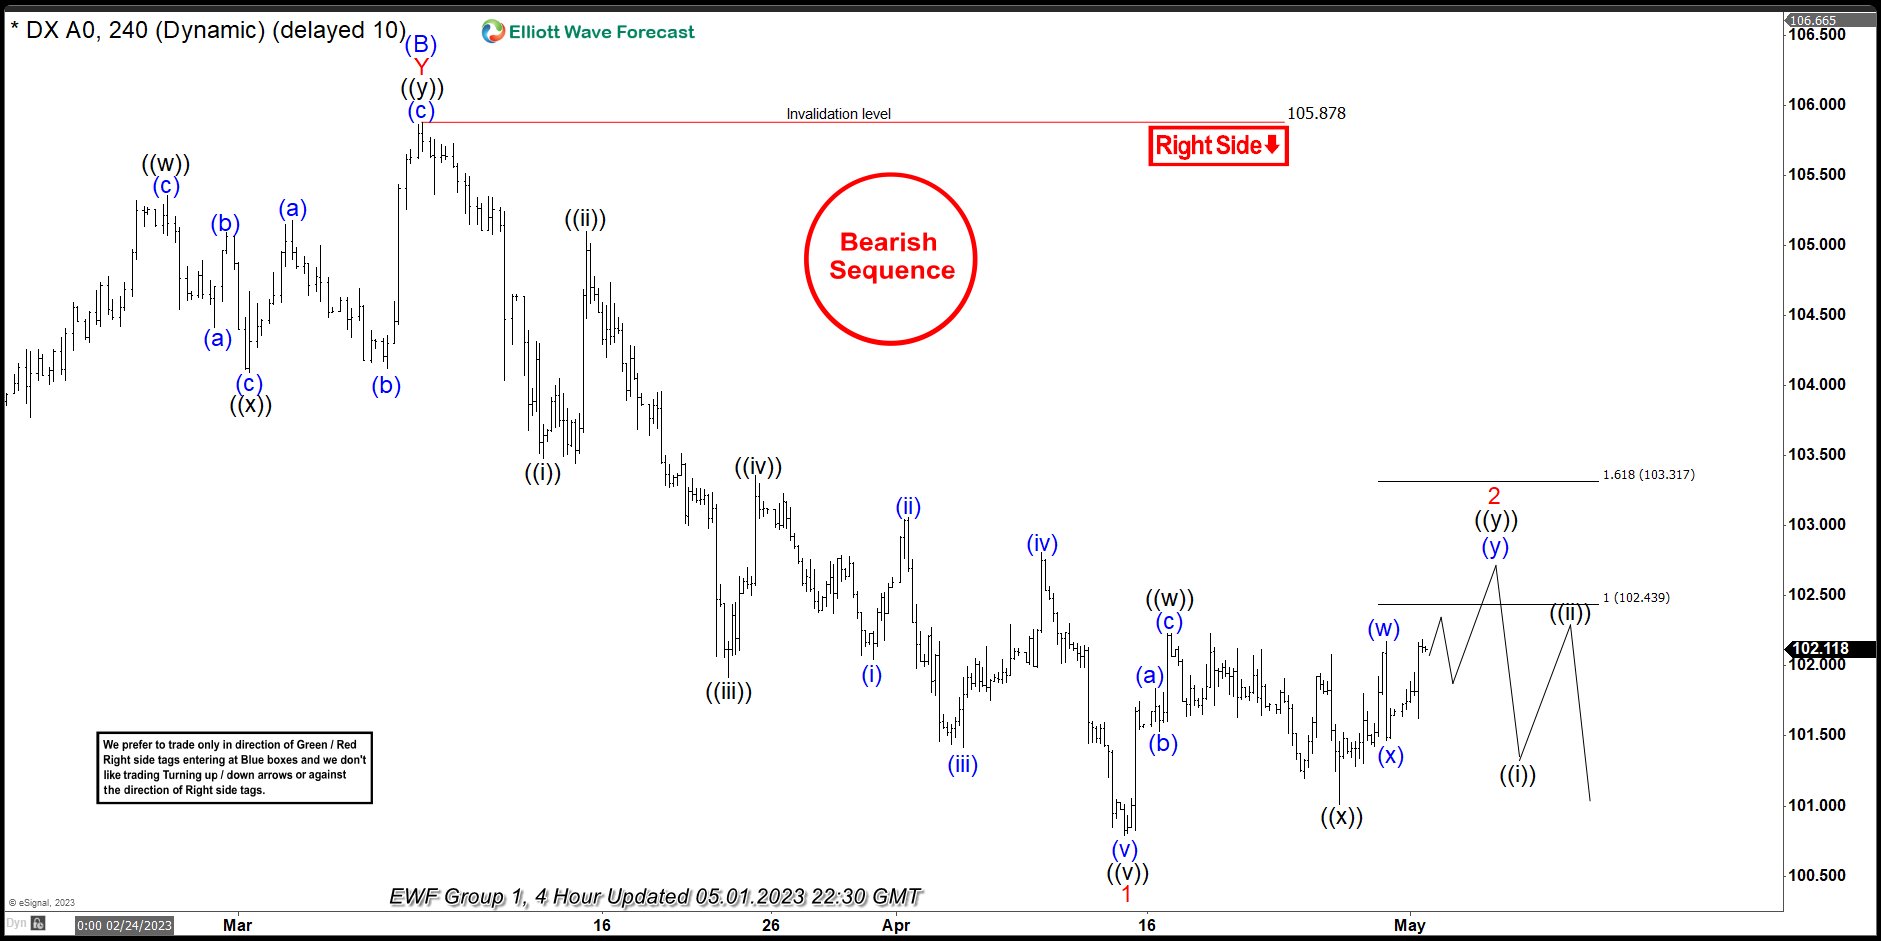
USDX 1h Hour Elliott Wave Analysis 05.01.2023
Dollar index ended cycle from the 105.87 peak as 5 waves structure. Currently USDX is giving us 2 red recovery that is unfolding as Elliott Wave Double Three Pattern. Correction has ((w))((x))((y)) black inner labeling. The price structure is still incomplete. We expect to see more short term strength in 7th swing toward 102.43-103.3 area to complete proposed correction. At that zone buyers should be ideally taking profits and sellers can appear again. Consequently , we expect to see reaction from the marked area. We can see either decline toward new lows or larger 3 waves pull back at least.
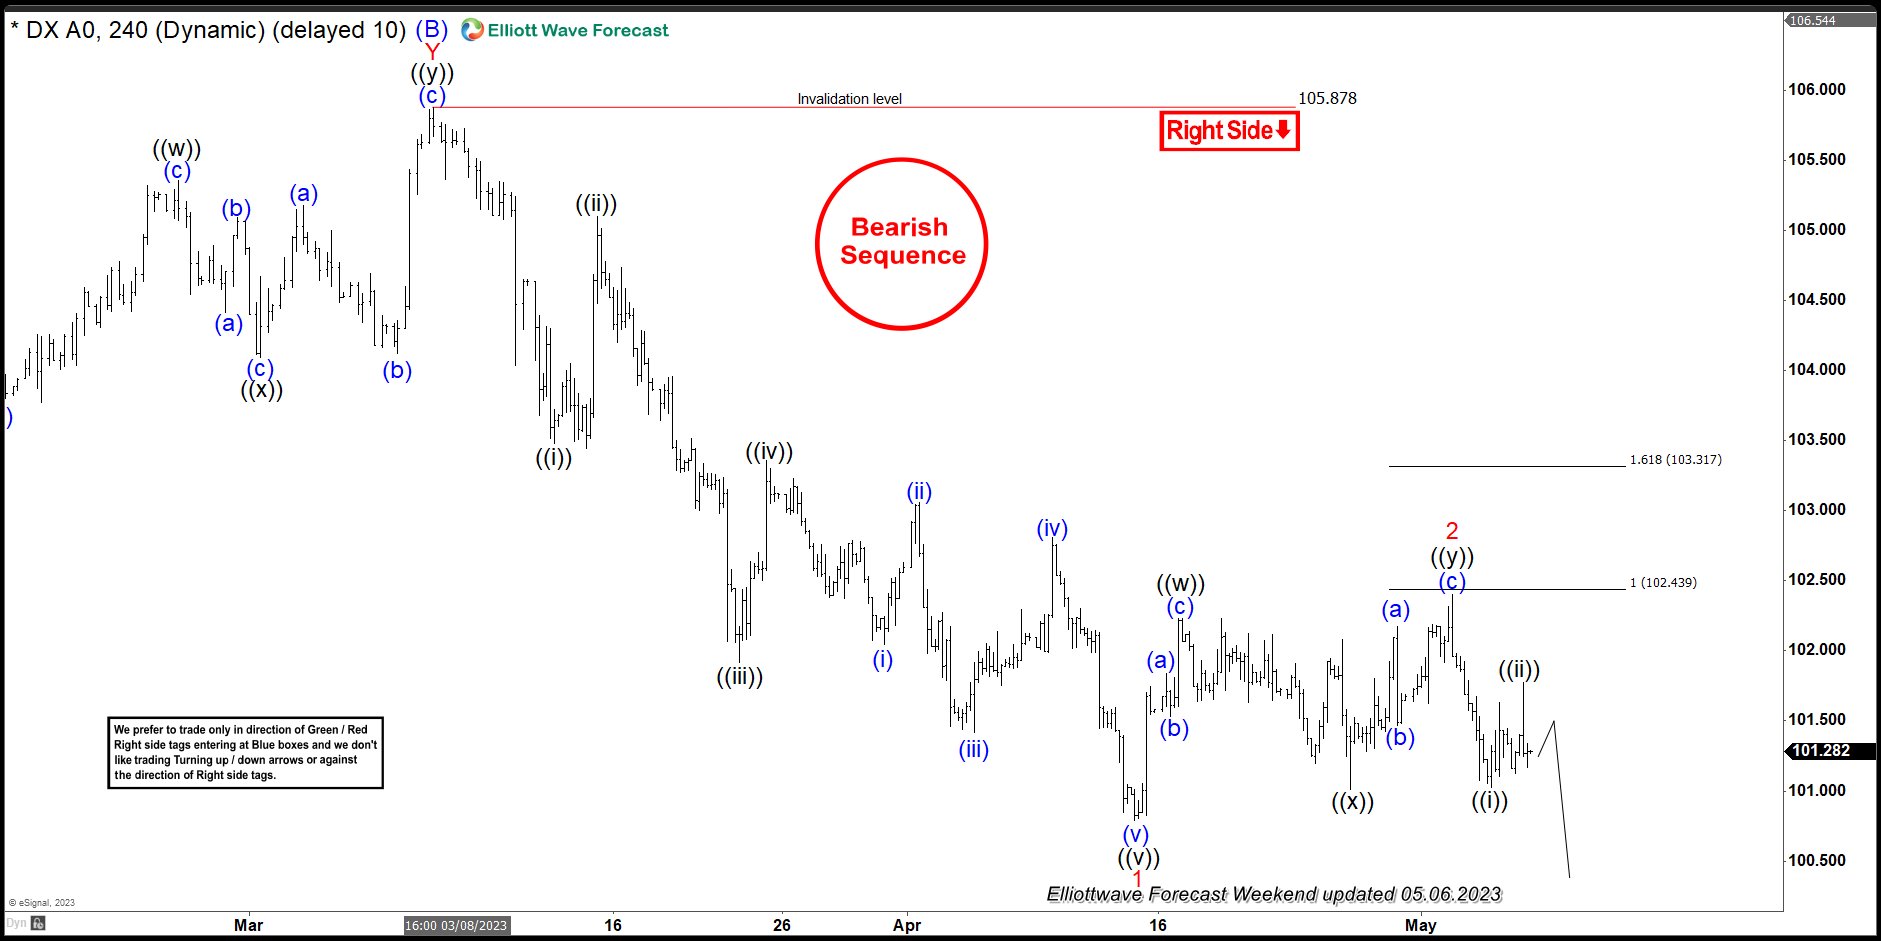
USDX 1h Hour Elliott Wave Analysis 05.06.2023
USDX made extension higher and almost reached 102.43 area. It found sellers and made decline as we expected. Current view suggests 2 red recovery completed at 102.4 high. As far as the price holds below that peak, further weakness should follow, otherwise larger correction can be taking place in 7 swings. We should wait for a break of 1 red low , which will confirm next leg down is in progress.
GBP/USD Extends Increase But Momentum Keeps Fading
Key Highlights
- GBP/USD climbed further higher toward the 1.2680 resistance.
- A major bullish trend line is forming with support at 1.2520 on the 4-hour chart.
- EUR/USD is still trading below the 1.1090 resistance zone.
- Crude oil price corrected losses and recovered toward $74.
GBP/USD Technical Analysis
The British Pound remained in a positive zone above 1.2500 against the US Dollar. GBP/USD extended its increase above the 1.2550 and 1.2620 resistance levels.
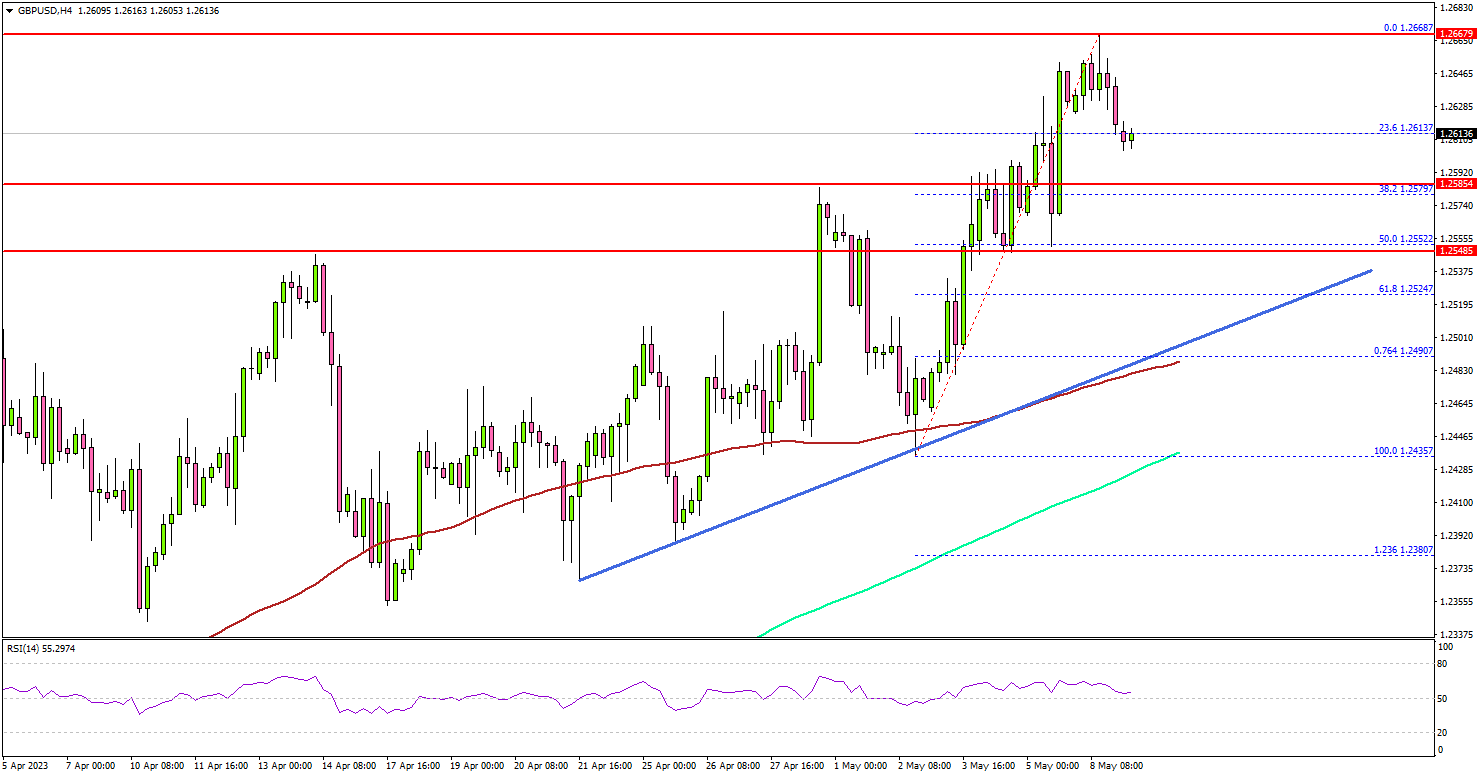
Looking at the 4-hour chart, the pair settled above the 1.2550 level, the 100 simple moving average (red, 4 hours), and the 200 simple moving average (green, 4 hours).
However, the pair seems to be losing bullish momentum above 1.2650. If there is a downside correction, the pair might test the 1.2590 support. The next major support is near the 1.2550 level.
There is also a major bullish trend line forming with support at 1.2520 on the same chart. If there is a downside break below the trend line support, the pair could test the 100 simple moving average (red, 4 hours) at 1.2480.
Immediate resistance on the upside is near the 1.2680 level. The next key resistance is near the 1.2740 level. A clear upside break and close above the 1.2740 resistance might start another steady increase. The next key resistance is near the 1.2850 zone. Any more gains might send the pair toward 1.2900.
Looking at crude oil price, there was a decent recovery wave from the $63.80 zone and the price climbed toward $74.
Economic Releases
- UK Halifax House Price Index for April 2023 (MoM) - Forecast +0.2%, versus +0.8% previous.
- UK Halifax House Price Index for April 2023 (3m/YoY) - Forecast +1.7%, versus +1.6% previous.
ECB Lane predicts disinflation later this year, despite ongoing core inflation momentum
ECB Chief Economist Philip Lane acknowledged the ongoing momentum in inflation but predicted a shift toward disinflation later this year.
Speaking at a panel in Berlin, Lane said, "There's still a lot of momentum in inflation, but later this year and ongoing a lot of this inflation is supposed to reverse, partly because of the reversal of the underlying shocks, partly because of monetary policy."
Despite this outlook, Lane noted that there is still momentum in food and core inflation, which runs counter to the decline in energy inflation.
Discussing businesses' expectations, Lane mentioned, "This year (businesses) expect margins to fall quite a bit, because they may face cost increases, including labour costs increases, but they won't be able to increase prices by so much because demand is normalising."
He also emphasized the importance of rebuilding real wages in the labor market, stating, "There's a very basic imperative for the labour market to rebuild real wages." Lane explained that this transition phase, which will last several years, helps clarify why inflation is not immediately dropping back to 2%.
Sunset Market Commentary
Markets
Core bonds extended declines in the wake of Friday’s stronger-than-expected US payrolls report. The 13th beat in a row served as a reminder to investors focused on financial stability and the US debt ceiling that there’s a price stability objective to fulfil as well. At the very least, it prevents the Fed from cutting rates as quickly as markets currently expect (2023H2). With the help of technical support areas and the US regional banking crisis (temporarily) moving to the background, American yields seized the opportunity to leave the YtD lows further behind on the first trading day of the week. Yields add 6.2-6.8 bps across the curve. German Bund yields rise between 3.5 and 5.7 bps, marginally underperforming vs. European swaps. Economic data was limited to German industrial production. March output missed expectations for a 1.5% m/m decline by coming in at -3.4%. But it triggered little else than a kneejerk and temporary Bund tick higher. In late US dealings, the Fed’s Senior Loan Officer Opinion Survey (the US equivalent of the ECB’s Bank Lending Survey) and the Financial Stability report is due and could still trigger some market volatility. Focus after that shifts to the White House. President Biden on Tuesday will host the House Speaker and other congressional leaders in a bid to unlock the debt ceiling stalemate. US April inflation numbers are due on Wednesday. Consensus estimates are for headline inflation to have stopped declining at 5% y/y (0.4% m/m) while core inflation is seen “easing” from 5.6% to 5.5% (0.3% m/m). The UK steals some of the thunder on Thursday with the Bank of England meeting. It will include new projections and a thorough impact assessment of SVB’s collapse. Q1 GDP numbers are scheduled for release one day later. Financial markets on the British island are closed today though, as they enjoy a long coronation weekend.
The big three on currency markets lose out today. The Japanese yen underperforms but since both the USD and euro trade fairly week too, the damage in the likes of USD/JPY (flirting with 135) is contained. EUR/JPY ekes out a small gain to 149. EUR/USD edges north to trade in the 1.104 area. The trade-weighted dollar loses a tad to 101.13. Commodity-driven currencies including the AUD, NZD and NOK perform well today. Oil prices rally for a third day straight (see below). A barrel of Brent (+2%) now trades at $76.73. Gold stabilizes around $2022/ounce after sliding 1.75% last Friday, be it from a level just shy of a record high. Stock markets trade/open flat in Europe/the US.
News & Views
Oil and gas prices rise around 3% today, linked to Canadian supply problems. Wildfires are raging through the providence of Alberta triggering a provincial state of emergency. The evacuations of almost 30 000 inhabitants is ongoing with oil and natural gas wells and pipeline systems being shut down. For now, the most hit region is Western Alberta, unlike 2016 when massive wildfires were concentrated in the northeast and forced the shutdown of more than 1 million barrels/day. Brent crude extends last week’s rebound, rising from $75/b to $77/b. Last week, Brent bounced off support in the low $70/b area.
The Chilean peso gained some ground against the dollar with USD/CLP nearing key support at 776/783. The currency profits from local election results where opposition conservatives delivered a big blow to the progressive president Boric’ plans to rewrite the constitution (return to Pinochet era). Right-wing candidates won 33 seats on the Constitutional Council responsible for the rewrite compared to 17 for leftist contenders. The opposition passed the three-fifths majority bar allowing to push through articles at will. President Boric’ first attempt to rewrite the constitution failed last year when it was voted away in a referendum over concerns that it would significantly weaken the country’s free-market economy.
EUR/USD Mid-Day Outlook
Daily Pivots: (S1) 1.0974; (P) 1.1011; (R1) 1.1055; More...
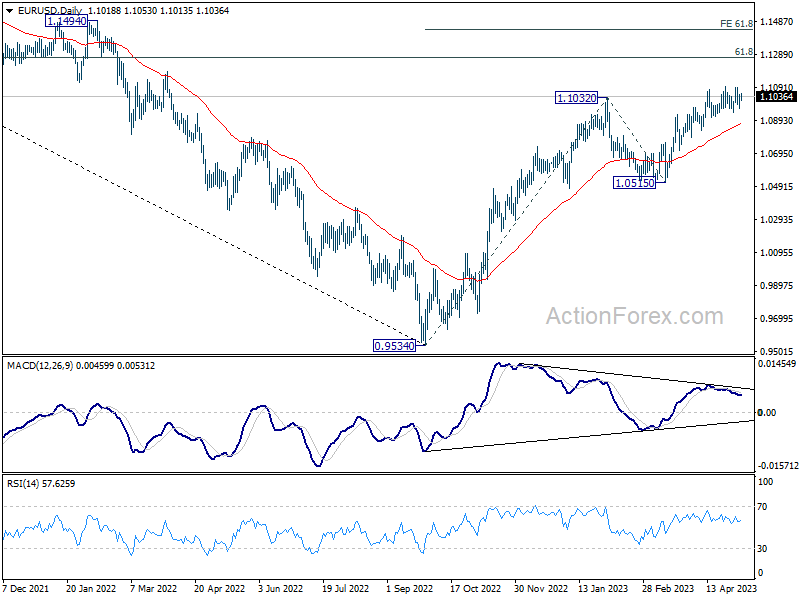
Range trading continues in EUR/USD and intraday bias stays neutral. But further rally remains in favor too. On the upside, firm break of 1.1094 will resume larger up trend to 1.1273 fibonacci level. Break there will target 61.8% projection of 0.9534 to 1.1032 from 1.0515 at 1.1441 However, considering bearish divergence condition in 4H MACD, break of 1.0908 support will indicate short term topping and turn bias back to the downside.
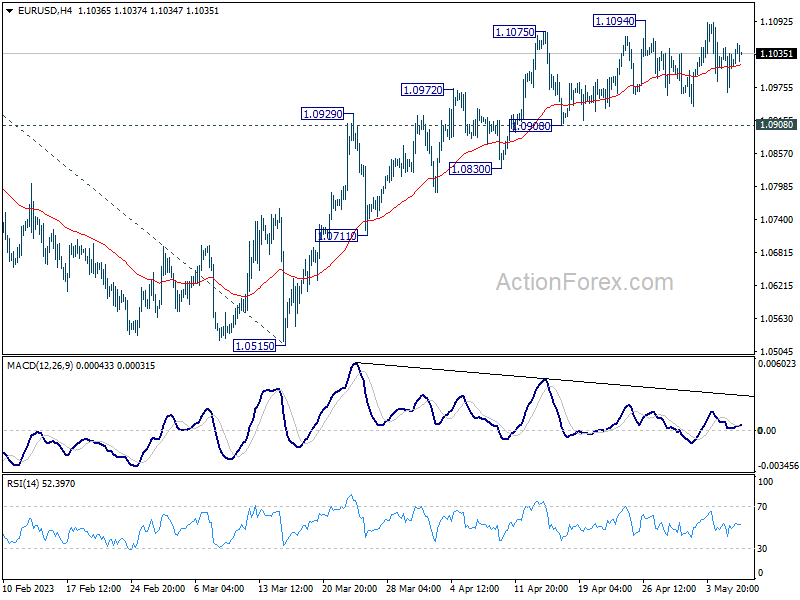
In the bigger picture, rise from 0.9534 (2022 low) is in progress for 61.8% retracement of 1.2348 (2021 high) to 0.9534 at 1.1273. Sustained break there will solidify the case of bullish trend reversal and target 1.2348 resistance next (2021 high). This will now remain the favored case as long as 1.0515 support holds, even in case of deeper pull back.