

Sample Category Title
Latest Survey Confirms Tightening Credit Conditions in the US, as Well
The week started on a mixed note. Bank stress further eased with PacWest and Western Alliance, which were the two banks that were on the chopping block after the First Republic Bank got swallowed by JPM, rallied, but gave back most of earlier gains. PacWest – which was up by more than 30% pre-market, ended the session with a 3.65% gain and Western Alliance with a 0.60% advance. But the SPDR’s US regional bank index lost 2%, as a confirmation that this type of wild price volatility is bad, even though it is on the top side.
Tighter credit conditions
Federal Reserve’s (Fed) senior loan officer opinion survey, which became the new hot data to watch for investors who are trying to put a hand on how much this whole crisis impacted credit conditions - came in worse than expected. The data showed that the banks who tightened credit conditions were higher than expected, around 46%, versus 44.8% expected. Tighter standards, weaker demand for commercial and industrial loans, less favorable macro conditions, reduced tolerance for risk, deterioration in collateral values and concerns about banks’ funding costs and liquidity positions were among key words and phrases that flashed out of that survey.
Debt ceiling impasse
On the political front, tensions regarding the US debt ceiling impasse remain high as US President Joe Biden meets congressional leaders today to discuss about a possibility to lift the debt ceiling to avoid a default which could hit the US as early as June 1st.
While suspense is killing everyone, Bill Gross, Pimco’s ex CIO says it’s a good idea to buy short term US papers at the current prices, as the debt ceiling discussion is ‘ridiculous, it always gets resolved’. Buying one, two-month treasury bills at a much higher rate than longer term papers is a good opportunity, according to him.
Indeed, the US 1-month bill now yields around 5.50%, while the 10-year paper is still around 3.50%. Note that this is not a risk-free trade, there is always a chance that an agreement on debt ceiling is not reached quickly and the risk is default gets real, but that’s the price you pay for taking the risk. No risk, no return!
In the FX
The US dollar outlook remains soft due to the bank stress and the debt ceiling impasse, which both increase the chances of slower growth and soften the Fed expectations. The dollar index has been slightly better at the start of this week, yet strong economic data, closely related to US inflation, could further weigh on the US dollar, as strong data means higher inflationary pressures, at a time when the Fed cannot keep raising the rates due to stress on banks. As a result, expected real returns for US denominated assets would fall, the natural preference for US denominated assets would decline, so would the value of the US dollar.
Buy Euro at a dip?
Despite a solid selling pressure above the 1.10 mark, price pullbacks in the EURUSD remain interesting opportunities for those looking for dip-buying opportunities.
Released yesterday, the 3.4% slump in German industrial production – which was the highest in a year - certainly came a slap on investors’ face, as the expectation was a 1.5% fall only. So the disappointing German data also revived the odds that the Q1 GDP could also be revised lower, and weigh on ECB rate hike expectations. On top of that, the euro area’s investor confidence index unexpectedly slumped as well.
But, despite signs of slowing economy, the European Central Bank (ECB) will remain focused on fighting inflation, and the latter means higher rates despite slowing activity – if of course slowing activity doesn’t lead to slower price pressures.
For now, ECB’s Chief economist Philip Lane warns that ‘there is still momentum in food and core inflation, which is for this year running in the opposite direction to the decline in energy inflation.’ It sure needs to be addressed. Therefore, I keep my medium-term target unchanged at 1.1225 for the EURUSD.
China imports slump
The latest trade data from China showed that the Chinese exports grew faster than expected in April, and imports fell faster than expected as well. As such, China’s trade balance hit $90bn, versus around $70bn expected by analysts. Rising Chinese exports is good sign for global economy, while lower Chinese imports is a bad sign for companies exporting to China. Maybe but just maybe, it could be time to slow down bets for further gains in French luxury brands, as the likes of LVMH, which had a stellar year, partly thanks to the returning Chinese demand? Other news from China is less encouraging.
Crude rebounds
In energy, American crude advanced past $73.50 per barrel yesterday, but slipped below the $73 level on worries that the Chinese recovery may not be as strong as predicted, and that slower global growth could further hit demand. Price advances into $75/76 will likely see strong resistance.
Tightening of US Bank Credit Conditions Seems Smaller Than Feared
Market movers today
Today Biden is set to meet with Congressional leaders on the US debt limit.
Otherwise it is a very light calendar with US NFIB small business optimism index as the only interesting data release on the global agenda.
In the Nordics the Riksbank minutes will take centre stage although we also get Norwegian average monthly earnings out this morning.
The 60 second overview
Markets. It has been a fairly quiet start to the week characterised by diminished bank concerns and slightly higher yields. There has been no major news overnight although slightly better-than-expected Chinese export figures suggest that global goods demand is keeping up for now despite eroded purchasing powers of consumers.
Credit conditions in the US. The Federal Reserve Senior Loan Officer Opinion Survey (SLOOS) released yesterday showed that banks reported tighter credit standards and weaker demand for commercial loans. The share of US banks that are tightening the terms on loans for medium and large businesses rose to 46.0% in Q1, up from 44.8% in Q4 2022.
Overall, this credit tightening was clearly not as worrying as the market had expected and feared and US yields moved higher after the release, while the USD broadly appreciated.
Mind the nature of bank concerns. At this stage the bank jitters that really started in March do not seem to have had as negative an impact on bank credit conditions and lending as feared by many investors. While it is still early to fully conclude on the ramifications we still emphasize that a smaller bank sector is a natural consequence of the Federal Reserve draining liquidity via quantitative tightening. The large quantitative easing programs following corona boosted banks' balance sheets by construction and now we are seeing the reverse play out. As such we rather see the last months' bank concerns as a natural symptom of tighter monetary policy than the epicentre of a systemic risk event taking place.
Fed pricing. Following the recent batch of data releases the markets are increasingly questioning the short-term outlook for rates with markets slowly beginning to price in a probability of another 25bp hike in June. We reiterate that should the situation in regional banks stabilise during the next month, labour markets stay tight, and inflation stay elevated (we get inflation tomorrow), a rate hike in June can increasingly be priced in by markets and/or rate cuts increasingly be priced out of the rate curve in H2. Our base case is that the Fed will pause for the remainder of this year - which in itself would mark a tightening of monetary policy amid markets pricing in close to three rate cuts ahead of new year.
Equities: Equities were little changed on Monday. Fed's Loan officer survey initially triggered a negative reaction which eventually soothed during the session. S&P 500 closed unchanged with the odd mix of growth/quality sectors communication and consumer discretionary outperforming together with financials. Futures are a tad lower this morning.
FI: Global rates recorded a modest sell-off yesterday with UK out for holiday as markets digested hawkish comments during the weekend from Knot and Lane saying that the euro area inflation still has 'a lot of momentum'. The front end led the sell-off in a curve flattening move. German 10y yields rose 3bp to 2.31%. Last night's SLOOS from Fed pointed to tighter standards as expected, but not as bad as initially feared by markets, which sent the US front end slightly higher.
FX: Monday's session delivered relatively muted moves in major space with EUR/USD hovering around the 1.10 mark and USD/JPY remaining around 135. Commodity currencies continue to be the big winner in the early part of the week with EUR/NOK trading just north of 11.50. EUR/GBP remained just above 0.87, the lowest level since February.
Credit: Yesterday was a bank holiday in the UK and overall it was a relatively quiet start to the week with no primary issuance in EUR credit markets. However, at least in the covered bond segment activity is picking up again with three new mandates announced yesterday.
Nordic macro
Riksbank Monetary Policy Minutes will be the centre of attention today. There are two aspects of the April decision to be looked into in particular. First, markets will scrutinize the rationale behind the fact that the Board decided on a rate path that attaches only a 60 % probability to another 25bp rate hike up to and including September. This is slightly less than what the market is currently pricing, although the markets thereafter prices rate cuts quite soon (contrary to Riksbank). Secondly, Governors Breman and Flodén dissented to the 50bp hike, opting for a 25bp hike to be followed by a higher probability for rate hikes in June and/or September, i.e., a smoother rate path. The reason for this deviation is also in focus, and whether any of these might be suggesting rate cuts earlier than signalled by ordinary rate path.
Separately, Riksbank vice governor Flodén, one of two dissenters, speaks at 12:00 on current monetary policy and the economy. A summary of the speech will be published.
USD/CAD Daily Outlook
Daily Pivots: (S1) 1.3330; (P) 1.3358; (R1) 1.3402; More....
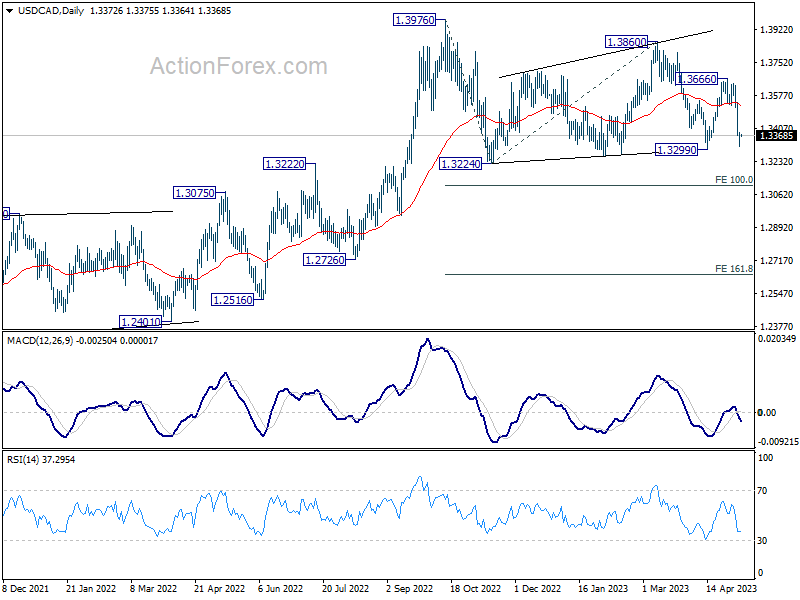
Intraday bias in USD/CAD stays on the downside at this point. Firm break of 1.3299 will extend the corrective pattern from 1.3976 lower to 100% projection of 1.3976 to 1.3224 from 1.3860 at 1.3395 next. On the upside, though, above 1.3389 minor resistance will turn intraday bias neutral first.
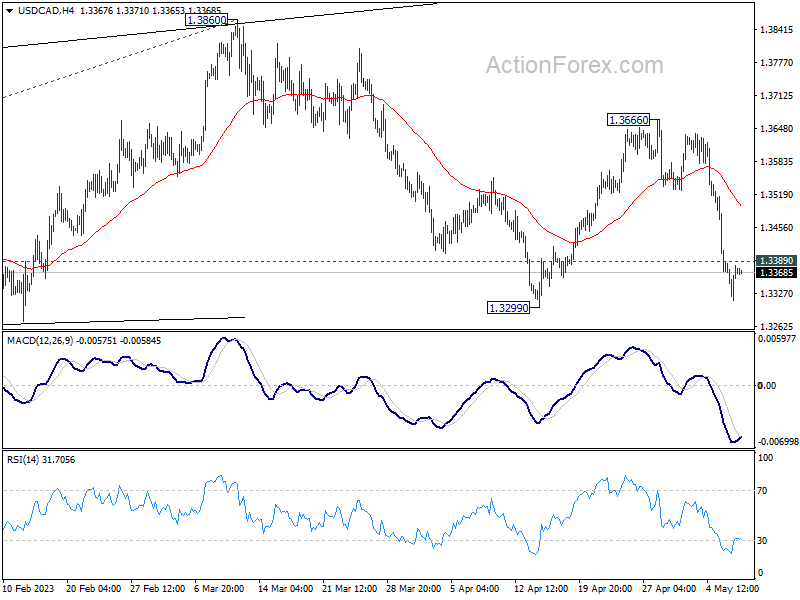
In the bigger picture, as long as 55 W EMA (now at 1.3312) holds, up trend from 1.2005 (2021 low) is still in favor to resume through 1.3976 at a later stage. However, sustained trading below the EMA and 38.2% retracement of 1.2005 to 1.3976 at 1.3233 will raise the chance of bearish reversal. Deeper should then be seen to 61.8% retracement at 1.2758 next.
AUD/USD Daily Report
Daily Pivots: (S1) 0.6746; (P) 0.6775; (R1) 0.6810; More...
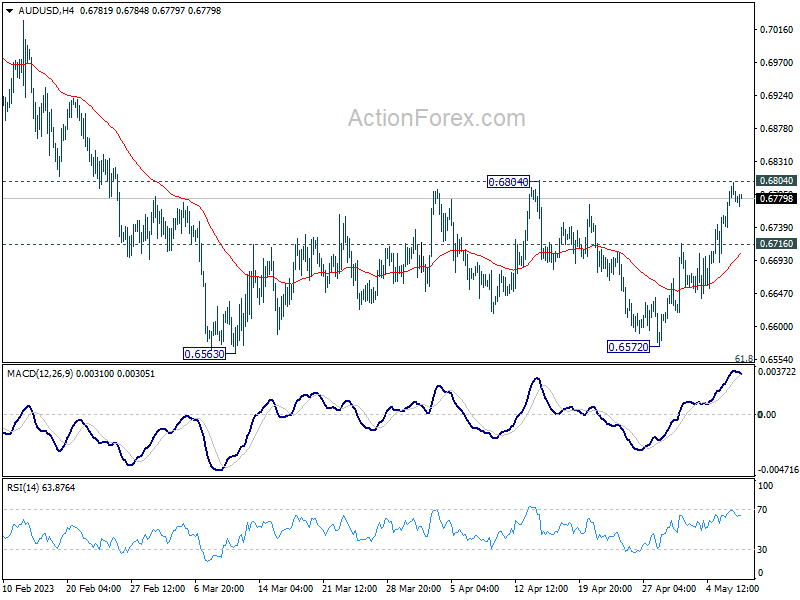
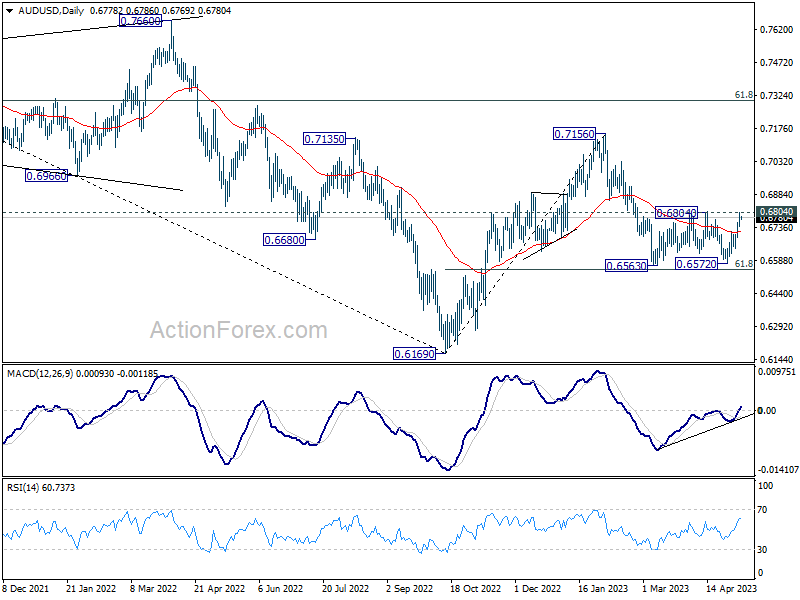
Immediate focus is now on 0.6804 resistance as rebound from 0.6572 extends. Decisive break there will indicate completion of whole fall from 0.7156, and turn near term outlook bullish for retesting this high. rejection by 0.6804 will retain near term bearishness, and down trend resumption through 0.6563 low is in favor at a later stage. Below 0.6716 minor support will bring retest of 0.6563 low.
In the bigger picture, as long as 61.8% retracement of 0.6169 to 0.7156 at 0.6546 holds, the decline from 0.7156 is seen as a correction to rally from 0.6169 (2022 low) only. Another rise should still be seen through 0.7156 at a later stage. However, sustained break of 0.6546 will raise the chance of long term down trend resumption through 0.6169 low.
USD/JPY Daily Outlook
Daily Pivots: (S1) 134.75; (P) 135.02; (R1) 135.40; More...
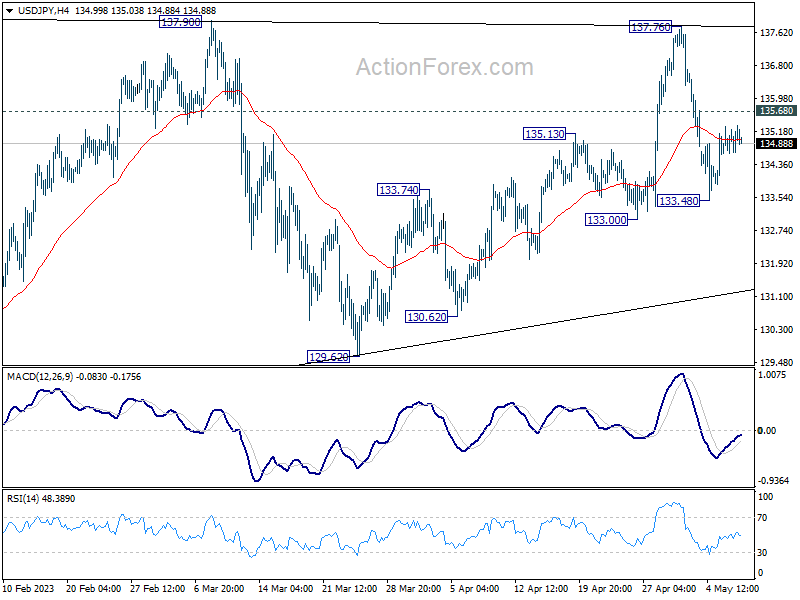
Intraday bias in USD/JPY remains neutral and further decline remains in favor with 135.68 minor resistance intact. Fall from 137.76 is seen as the third leg of the pattern from 137.90. Below 133.48 will target 133.00 first, break will target 129.62 support. Still, as long as 129.62 holds, larger rebound from 127.20 is still in favor to resume at a later stage. On the upside, above 135.68 minor resistance will turn bias back to the upside for 137.76/90 instead.
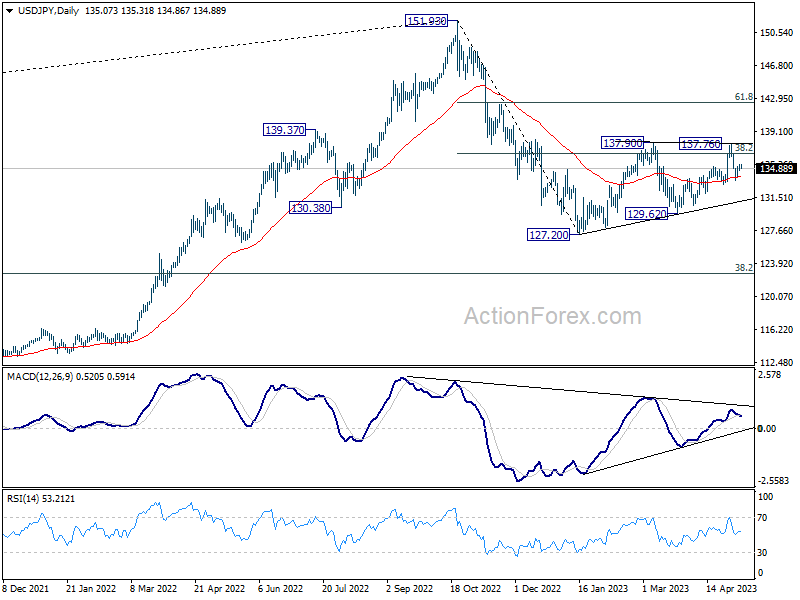
In the bigger picture, price actions from 151.93 high are currently seen as a corrective pattern to the long term up trend. The first leg should have completed at 127.20. Rebound from there is seen as the second leg. Sustained break of 38.2% retracement of 151.93 to 127.20 at 136.34 will bring stronger rebound to 61.8% retracement at 142.48. Meanwhile, break of 129.62 will argue that the third leg is starting through 127.20 low.
USD/CHF Daily Outlook
Daily Pivots: (S1) 0.8871; (P) 0.8892; (R1) 0.8915; More...
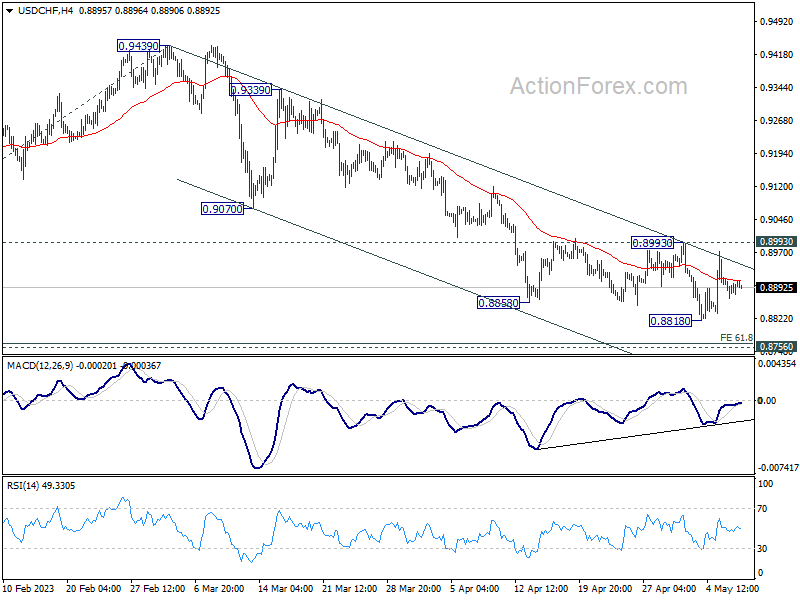
Intraday bias in USD/CHF remains neutral as range trading continues. While down trend from 1.0146 could still extend lower, strong support should be seen from 61.8% projection of 1.0146 to 0.9058 from 0.9439 at 0.8767, which is close to 0.8756 long term support, to bring rebound, at least on first attempt. On the upside, break of 0.8993 resistance will indicate short term bottoming, on bullish convergence condition in 4H MACD, and turn bias back to the upside for stronger rebound.
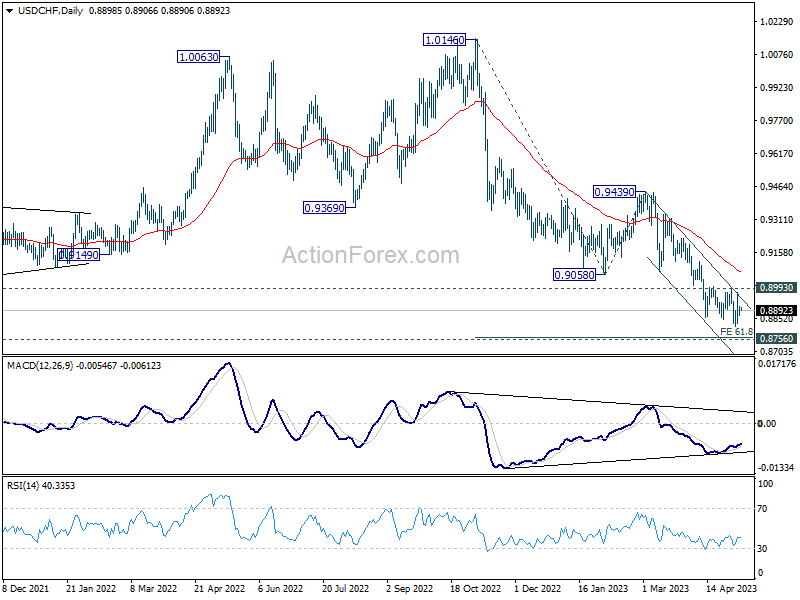
In the bigger picture, fall from 1.1046 (2022 high) is seen as a leg in the long term range pattern from 1.0342 (2016 high). So, downside should be contained by 0.8756 to bring reversal. Sustained break of 0.9058 support turned resistance will be the first sign of medium term bottoming. However, decisive break of 0.8756 will carry larger bearish implications.
GBP/USD Daily Outlook
Daily Pivots: (S1) 1.2598; (P) 1.2634; (R1) 1.2654; More...
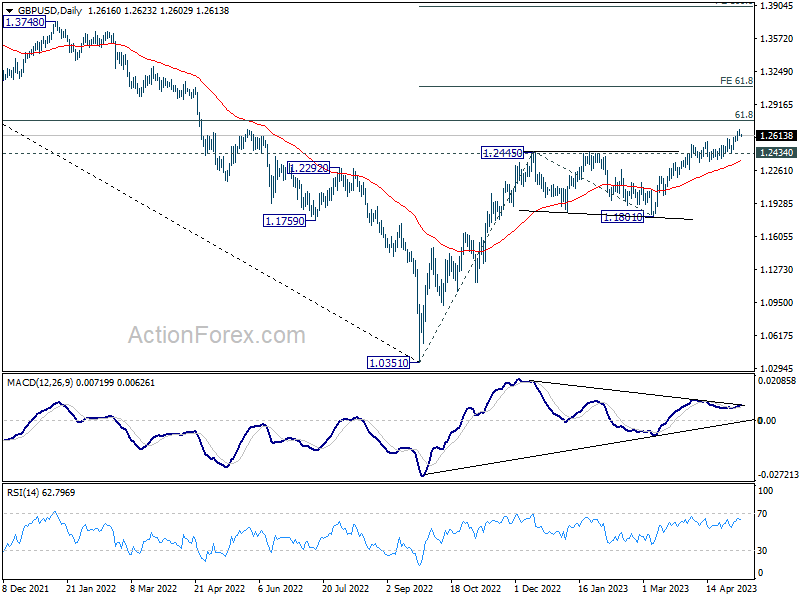
Intraday bias in GBP/USD is turned neutral with current retreat. But outlook will remain bullish as long as 1.2434 support holds. Break of 1.2667 will resume larger up trend to 1.2759 fibonacci level first. Firm break there will target 61.8% projection of 1.0351 to 1.2445 from 1.1801 at 1.3095.
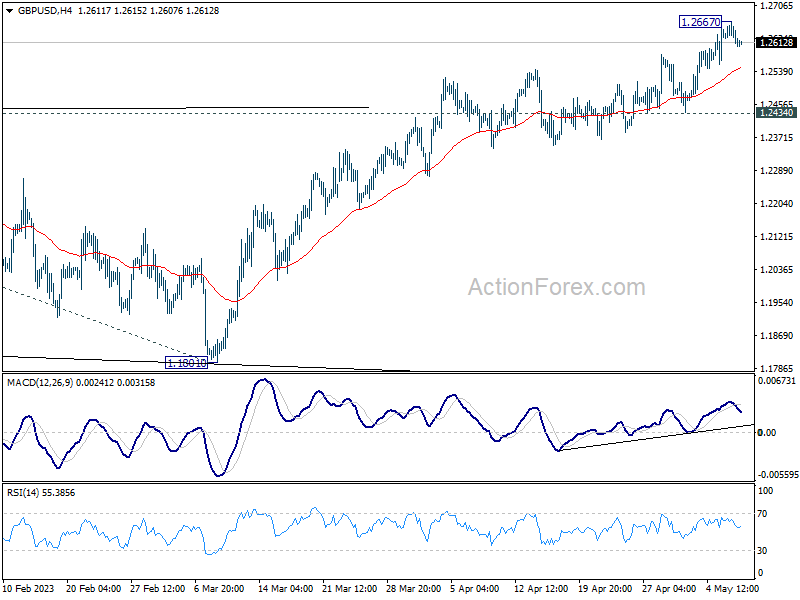
In the bigger picture, the rise from 1.0351 medium term term bottom (2022 low) is in progress for 61.8% retracement of 1.4248 (2021 high) to 1.0351 at 1.2759. Sustained break there will add to the case of long term bullish trend reversal. Further break of 61.8% projection of 1.0351 to 1.2445 from 1.1801 at 1.3095 could prompt upside acceleration to 100% projection at 1.3895. For now, this will remain the favored case as long as 1.1801 support holds, even in case of deep pull back.
Technical Outlook and Review
DXY:
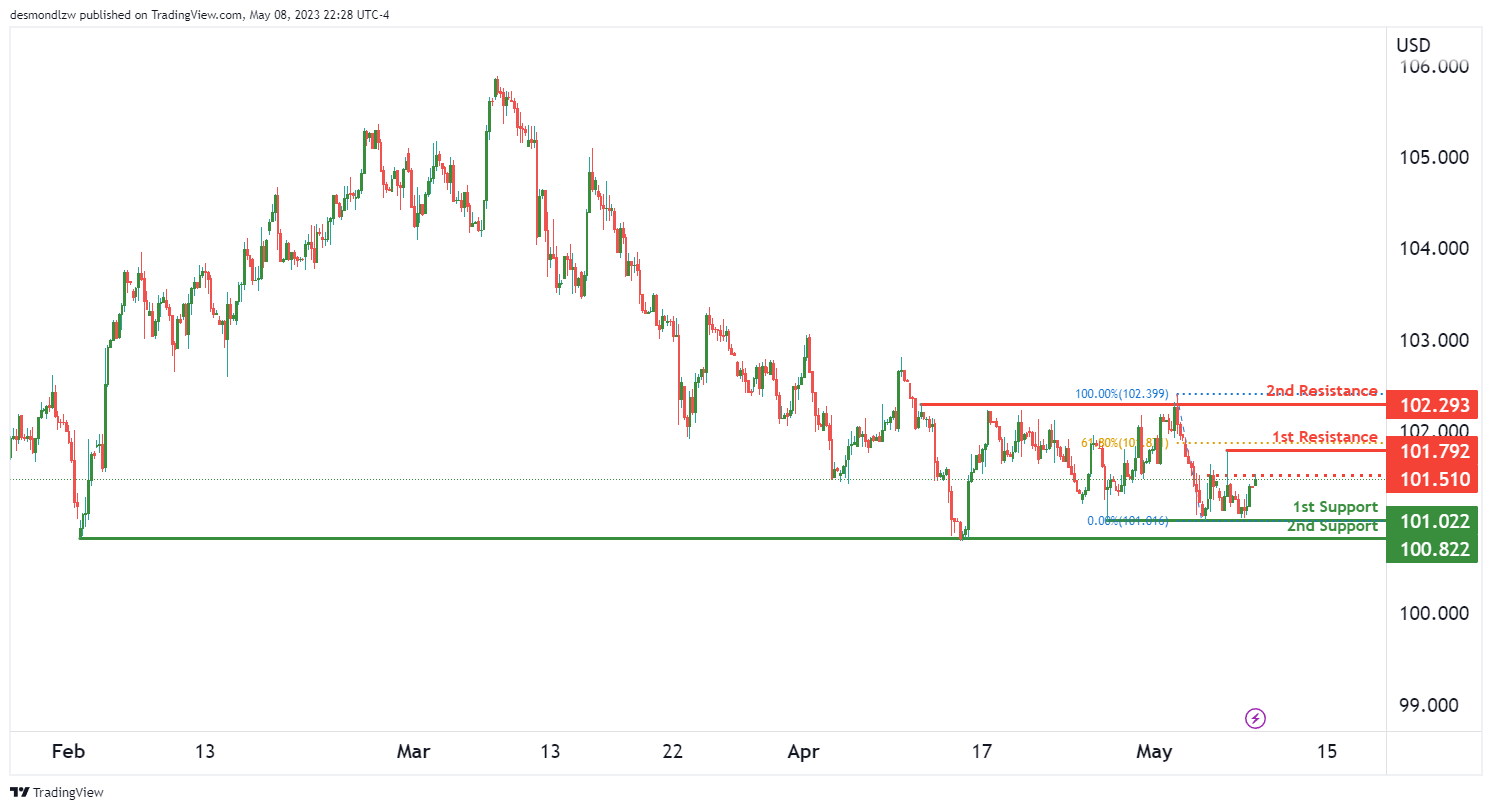
The overall momentum of the chart is bullish, and there is a potential for a bullish continuation towards the 1st resistance level.
There are two support levels to consider for this instrument. The 1st support level is at 101.02, and this is a multi-swing low support level. It has acted as a strong support level in the past, and if price were to drop to this level again, it could potentially act as a support level again. The 2nd support level is at 100.82, and this is also a multi-swing low support level. If price were to drop further, it could potentially find support at this level as well.
On the resistance side, the 1st resistance level is at 101.79, and this is a swing high resistance level. This level has acted as a strong resistance level in the past, and if price were to rise towards this level, it could potentially face resistance here. The 2nd resistance level is at 102.29, and this is a multi-swing high resistance level. This level has also acted as a strong resistance level in the past, and if price were to break above the 1st resistance level, it could potentially rise towards this level.
There is also an intermediate resistance level at 101.51, and this is a multi-swing high resistance level. This level has acted as a strong resistance level in the past, and if price were to break above this level, it could potentially trigger a stronger bullish acceleration towards the 1st resistance level.
EUR/USD:
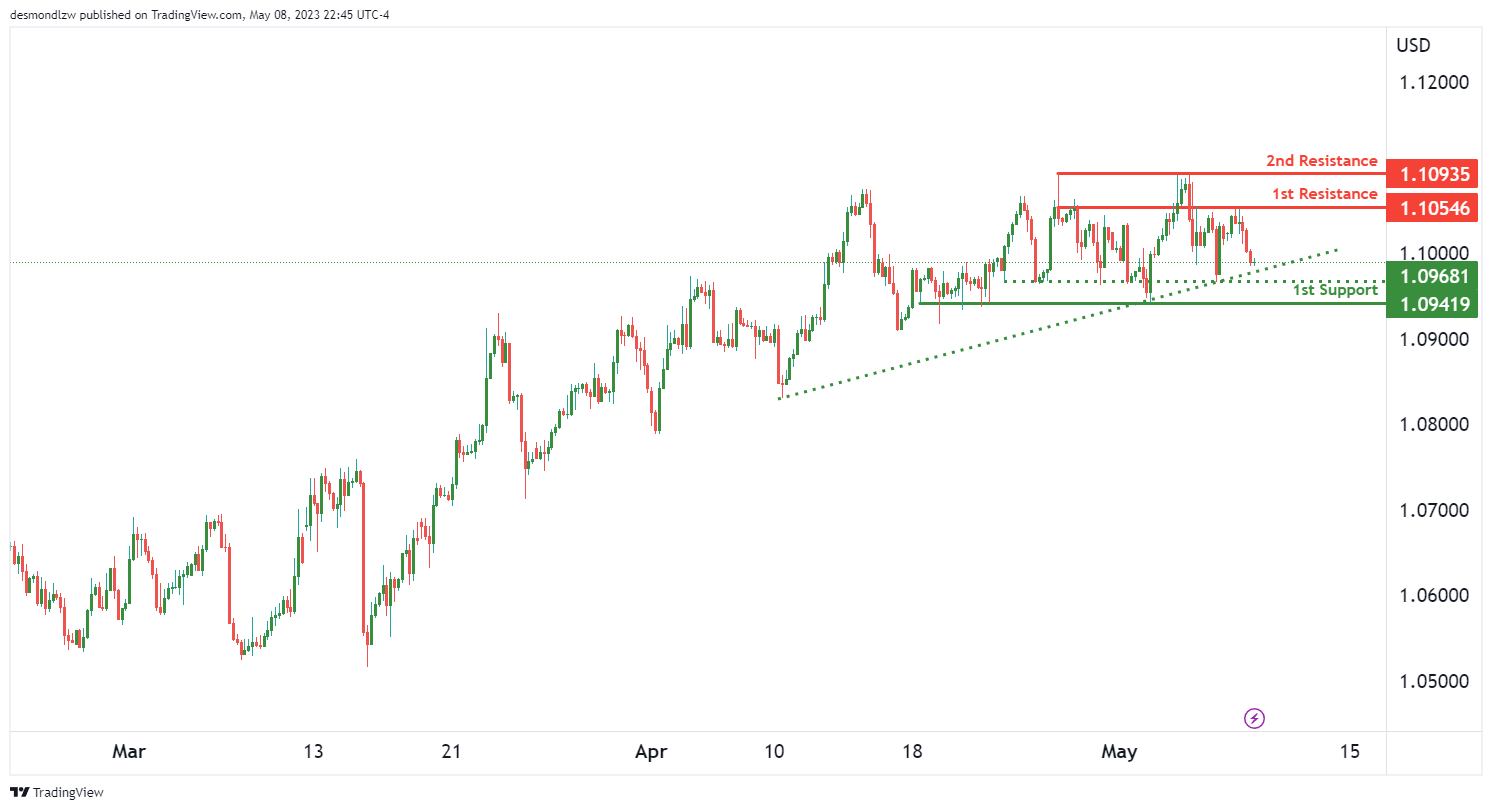
The EUR/USD instrument. The overall momentum of the chart is currently bearish, and this is due to the possibility that the price may break below the ascending trendline, which could cause the price to drop towards the 1st support level.
The 1st support level is at 1.0941, and this is a multi-swing low support level. This suggests that price has previously bounced off this level, and it could potentially act as a support level again if price were to drop towards this level.
The intermediate support level is at 1.0968, and this is also a multi-swing low support level. This level has acted as a strong support level in the past, and if price were to drop further, it could potentially find support at this level as well.
On the resistance side, the 1st resistance level is at 1.1054, and this is an overlap resistance level. This means that there is a confluence of factors, such as a previous support level now acting as a resistance level, and this could make this level a strong resistance level.
The 2nd resistance level is at 1.1093, and this is a multi-swing high resistance level. This level has acted as a strong resistance level in the past, and if price were to rise towards this level, it could potentially face resistance here.
GBP/USD:
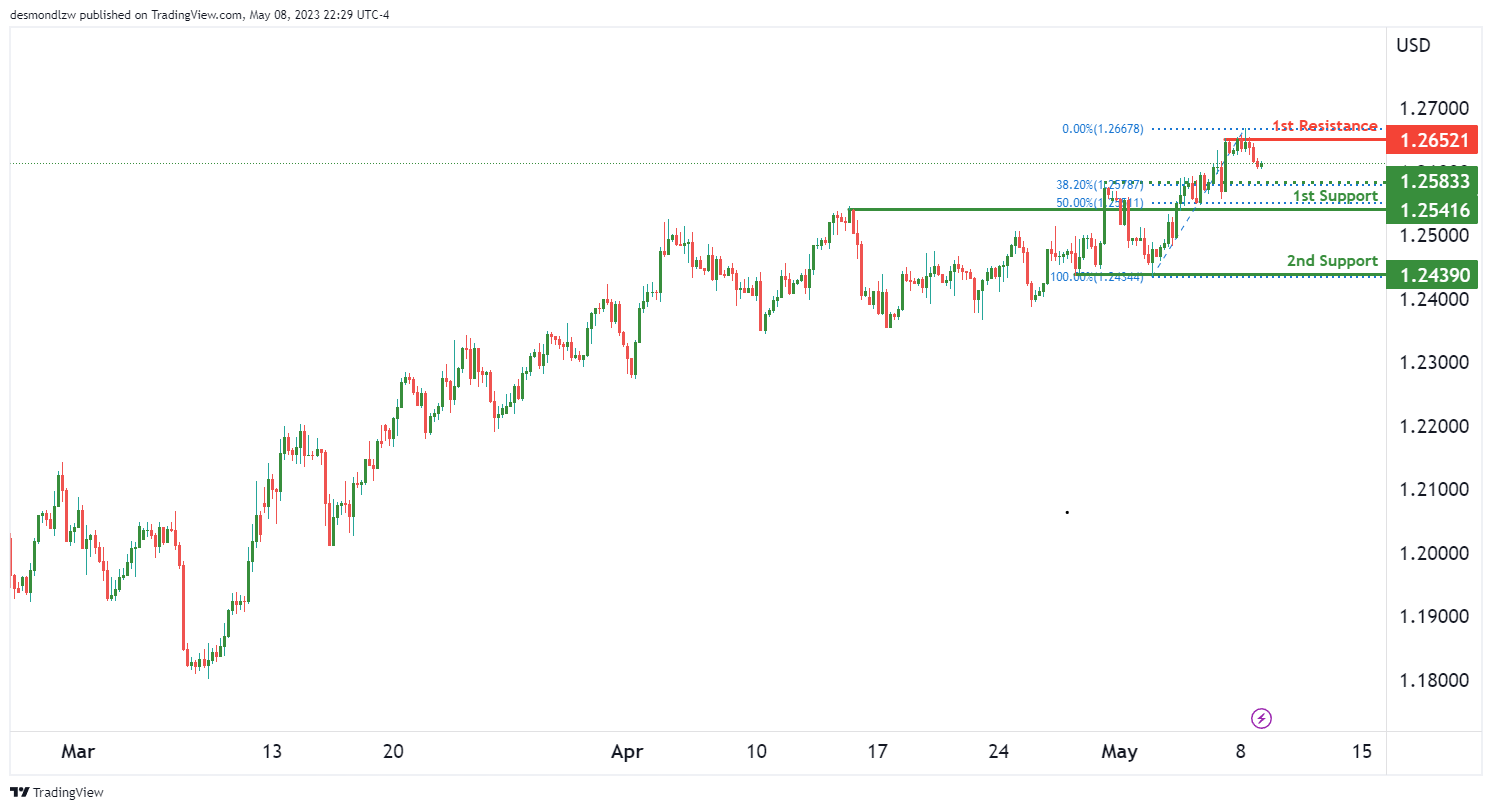
The GBP/USD instrument. The overall momentum of the chart is still bearish, and there is a potential for a bearish continuation towards the 1st support level.
The 1st support level is at 1.2541, and this is an overlap support level. This means that there is a confluence of factors, such as a previous resistance level now acting as a support level, and this could make this level a strong support level. Additionally, this level coincides with the 50% Fibonacci retracement level, which could make it an even stronger support level.
The 2nd support level is at 1.2439, and this is a multi-swing low support level. This level has acted as a strong support level in the past, and if price were to drop further, it could potentially find support at this level as well.
On the resistance side, the 1st resistance level is at 1.2652, and this is a multi-swing high resistance level. This level has acted as a strong resistance level in the past, and if price were to rise towards this level, it could potentially face resistance here.
There is also an intermediate support level at 1.2583, and this is a multi-swing high resistance level. This suggests that price has previously struggled to break above this level, and if price were to drop towards this level, it could potentially act as a support level. Additionally, this level coincides with the 38.20% Fibonacci retracement level, which could make it an even stronger support level.
USD/CHF:
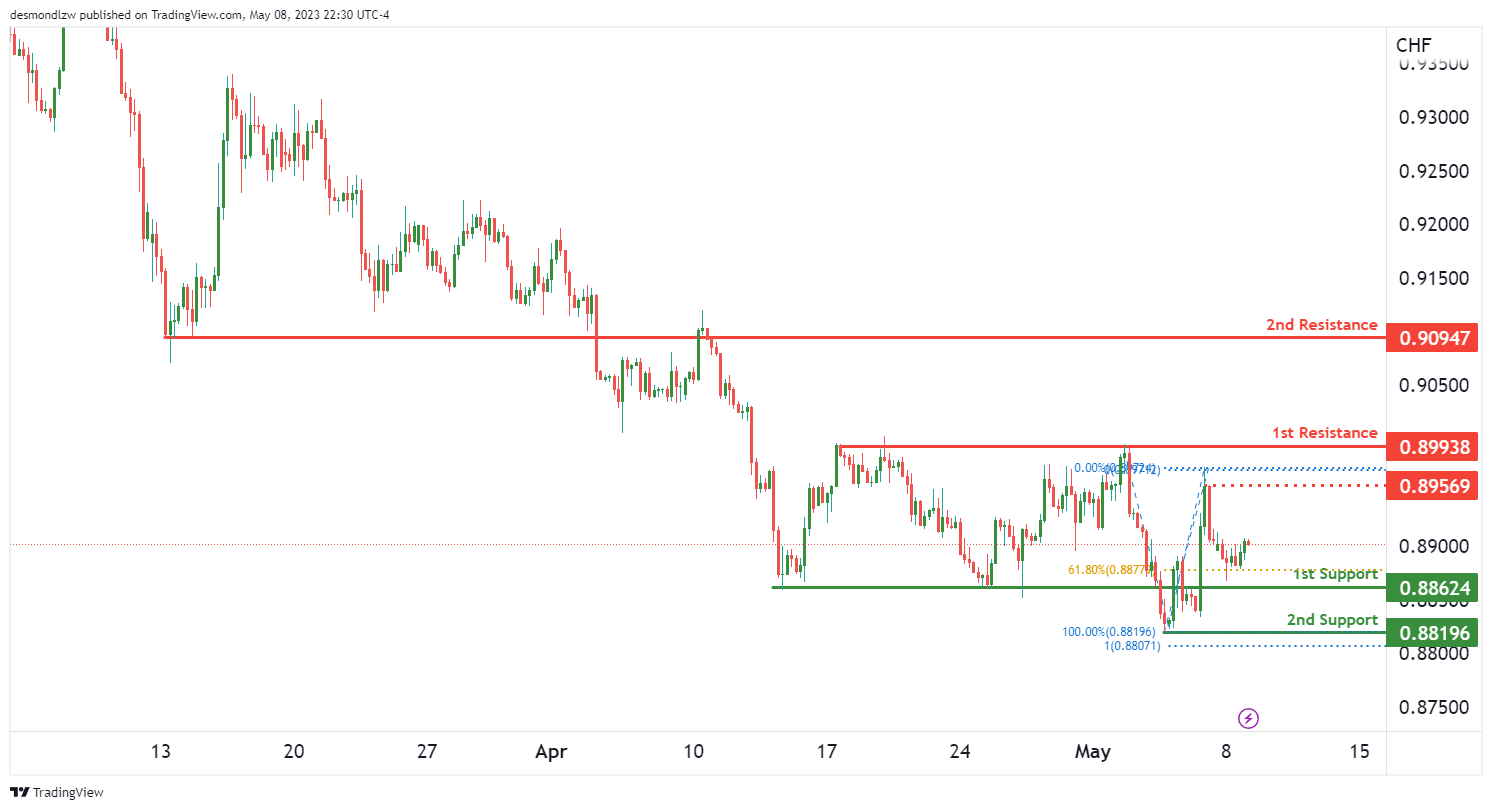
The USD/CHF instrument. The overall momentum of the chart is still bearish, but there is a potential for a bullish continuation towards the 1st resistance level.
The 1st support level is at 0.8862, and this is an overlap support level. This means that there is a confluence of factors, such as a previous resistance level now acting as a support level, and this could make this level a strong support level. Additionally, this level coincides with the 61.80% Fibonacci retracement level, which could make it an even stronger support level.
The 2nd support level is at 0.8819, and this is a swing low support level. This level has acted as a strong support level in the past, and if price were to drop further, it could potentially find support at this level as well. Additionally, this level coincides with the 100% Fibonacci projection level, which could make it an even stronger support level.
On the resistance side, the 1st resistance level is at 0.8993, and this is a multi-swing high resistance level. This level has acted as a strong resistance level in the past, and if price were to rise towards this level, it could potentially face resistance here.
The 2nd resistance level is at 0.9095, and this is an overlap resistance level. This means that there is a confluence of factors, such as a previous support level now acting as a resistance level, and this could make this level a strong resistance level.
There is also an intermediate resistance level at 0.8956, and this is a swing high resistance level. This means that price has struggled to break above this level in the past, and if price were to rise towards this level, it could potentially face resistance here.
USD/JPY:
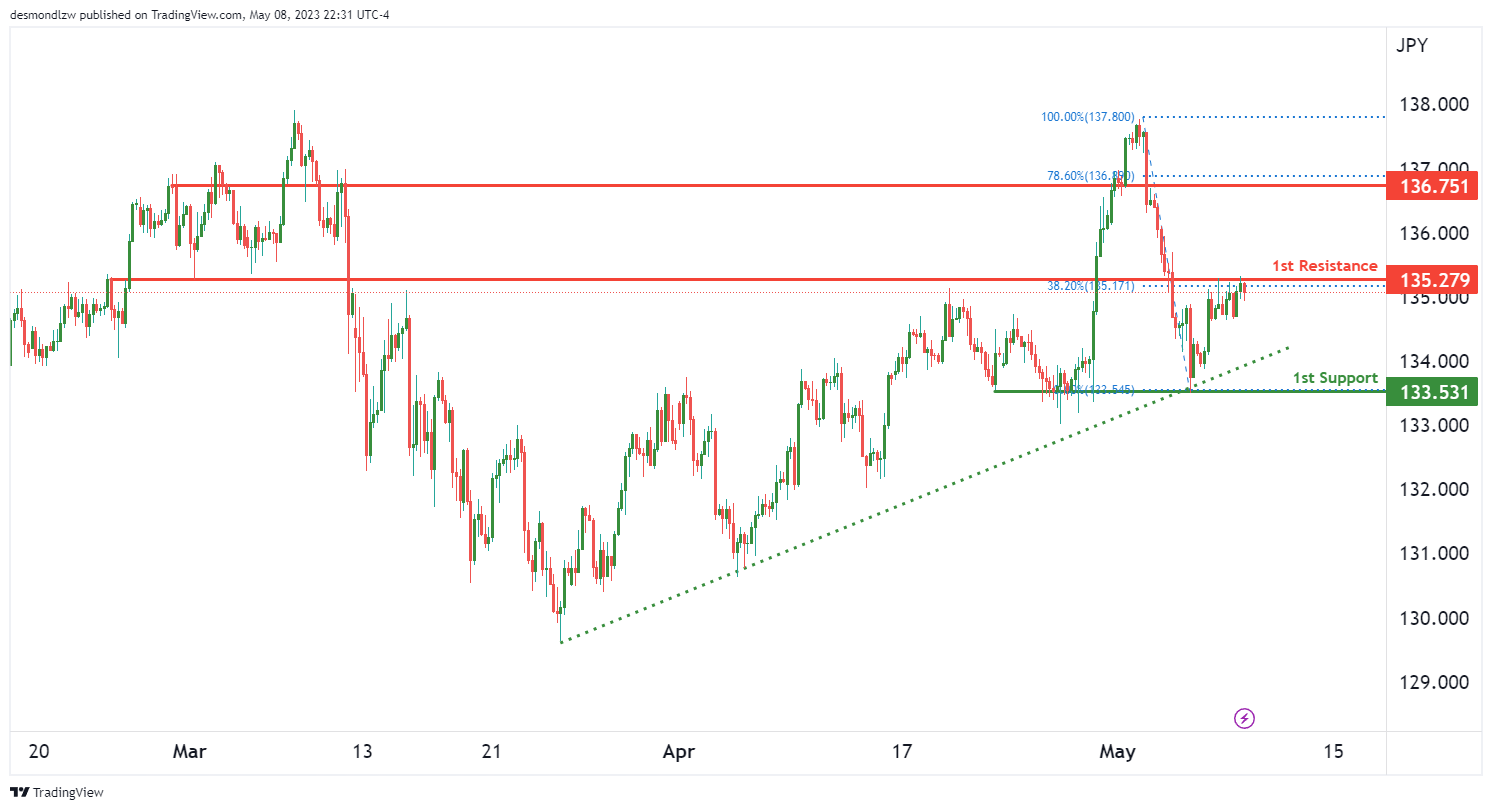
The USD/JPY instrument. The overall momentum of the chart is bullish, and this is due to price being above a major ascending trend line, which suggests that further bullish momentum could be on the cards.
There is a potential for a bullish break through of the 1st resistance level and a rise towards the 2nd resistance level.
The 1st support level is at 133.53, and this is a multi-swing low support level. This means that price has bounced off this level multiple times in the past, and it could potentially act as a strong support level again in the future.
The 1st resistance level is at 135.27, and this is an overlap resistance level. This means that there is a confluence of factors, such as a previous support level now acting as a resistance level, and this could make this level a strong resistance level. Additionally, this level coincides with the 38.20% Fibonacci retracement level, which could make it an even stronger resistance level.
The 2nd resistance level is at 136.75, and this is also an overlap resistance level. This means that there is a confluence of factors, such as a previous support level now acting as a resistance level, and this could make this level a strong resistance level. Additionally, this level coincides with the 78.60% Fibonacci retracement level, which could make it an even stronger resistance level.
AUD/USD:
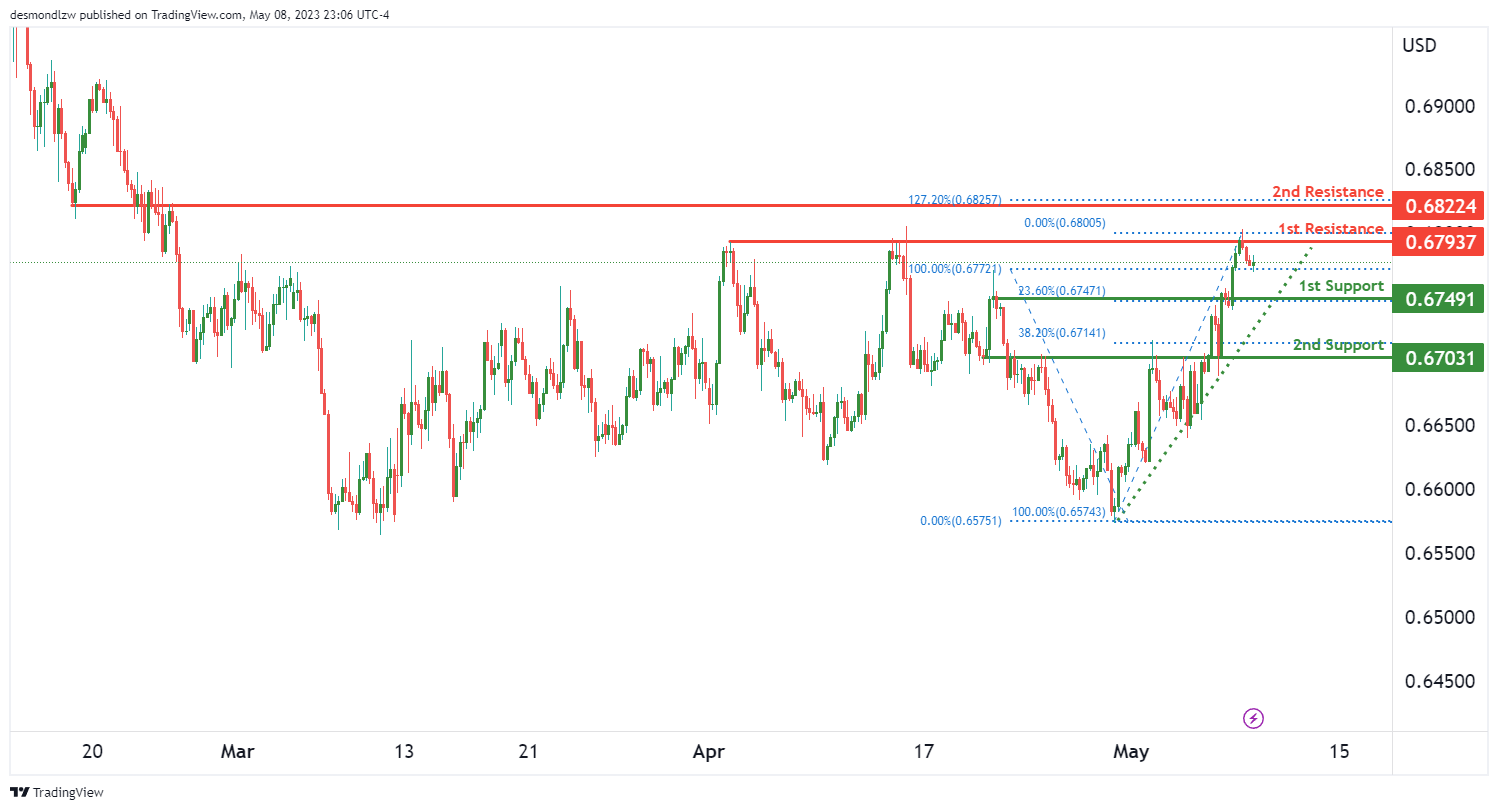
The overall momentum of the AUD/USD chart is currently bullish, with price above a major ascending trend line suggesting further upside potential. However, in the short term, there could be a drop towards the first support level before potentially bouncing back up towards the first resistance.
The first support level is at 0.6749, which is an overlap support level and also coincides with a 23.60% Fibonacci retracement. The second support level is at 0.6703, which is another overlap support level and coincides with a 38.20% Fibonacci retracement.
On the upside, the first resistance level is at 0.6793, which is a multi-swing high resistance level. The second resistance level is at 0.6822, which is an overlap resistance level and coincides with a 127.20% Fibonacci extension.
If price drops towards the first support level in the short term, there could be a potential bounce from there towards the first resistance level. However, if price breaks below the first support level, it could potentially drop further towards the second support level.
NZD/USD
The NZD/USD Potential for Bullish Continuation
The overall momentum of the NZD/USD chart is currently bullish, with price trading above a major ascending trend line that suggests further bullish momentum is on the cards. However, in the short term, price may drop further to the first support level before bouncing and rising towards the first resistance.
The first support level is at 0.6315, which is a pullback support level at the 23.60% Fibonacci retracement. This support level is followed by the second support level at 0.6264, which is an overlap support level at the 38.20% Fibonacci retracement. These support levels are considered good because they have held up multiple times in the past, indicating a strong level of support.
On the other hand, the first resistance level is at 0.6351, which is a multi-swing high resistance level. This is followed by the second resistance level at 0.6390, which is another multi-swing high resistance level. These resistance levels are considered good because they have prevented price from rising higher in the past, suggesting that they may continue to do so.
USD/CAD:
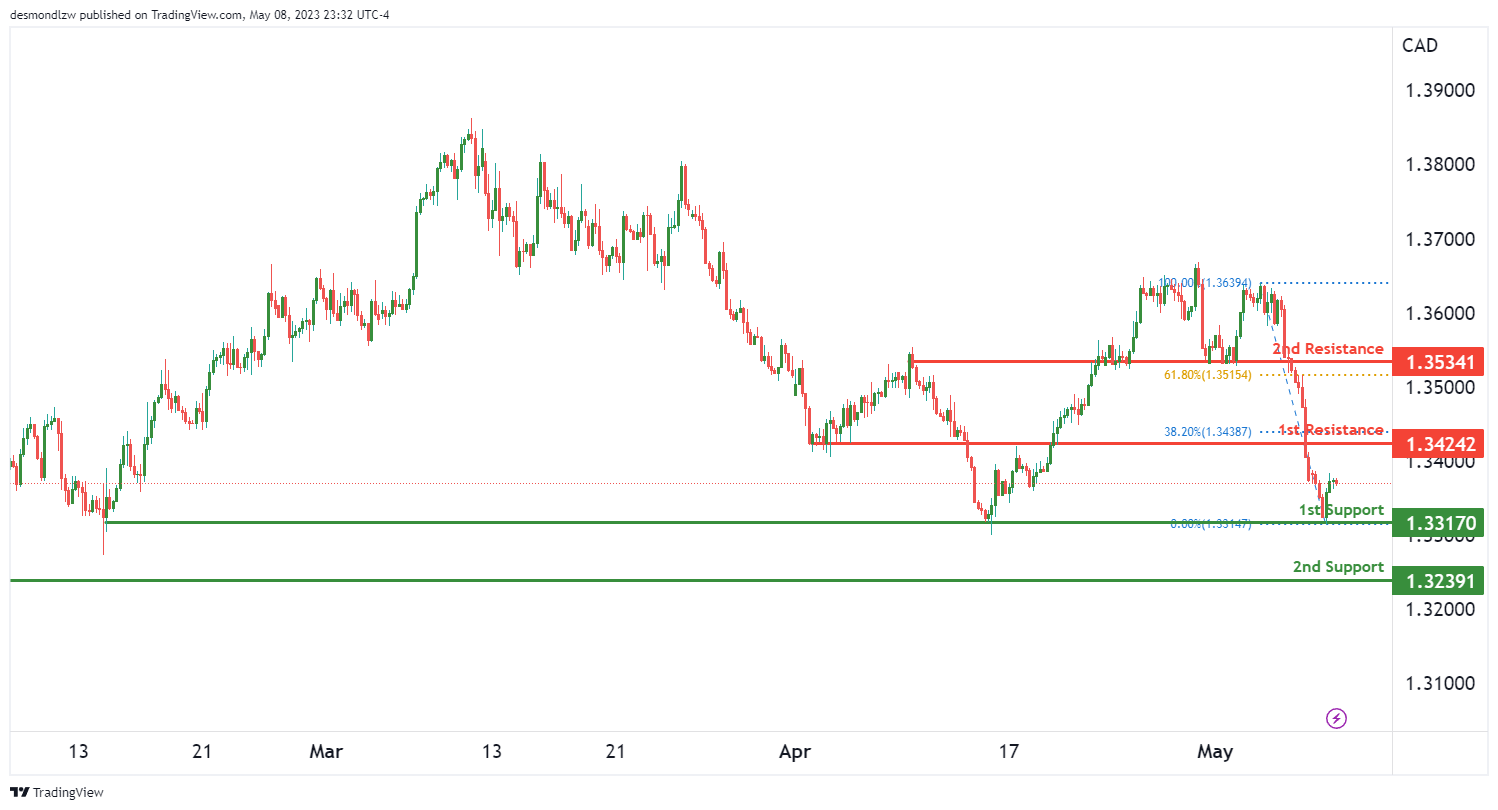
The USD/CAD chart is currently showing bullish momentum with the potential for further upside. The overall momentum of the chart is bullish, suggesting that prices may continue to rise in the near future. If the bullish momentum continues, the price could potentially make a bullish continuation towards the 1st resistance level.
There are two support levels to watch out for in case of a price drop. The 1st support level is at 1.3317, which is a multi-swing low support level. The 2nd support level is at 1.3239, which is a swing low support level.
On the upside, there are two resistance levels to watch out for. The 1st resistance level is at 1.3424, which is a pullback resistance level that coincides with the 38.20% Fibonacci retracement level. The 2nd resistance level is at 1.3534, which is also a pullback resistance level that coincides with the 61.80% Fibonacci retracement level.
DJ30:
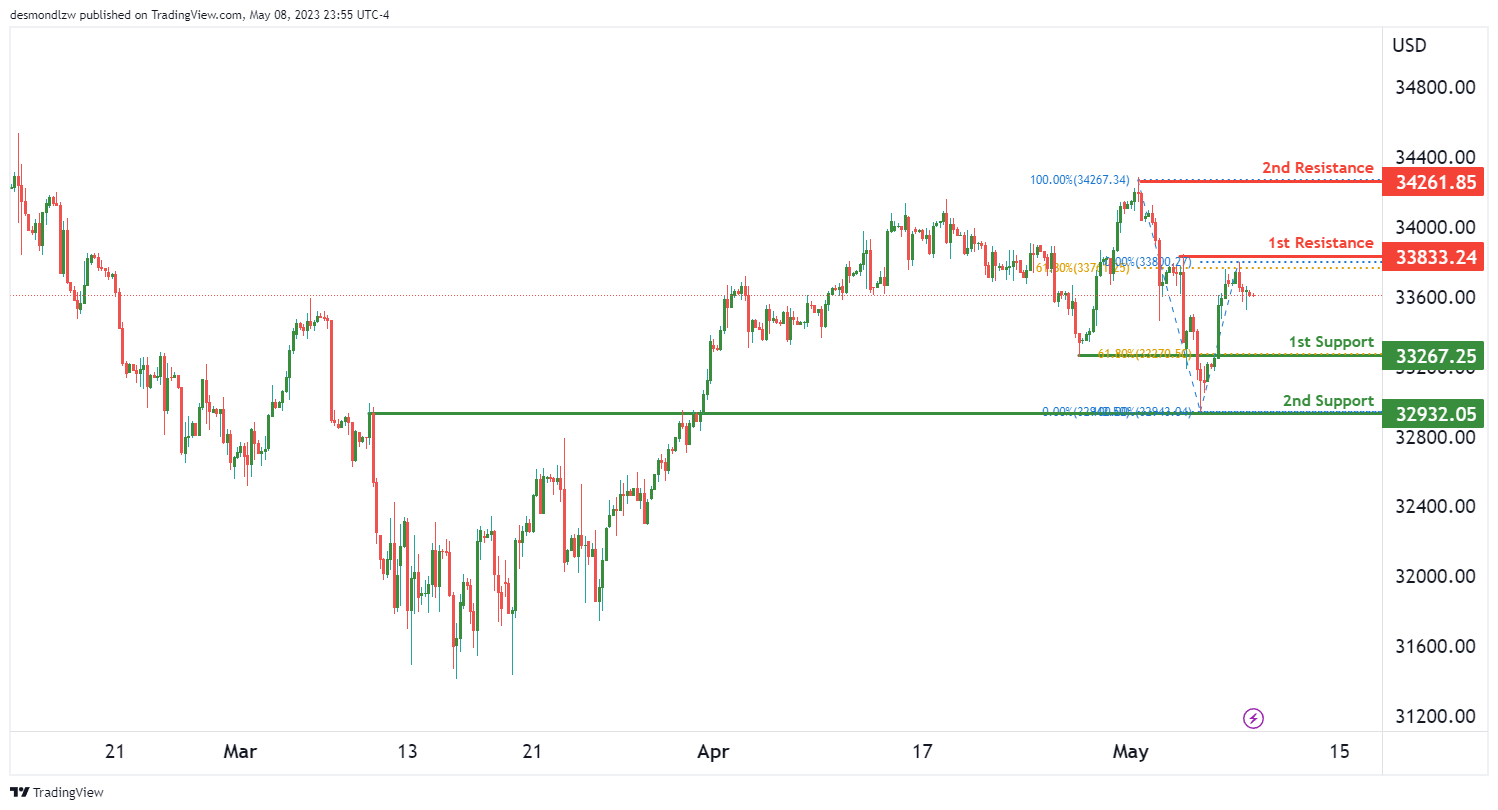
The overall momentum of the DJ30 chart is bearish. The potential price move for this instrument is a bearish continuation towards the first support level. The first support level is located at 33267.25, which is a pullback support level at the 61.80% Fibonacci Retracement. The second support level is located at 32932.05, which is a pullback support level.
On the resistance side, the first resistance level is located at 33833.24, which is a multi-swing high resistance level at the 61.80% Fibonacci Retracement. The second resistance level is located at 34261.85, which is a swing high resistance level.
GER30:
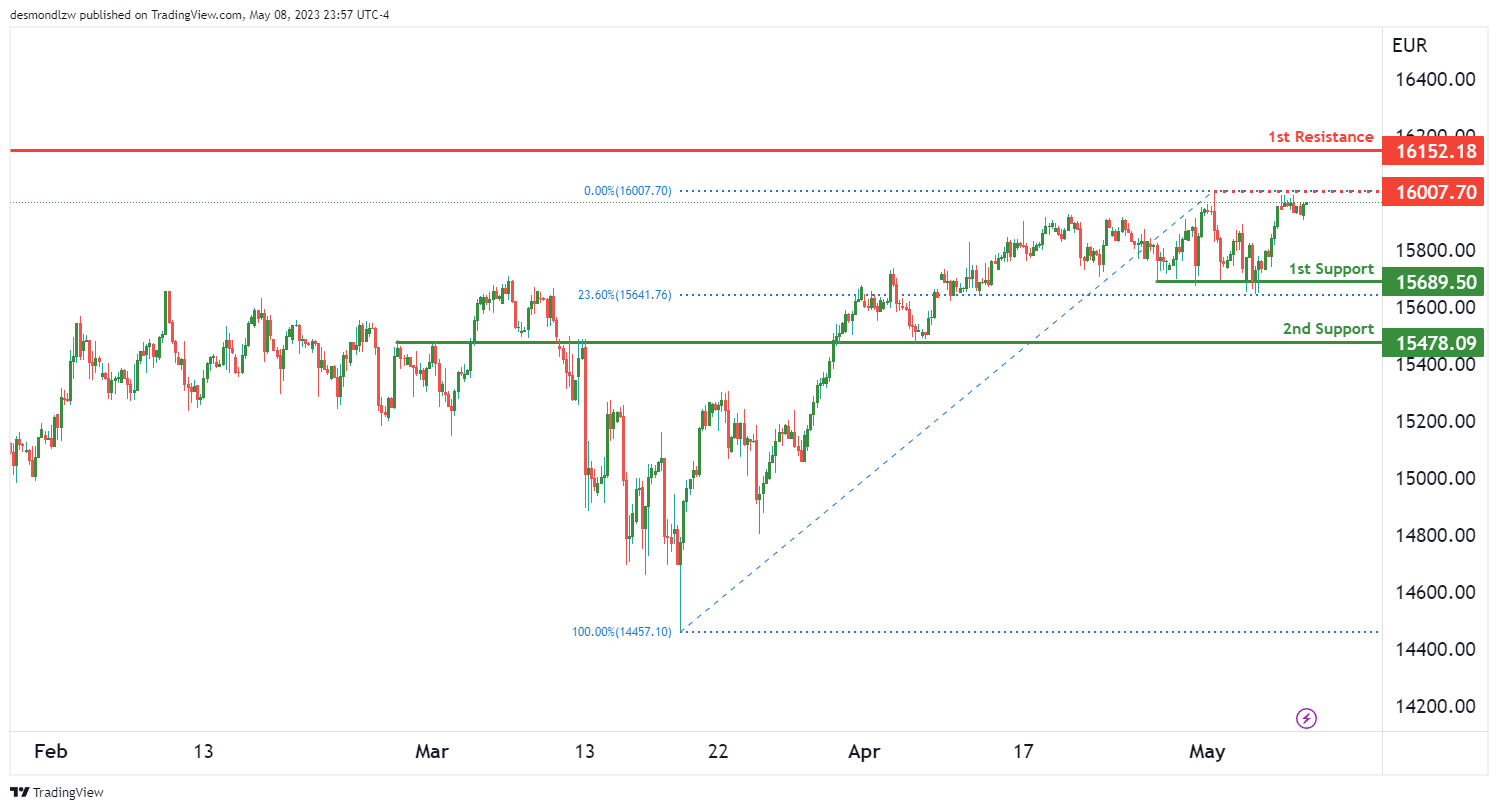
The GER30 (German DAX) index appears to have a bullish overall momentum, and the price could potentially make a bullish continuation towards the first resistance level.
The first support level is at 15689.50, which is a multi-swing low support and also corresponds to the 23.60% Fibonacci retracement level. The second support level is at 15478.09, which is an overlap support.
The first resistance level is at 16152.18, which is a swing high resistance. An intermediate resistance level can also be identified at 16007.70, which is a multi-swing high resistance.
If the bullish momentum continues, prices could potentially rise from the current level towards the first resistance level, followed by a potential break above the intermediate resistance level, towards the swing high resistance. On the other hand, if the bullish momentum loses steam, prices could retrace towards the first or second support levels.
BTC/USD:
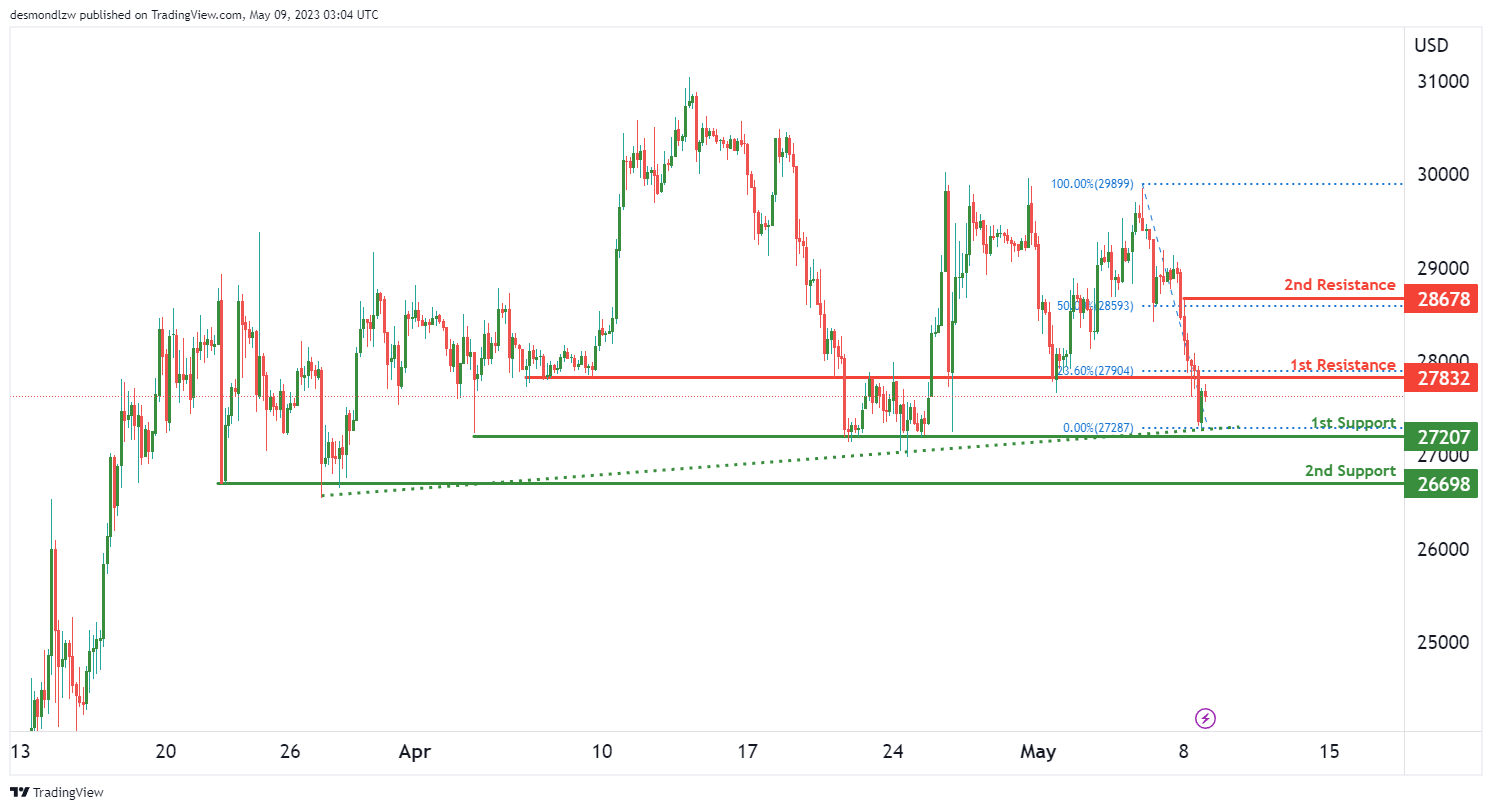
The BTC/USD chart is showing strong bullish momentum, with price currently above a major ascending trend line. This suggests that further upside potential is likely in the near term.
In the short term, price could potentially make a bullish continuation towards the first resistance level at 27832, followed by the second resistance level at 28678.
On the downside, there are two important support levels to watch out for. The first support level is at 27207, which is a multi-swing low support. The second support level is at 26698, which is also a multi-swing low support.
Looking at the Fibonacci retracement levels, the first resistance level coincides with the 38.20% retracement level, adding to its significance as a key level to watch out for. The second resistance level is at the 50% retracement level and is also a swing high resistance level.
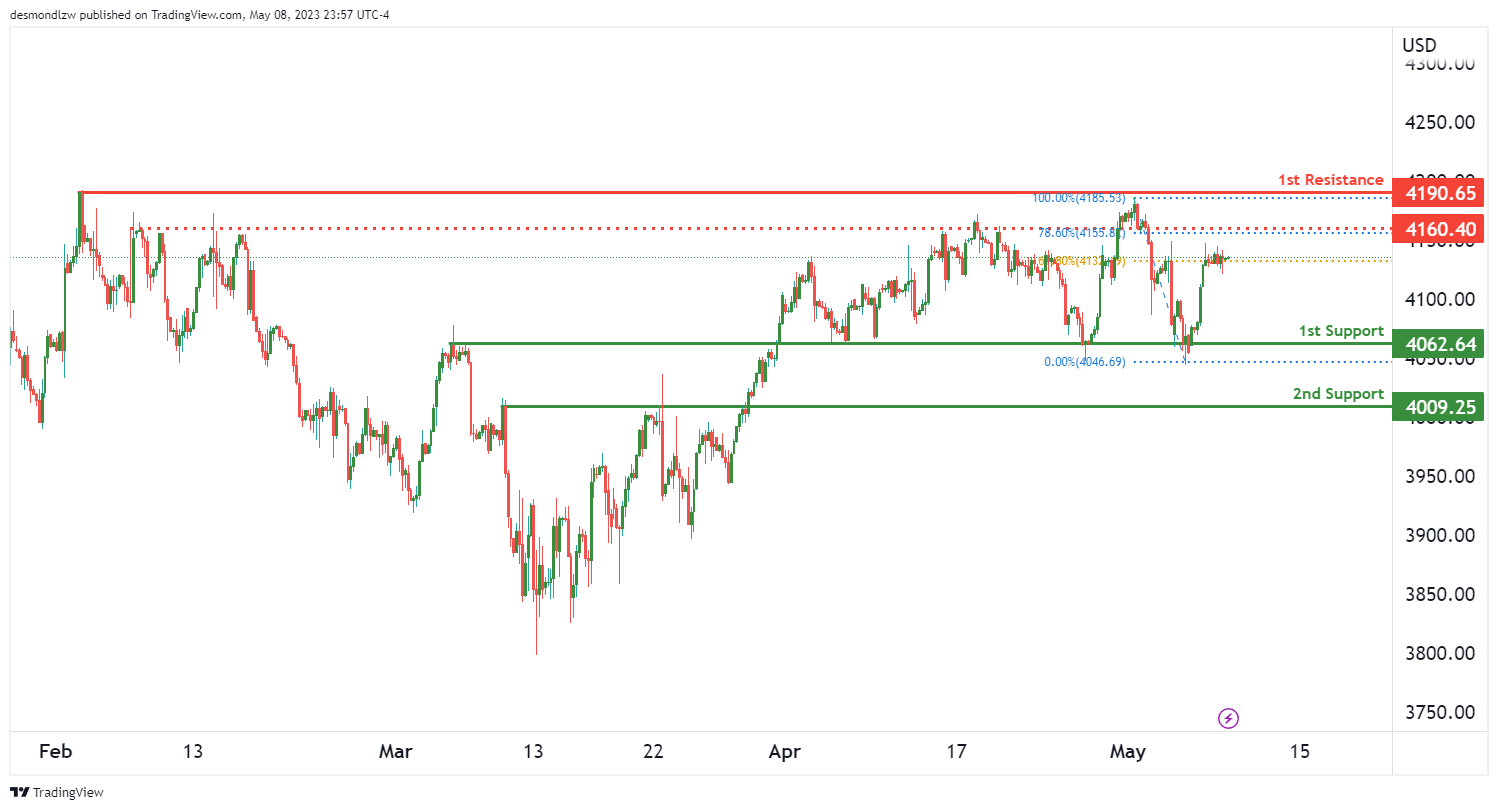
US500
The overall momentum of the US500 chart is bullish. The price is expected to make a bullish continuation towards the 1st resistance level.
The 1st support level is at 4062.64, which is an overlap support. The 2nd support level is at 4009.25, which is a pullback support. These levels could potentially act as support areas where price could bounce from.
The 1st resistance level is at 4190.65, which is a multi-swing high resistance. This level could potentially act as a resistance area where price could reverse from. An intermediate resistance level is at 4160.40, which is an overlap resistance and also coincides with the 78.60% Fibonacci retracement level.
ETH/USD:
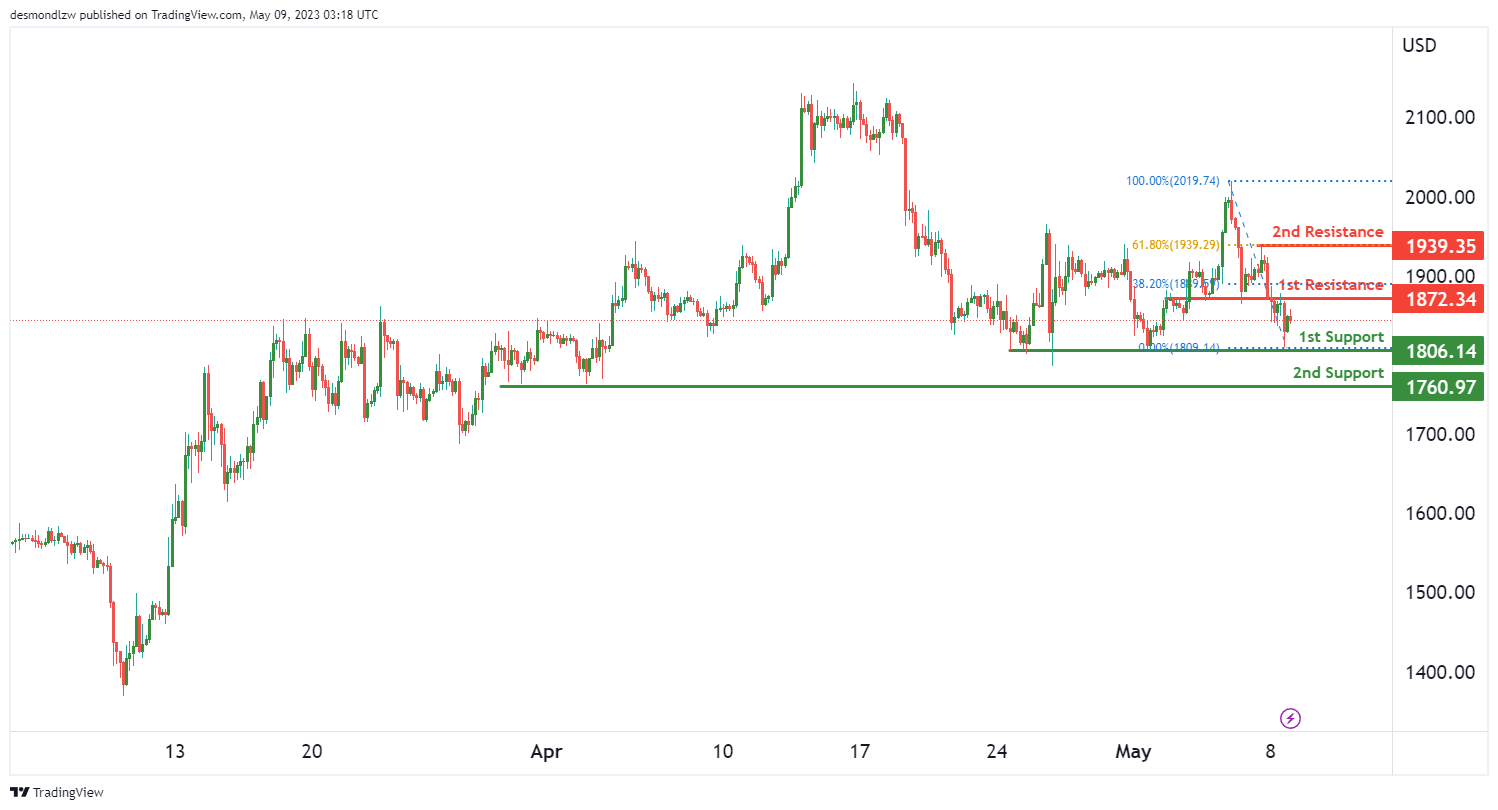
The overall momentum of ETH/USD is currently bullish, with the price above a major ascending trend line. This suggests that further bullish momentum is on the cards for the cryptocurrency.
Looking at the chart, the price of ETH/USD could potentially make a bullish continuation towards the first resistance level at 1877.34. If the price manages to break through this level, it could rise towards the second resistance level at 1939.35.
On the downside, there are two support levels to watch out for. The first support level is at 1808.14, which is a multi-swing low support. The second support level is at 1760.97, which is another multi-swing low support.
In terms of resistance, the first level at 1877.34 is an overlap resistance and is also at the 38.20% Fibonacci retracement level. The second resistance level at 1939.35 is a swing high resistance and is also at the 61.80% Fibonacci retracement level.
WTI/USD:
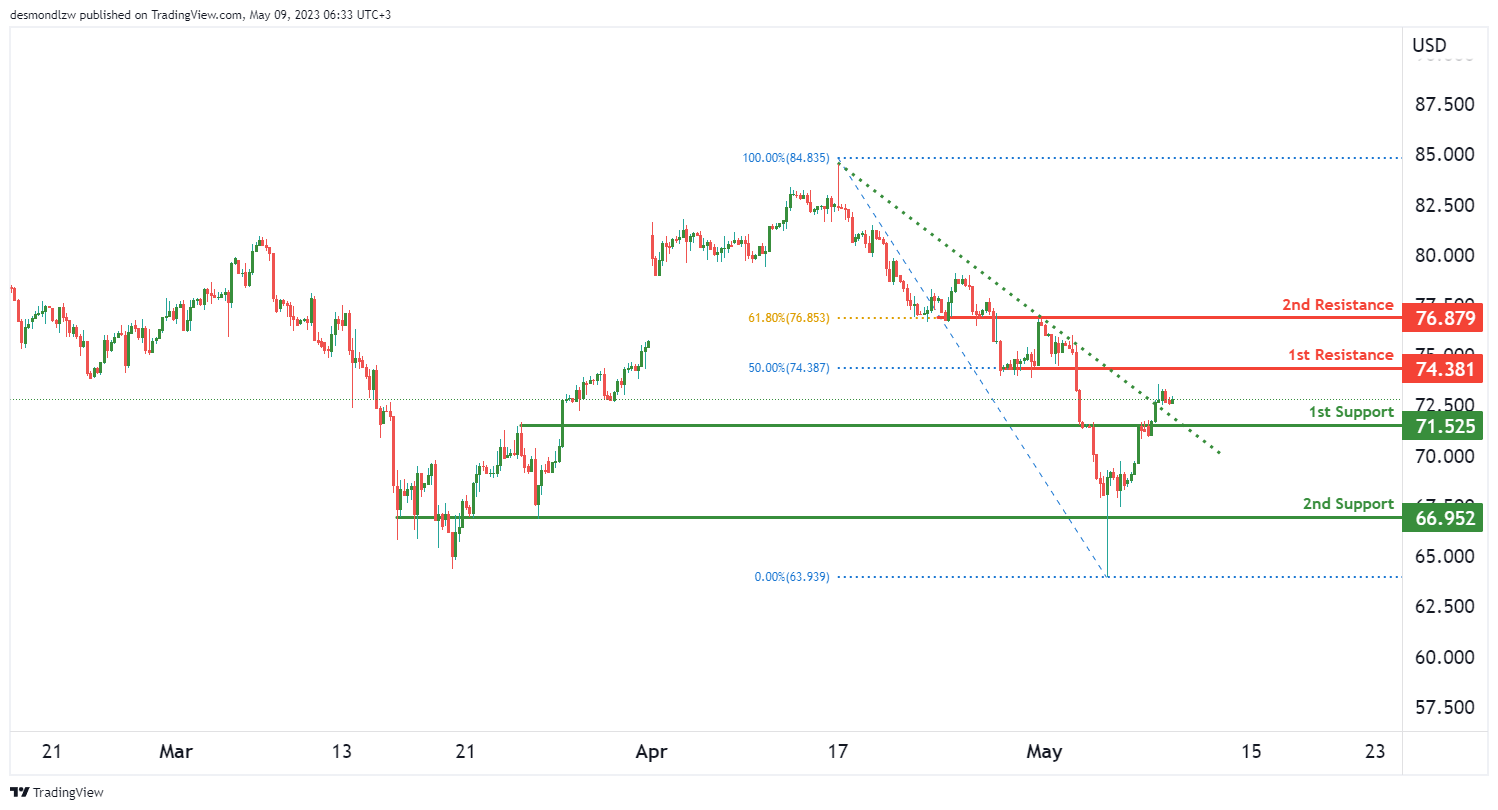
Crude oil prices have been bullish lately, and this momentum is expected to continue based on a number of factors. The overall momentum of the chart is bullish, which means that we can expect prices to continue to rise. One of the reasons for this is that the price broke above a descending resistance line, which triggered a potential bullish move.
Looking at the support and resistance levels, the first support level is at $71.52, which is an overlap support level. This means that this level has been tested several times in the past and has held as support. The second support level is at $66.95, which is also an overlap support level.
On the other hand, the first resistance level is at $74.38, which is a pullback resistance level and corresponds to the 50% Fibonacci retracement level. This level is expected to hold as resistance initially. The second resistance level is at $76.87, which is an overlap resistance level and corresponds to the 61.80% Fibonacci retracement level. This level is expected to be the next target if the price can break above the first resistance level.
XAU/USD (GOLD):
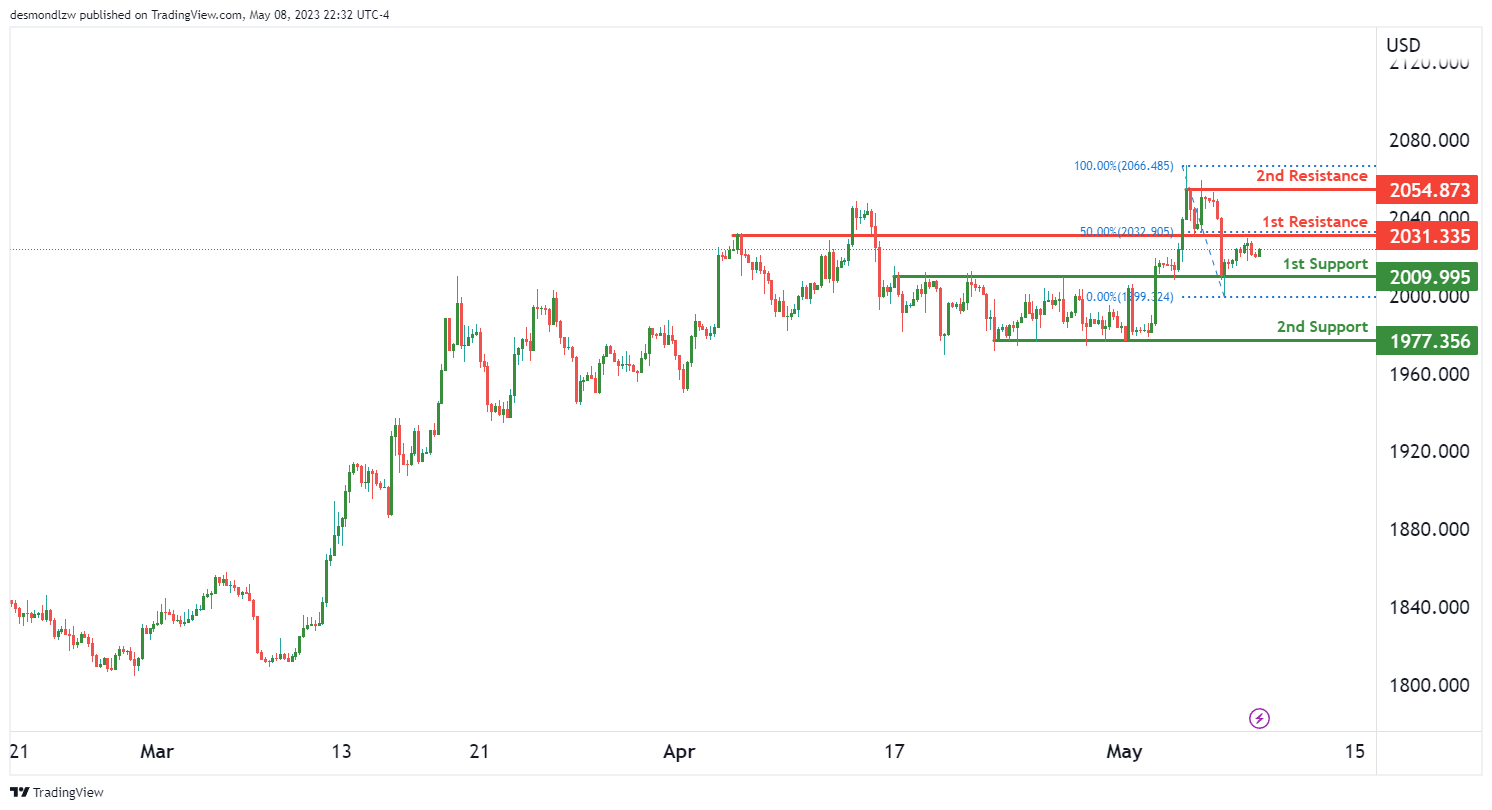
The price of gold (XAU/USD) has been showing bearish momentum on the charts, with potential for a rise towards the first resistance in the short term before reversing and dropping towards the first support level.
The first support level is identified at 2009.99, as an overlap support level. This level could potentially act as a bounce point for the price, providing some temporary relief to the bears. If the price drops below this level, it could continue the bearish trend towards the second support level at 1977.35. This level is identified as a multi-swing low support level, and if the price reaches this level, it could indicate a further downward trend.
On the other hand, the first resistance level is identified at 2031.33, which is also the 50% Fibonacci retracement level. This level could act as a pullback resistance level, where the price might reverse off of it and move towards the support levels. The second resistance level at 2054.87 is identified as a multi-swing high resistance level, and if the price breaks above it, it could potentially signal a reversal of the bearish trend.
EUR/USD Daily Outlook
Daily Pivots: (S1) 1.0985; (P) 1.1019; (R1) 1.1039; More...
No change in EUR/USD's outlook as range trading continues. Intraday bias stays neutral first. Further rally could still be seen with 1.0908 support intact. On the upside, firm break of 1.1094 will resume larger up trend to 1.1273 fibonacci level. Break there will target 61.8% projection of 0.9534 to 1.1032 from 1.0515 at 1.1441 However, considering bearish divergence condition in 4H MACD, break of 1.0908 support will indicate short term topping and turn bias back to the downside.
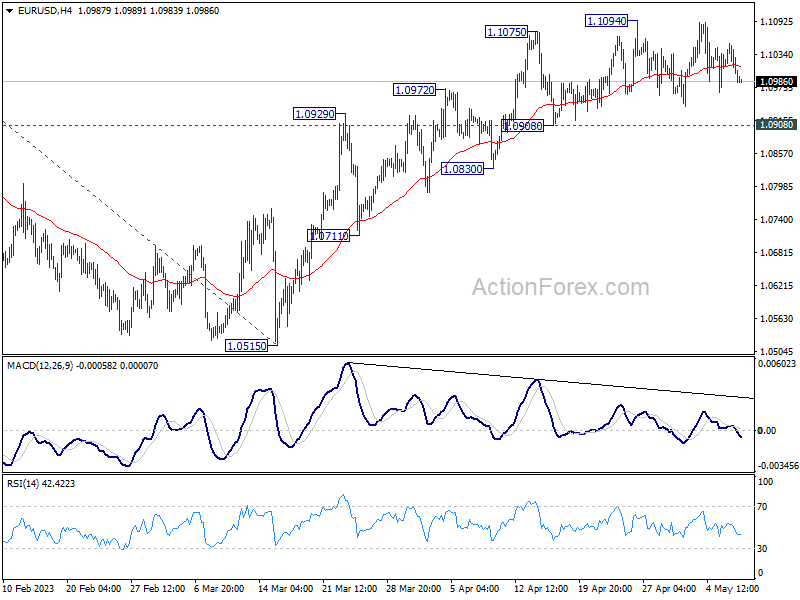
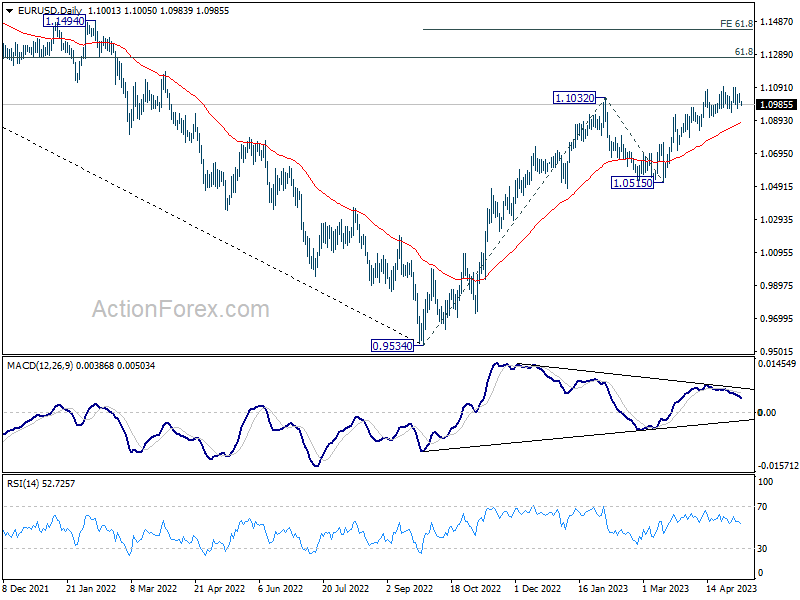
In the bigger picture, rise from 0.9534 (2022 low) is in progress for 61.8% retracement of 1.2348 (2021 high) to 0.9534 at 1.1273. Sustained break there will solidify the case of bullish trend reversal and target 1.2348 resistance next (2021 high). This will now remain the favored case as long as 1.0515 support holds, even in case of deeper pull back.
Euro Continues to Slip in Asian Trading, Dollar Mixed
Euro continues its descent during Asian trading session, partly due to the optimism expressed by ECB Chief Economist about slowing in inflation ahead. The common currency currently ranks as the worst performer for the month, although it still holds above last month's low against all currencies, barring the Pound. Meanwhile, Sterling also shows signs of softness, while Swiss franc is mixed.
Yen, on the other hand, is attempting a comeback, but its upside remains capped by resilient risk sentiment and recovery in global benchmark treasury yields. Dollar is mixed as market awaits tomorrow's US CPI data. Commodity currencies are leading the pack for now, with New Zealand and Australian dollars outpacing Canadian dollar.
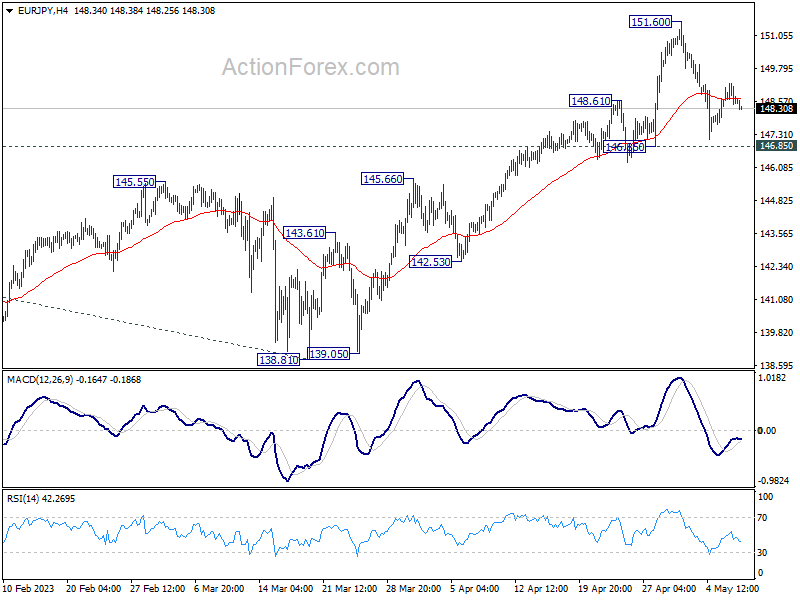
On the technical front, EUR/JPY's recovery appears to have faltered after a brief break of 55 4H EMA. Deeper fall would bring 146.85 support level into focus. Firm break below this level could indicate that deeper correction is underway towards 145.66 resistance turned support level, and possibly even lower. This 146.85 support level should be watched closely alongside 1.0908 support level in EUR/USD. Decisive break of these two levels could signal broader weakness in Euro.
In Asia, at the time of writing, Nikkei is up 1.05%. Hong Kong HSI is down -0.53%. China Shanghai SSE is up 0.39%. Singapore Strait Times is down -0.29%. Japan 10-year JGB yield is up 0.163 at 0.429. Overnight, DOW dropped -0.17%. S&P 500 rose 0.05%. NASDAQ rose 0.18%. 10-year yield rose 0.075 to 3.521.
BoJ Ueda sees position signs in trend inflation
BoJ Governor Kazuo Ueda pointed to encouraging signs in trend inflation during a recent parliamentary session. "We're seeing some positive signs in trend inflation, including inflation expectations," Ueda said. He added that once the BOJ could foresee inflation stably and sustainably meeting their 2% target, they would "abandon yield curve control and then move towards shrinking the bank's balance sheet."
Ueda also spoke about the upcoming monetary policy review, stating it would critically examine the benefits and side effects of past monetary policies. The review process will include workshops with private academics. However, the governor clarified that the central bank did not have any preconceived notions about how the review could influence future monetary policy decisions.
"We will take necessary policy steps at each of our rate reviews, with an eye on financial and price developments, even while we conduct the review," Ueda stated.
Australia sees second consecutive quarter of falling retail sales volume amidst rising living costs
Australia's retail sales volume declined by -0.6% qoq to AUD 96.17 billion in Q1 2023. Through the year, sales volume only managed to register a modest 0.3% yoy growth in the quarter.
ABS's head of retail statistics, Ben Dorber, noted that this marked the second consecutive quarter of falling retail sales volumes, primarily influenced by mounting cost of living pressures that continue to burden household spending.
"Outside of the COVID-19 pandemic period, this is the largest fall in retail sales volumes since the September quarter of 2009," Dorber stated, underlining the gravity of the situation.
Meanwhile, retail prices growth has slowed to 0.6% qoq in Q1. "Retail prices rose for the sixth straight quarter, but price growth this quarter is the smallest since September 2021," Dorber added.
He attributed the slowdown in price growth mainly to discounts on clothing and larger household items such as furniture and electronic goods. However, he noted that food retailing prices continued their upward trajectory.
China exports rose 8.5% yoy in Apr, exports to Russia surged 153% yoy
China's April exports outperformed expectations, growing by 8.5% yoy to reach USD 295.4B. This marked the second consecutive month of growth, exceeding anticipated 8.0% yoy. However, imports dropped by -7.9% yoy to USD 205.2B, falling short of expected 0.0% yoy. As a result, trade surplus widened from USD 88.2B to USD 90.2B, significantly surpassing the forecasted USD 69.0B.
Breaking down the numbers, exports to EU experienced a modest growth of 3.7% yoy, while imports from the bloc saw a slight decrease of -0.12% yoy. Trade with the US reflected a downturn, with exports dropping by -6.5% yoy and imports declining by -3.1% yoy.
Trade relations with ASEAN region were mixed, with exports increasing by 4.49% yoy, while imports fell by -6.25% yoy. Meanwhile, trade with Russia exhibited a significant surge. Chinese exports to Russia skyrocketed by a staggering 153.09% yoy, and imports also rose, though at a more modest rate of 8.06% yoy.
ECB Lane predicts disinflation later this year, despite ongoing core inflation momentum
ECB Chief Economist Philip Lane acknowledged yesterday ongoing momentum in inflation but predicted a shift toward disinflation later this year.
Speaking at a panel in Berlin, Lane said, "There's still a lot of momentum in inflation, but later this year and ongoing a lot of this inflation is supposed to reverse, partly because of the reversal of the underlying shocks, partly because of monetary policy."
Despite this outlook, Lane noted that there is still momentum in food and core inflation, which runs counter to the decline in energy inflation.
Discussing businesses' expectations, Lane mentioned, "This year (businesses) expect margins to fall quite a bit, because they may face cost increases, including labour costs increases, but they won't be able to increase prices by so much because demand is normalising."
He also emphasized the importance of rebuilding real wages in the labor market, stating, "There's a very basic imperative for the labour market to rebuild real wages." Lane explained that this transition phase, which will last several years, helps clarify why inflation is not immediately dropping back to 2%.
Looking ahead
France trade balance is the only feature in European session while US will release NFIB business optimism index.
EUR/USD Daily Outlook
Daily Pivots: (S1) 1.0985; (P) 1.1019; (R1) 1.1039; More...
No change in EUR/USD's outlook as range trading continues. Intraday bias stays neutral first. Further rally could still be seen with 1.0908 support intact. On the upside, firm break of 1.1094 will resume larger up trend to 1.1273 fibonacci level. Break there will target 61.8% projection of 0.9534 to 1.1032 from 1.0515 at 1.1441 However, considering bearish divergence condition in 4H MACD, break of 1.0908 support will indicate short term topping and turn bias back to the downside.
In the bigger picture, rise from 0.9534 (2022 low) is in progress for 61.8% retracement of 1.2348 (2021 high) to 0.9534 at 1.1273. Sustained break there will solidify the case of bullish trend reversal and target 1.2348 resistance next (2021 high). This will now remain the favored case as long as 1.0515 support holds, even in case of deeper pull back.
Economic Indicators Update
| GMT | Ccy | Events | Actual | Forecast | Previous | Revised |
|---|---|---|---|---|---|---|
| 23:30 | JPY | Labor Cash Earnings Y/Y Mar | 0.80% | 1.00% | 1.10% | |
| 23:30 | JPY | Overall Household Spending Y/Y Mar | -1.90% | 0.40% | 1.60% | |
| 03:00 | CNY | Trade Balance (USD) Apr | 90.2B | 69.0B | 88.2B | |
| 06:45 | EUR | France Trade Balance (EUR) Mar | -9.5B | -9.9B | ||
| 10:00 | USD | NFIB Business Optimism Index Apr | 89.6 | 90.1 |