Sample Category Title
EUR/USD Mid-Day Outlook
Daily Pivots: (S1) 1.0974; (P) 1.1011; (R1) 1.1055; More...
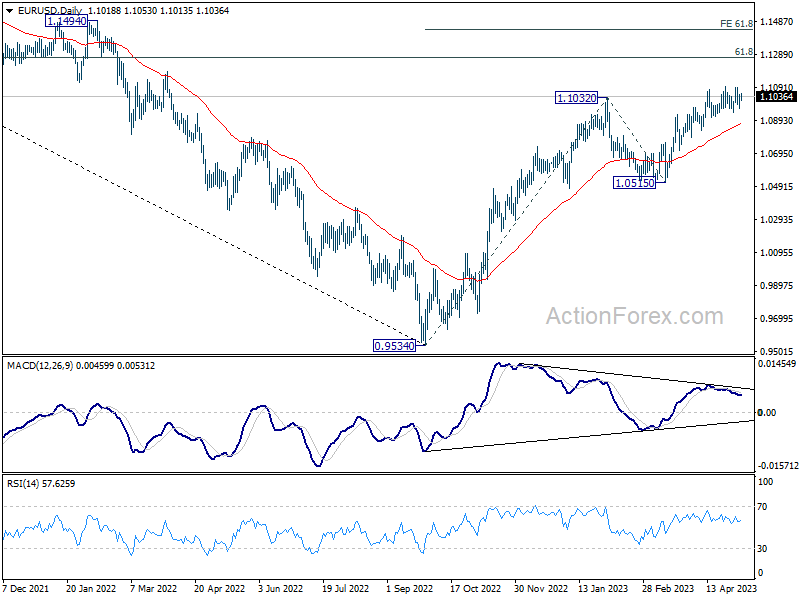
Range trading continues in EUR/USD and intraday bias stays neutral. But further rally remains in favor too. On the upside, firm break of 1.1094 will resume larger up trend to 1.1273 fibonacci level. Break there will target 61.8% projection of 0.9534 to 1.1032 from 1.0515 at 1.1441 However, considering bearish divergence condition in 4H MACD, break of 1.0908 support will indicate short term topping and turn bias back to the downside.
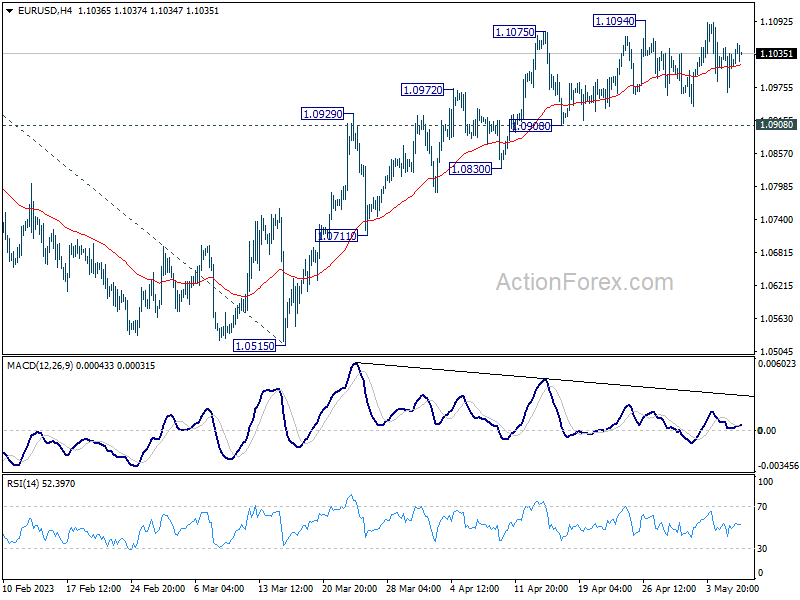
In the bigger picture, rise from 0.9534 (2022 low) is in progress for 61.8% retracement of 1.2348 (2021 high) to 0.9534 at 1.1273. Sustained break there will solidify the case of bullish trend reversal and target 1.2348 resistance next (2021 high). This will now remain the favored case as long as 1.0515 support holds, even in case of deeper pull back.
GBP/USD Mid-Day Outlook
Daily Pivots: (S1) 1.2578; (P) 1.2615; (R1) 1.2669; More...
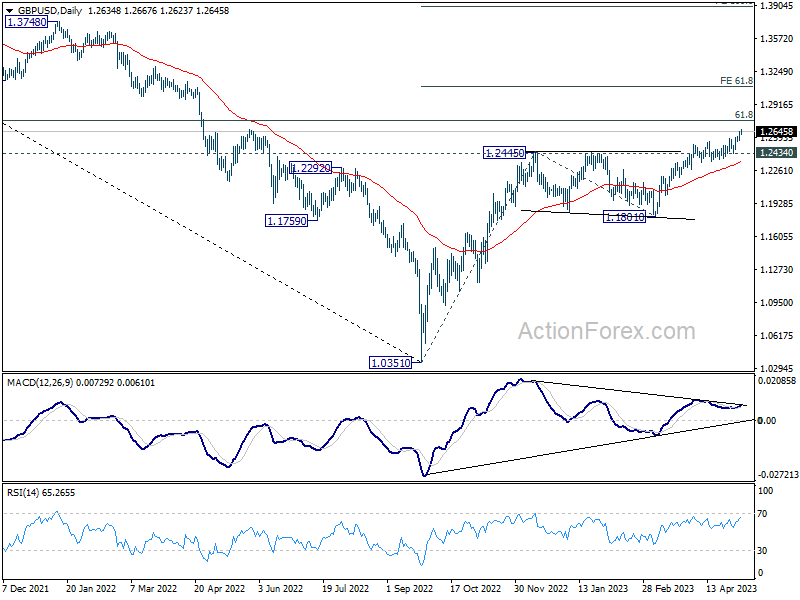
Outlook in GBP/USD remains on the upside at this point, and intraday bias stays on the upside. Current up trend should target 1.2759 fibonacci level first. Firm break there will target 61.8% projection of 1.0351 to 1.2445 from 1.1801 at 1.3095. Meanwhile, break of 1.2434 support is needed to confirm short term topping. Otherwise, outlook will stay bullish in case of retreat.
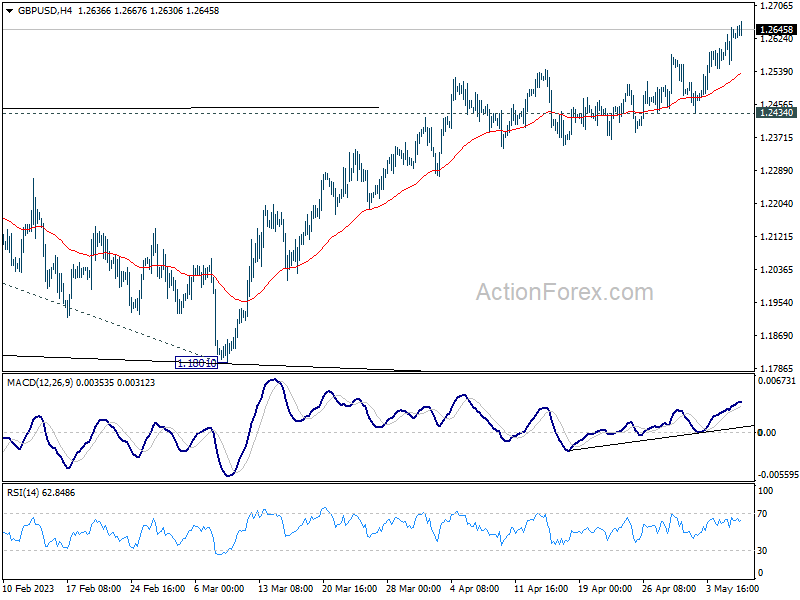
In the bigger picture, the rise from 1.0351 medium term term bottom (2022 low) is in progress for 61.8% retracement of 1.4248 (2021 high) to 1.0351 at 1.2759. Sustained break there will add to the case of long term bullish trend reversal. Further break of 61.8% projection of 1.0351 to 1.2445 from 1.1801 at 1.3095 could prompt upside acceleration to 100% projection at 1.3895. For now, this will remain the favored case as long as 1.1801 support holds, even in case of deep pull back.
USD/CHF Mid-Day Outlook
Daily Pivots: (S1) 0.8836; (P) 0.8905; (R1) 0.8974; More...
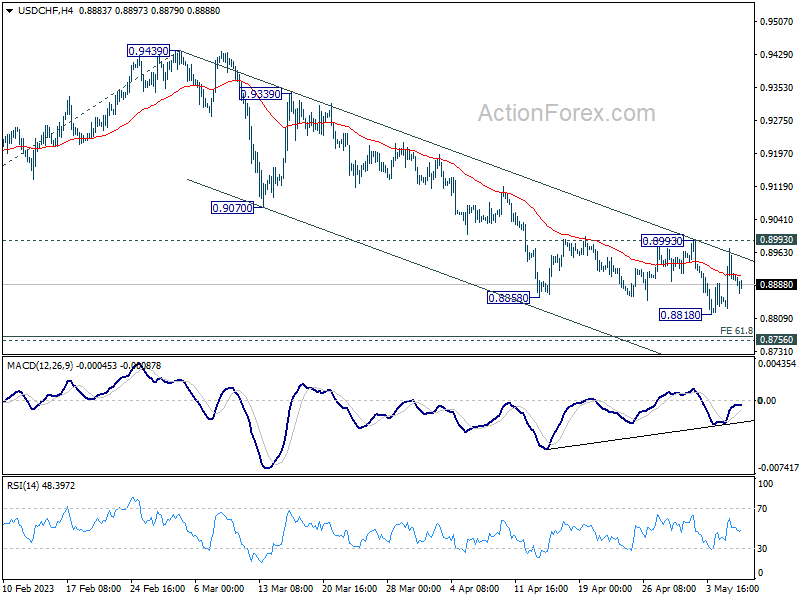
USD/CHF is bounded in range of 0.8818/8993 and intraday bias stays neutral. While down trend from 1.0146 could still extend lower, strong support should be seen from 61.8% projection of 1.0146 to 0.9058 from 0.9439 at 0.8767, which is close to 0.8756 long term support, to bring rebound, at least on first attempt. On the upside, break of 0.8993 resistance will indicate short term bottoming, on bullish convergence condition in 4H MACD, and turn bias back to the upside for stronger rebound.
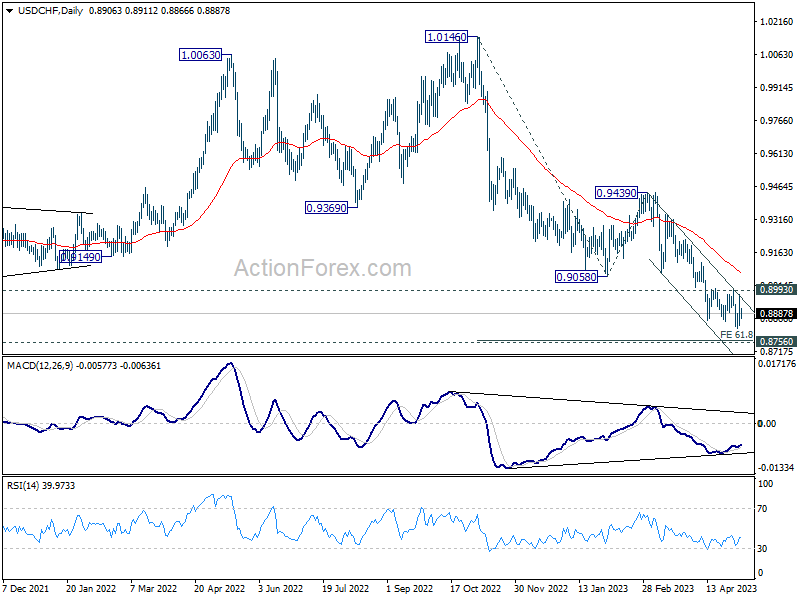
In the bigger picture, fall from 1.1046 (2022 high) is seen as a leg in the long term range pattern from 1.0342 (2016 high). So, downside should be contained by 0.8756 to bring reversal. Sustained break of 0.9058 support turned resistance will be the first sign of medium term bottoming. However, decisive break of 0.8756 will carry larger bearish implications.
USD/JPY Mid-Day Outlook
Daily Pivots: (S1) 134.11; (P) 134.62; (R1) 135.34; More...
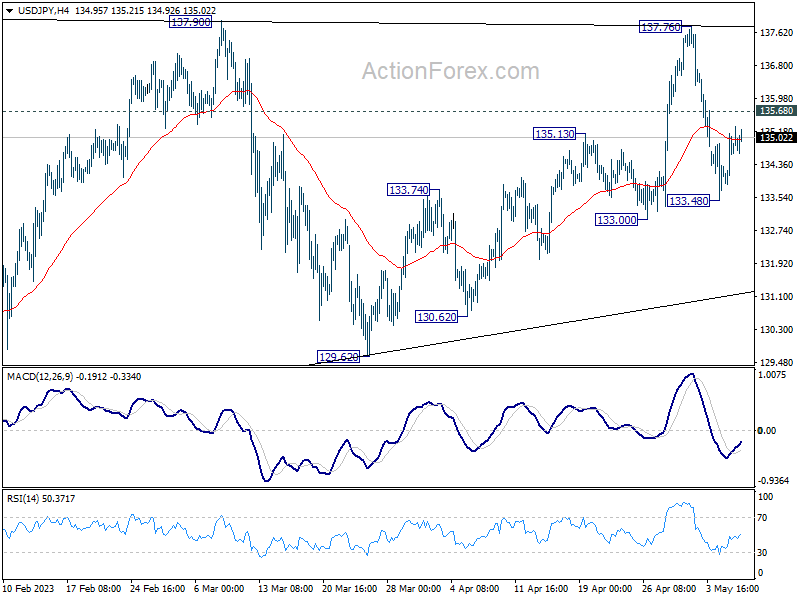
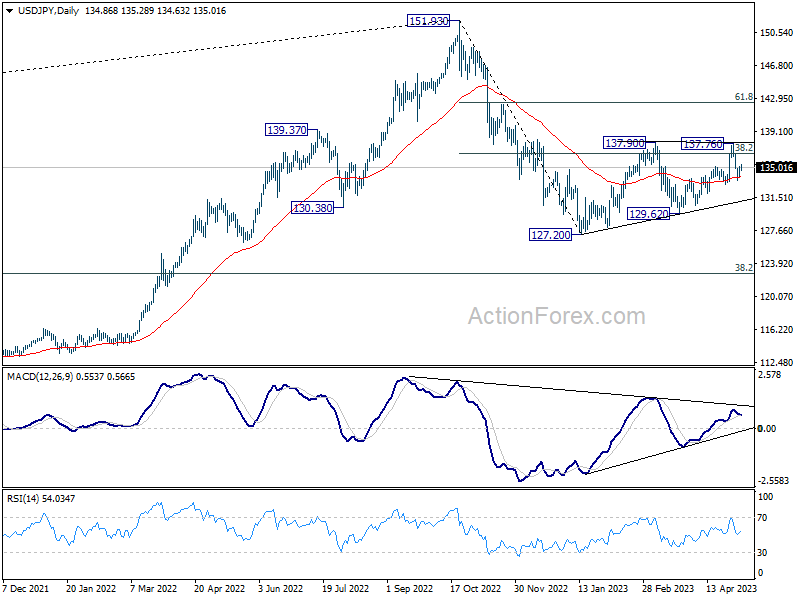
No change in USD/JPY's outlook and intraday bias stays neutral. Further decline is still in favor with 135.68 minor resistance intact. Fall from 137.76 is seen as the third leg of the pattern from 137.90. Below 133.48 will target 133.00 first, break will target 129.62 support. Still, as long as 129.62 holds, larger rebound from 127.20 is still in favor to resume at a later stage. On the upside, above 135.68 minor resistance will turn bias back to the upside for 137.76/90 instead.
In the bigger picture, price actions from 151.93 high are currently seen as a corrective pattern to the long term up trend. The first leg should have completed at 127.20. Rebound from there is seen as the second leg. Sustained break of 38.2% retracement of 151.93 to 127.20 at 136.34 will bring stronger rebound to 61.8% retracement at 142.48. Meanwhile, break of 129.62 will argue that the third leg is starting through 127.20 low.
EUR/AUD Mid-Day Outlook
Daily Pivots: (S1) 1.6266; (P) 1.6365; (R1) 1.6416; More...
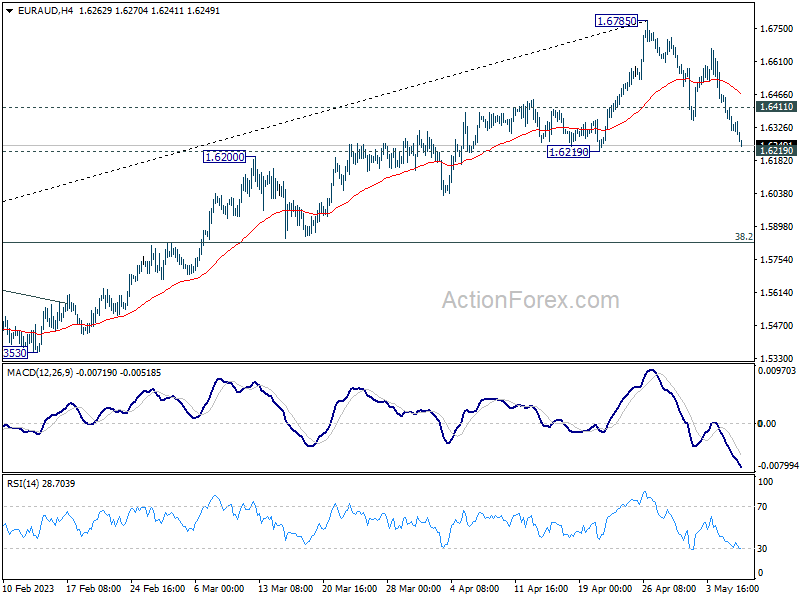
Immediate focus is now on 1.6219 support tin EUR/AUD. Considering bearish divergence condition in D MACD, decisive break of 1.6219 will argue that it's already in correction to whole up trend from 1.4281. Deeper decline would then be seen to 38.2% retracement of 1.4281 to 1.6785 at 1.5282, which is inside 1.5254/5976 support zone. On the upside, break of 1.6411 minor resistance will retain near term bullishness and turn bias back to the upside for retesting 1.6785 high.
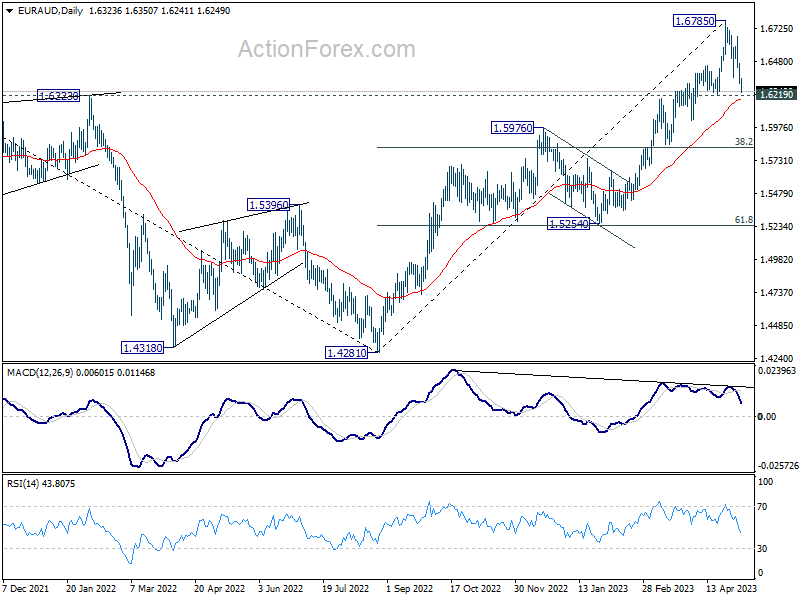
In the bigger picture, the solid break of 1.6434 resistance argues that whole down trend from 1.9799 (2020 high) has completed at 1.4281 (2022 low). Further rise should be seen to 61.8% retracement of 1.9799 to 1.4281 at 1.7691 next. For now, outlook will stay bullish as long as 1.5976 resistance turned support holds, even in case of deep pull back.
Euro Weakens Amid Faltering Economic Recovery, Commodity Currencies Shine
Eurn turns weaker today after investor confidence data suggests that economic recovery might be faltering. But for now, Yen and Dollar are even weaker. Sterling and Swiss Franc are not much better than Euro too. Commodity currencies are the stars of the day, with New Zealand Dollar leading the way. Canadian Dollar is also catching up quickly, following Australian Dollar. Overall, the movement in currencies for the rest of the day will very much depend on development in risk sentiment.
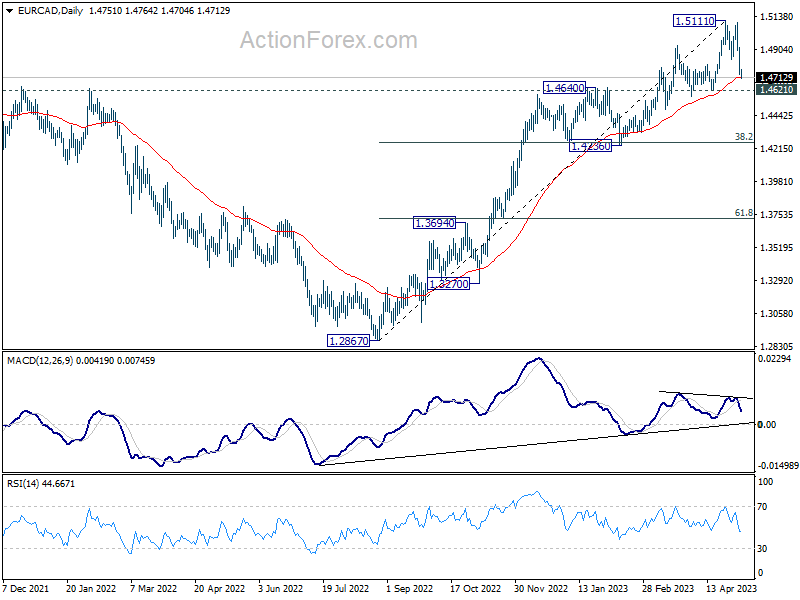
Technically, one immediate focus now is whether EUR/AUD's selloff would accelerate from current level. Sustained break of 1.6219 support, which is close to 55 D EMA (now at 1.6191) would argue that it's already in correction to whole up trend from 1.4281. Deeper fall would be seen to 1.5254/5976 support zone. At the same time, break of 1.4621 support in EUR/CAD would align the outlook and bring deeper decline to 1.4235 support.
In Europe, UK is on holiday. At the time of writing, DAX is up 0.21%. CAC is up 0.30%. Germany 10-year yield is up 0.0354 at 2.330. Earlier in Asia, Nikkei dropped -0.71%. Hong Kong HSI rose 1.24%. China Shanghai SSE rose 1.81%. Singapore Strait Times dropped -0.27%. Japan 10-year JGB yield dropped -0.0107 to 0.413.
Eurozone Sentix hits lowest level since January, recovery beginning to falter
Eurozone Sentix Investor Confidence fell to its lowest level since January, dropping from -8.7 to -13.1 in May. Current Situation Index slipped from -4.3 to -7.0, while Expectations Index declined from -13.0 to -19.0 – its lowest point since December 2022.
Sentix commented, "The spring upswing in individual eurozone countries has so far been subdued anyway. Now the eurozone economy is being gripped by significant spring fatigue." The organization added that although the Eurozone economy weathered the winter months better than many had feared, energy shortages remain a perennial issue. High inflation data continues to hamper consumer spending, causing the economic recovery to falter.
Regarding inflation, Sentix noted, "the Inflation Barometer does not indicate any sustained easing, which should give the central banks little leeway to deviate from their restrictive path in their current key interest rate policy."
Japan's PMI services reaches record high in April, record optimism too
Japan PMI Services rose to 55.4 in April, up from 55.0 in March, marking the eighth consecutive month in growth territory. This represents the highest reading since records began in 2007, surpassing the previous record set in 2013. S&P Global also noted that year-ahead business expectations reached an all-time high, while prices charged increased at the steepest pace in nine years. Meanwhile, the PMI Composite remained unchanged at 52.9, as stronger services growth offset a sharper reduction in manufacturing production.
Tim Moore, Economics Director at S&P Global Market Intelligence attributed the record rise in service sector output to a rebound in demand for face-to-face consumer services, recovery in international tourist arrivals, and improvement in new business from abroad.
Moore also emphasized the high level of business confidence, with around four times as many service providers expecting an increase in activity as those forecasting a decline. This optimism marked the highest level in more than 15 years of data collection.
Furthermore, service providers increasingly passed on higher business expenses to customers to alleviate pressure on margins from rising wages and transportation costs. This resulted in the steepest increase in service sector output charges since the sales tax hike in April 2014.
BoJ minutes: Few members saw positive signs towards price target
Minutes of BoJ's meeting on March 9 and 10 show a continued commitment to monetary easing, with the aim of achieving price stability in a sustainable and stable manner, accompanied by wage increases. Nevertheless, a few members noted emerging "positive signs" toward reaching the price stability target, indicating a changing price environment.
With respect to yield curve control, some members emphasized the need to examine the effects of various implemented measures aimed at improving market functioning. They acknowledged that JGB yield curve appeared smoother than before. One member explained that if observed CPI inflation declined and market projections of interest rates calmed down, distortions in the yield curve would likely be corrected.
In terms of the 2% price stability target, several members underscored the importance of maintaining its commitment. One member added that the central bank should anchor inflation expectations to 2% by committing to achieve the target.
Meanwhile, another member expressed concern that discussing the target might lead to "unnecessary speculation" on monetary policy conduct, especially given the growing possibility of achieving the price stability target. This member also argued against revising the joint statement of the government and BoJ.
Australia NAB business confidence rose to 9, conditions down to 14
Australia NAB Business Confidence index rose from -1 to 0 in April, while Business Conditions slipped from 16 to 14. A closer look at the details reveals that trading conditions declined from 24 to 20, profitability conditions dropped from 13 to 11, and employment conditions edged up from 10 to 11.
Price and cost growth indicators were mixed, with labor cost growth holding steady at 1.9% in quarterly equivalent terms, and purchase cost growth increasing to 2.3% (up from 1.9% in March). However, overall price growth was 1.1% (down from 1.3%), and inflation in the retail sector declined to 1.4% (down from 1.7%).
NAB Chief Economist Alan Oster pointed out that business conditions, although lower, remained well above their long-run average. Confidence, although still below average, has stabilized around 0 index points in recent months. Furthermore, Oster observed some easing in price measures this month, even as cost pressures remained high. This trend may signal a gradual easing of inflation in Q2's early stages, though inflation remains elevated.
EUR/AUD Mid-Day Outlook
Daily Pivots: (S1) 1.6266; (P) 1.6365; (R1) 1.6416; More...
Immediate focus is now on 1.6219 support tin EUR/AUD. Considering bearish divergence condition in D MACD, decisive break of 1.6219 will argue that it's already in correction to whole up trend from 1.4281. Deeper decline would then be seen to 38.2% retracement of 1.4281 to 1.6785 at 1.5282, which is inside 1.5254/5976 support zone. On the upside, break of 1.6411 minor resistance will retain near term bullishness and turn bias back to the upside for retesting 1.6785 high.
In the bigger picture, the solid break of 1.6434 resistance argues that whole down trend from 1.9799 (2020 high) has completed at 1.4281 (2022 low). Further rise should be seen to 61.8% retracement of 1.9799 to 1.4281 at 1.7691 next. For now, outlook will stay bullish as long as 1.5976 resistance turned support holds, even in case of deep pull back.
Economic Indicators Update
| GMT | Ccy | Events | Actual | Forecast | Previous | Revised |
|---|---|---|---|---|---|---|
| 23:50 | JPY | BoJ Meeting Minutes | ||||
| 01:30 | AUD | NAB Business Conditions Apr | 14 | 16 | ||
| 01:30 | AUD | NAB Business Confidence Apr | 0 | -1 | ||
| 01:30 | AUD | Building Permits M/M Mar | -0.10% | 3.00% | 4.00% | |
| 06:00 | EUR | Germany Industrial Production M/M Mar | -3.40% | -1.60% | 2.00% | 2.10% |
| 08:30 | EUR | Eurozone Sentix Investor Confidence May | -13.1 | -7.9 | -8.7 | |
| 14:00 | USD | Wholesale Inventories Mar F | 0.10% | 0.10% |
EUR/USD: Bullish Bias Above 1.10 Support, But Near-term Action Still in a Range
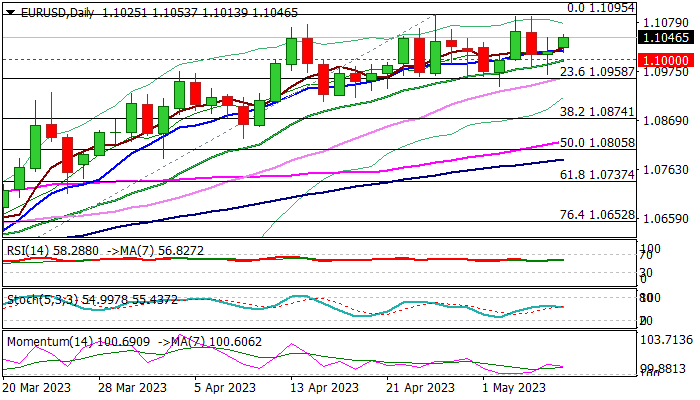
The Euro regained traction on Monday after Friday’s action, shaped in long-legged Doji, signaled indecision.
Near-term bias remains with bulls as price action stays above psychological 1.10 support the fourth straight day.
The pair kept positive tone despite significant drop in German industrial production in March (-3.4% vs 2.1% rise in Feb), underpinned by weaker dollar on expectations of Fed rates peak and speculations of possible start of cutting rates.
However, near-term action remains directionless while holding within 1.0942/1.1095 range for the fourth consecutive week, with break of either range boundary to generate fresh direction signal.
The single currency is expected to maintain positive stance while market prices for rate cuts this year, with more information from US loans and inflation data, while German recession risk weighs.
Bullish scenario requires firm break of 2023 peak (1.1095) to signal bullish continuation and expose targets at 1.1193/1.1274 (200WMA / Fibo 61.8% of 1.2349/0.9535).
Conversely, loss of 1.10 support would dent near-term structure, with sustained break of pivots at 1.0960/42 to revive bears and generate initial reversal signal.
Res: 1.1000; 1.1044; 1.1075; 1.1095.
Sup: 1.1000; 1.0960; 1.0942; 1.0909.
WTI Oil Technical: Evolving into Minor Uptrend
- Last week’s intra-week loss of -17% has been recovered partially.
- Positive technical analysis elements sighted; “Morning Star” daily Japanese candlestick.
- Short-term overbought condition in hourly RSI highlights the risk of a minor pull-back.
West Texas Oil Technical Analysis – Minor uptrend intact but risk of a pull-back
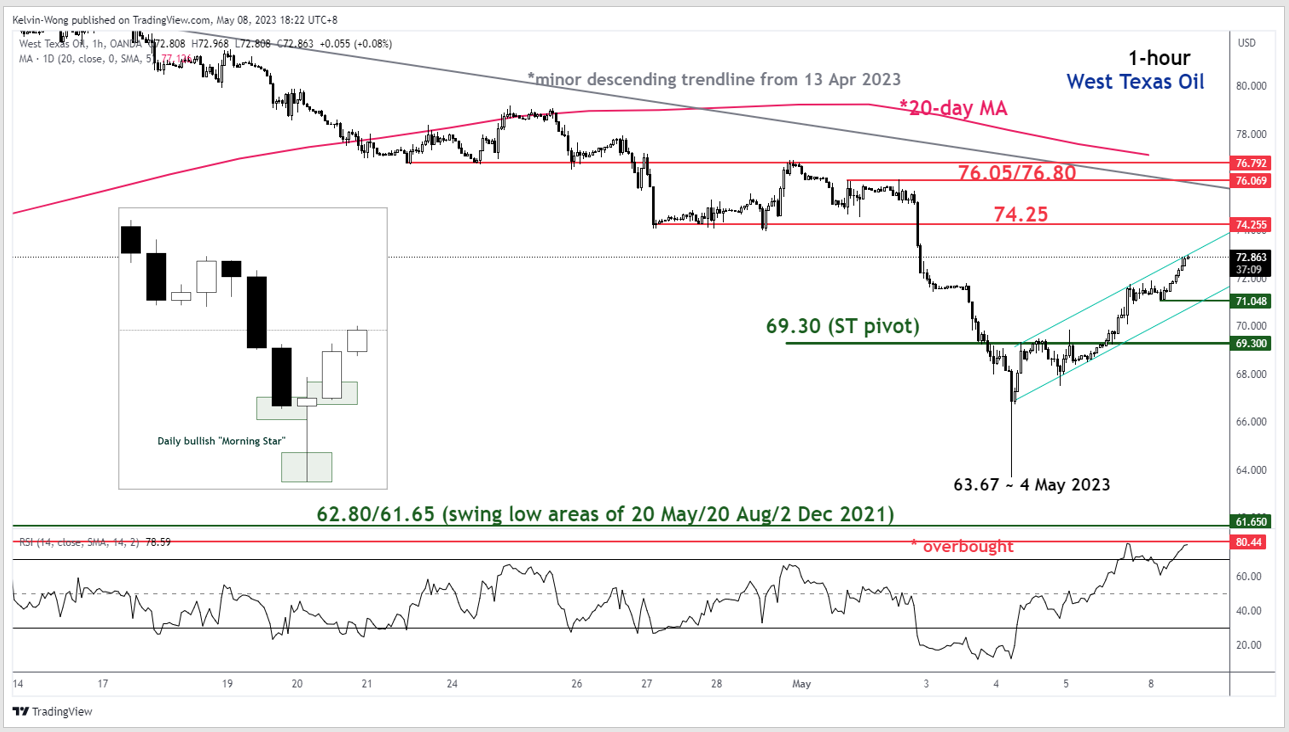
Fig 1: West Texas Oil trend as of 8 May 2023 (Source: TradingView, click to enlarge chart)
The West Texas Oil (a proxy for the WTI crude oil futures) managed to stage a partial reversal last Friday, 5 May on its initial prior intra-week losses of around -17% where it was going to record its worst weekly decline in three years since the onset of the pandemic in early March 2020.
West Texas Oil has formed a daily bullish reversal three-candlestick configuration called “Morning Star” via the price actions captured on 3 May, 4 May, and 5 May 2023. The formation of such a bullish reversal Japanese candlestick confirmation indicates a possible change in the bearish sentiment of the prior short-term downtrend of West Texas Oil in place since the 12 April 2023 high of US$83.53/barrel.
On a minor scale as seen from the 1-hour chart, the recent up move of West Texas Oil from its 4 May low of US$63.67/barrel has evolved into a minor ascending channel that depicts a minor uptrend phase in progress.
But this ongoing minor uptrend phase has just reached the upper limit of the ascending channel at around US$73.00/barrel with the 1-hour RSI oscillator at overbought condition (above 70%). These observations suggest that the upside momentum of the minor uptrend has reached overstretched conditions where the risk of a minor pull-back has increased at this juncture with the immediate support to watch at US$71.05/barrel.
US$69.30/barrel is the short-term pivotal support to maintain this minor uptrend with the next resistances at US$74.25/barrel and a break above it may see the next resistance coming in at US$76.05-76.80/barrel (also coincides with the minor descending trendline from 13 April 2022 high & the 20-day moving average where the price actions have trading below it since 20 April 2023).
On the other hand, failure to hold above US$69.30/barrel jeopardizes the minor uptrend to expose the key medium-term support zone of US$62.80-61.65/barrel.
BTCUSD Analysis: Important Support Under Threat
On May 7, Binance, the largest cryptocurrency exchange, suspended the withdrawal of bitcoins twice due to a heavy load on the network, which may be associated with a surge in traders' interest in new meme coins. This, in turn, caused bitcoin transaction fees to reach their highest level in two years. Fortunately, bitcoin operations on Binance were restored, but the unfortunate incident had a negative impact on the price of bitcoin.
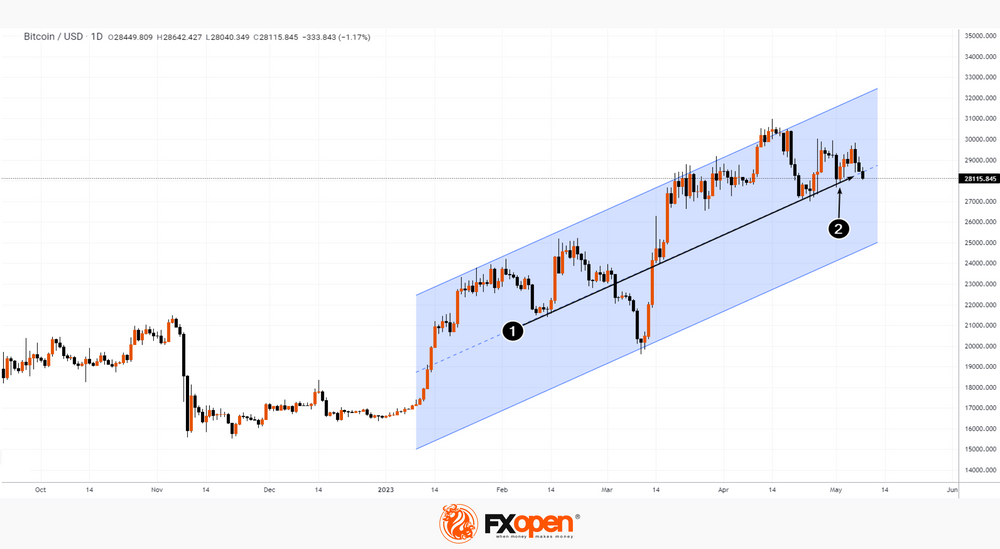
The bitcoin chart shows that the current price of bitcoin in USD is near an important support line (1) — this is the median line of the ascending channel, which has been in effect since the beginning of the year. Bitcoin price rebounded (2) from this line in early May. However, the bulls failed to reach the psychological level of USD 30k (a sign of weak demand), and today bitcoin is forming the third bearish candle in a row. Because of this, a bearish breakdown of this line may form in the near future.
Dollar Index: Dollar Comes Under Increased Pressure on Rate Peak Speculations, US Loans
The dollar index started the week in negative mode, pressured by speculations of a peak in Fed rates, as the central bank signaled on last week’s policy meeting.
Some analysts also point to possible start of cutting rates, though the percentage of expectations is still low, as robust US jobs data for April partially offset expectations.
Markets focus on today’s US loans data which is expected to give more details about the size of credit tightening after three us banks failed recently and Apr inflation data (due on Wednesday) which will show whether consumer prices returned to a downward trajectory after surprise jump in March, or price growth is gaining traction.
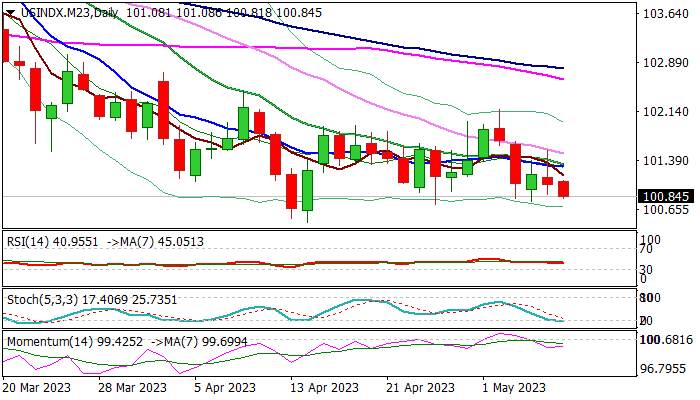
Daily technical studies remain bearish but oversold, which may obstruct fresh bears on attempts at key support at 100.45 (2023 low of Apr 14), although negative signal on bearish weekly candle with long upper shadow, which comes after a double-Doji, maintains pressure.
Firm break of 100.45 pivot would expose psychological 100 support and signal continuation of larger downtrend from 114.72 (2022 high) towards next target at 97.93 (200WMA).
The action should stay capped by falling converged 10/20DMA’s (101.30) to keep bears intact, though extended consolidation above 100.45 cannot be ruled out until release of US inflation data.
Res: 101.30; 101.54; 101.97; 102.17.
Sup: 100.66; 100.45; 100.00; 99.43.