Sample Category Title
USD/CAD Daily Outlook
Daily Pivots: (S1) 1.3316; (P) 1.3430; (R1) 1.3489; More....
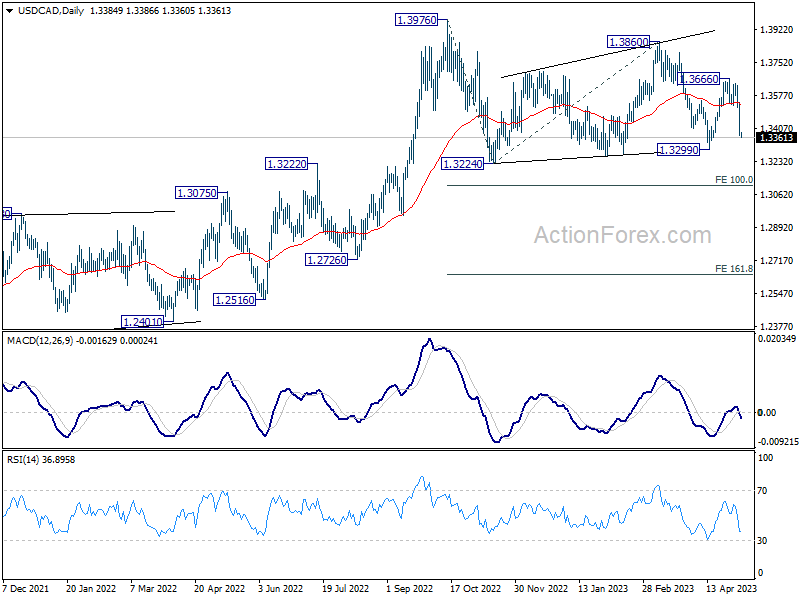
Intraday bias in USD/CAD remains on the downside for 1.3299 support first. Firm break there will extend the corrective pattern from 1.3976 lower to 100% projection of 1.3976 to 1.3224 from 1.3860 at 1.3395 next. On the upside, though, above 1.3425 minor resistance will turn intraday bias neutral first.
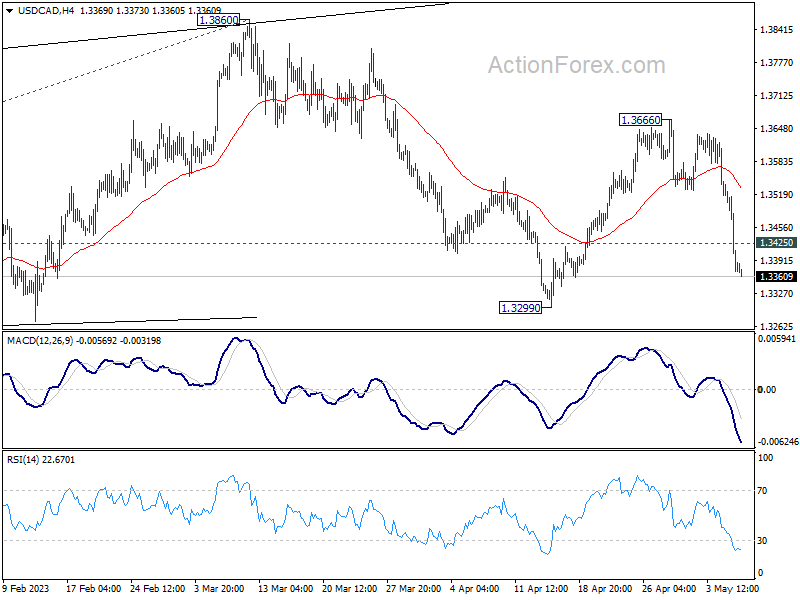
In the bigger picture, as long as 55 W EMA (now at 1.3312) holds, up trend from 1.2005 (2021 low) is still in favor to resume through 1.3976 at a later stage. However, sustained trading below the EMA and 38.2% retracement of 1.2005 to 1.3976 at 1.3233 will raise the chance of bearish reversal. Deeper should then be seen to 61.8% retracement at 1.2758 next.
JPY Bearish Positioning is Getting Overstretched
- Better than expected US non-farm payrolls for April have failed to ignite US dollar bulls.
- Two outliers; the safe haven currencies, CHF and JPY underperformed against the US dollar due to the resurgence of risk-on behaviour in the US stock market.
- JPY future’s bearish positioning has highlighted a risk of a short-term revival of JPY’s strength.
Last Friday, the better-than-expected US official non-farm payrolls data (labour market) for April failed to trigger a meaningful rally in the US dollar in general where the US Dollar Index ended the 5 May US session with a loss of -0.16% to close at 101.28, a whisker away from its 100.95 key medium-term support that has been tested twice so far in past four weeks.
Even the recovery in the 2-year US Treasury yield which added 12 basis points to close at 3.92% last Friday reinforced by the rosy US payrolls data that put a halt to the prior three sessions of daily losses has failed to ignite the bulls in the US dollar.
Interestingly, the major currencies that underperformed against the US dollar last Friday were the safe haven pair duo; CHF (-0.5%) and JPY (-0.4%), and the primary driver was the risk-on behaviour seen in the US stock market.
The benchmark S&P 500 has managed to reduce its initial accumulated losses of -2.6% from last Monday to Thursday by more than half, ending last Friday’s US session with a minor weekly loss of -0.8% attributed mainly by stellar returns of Apple, NVIDIA and Tesla that on the average contributed 26% of last Friday’s S&P 500 daily gain of +1.85%.
Also, the Bank of Japan’s (BoJ) latest guidance from its recently concluded monetary policy meeting in April is still skewed towards maintaining its ultra-dovish stance at least in the short term that is likely to have put a cap on traders’ bet on further JPY’s strength and weakness on the 10-year Japanese Government Bond (JGB) price.
Based on the latest weekly Commitments of Traders report as of 1 May 2023 compiled by the Commodity Futures Trading Commission (CFTC) on US exchange-listed FX futures market on the JPY futures contract (take note that JPY is quoted as the base currency & USD as the variable currency), it has indeed shown that traders’ sentiment is skewed towards a more bearish positioning on JPY.
Trader’s sentiment from the Commitments of Traders report is measured by the difference between the net open positions of large non-commercials (speculators) and the large commercials (hedgers/dealers). A positive number represents net long positions on JPY and a negative number represents net short on JPY.
JPY futures’ bearish positioning is building up
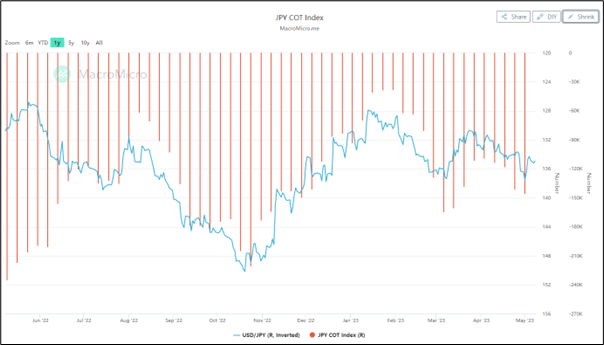
Fig 1: JPY futures net positioning trend as of 1 May 2023 (Source: MacroMicro, click to enlarge chart)
Since 3 April 2023, the weekly reported net open positions on the JPY futures market have indicated a steady increase of net shorts positions on JPY from -109,302 contracts to -145,845 as of 1 May 2023 which suggests that traders’ sentiment on the JPY is getting bearish on an incremental basis.
An important point to note is that sentiment on financial assets can significantly impact their tradable prices in the short to medium term if such sentiment has reached an “overcrowded” positioning situation. Too much bearish sentiment can lead to an upside reversal in the prices of the financial asset (the opposite, contrary opinion effect) and vice versa for too extreme bullish sentiment.
These contrary opinion effects are being triggered easily due to a lack of further catalysts to support the initial “overcrowded” positioning and new related data or news flow that goes against the narrative that built up the initial sentiment.
A closer inspection of the latest sentiment of JPY futures by considering prior positioning levels with the movements of JPY/USD, the current reported net short open positions of -145,845 is coming close to a level of around -205,000 (40% away) that led the JPY to strengthen by +16% against the US dollar from 21 Oct 2022 to 16 January 2023.
Hence, the current bearish positioning of JPY in the futures market seems to be reaching “overcrowding” levels where the risk of an upside reversal (JPY strength) in the short to medium term cannot be ignored. Two likely catalysts are the reduction of the current bullish sentiment status of the US stock market and this Wednesday, 10 May release of US inflation data for April.
USD/JPY Technical Analysis – Post NFP rally has started to fizzle out
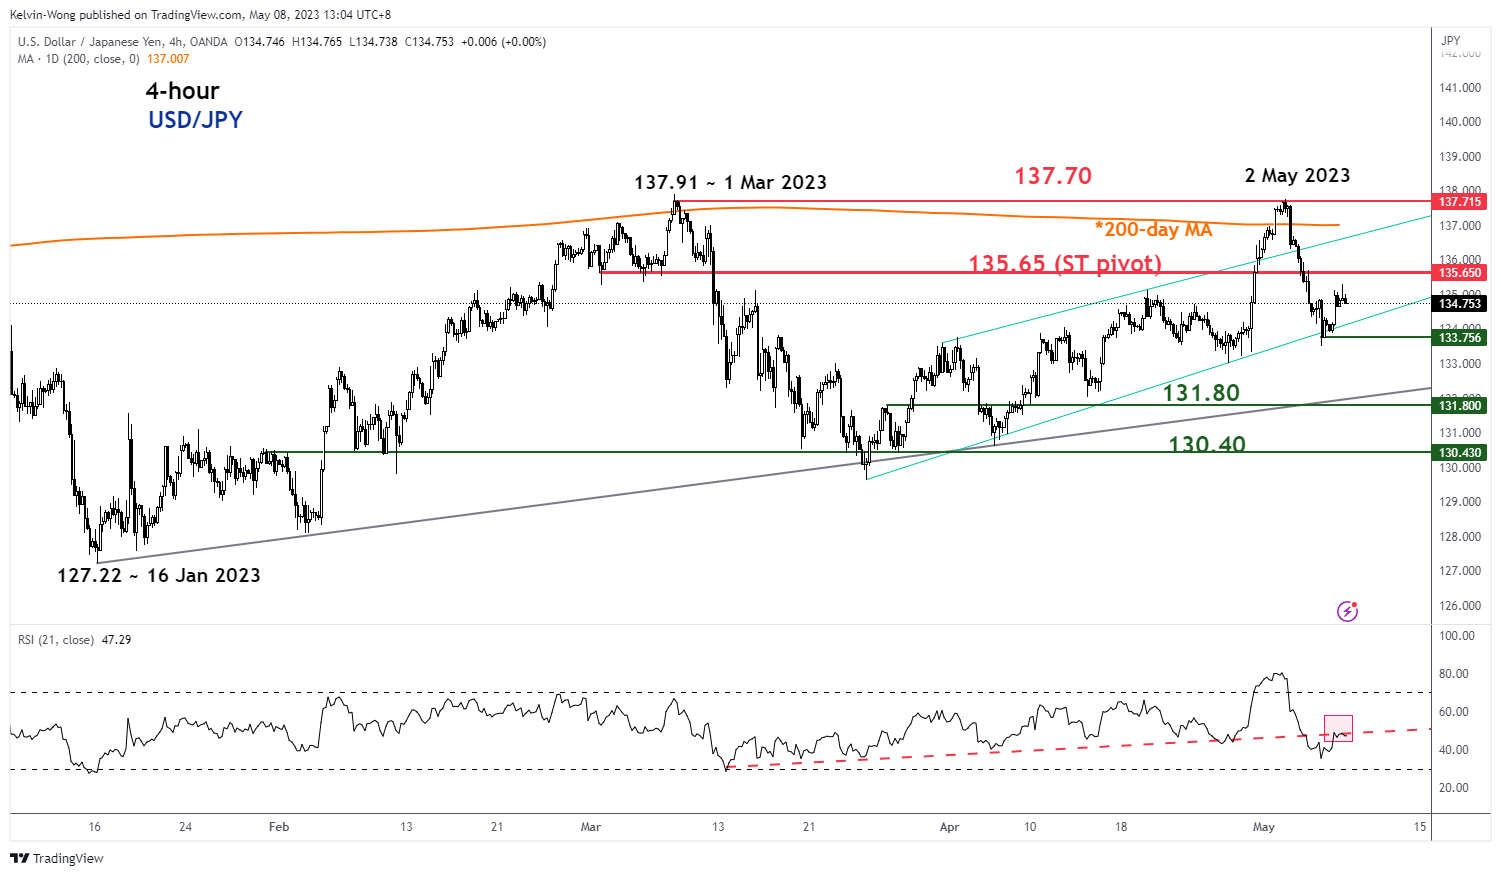
Fig 2: USD/JPY trend as of 8 May 2023 (Source: TradingView, click to enlarge chart)
Last Friday, 5 May post-US non-farm payrolls bounce seen in the USD/JPY has stalled at the 38.2% Fibonacci retracement of the prior minor decline from the 2 May 2023 high of 137.77 to 4 May 2023 low of 133.50.
Short-term upside momentum has turned lacklustre as the 4-hour RSI oscillator has failed to make a break above its corresponding resistance at around the 50% and has yet to hit its oversold region (below 30%).
A break below 133.75 intermediate support exposes the next support at 131.80 which is the lower limit of the short-term range configuration in place since 1 March 2023 swing high. On the other hand, a clearance above 135.65 jeopardizes the bearish tone to see the next resistance coming in at 137.70.
Fed Expectations All Over the Place Amid Strong Data, Bank Stress, Debt Ceiling Impasse
Friday’s US jobs data was nowhere sad. The US economy added 253K new nonfarm jobs in April, beating analyst expectations for the 13th straight month! The unemployment rate unexpectedly fell to 3.4%, a multi-decade low, and wages grew 0.5% on a monthly basis, and 4.4% on a yearly basis. Both, higher than expected.
Strong jobs data reversed expectation of a Federal Reserve (Fed) rate cut in July. The expectation that the Fed would cut rates fell from 85bp to near 79bp after the data, and we even saw a slim expectation that the Fed could hike the rates again in June, of 10%.
The US 2-year yield rebounded from last week’s lows, but stayed below the 4% mark, as the dollar index remained offered at session highs, on the unresolved US debt ceiling debate, and despite some relief on regional banks front.
US President Biden will meet some congressional leaders on Wednesday but will unlikely compromise on spending. US treasury Secretary Yellen urges Congress to lift the debt ceiling, as the government could run out of money by June 1st and that Biden taking unilateral action would provoke a constitutional crisis.
On the data front
We have two CPI reports and one more jobs data to go before the Fed’s next decision.
The next US CPI report is due this Wednesday. The expectation is that the US core inflation may have eased from 5.6% to 5.5% in April, headline figure may have steadied around 5% but the monthly headline figure may have ticked from 0.1% to 0.4% due to the jump in energy prices after OPEC cut production. Any upside surprise in inflation figures would bring the Fed hawks back to the market and help scale back the Fed cut expectations.
In the FX
The US dollar remains under a decent selling pressure. The debt ceiling and the ongoing stress in US regional banks help keep the Fed doves in charge of the market despite economic data calling for a tight hand from the Fed.
As a result, the EURUSD – which dropped below the 1.10 mark after the strong US jobs data, quickly rebounded and remains bid above the 1.10 mark in Asia this morning. Sentiment remains upbeat for the euro bulls although there is a solid resistance into the 1.11 mark.
Cable tests the ceiling of a long-term down-trending channel, as economists and markets can’t agree on what the Bank of England (BoE) should do, or what it WILL do.
Economists bet for one more rate hike from the BoE and pause, whereas the interest rate markets price in a 25bp hike this Thursday, followed by one, and possibly two more rate hikes until September – which would push the British policy rate to the 5% psychological mark.
Given how scary UK inflation looks, the BoE should continue hiking the rates. Even though BoE Governor Bailey thinks that price pressure will drastically cool later this year, he should consider the risk that… they might not.
As such, expectations between the BoE and the Fed are diverging in favour of the latter, and that should keep Cable on a path toward further gains.
S&P 500 had a good quarter, after all
The S&P500 closed with a 1.85% gain on Friday, as US regional banks closed a turbulent week with a decent rally. PacWest shares rallied more than 80%, Western Alliance jumped nearly 50% and SPDR’s regional bank index was up by more than 6% on Friday.
Zooming out, overall, 85% of the companies in the S&P 500 have reported results for Q1. According to FactSet, 79% of them revealed earnings above estimates, which also helped keep the S&P500 afloat despite the fuming regional bank stocks.
US Crude jumps, gains could remain capped into $75pb
US crude jumped nearly 4% on Friday, along with the US equities, and is bid above $71pb this morning.
We are now far below the price level when OPEC announced cutting production to boost prices.
Consequently, the OPEC boost to oil prices remained short-lived. The latter means 1. market is strongly concerned about the deteriorating growth outlook that weighs on oil demand outlook, and 2. OPEC could surprise with another production cut announcement to keep the price pressure on the upside.
In the absence of such a surprise, upside potential in US crude will likely remain capped near $75/76, region that shelters the 50 and 100-DMA.
Bank Concerns Ease Again
Market movers today
Focus this week continues on news regarding the US banking sector but inflation is also back in the spotlight with the US CPI release on Wednesday. We also have US inflation expectations from the University of Michigan on Friday, which showed a somewhat surprising rebound in April. In the Nordics CPI in Norway is up on Wednesday.
Today is a quiet day on the data front with the Euro Sentix survey for May being the main release of interest. It normally gives a good indication on other indicators such as PMI. After recovering in late 2022 it has moved broadly sideways over the past three months. We also get the Federal Reserve's survey of loan officers which will attract attention amid focus on regional bank weaknesses.
The 60 second overview
Markets: Sentiment this morning is characterised by "green" equity markets with most Asian equity indices following their US counterparts higher after a strong close to the US session on Friday. Overnight yields are close to unchanged and also commodities and FX markets have shown little volatility to start the week.
Bank jitters. Regional bank concerns have faded again with bank stocks performing sharply. Our baseline scenario is still that banking stress is a symptom of monetary tightening and that it will be fairly contained and not turn into a more systemic crisis. But it needs close monitoring as these things can sometimes become self-fulfilling and spread like dominoes falling one by one - as witnessed for example during the euro debt crisis.
US jobs: At a gain of +253K Friday's nonfarm payrolls report revealed slightly larger than expected job growth in April albeit the release also showed negative revisions of -149K for February and March. For markets, the most important thing was the higher-than-expected wage growth of +0.5 m/m which is why rates rose and the USD rallied upon announcement. The household survey showed a surprise decline in the unemployment rate from 3.5% to 3.4% while the participation rate was unchanged.
The rise in the US wage sum - the product of employment and wage gains - shows that the nominal engine behind the US economy remains on a strong footing. This leaves the Fed in a tough spot where they have to decide on either keeping rates at current contractionary levels for longer or to deliver additional rate hikes. We are leaning towards the former. Either way we still think that rates markets' pricing of around 70bp rate cuts in H2 are overdone.
Oil. Oil prices rebounded on Friday after global risk sentiment improved. OPEC+ production cuts are currently secondary to risk sentiment and demand expectations and we expect that to continue to be the case in the short-term. Further recovery in risk sentiment should help Brent recover back above the USD80/bbl. Another OPEC+ production cut and/or halt of US selling of strategic reserves would help floor prices in our view.
Debt ceiling: US Treasury Secretary Janet Yellen yesterday warned that should Congress fail to act on the debt ceiling in the coming month it would risk triggering a "constitutional crisis". Markets also show rising concern as we approach the so called x-date albeit so far the market reaction at stage primarily has been contained to the T-bill and CDS markets. A solution to the debt ceiling in the 11th hour remains our base case.
Equities: Take a solid job report and mix it with some regional bank ease, and you will end up with an equity rally. US equities surged on Friday with all indices adding around 2%. As the recession is still far from the labor market, cyclicals outperformed massively. Quality/growth stocks are still outperforming, but Friday also brought energy and financials among the leaders. The S&P 1500 regional bank index rebounded 7%. There were probably some positioning to this too, as the VIX shaved off -14% to 17. US futures are unchanged this morning.
FI: Global bond yields rose on Friday on the back of the stronger than expected US labour market data. 10Y Treasury yields rose some 5-6bp, while 10Y German government bond yields rose 7-8bp. However, we are still at a lower level than the start of the week despite the tighter monetary policy in both Europe and US. However, we are getting close to the peak in policy rates in Europe and US. Furthermore, the 10Y spread between Italy and Germany has remained fairly stable despite ECB ending APP reinvestments from July.
FX: EUR/USD moved lower on stronger than expected non-farm payrolls during Friday's session, but reversed the move later in the session ending back above 1.10. General risk-on and rally in oil lifted AUD, MXN, NOK and CAD with the latter being the top-performer in Friday's Majors session. EUR/SEK has fallen back below the 11.20 mark. Following a lower than expected April inflation print, EUR/CHF moved back above 0.98.
Credit: Credit markets were back in risk-on mode on Friday, potentially bouncing back from an overly negative reaction to the ECB meeting on Thursday. Itrax main tightened 4.1bp to close at 86.2bp, while Itrax Xover tighthened 18.7bp to close at 449.8bp. Primary markets were relatively muted.
Nordic macro
Debt Office releases the April budget balance. DO expects a SEK23.5bn surplus. That said, it might be wise to take into account that in Feb-Mar the budget balance showed a "surprise" excess surplus amounting to no less than SEK49bn, a pretty significant deviation over two months.
AUD/USD Daily Report
Daily Pivots: (S1) 0.6710; (P) 0.6733; (R1) 0.6776; More...
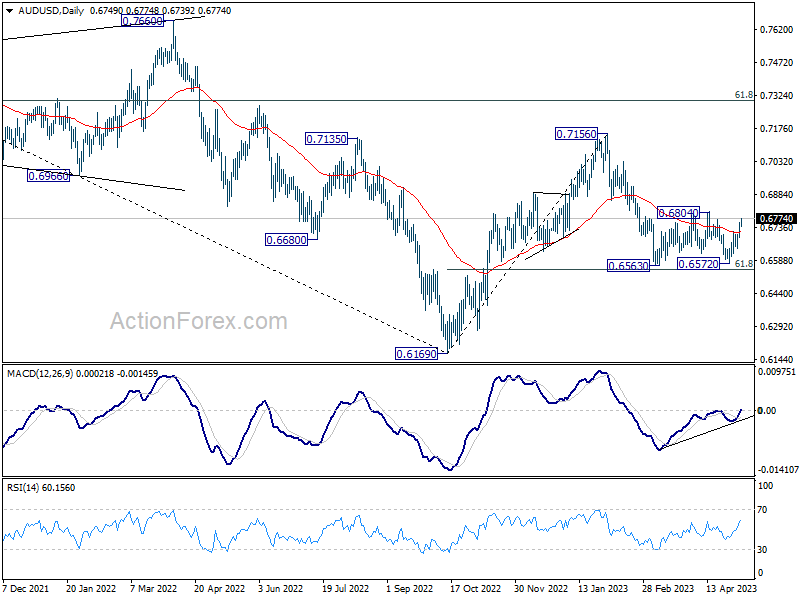
AUD/USD's rebound from 0.6572 extends higher today, but stays below 0.6804 resistance. Intraday bias remains neutral at this point. Near term outlook also stays bearish as long as 0.6804 resistance holds, and down trend resumption through 0.6563 low is in favor at a later stage. Below 0.6689 minor support will bring retest of 0.6563 low. Nevertheless, sustained break of 0.6804 should indicate completion of whole fall from 0.7156, and turn near term outlook bullish for retesting this high instead.
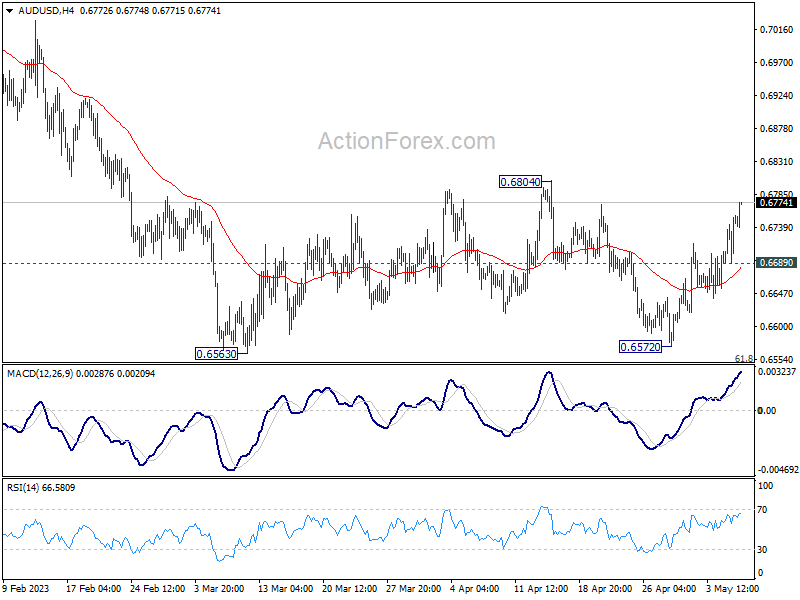
In the bigger picture, as long as 61.8% retracement of 0.6169 to 0.7156 at 0.6546 holds, the decline from 0.7156 is seen as a correction to rally from 0.6169 (2022 low) only. Another rise should still be seen through 0.7156 at a later stage. However, sustained break of 0.6546 will raise the chance of long term down trend resumption through 0.6169 low.
Dollar Declines in Asia on Upbeat Sentiment; Sterling Mixed Awaiting BoE Hike
Dollar weakened broadly during Asian session, as relatively upbeat sentiment in stock markets took hold. Despite Japan's Nikkei being down after holidays, stocks in Hong Kong and China are both making gains. Australian and New Zealand dollars emerged as the stronger performers for now, followed by Euro. Meanwhile, Canadian Dollar lagged once again, digesting some of last week's gains. British Pound is mixed, with traders awaiting BoE rate hike and guidance later in the week.
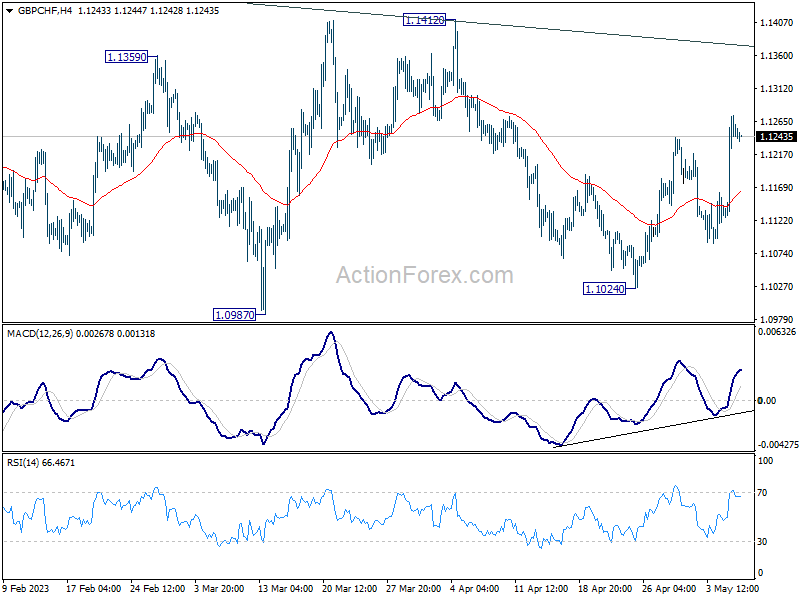
Technically, GBP/CHF made progress last week by extending its rebound from 1.1024. It remains uncertain whether this rebound is merely a part of a medium-term corrective pattern from 2022's high of 1.1574. However, as long as the 55 4H EMA now at 1.1166) holds, further gains towards 1.1412 resistance level are likely. Decisive break of 1.1412 in GBP/CHF may require some assistance from either break of 0.9878 resistance in EUR/CHF or downside acceleration in EUR/GBP towards 0.8545 support.
In Asia, at the time o writing, Nikkei is down -0.66%. Hong Kong HSI is up 0.75%. China Shanghai SSE is up 1.56%. Singapore Strait Times is down -0.15%. Japan 10-year JGB yield is down -0.0052 at 0.418.
Japan's PMI services reaches record high in April, record optimism too
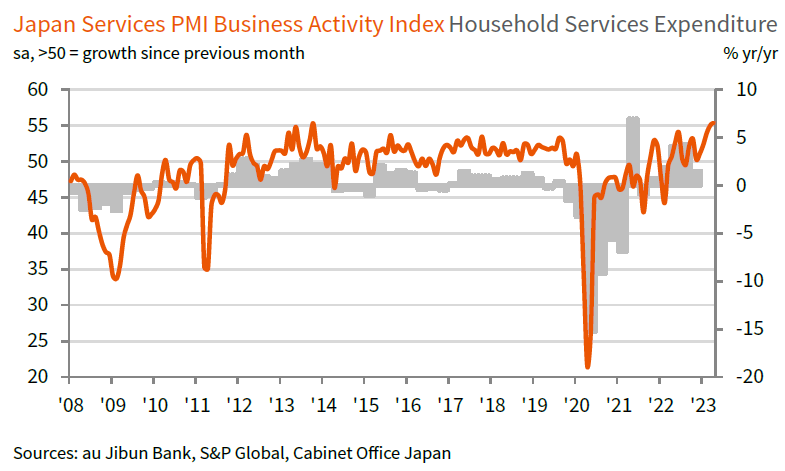
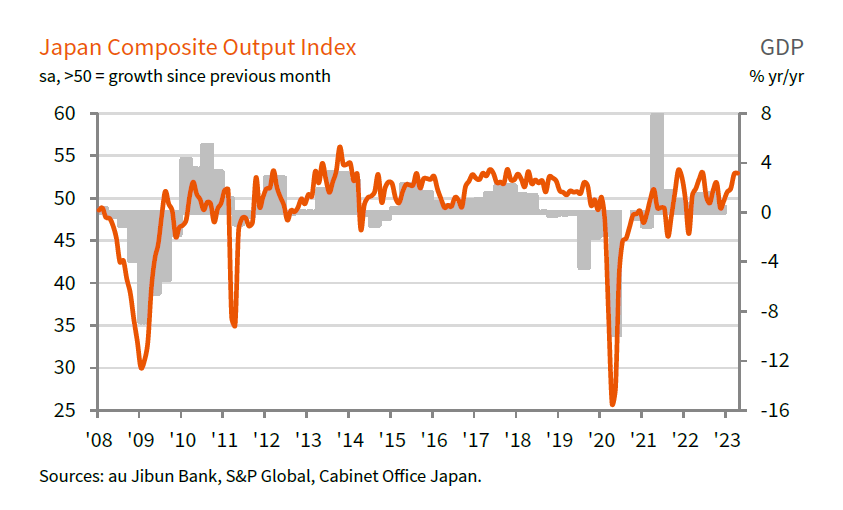
Japan PMI Services rose to 55.4 in April, up from 55.0 in March, marking the eighth consecutive month in growth territory. This represents the highest reading since records began in 2007, surpassing the previous record set in 2013. S&P Global also noted that year-ahead business expectations reached an all-time high, while prices charged increased at the steepest pace in nine years. Meanwhile, the PMI Composite remained unchanged at 52.9, as stronger services growth offset a sharper reduction in manufacturing production.
Tim Moore, Economics Director at S&P Global Market Intelligence attributed the record rise in service sector output to a rebound in demand for face-to-face consumer services, recovery in international tourist arrivals, and improvement in new business from abroad.
Moore also emphasized the high level of business confidence, with around four times as many service providers expecting an increase in activity as those forecasting a decline. This optimism marked the highest level in more than 15 years of data collection.
Furthermore, service providers increasingly passed on higher business expenses to customers to alleviate pressure on margins from rising wages and transportation costs. This resulted in the steepest increase in service sector output charges since the sales tax hike in April 2014.
BoJ minutes: Few members saw positive signs towards price target
Minutes of BoJ's meeting on March 9 and 10 show a continued commitment to monetary easing, with the aim of achieving price stability in a sustainable and stable manner, accompanied by wage increases. Nevertheless, a few members noted emerging "positive signs" toward reaching the price stability target, indicating a changing price environment.
With respect to yield curve control, some members emphasized the need to examine the effects of various implemented measures aimed at improving market functioning. They acknowledged that JGB yield curve appeared smoother than before. One member explained that if observed CPI inflation declined and market projections of interest rates calmed down, distortions in the yield curve would likely be corrected.
In terms of the 2% price stability target, several members underscored the importance of maintaining its commitment. One member added that the central bank should anchor inflation expectations to 2% by committing to achieve the target.
Meanwhile, another member expressed concern that discussing the target might lead to "unnecessary speculation" on monetary policy conduct, especially given the growing possibility of achieving the price stability target. This member also argued against revising the joint statement of the government and BoJ.
Australia NAB business confidence rose to 9, conditions down to 14
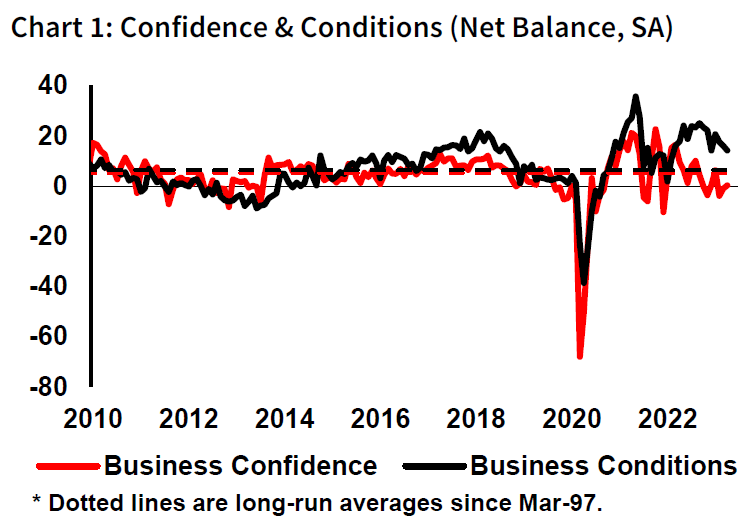
Australia NAB Business Confidence index rose from -1 to 0 in April, while Business Conditions slipped from 16 to 14. A closer look at the details reveals that trading conditions declined from 24 to 20, profitability conditions dropped from 13 to 11, and employment conditions edged up from 10 to 11.
Price and cost growth indicators were mixed, with labor cost growth holding steady at 1.9% in quarterly equivalent terms, and purchase cost growth increasing to 2.3% (up from 1.9% in March). However, overall price growth was 1.1% (down from 1.3%), and inflation in the retail sector declined to 1.4% (down from 1.7%).
NAB Chief Economist Alan Oster pointed out that business conditions, although lower, remained well above their long-run average. Confidence, although still below average, has stabilized around 0 index points in recent months. Furthermore, Oster observed some easing in price measures this month, even as cost pressures remained high. This trend may signal a gradual easing of inflation in Q2's early stages, though inflation remains elevated.
BoE to tighten again amid high inflation, US CPI could move markets
BoE is widely anticipated to continue tightening this week, as recent data revealed that CPI remained in double-digit territory at 10.1% in March, despite slowing from February's 10.4%. This figure is significantly higher than BoE's own forecast of 9.2%. A majority of market participants expect the rate to peak at 4.50% following this week's decision. However, most acknowledge that risks to BoE rates are now tilted to the upside. The new economics projections should provide insight into BoE's view on inflation and hints on the rate path.
As is customary with all BoE rate decisions, voting will be a focal point. Dovish members, including Silvana Tenreyro and Swati Dhingra, are unlikely to change their stance given their recent comments. As a result, the decision is likely to be a 7-2 vote. Any shift in the seven hawkish members would be bearish for the Pound.
In terms of data releases, US CPI will likely be the most significant market mover this week. Other noteworthy releases include US PPI and University of Michigan consumer sentiment, Eurozone Sentix investor confidence, UK GDP, Australia NAB business confidence, and New Zealand BusinessNZ manufacturing.
Here are some highlights for the week:
- Monday: BoJ Minutes; Australia building permits, NAB business confidence; Germany industrial production; Eurozone Sentix investor confidence.
- Tuesday: Japan average cash earnings, household spending; Australia Westpac consumer sentiment, retail sales; China trade balance; France trade balance; US NFIB small business index.
- Wednesday: Japan leading indicators; Germany CPI final; Italian industrial production; Canada building permits; US CPI.
- Thursday: BoJ summary of opinions, Japan bank lending, current account; China CPI, PPI; BoE rate decision; US PPI, jobless claims.
- Friday: New Zealand BusinessNZ Manufacturing index, inflation expectations; Japan M2; UK GDP, production, trade balance; US import prices, U of Michigan consumer sentiment.
AUD/USD Daily Report
Daily Pivots: (S1) 0.6710; (P) 0.6733; (R1) 0.6776; More...
AUD/USD's rebound from 0.6572 extends higher today, but stays below 0.6804 resistance. Intraday bias remains neutral at this point. Near term outlook also stays bearish as long as 0.6804 resistance holds, and down trend resumption through 0.6563 low is in favor at a later stage. Below 0.6689 minor support will bring retest of 0.6563 low. Nevertheless, sustained break of 0.6804 should indicate completion of whole fall from 0.7156, and turn near term outlook bullish for retesting this high instead.
In the bigger picture, as long as 61.8% retracement of 0.6169 to 0.7156 at 0.6546 holds, the decline from 0.7156 is seen as a correction to rally from 0.6169 (2022 low) only. Another rise should still be seen through 0.7156 at a later stage. However, sustained break of 0.6546 will raise the chance of long term down trend resumption through 0.6169 low.
Economic Indicators Update
| GMT | Ccy | Events | Actual | Forecast | Previous | Revised |
|---|---|---|---|---|---|---|
| 23:50 | JPY | BoJ Meeting Minutes | ||||
| 01:30 | AUD | NAB Business Conditions Apr | 14 | 16 | ||
| 01:30 | AUD | NAB Business Confidence Apr | 0 | -1 | ||
| 01:30 | AUD | Building Permits M/M Mar | -0.10% | 3.00% | 4.00% | |
| 06:00 | EUR | Germany Industrial Production M/M Mar | -1.60% | 2.00% | ||
| 08:30 | EUR | Eurozone Sentix Investor Confidence May | -7.9 | -8.7 | ||
| 14:00 | USD | Wholesale Inventories Mar F | 0.10% | 0.10% |
Technical Outlook and Review
DXY:
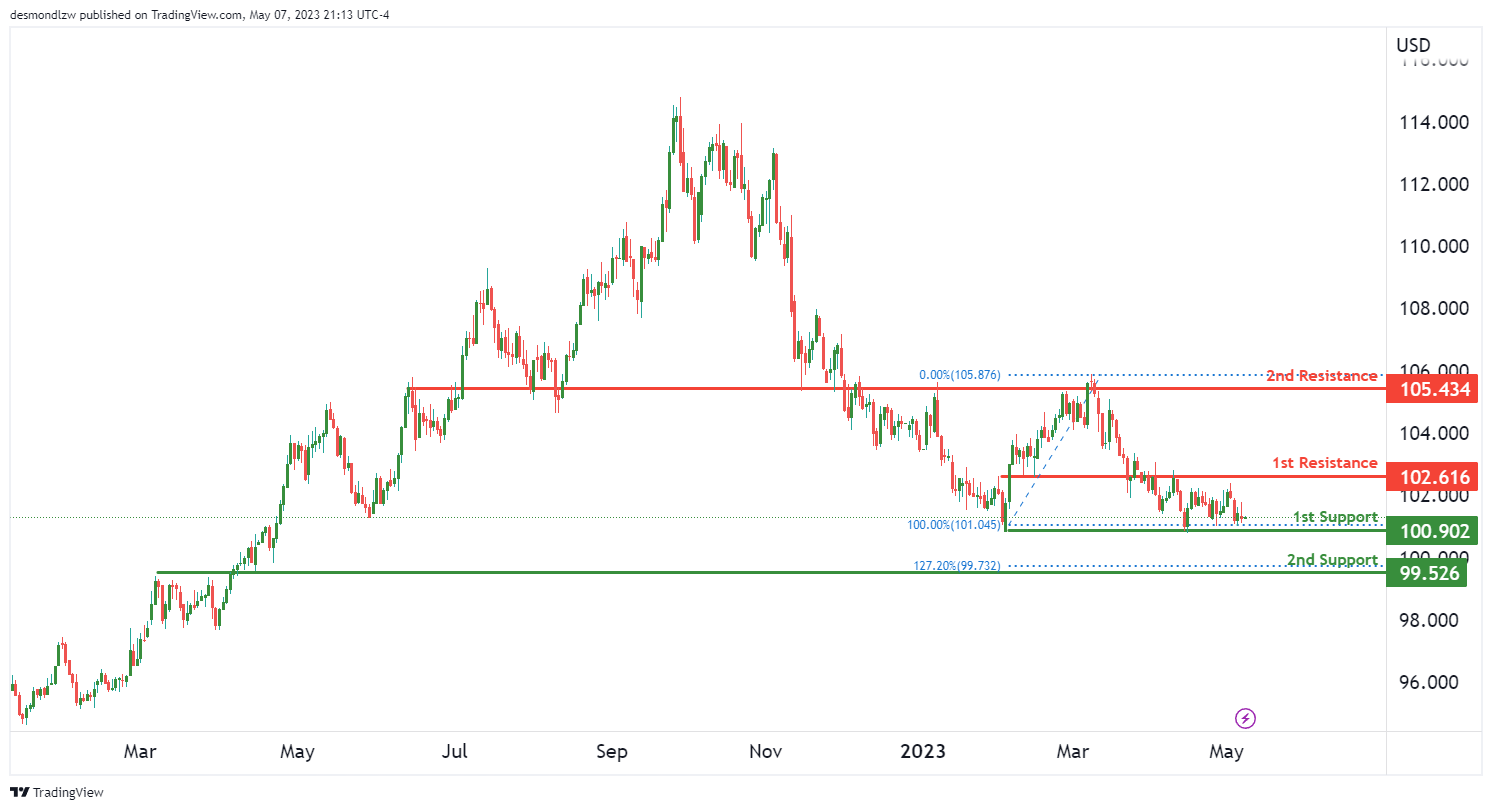
The DXY chart currently shows bullish momentum, indicating a potential for prices to rise in the short term. The price is also currently above the Ichimoku cloud, which is a bullish signal.
The first support level for the DXY chart is located at 100.90, which is a multi-swing low support level. This level is a good potential point for the price to bounce off of, as it has done in the past. If the price bounces from this level, it could head towards the first resistance level at 102.61, which is an overlap resistance level. This level has the potential to push prices even higher.
If the price breaks above the first resistance level, it could potentially rise towards the second resistance level at 105.43. This is another overlap resistance level that could provide significant bullish momentum.
However, if the price were to break below the first support level at 100.90, it could potentially drop to the second support level at 99.52. This level is also significant, as it’s an overlap support level and has a 127.20% Fibonacci extension lining up with it.
EUR/USD:
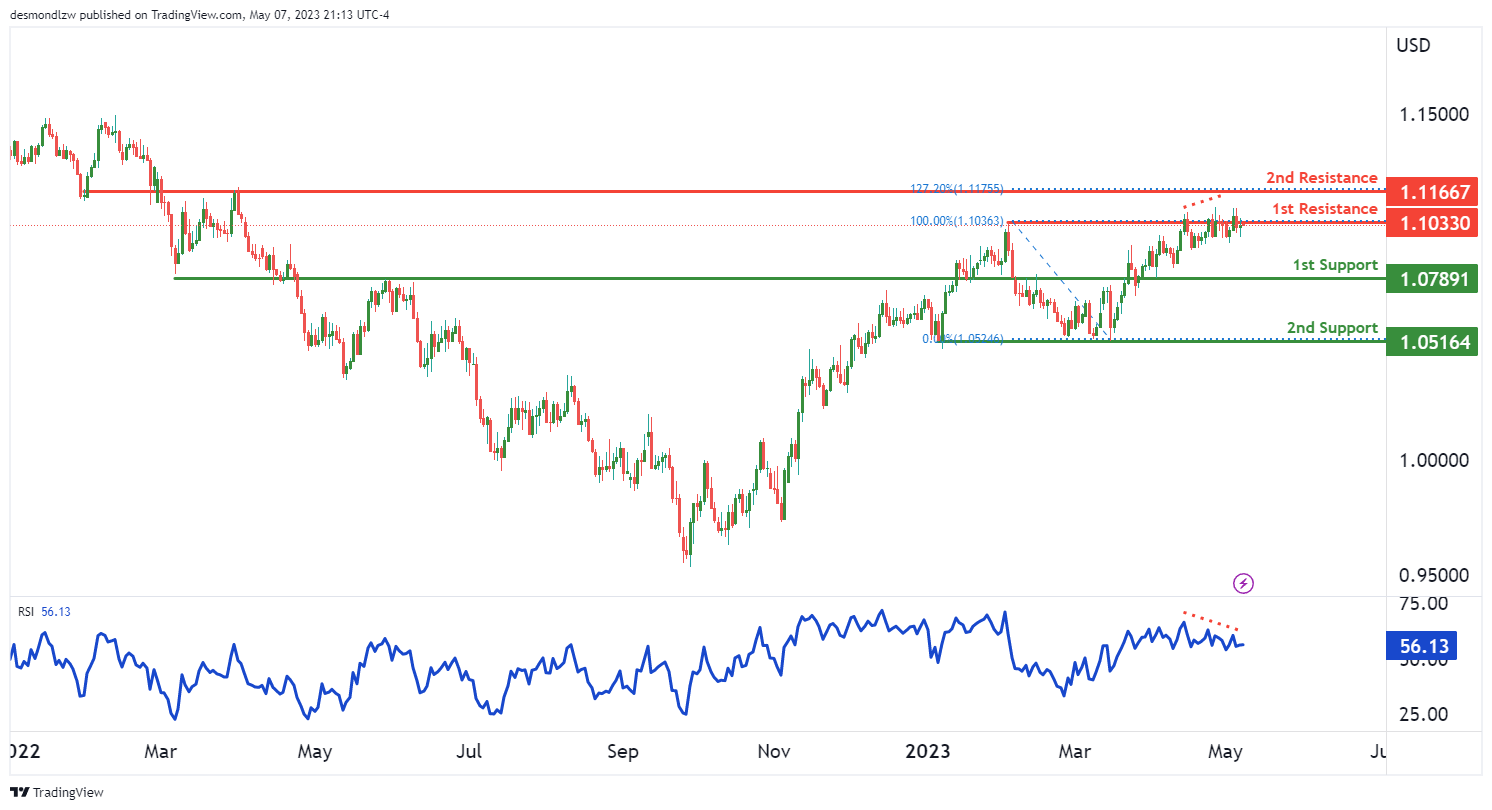
The EUR/USD chart currently shows bearish momentum, indicating a potential for prices to drop in the short term. The price is also below the Ichimoku cloud, which is a bearish signal.
The first resistance level for the EUR/USD chart is located at 1.1033, which is a multi-swing high resistance level. This level is a good potential point for the price to react off of, and potentially drop towards the first support level at 1.0789. This level is an overlap support level and has the potential to push prices even lower.
If the price breaks below the first support level, it could potentially drop to the second support level at 1.0516. This level is also significant, as it’s a multi-swing low support level.
However, if the price were to break above the first resistance level at 1.1033, it could potentially rise towards the second resistance level at 1.1166. This level is also significant, as it’s an overlap resistance level.
It’s worth noting that the RSI is displaying bearish divergence versus price, which suggests that a reversal might occur soon
GBP/USD:
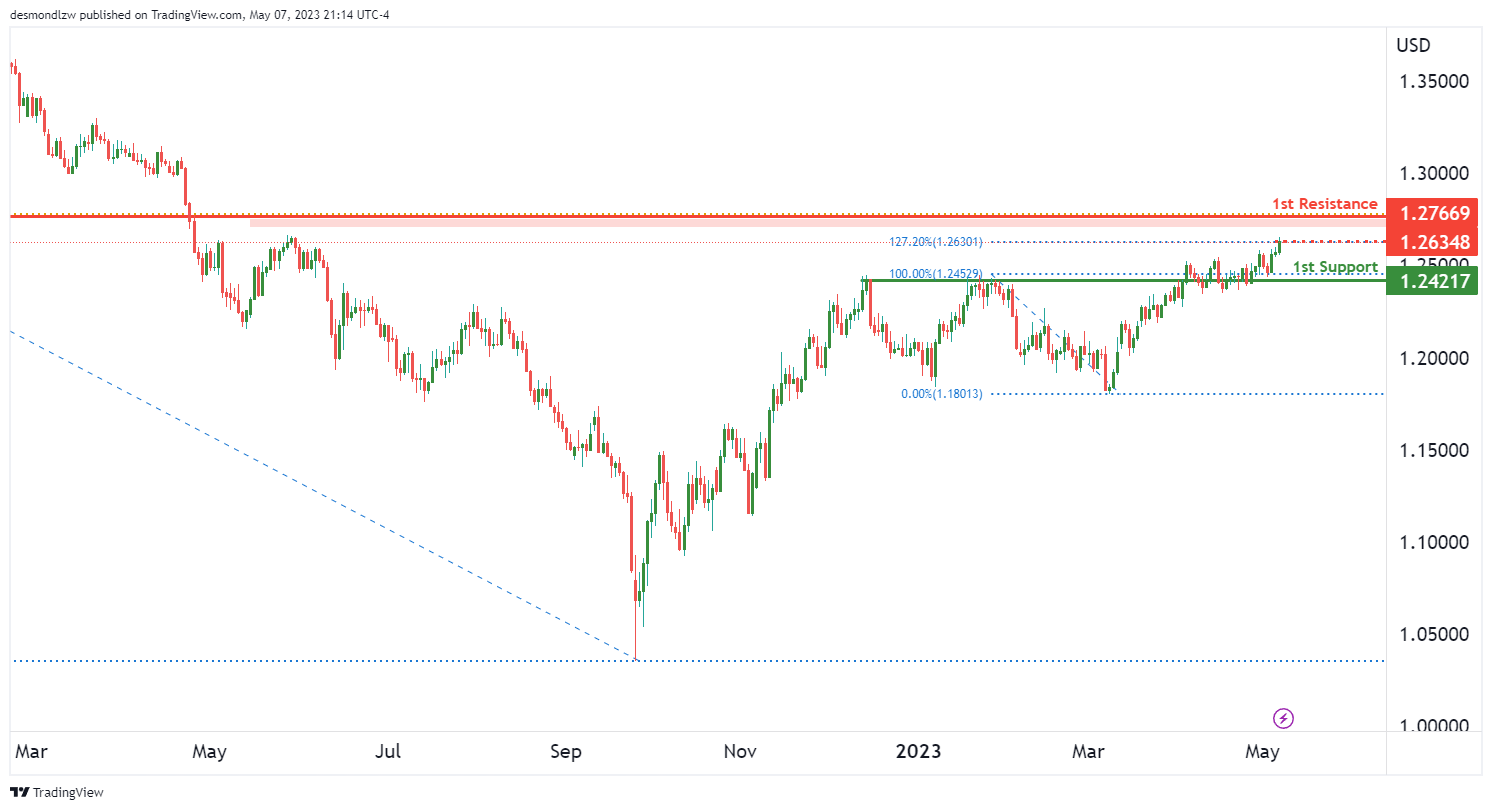
The GBP/USD chart is currently showing bearish momentum, indicating a potential for prices to drop in the long term. However, in the short term, there could be a potential rise towards the first resistance level at 1.2766.
This level is a pullback resistance and a potential point for the price to reverse off of, and potentially drop towards the first support level at 1.2421. This level is an overlap support level and has the potential to push prices even lower.
If the price breaks below the first support level, it could potentially drop even lower in the long term.
There is also an intermediate resistance level at 1.2634, which is a swing high resistance level and coincides with the 127.20% Fibonacci extension level. If the price were to break above this level, it could potentially continue to rise towards the first resistance level at 1.2766.
However, the overall momentum of the chart is still bearish, indicating that any rise towards the first resistance level should be seen as a potential opportunity to sell and take advantage of the long-term bearish trend.
USD/CHF:
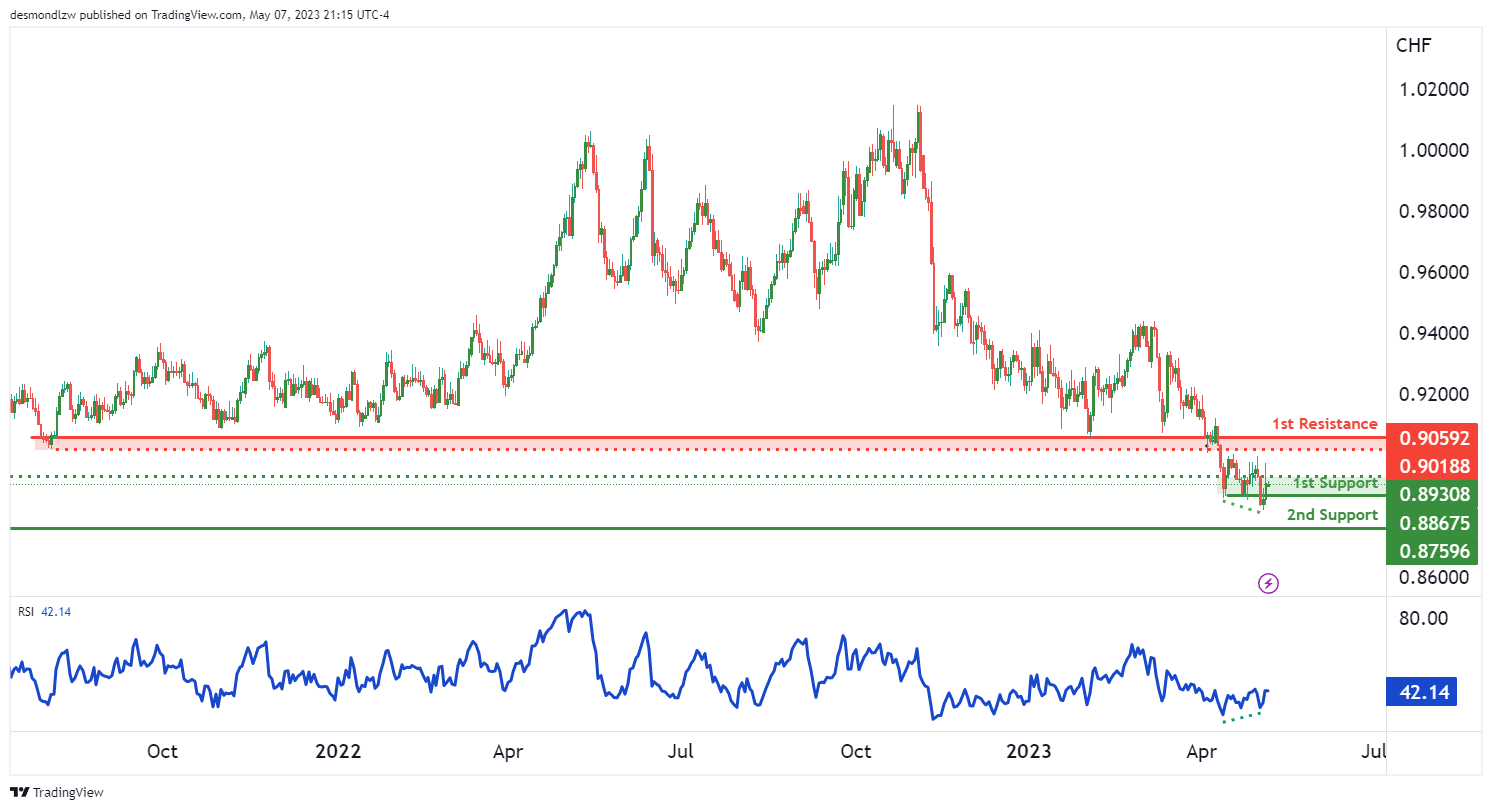
The overall momentum of the USD/CHF chart is bullish. The first support level is at 0.8867, which is a multi-swing low support level. This is a good level for buyers to step in and push the price higher. The second support level is at 0.8759, which is a swing low support level. This level also provides a good buying opportunity.
The first resistance level is at 0.9059, which is an overlap resistance level. This level may provide some resistance to the price, but if it can break above this level, it could potentially rise towards the intermediate resistance level at 0.9018. This level is also an overlap resistance level and coincides with a 127.2% Fibonacci extension.
On the downside, there is an intermediate support level at 0.8930 which could provide a cushion for the price if it drops. If the price breaks below this level, it could drop towards the first support level at 0.8867.
It’s worth noting that the RSI is displaying bullish divergence versus price, which suggests that there could be a rapid incline in price. This provides additional evidence that the overall momentum of the chart is bullish.
USD/JPY:
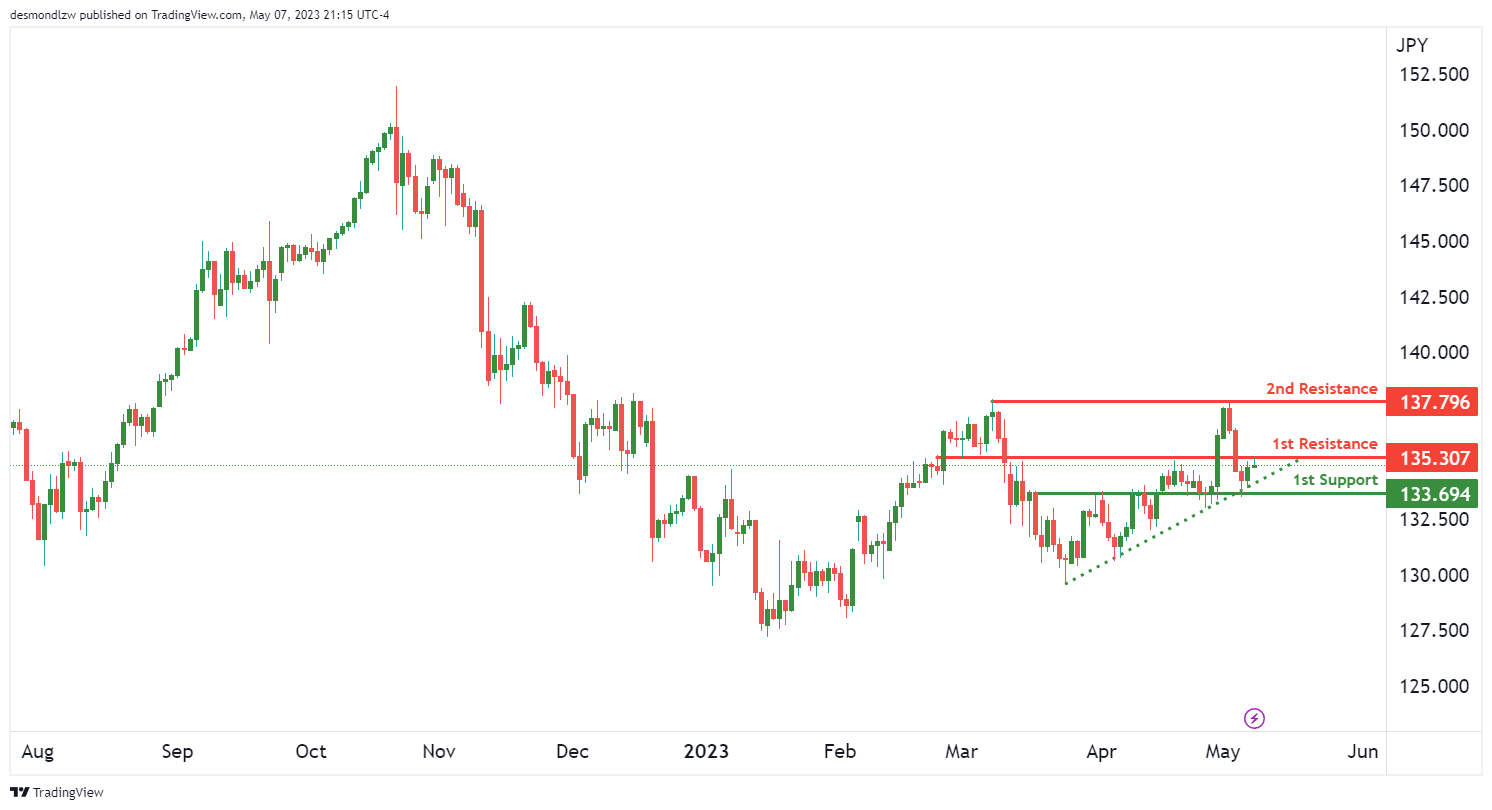
USD/JPY is currently experiencing a strong bullish momentum, as indicated by the fact that price is above a major ascending trend line. This suggests that there could be further upward momentum in the near future.
The first support level for USD/JPY is at 133.69, which is an overlap support. Additionally, the price is testing a major support level which has a 38.2% Fibonacci retracement lining up with it. If price bounces off this level, it could rise towards the first resistance level at 135.30, which is a pullback resistance that also coincides with a descending trend line.
There is an intermediate resistance at 136.04, which is between where the price is currently and our first resistance. If price were to break this intermediate resistance, it could trigger a stronger bullish acceleration towards our first resistance.
If it breaks the first resistance level, it could potentially rise towards the second resistance at 137.79, which is a multi-swing high resistance.
AUD/USD:
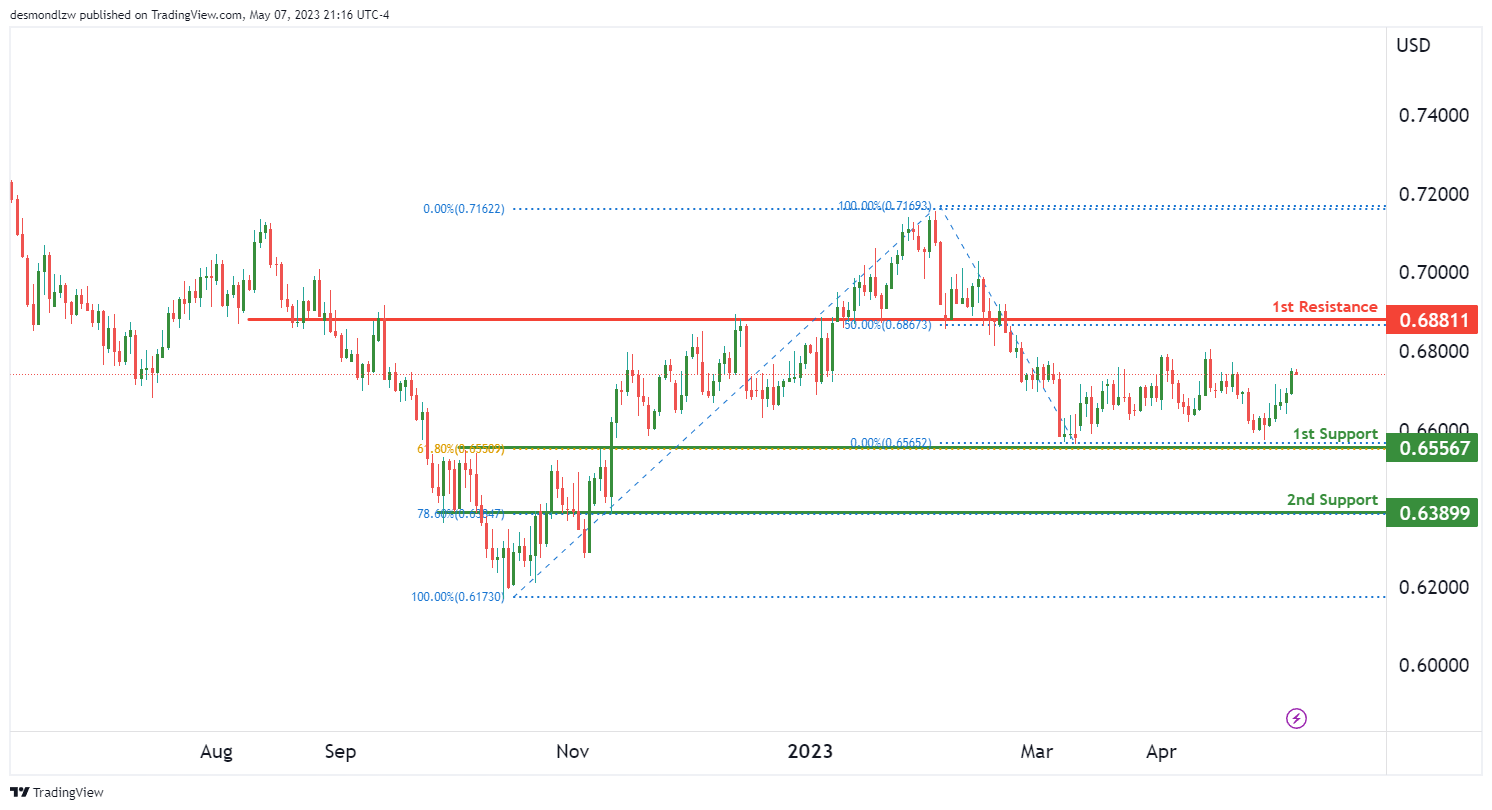
The AUD/USD chart is showing strong bullish momentum and is potentially heading towards the first resistance level. The first support at 0.6556 is a good level as it is an overlap support and coincides with a 61.80% Fibonacci retracement. Another support level to keep an eye on is the 0.6389 level, which is also an overlap support and lines up with a 78.60% Fibonacci retracement.
On the other hand, the first resistance at 0.6881 is a level to watch as it is a pullback resistance and coincides with a 50% Fibonacci retracement. If price manages to break through this resistance, it could potentially continue towards higher levels.
Overall, the chart is showing bullish momentum and a potential for a continuation towards the first resistance level. However, it’s important to keep an eye on the support levels as a break below these levels could indicate a shift in momentum towards the downside.
NZD/USD:
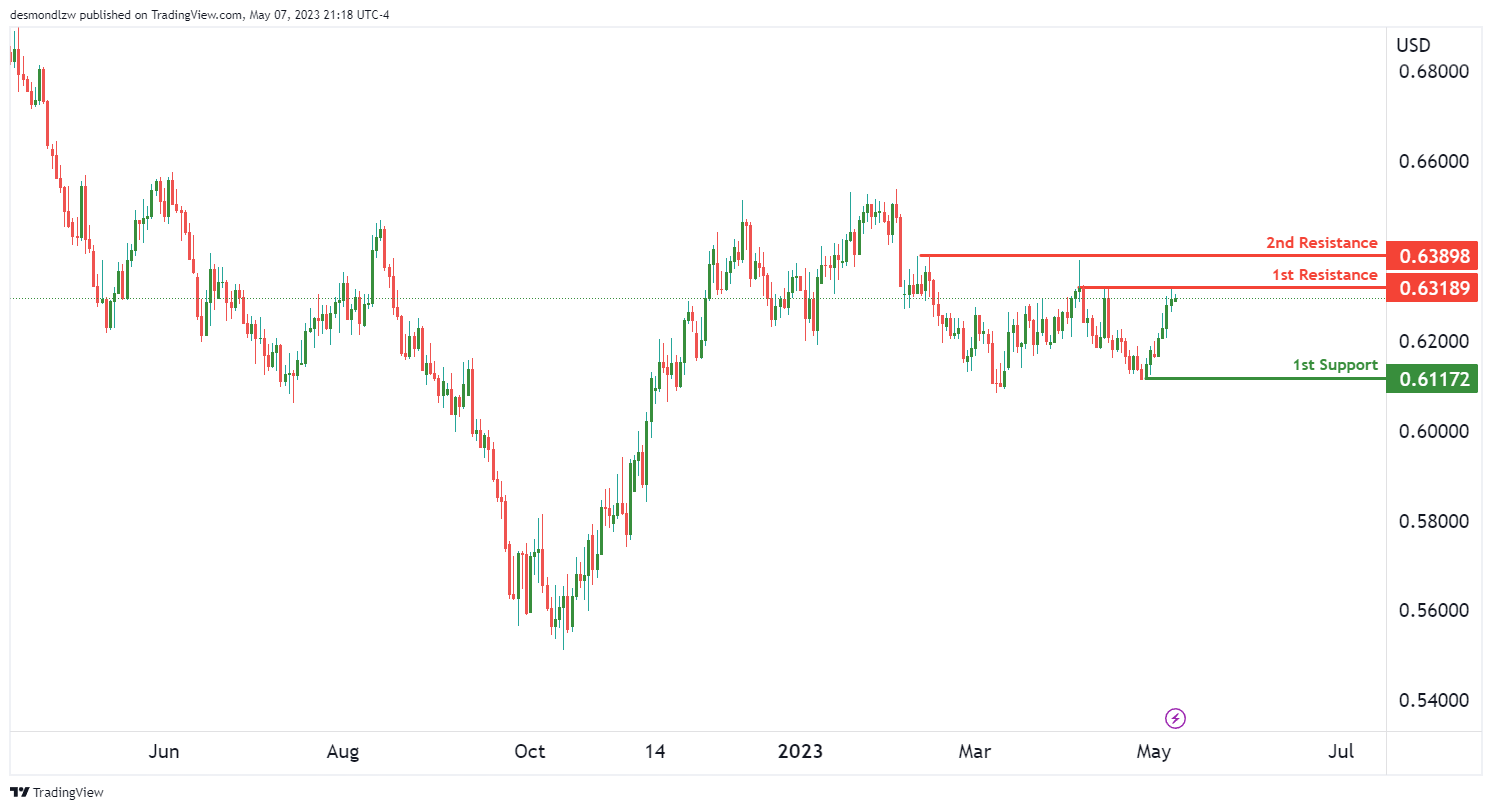
The NZD/USD chart is currently displaying bearish momentum, with the potential for a drop in the near future. The overall bias of the chart is bearish, indicating that prices may fall in the short term.
The price could potentially make a bearish reaction off the 1st resistance and drop to the 1st support. The 1st support level is at 0.6117, which is a swing low support. If the price were to drop further, it may hit our 2nd support level at 0.0000, which is also a swing low support level.
On the other hand, the 1st resistance level is at 0.6318, which is a multi-swing high resistance level. If the price were to break this resistance, it may rise to our 2nd resistance level at 0.6389, which is also a multi-swing high resistance level.
It’s important to note that RSI is not providing any bullish or bearish signals at the moment. However, the bearish momentum on the chart is indicating that the price may drop in the near future.
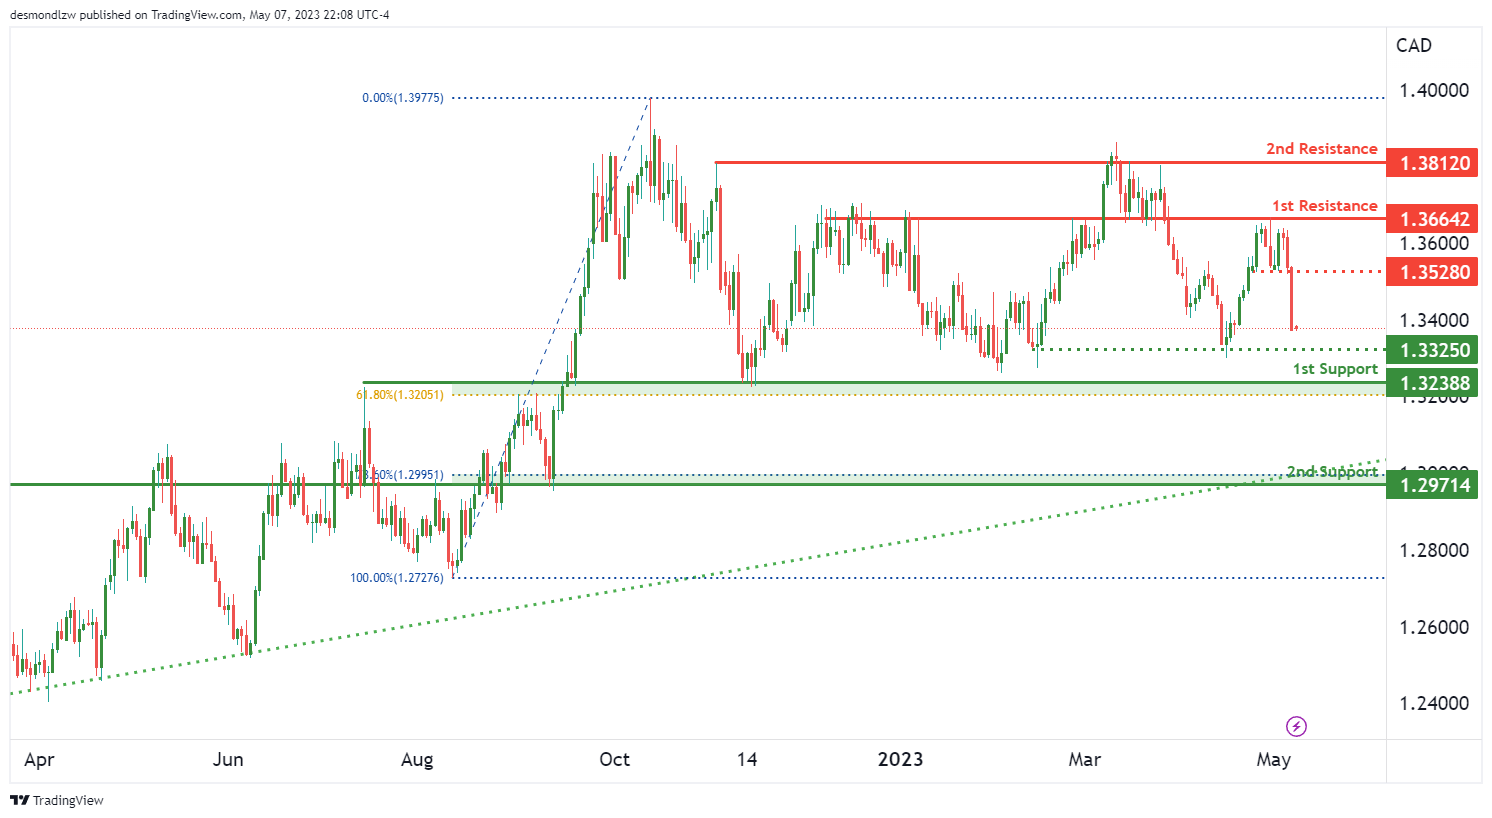
USD/CAD:
The USD/CAD chart has an overall bearish momentum. The potential price movement is a continuation of the bearish trend towards the first support level at 1.3239. This support level is significant as it is an overlap support and is also aligned with a 61.80% Fibonacci retracement level.
If the price continues to drop, it may reach the second support level at 1.2971, which is also an overlap support level and coincides with a 78.60% Fibonacci retracement level.
On the other hand, the first resistance level is at 1.3664, which is a significant overlap resistance level. The second resistance level is at 1.3812, which is also an overlap resistance level.
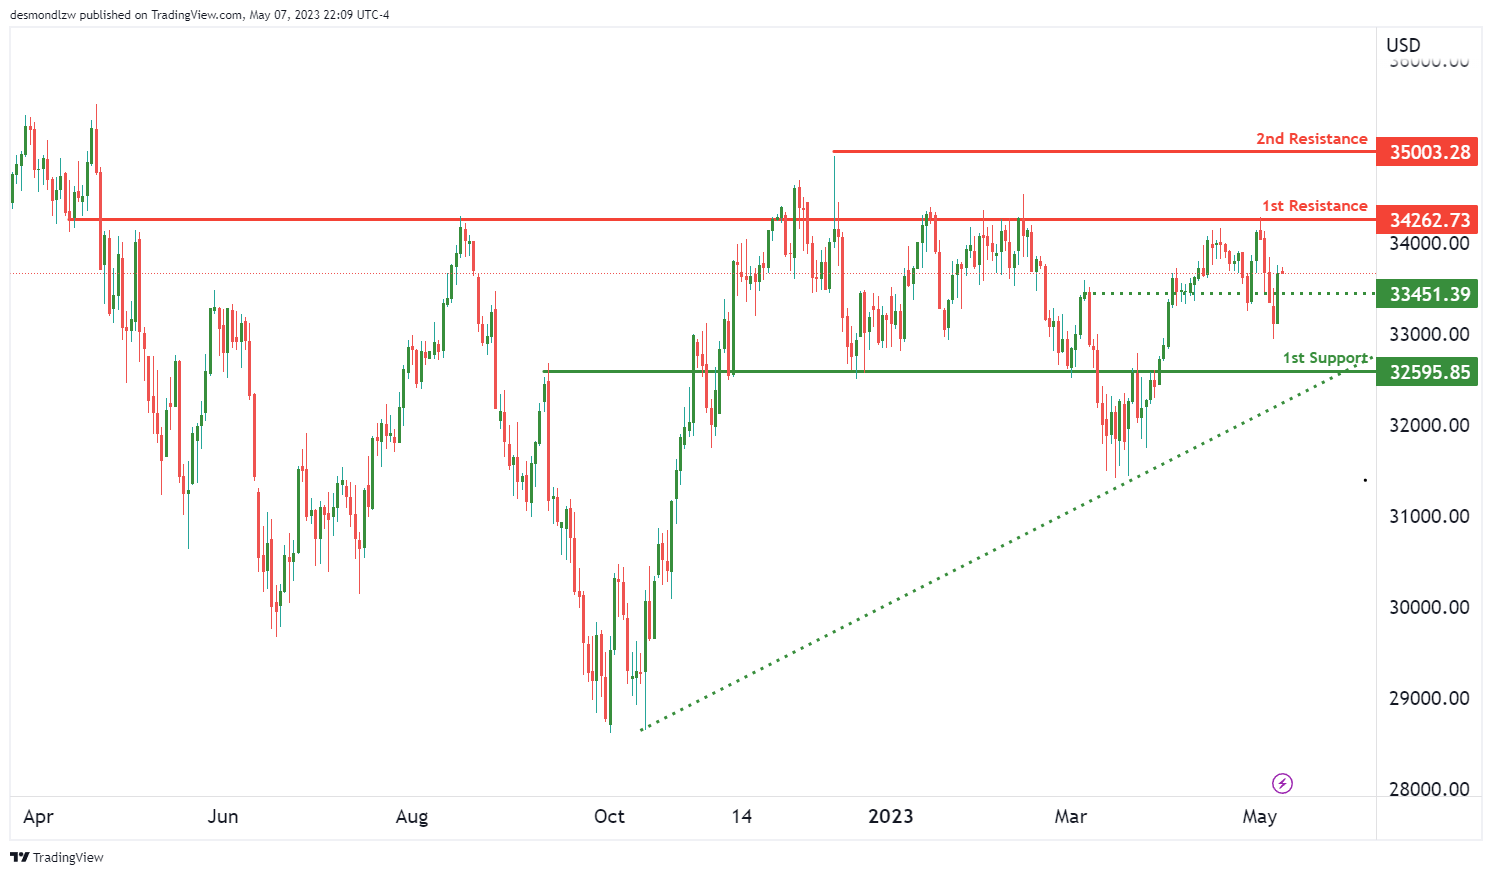
DJ30:
The DJ30 chart currently has a bearish momentum. If the trend continues, the price could potentially make a bearish continuation towards the first support.
The intermediate support level is at 33,451.39 and is an overlap support. If the price breaks through this level, it could potentially drop further towards the first support at 32,595.85, which is also an overlap support.
On the other hand, if the price manages to break through the resistance levels, it could potentially turn bullish. The first resistance level is at 34,262.73 and is an overlap resistance. The second resistance level is at 3,5003.28 and is also an overlap resistance.
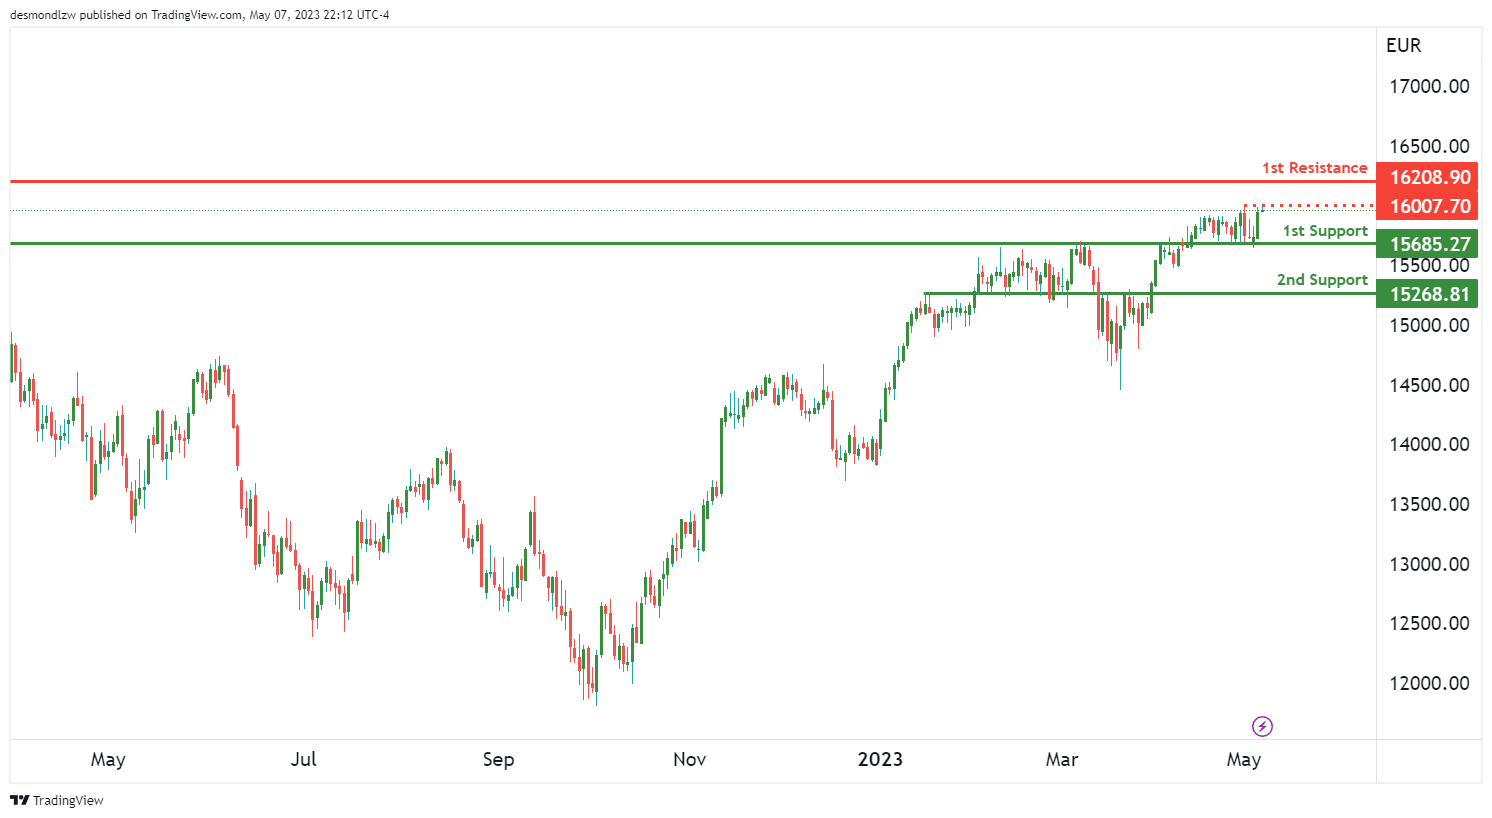
GER30:
The GER30 chart is currently showing a bullish momentum, with potential for price to continue rising towards the 1st resistance level. There are several key support and resistance levels to watch out for.
The 1st support level is at 15,685.27, which is a strong overlap support level. If price were to drop to this level, it could potentially bounce back up towards the intermediate resistance level at 16,007.70.
The 2nd support level is at 15,268.81, another overlap support level. This level could provide further support if price were to drop below the 1st support level.
On the other hand, the 1st resistance level at 16,208.90 is a strong overlap resistance level. If price were to break through the intermediate resistance level at 16,007.70, it could potentially rise towards the 1st resistance level.
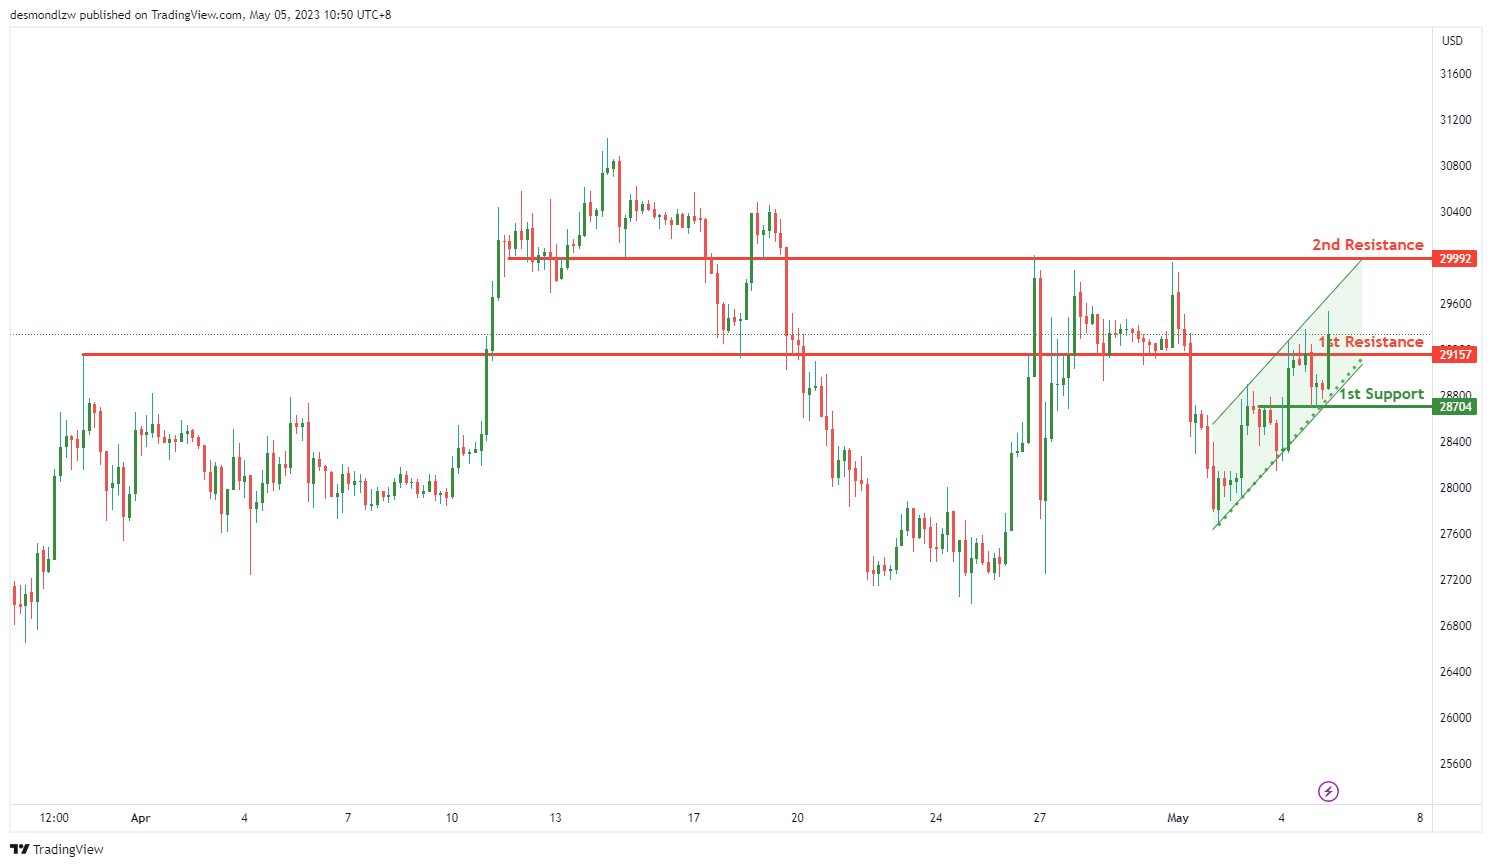
BTC/USD:
BTC/USD is currently seeing strong bullish momentum, as indicated by its position in a bullish ascending channel. The overall momentum of the chart is bullish, and this is reinforced by the fact that price is within a bullish ascending channel, which suggests that price might continue to rise due to its bullish momentum.
Price could potentially make a bullish break through the 1st resistance at 29157 and rise to the 2nd resistance at 29992. This is a significant level for the price of BTC/USD, as it marks an overlap resistance that has the potential to trigger a strong bullish acceleration towards the 2nd resistance level.
In terms of support, the 1st support level is at 28704, and it is an overlap support. This level is important because it can act as a base for the price to bounce off of and potentially continue its bullish trend.
US500
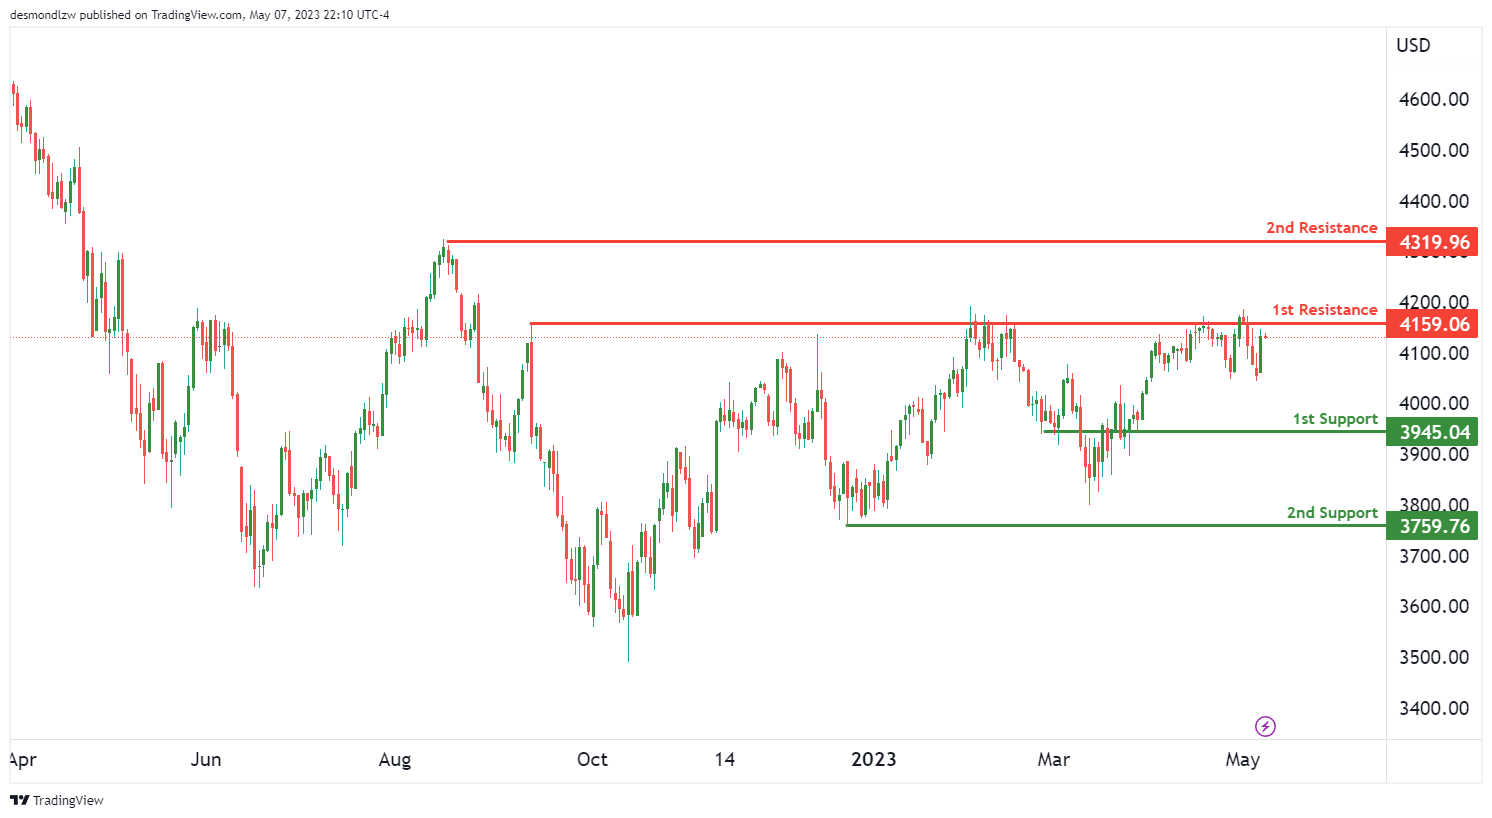
The overall momentum of the US500 chart is bullish with low confidence. However, there is a potential for a bullish break through of the 1st resistance, which could lead to a rise towards the 2nd resistance.
The 1st support level is at 3,945.04, which is an overlap support level. The 2nd support level is at 3,759.76, which is also an overlap support level.
On the resistance side, the 1st resistance level is at 4,159.06, which is an overlap resistance level. The 2nd resistance level is at 4,319.96, which is also an overlap resistance level. If price does not break through the 1st resistance, it could potentially fall towards the 1st support level.
ETH/USD:
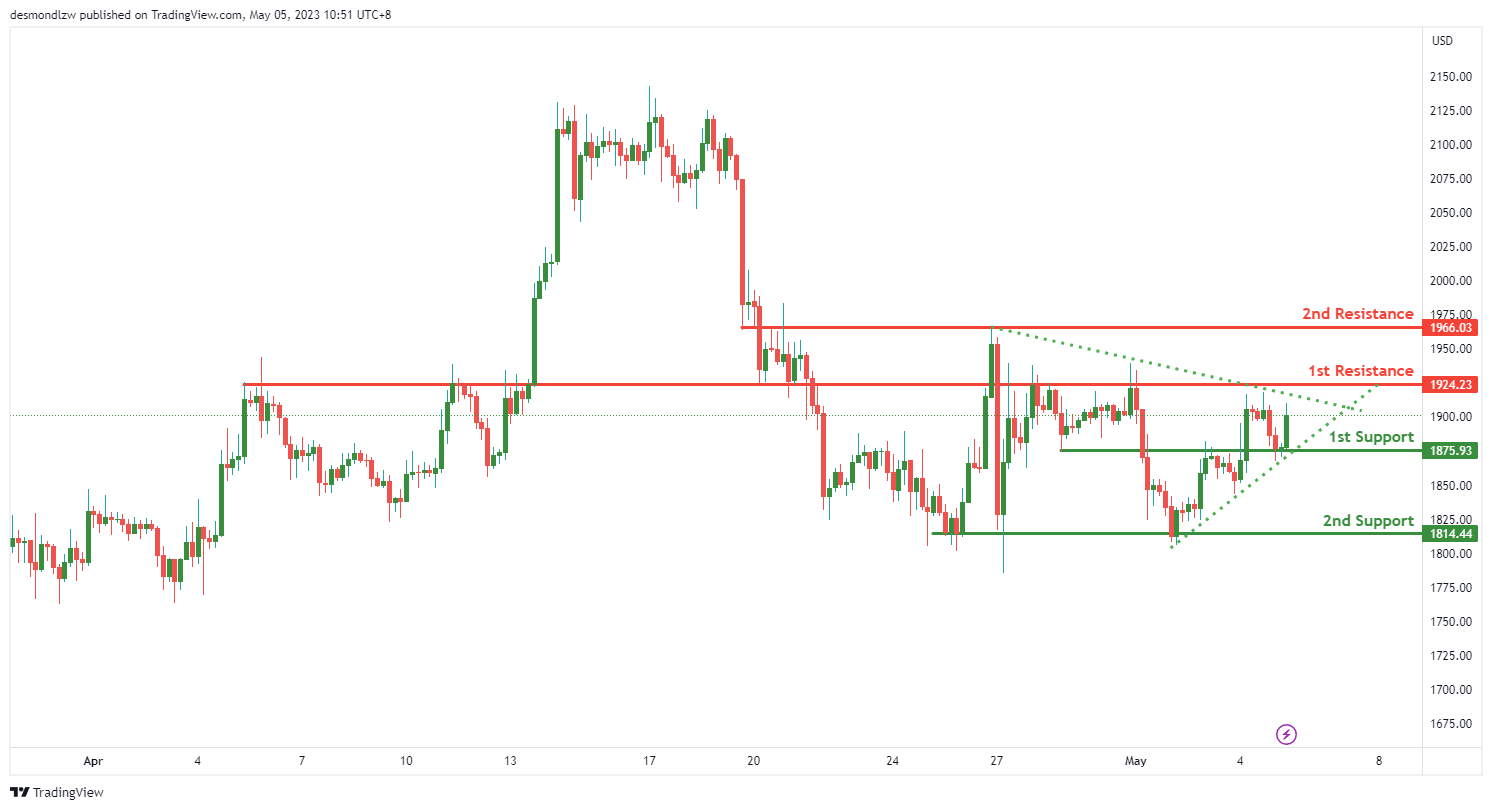
The ETH/USD chart is currently exhibiting a bullish momentum, which suggests that the price might continue to rise due to its bullish momentum. The overall momentum of the chart is bullish, and the price could potentially make a bullish continuation towards the 1st resistance level.
The 1st support level is at 1875.93, which is an overlap support level. This means that this level has been tested several times in the past and has held as a support level, which makes it a strong level to watch out for. The 2nd support level is at 1814.44, which is a multi-swing low support level.
The 1st resistance level is at 1924.23, which is an overlap resistance level. This level has been tested several times in the past and has acted as a strong resistance level. The 2nd resistance level is at 1966.03, which is also an overlap resistance level.
Additionally, there is a symmetrical triangle chart pattern on the chart, which represents a period of consolidation before the price is forced to breakout or breakdown. This suggests that there might be a potential breakout in the near future, which could lead to a bullish continuation in price.
WTI/USD:
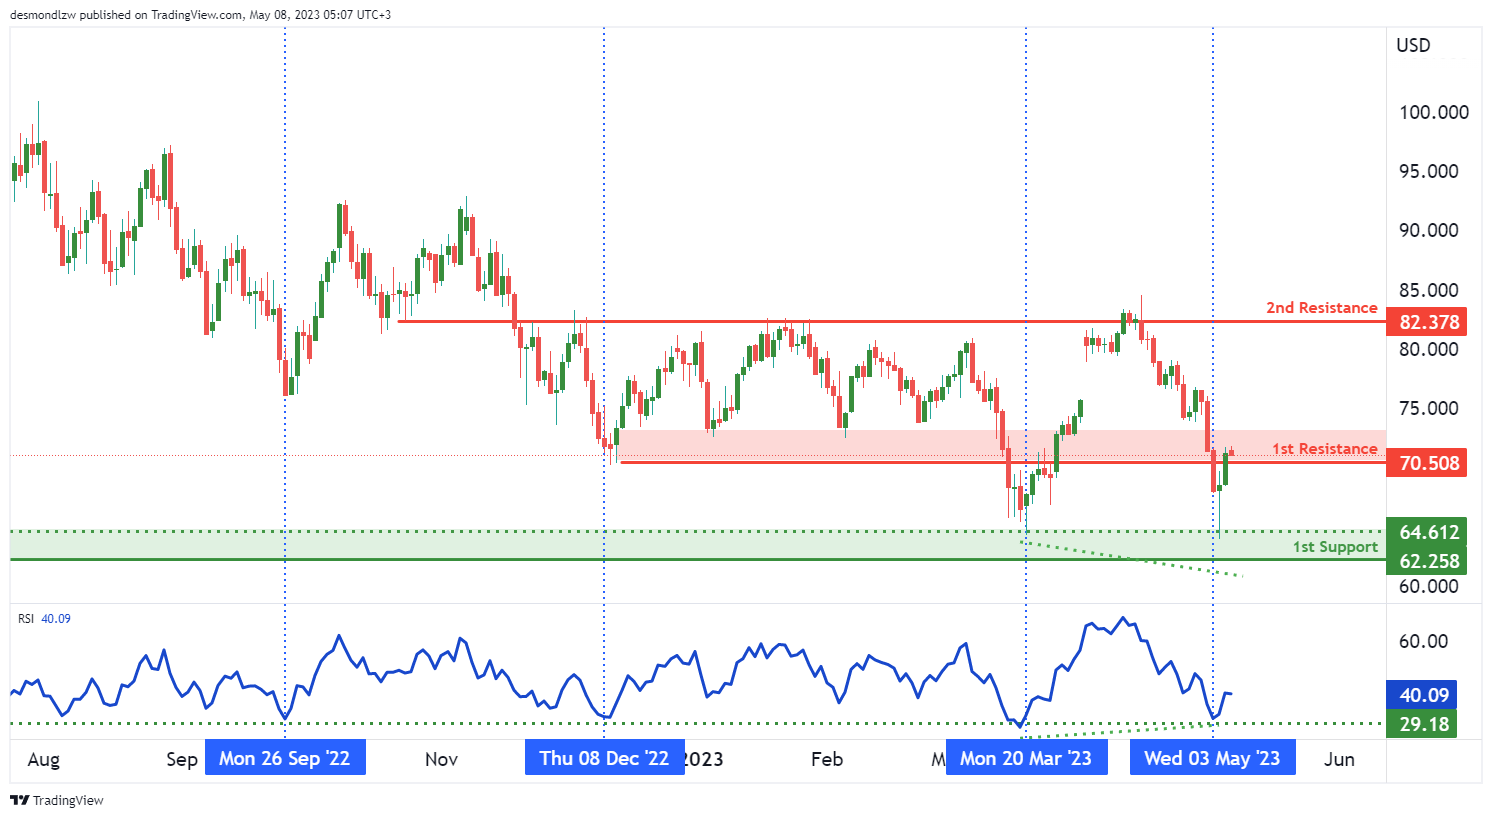
The overall momentum of WTI appears weak bullish with low confidence. However, price has broken through the 1st resistance level at 70.51 and could potentially rise towards the 2nd resistance level at 82.38. In terms of support levels, the intermediate support level is at 64.61 and the 1st support level is at 62.26.
One reason why the 1st resistance level is good is because it is an overlap resistance, meaning that it has been a significant level of price resistance in the past. If price can stay above this level, WTI could make a run towards the 2nd resistance level.
Similarly, the intermediate and 1st support levels are also good as they are both overlap supports, indicating that they have previously provided strong support for the price.
In addition, the RSI is displaying bullish divergence versus price, suggesting that a rapid incline in price may occur.
XAU/USD (GOLD):
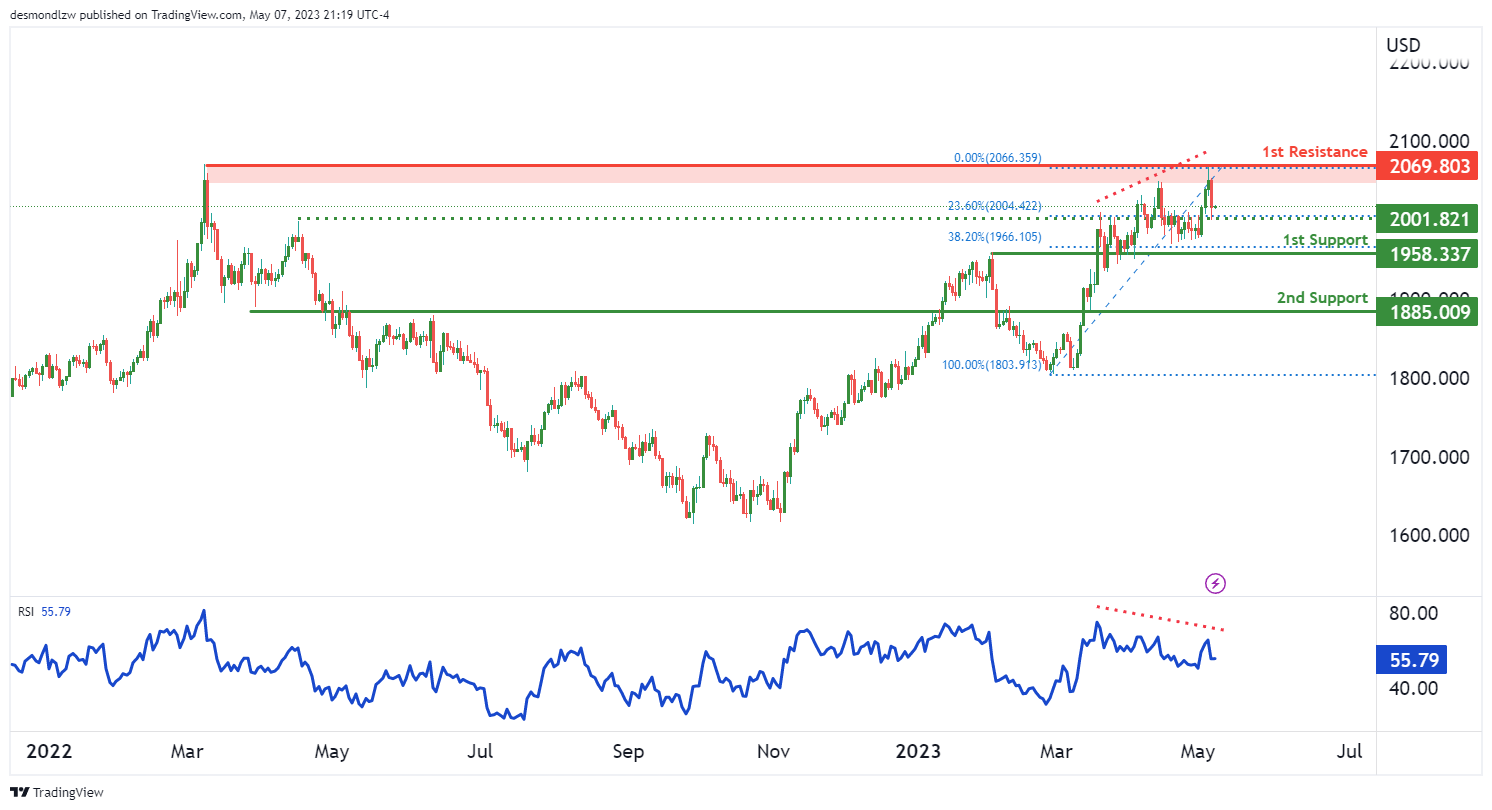
old has been on a bearish trend in recent times, and the XAU/USD chart shows that this momentum is likely to continue in the short term. The overall momentum of the chart is bearish, indicating that prices are more likely to fall than rise. In fact, price could potentially make a bearish continuation towards the 1st support.
The 1st support is at 1958.33, and it is a strong overlap support that coincides with a 38.20% Fibonacci retracement. If the price were to break below this support level, it could drop to the 2nd support at 1885.00, which is also an overlap support.
On the other hand, the 1st resistance is at 2069.80, and it is a multi-swing high resistance level. If the price were to break above this resistance level, it could potentially rise towards the next resistance level at 2183.00.
However, the RSI indicator is also displaying bearish divergence versus price, which suggests that a reversal might occur soon. This reinforces the likelihood of a bearish continuation towards the 1st support.
It’s worth noting that there is an intermediate support level at 2001.82, which is also an overlap support and coincides with a 23.60% Fibonacci retracement. This level could provide a temporary bounce if the price were to drop towards the 1st support.
EUR/USD Faces Significant Resistance, Dollar Weakens Further
Key Highlights
- EUR/USD is facing strong resistance near 1.1090.
- A key bullish trend line is forming with support at 1.0975 on the 4-hour chart.
- GBP/USD climbed further above the 1.2620 resistance.
- Gold price corrected gains and traded below $2,030.
EUR/USD Technical Analysis
The Euro made another attempt to clear 1.1090 against the US Dollar. However, EUR/USD failed to gain strength and corrected gains from the 1.1091 high.
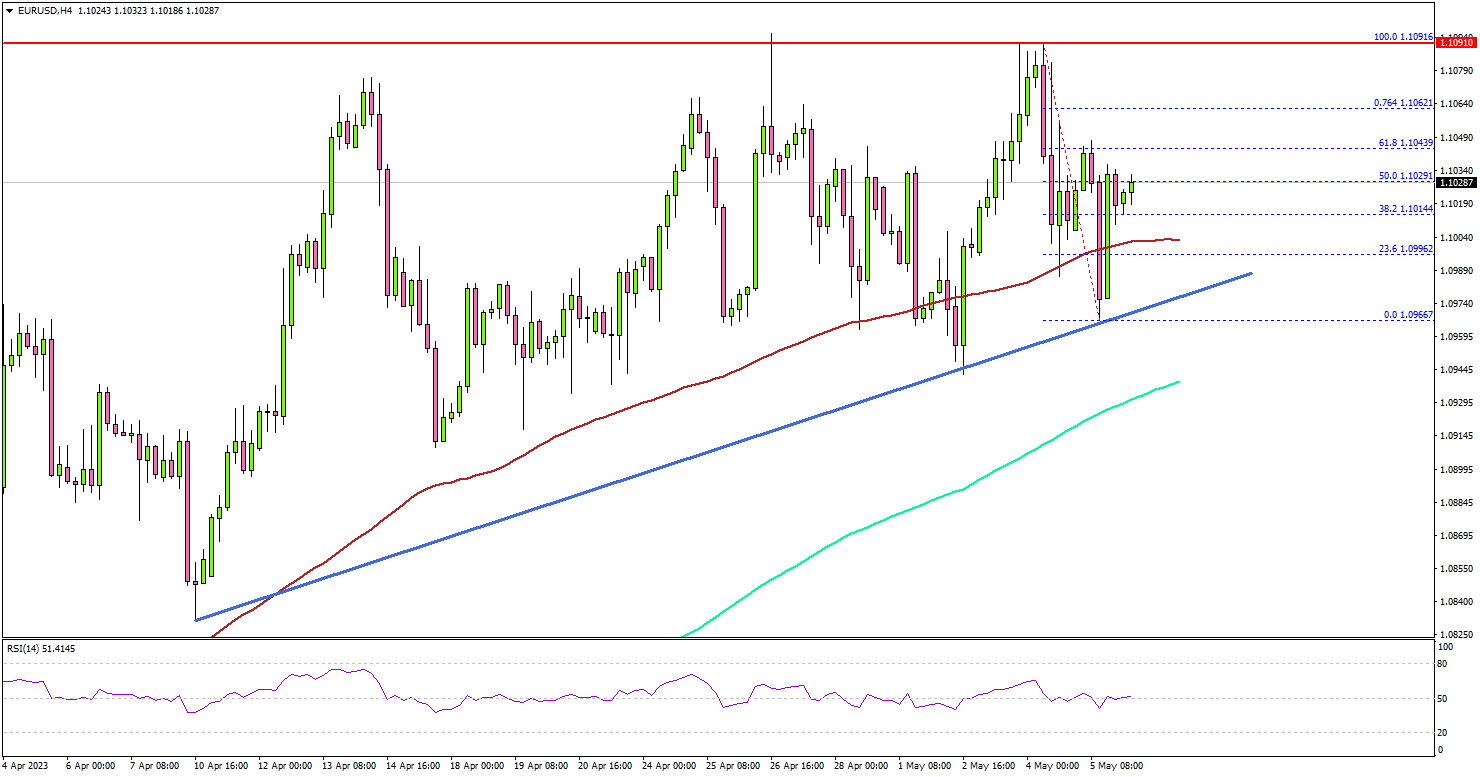
Looking at the 4-hour chart, the pair started a downside correction below the 1.1020 support. It even spiked below the 1.1000 level and the 100 simple moving average (red, 4 hours).
A low is formed near 1.0966 and the pair is now stuck in a broad range. There is also a key bullish trend line forming with support at 1.0975 on the same chart. Immediate resistance on the upside is near the 1.1050 level.
The next key resistance is near the 1.1090 level. A clear upside break and close above the 1.1090 resistance might start a steady increase. The next key resistance is near the 1.1150 zone. Any more gains might send the pair toward 1.1200.
On the downside, the bulls might remain active near 1.0980. The next major support is near the 1.0950 level or the 200 simple moving average (green, 4 hours).
If there is a downside break below the 1.0950 support, the pair could accelerate lower. In the stated case, the pair might even test 1.0880.
Looking at Gold price, it traded to a new all-time high at $2,079.84 before the bears appeared and initiated a downside correction to $2,000.
Economic Releases
- Germany’s Industrial Production for March 2023 (MoM) - Forecast -1%, versus +2 % previous.
Australia NAB business confidence rose to 9, conditions down to 14
Australia NAB Business Confidence index rose from -1 to 0 in April, while Business Conditions slipped from 16 to 14. A closer look at the details reveals that trading conditions declined from 24 to 20, profitability conditions dropped from 13 to 11, and employment conditions edged up from 10 to 11.
Price and cost growth indicators were mixed, with labor cost growth holding steady at 1.9% in quarterly equivalent terms, and purchase cost growth increasing to 2.3% (up from 1.9% in March). However, overall price growth was 1.1% (down from 1.3%), and inflation in the retail sector declined to 1.4% (down from 1.7%).
NAB Chief Economist Alan Oster pointed out that business conditions, although lower, remained well above their long-run average. Confidence, although still below average, has stabilized around 0 index points in recent months. Furthermore, Oster observed some easing in price measures this month, even as cost pressures remained high. This trend may signal a gradual easing of inflation in Q2's early stages, though inflation remains elevated.
Japan’s PMI services reaches record high in April, record optimism too
Japan PMI Services rose to 55.4 in April, up from 55.0 in March, marking the eighth consecutive month in growth territory. This represents the highest reading since records began in 2007, surpassing the previous record set in 2013. S&P Global also noted that year-ahead business expectations reached an all-time high, while prices charged increased at the steepest pace in nine years. Meanwhile, the PMI Composite remained unchanged at 52.9, as stronger services growth offset a sharper reduction in manufacturing production.
Tim Moore, Economics Director at S&P Global Market Intelligence attributed the record rise in service sector output to a rebound in demand for face-to-face consumer services, recovery in international tourist arrivals, and improvement in new business from abroad.
Moore also emphasized the high level of business confidence, with around four times as many service providers expecting an increase in activity as those forecasting a decline. This optimism marked the highest level in more than 15 years of data collection.
Furthermore, service providers increasingly passed on higher business expenses to customers to alleviate pressure on margins from rising wages and transportation costs. This resulted in the steepest increase in service sector output charges since the sales tax hike in April 2014.