Sample Category Title
AUD/USD Technical Analysis
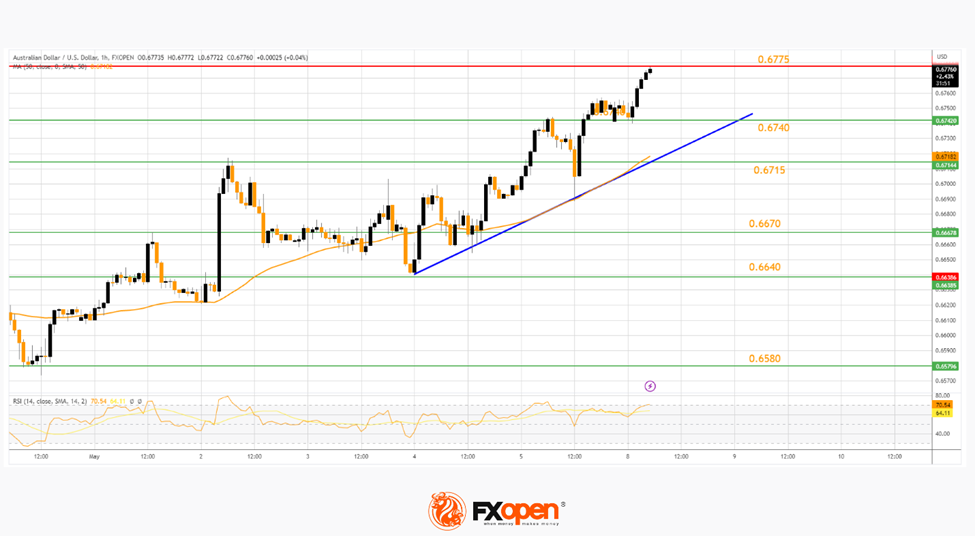
On the hourly chart of AUD/USD at FXOpen, the pair started a decent increase from the 0.6640 support. The Aussie Dollar broke the 0.6715 resistance to move into a positive zone.
The pair tested the 0.6775 zone and is currently consolidating gains. If there is a downside correction, the pair might find bids near a key bullish trend line at 0.6740 on the hourly chart. The next key support is near 0.6715 and the 50-hour simple moving average.
A downside break below the 0.6715 support might open the doors for a test of the 0.6667 support. Any more losses might send AUD/USD toward the 0.6580 support.
An Immediate hurdle for the bulls is at 0.6775. The next major resistance is near the 0.6800 level. If there is an upside break above the 0.6800 zone, the pair could rise steadily toward the 0.6820 level. Any more gains might send AUD/USD toward 0.6840.
Eurozone Sentix hits lowest level since January, recovery beginning to falter
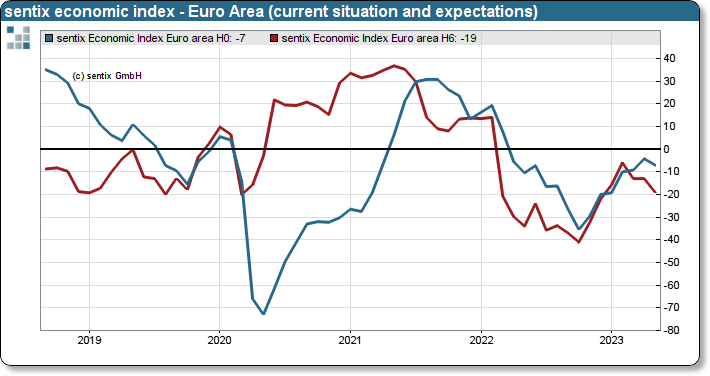
Eurozone Sentix Investor Confidence fell to its lowest level since January, dropping from -8.7 to -13.1 in May. Current Situation Index slipped from -4.3 to -7.0, while Expectations Index declined from -13.0 to -19.0 – its lowest point since December 2022.
Sentix commented, "The spring upswing in individual eurozone countries has so far been subdued anyway. Now the eurozone economy is being gripped by significant spring fatigue." The organization added that although the Eurozone economy weathered the winter months better than many had feared, energy shortages remain a perennial issue. High inflation data continues to hamper consumer spending, causing the economic recovery to falter.
Regarding inflation, Sentix noted, "the Inflation Barometer does not indicate any sustained easing, which should give the central banks little leeway to deviate from their restrictive path in their current key interest rate policy."
EURUSD Extends Sideways Move, Failing to Post Higher High
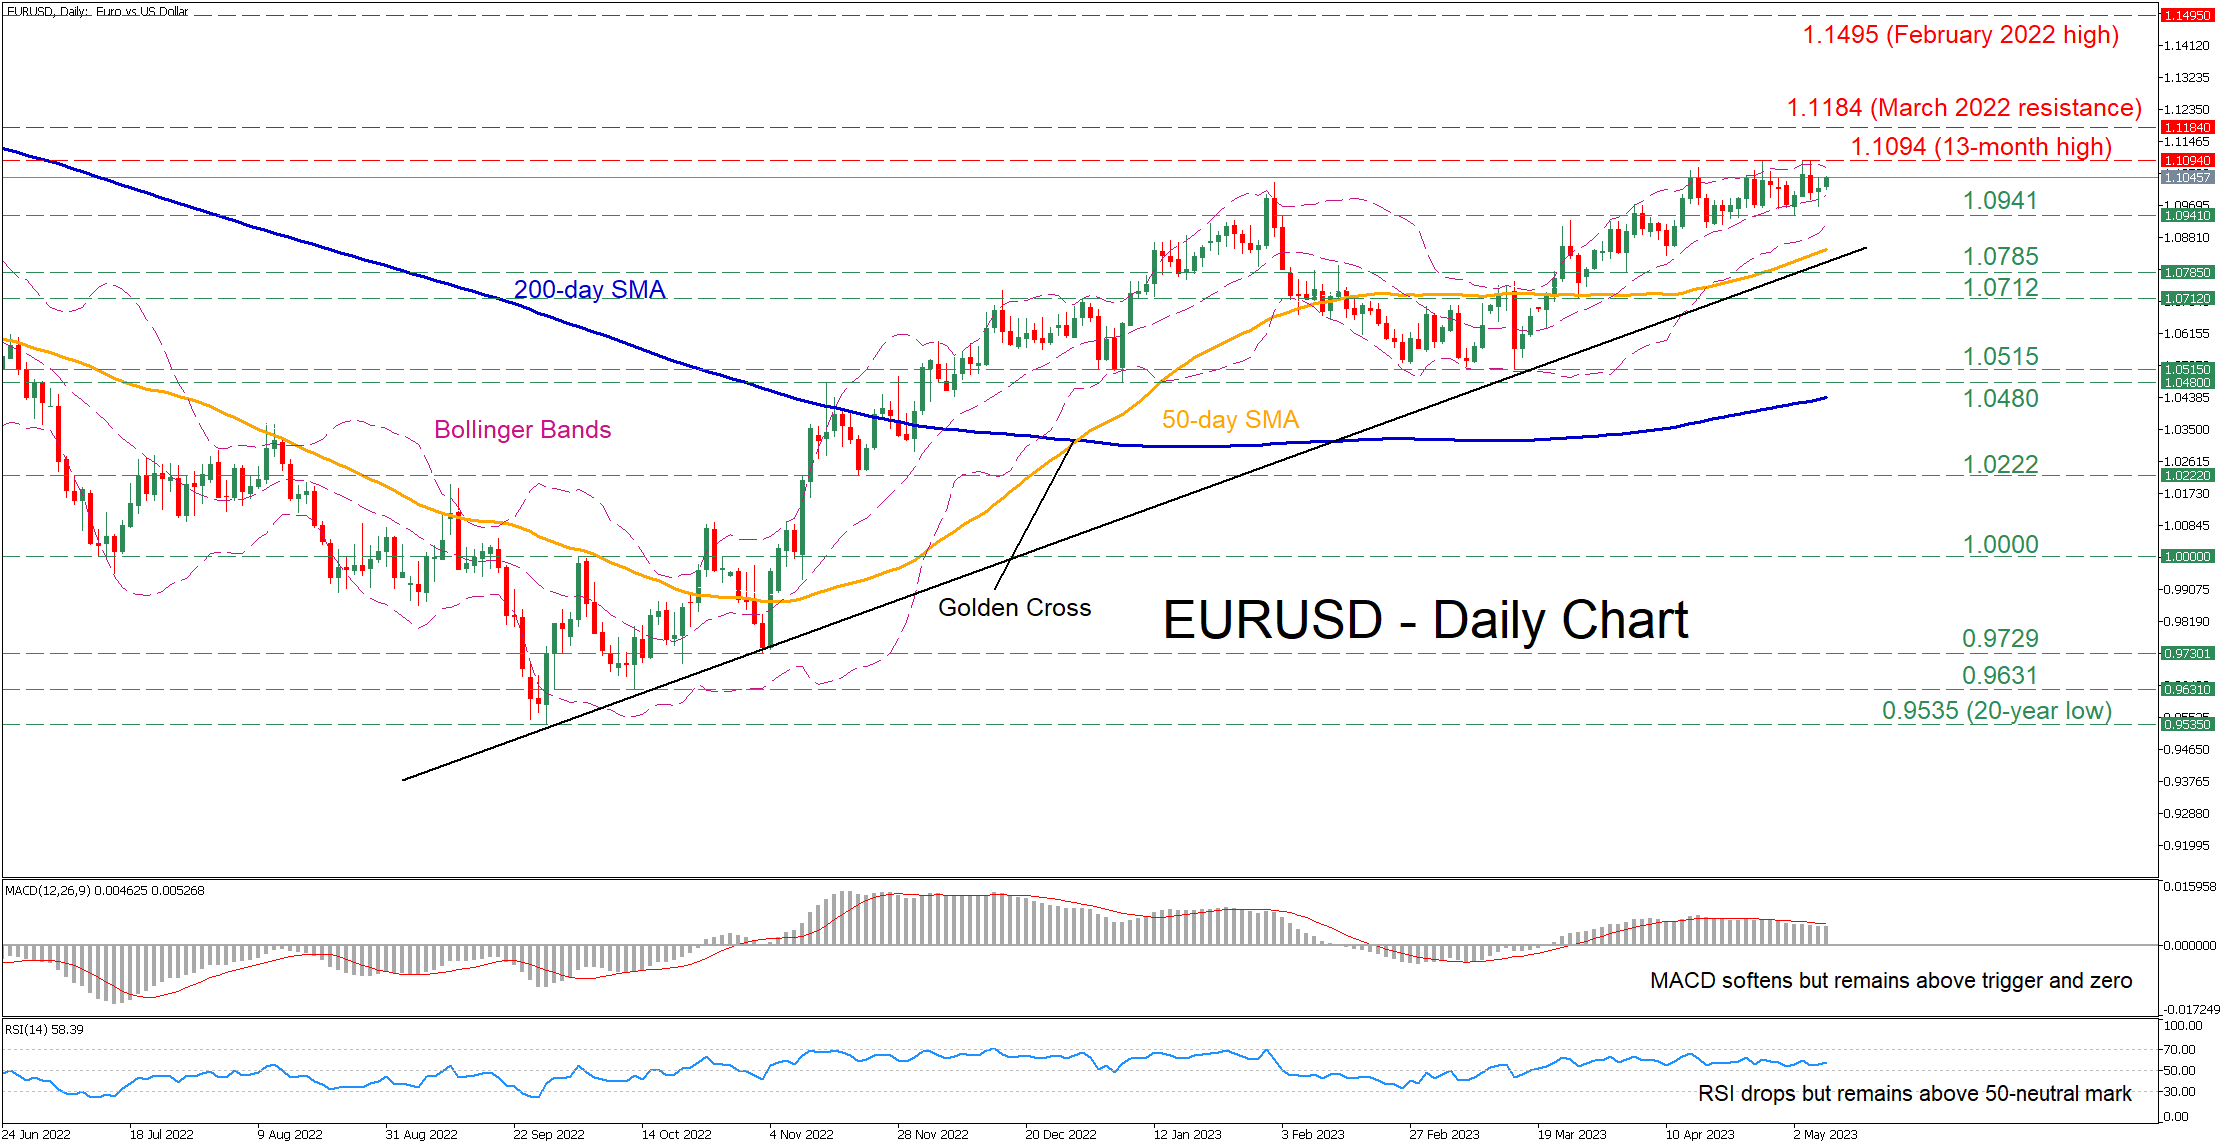
EURUSD had been in a steady uptrend after finding its feet at the March low of 1.0515. Even though the pair posted a fresh 13-month peak of 1.1094 in late April, it has been rangebound since then, appearing unable to generate a fresh higher high and resume its uptrend.
The short-term oscillators are endorsing a cautiously bullish bias. Specifically, the MACD is softening but remains above both zero and its red signal line, while the RSI has flatlined above its 50-neutral mark.
If buyers re-gain total control and push the price higher, the 13-month high of 1.1094 could act as initial resistance. Surpassing that zone, the pair might ascend towards a fresh multi-month peak, where the March 2022 resistance of 1.1184 could prove to be a tough obstacle for the price to overcome. Further advances could then cease at the February 2022 high of 1.1495.
On the flipside, should the pair reverse lower, the bears could target the recent support of 1.0941. If that floor collapses, the attention could shift towards 1.0785 before the 1.0712 barrier gets tested. A break below the latter may set the stage for the March low of 1.0515, which is the base of the pair's latest uptrend.
In brief, EURUSD has been trading sideways near its recent 13-month high as it seems to be lacking the necessary momentum to push higher. Nevertheless, the narrowing Bollinger bands are reinforcing the case of an impending breakout, with the broader technical signals tilting to the bullish side.
GBP/USD Eyes Bullish Breakout While EUR/GBP Consolidates Losses
GBP/USD is gaining bullish momentum above the 1.2600 resistance zone. EUR/GBP is now consolidating losses below the 0.8740 resistance.
Important Takeaways for GBP/USD and EUR/GBP Analysis Today
- The British Pound is showing a lot of bullish signs above the 1.2600 pivot level against the US Dollar.
- There is a key bullish trend line forming with support near 1.2600 on the hourly chart of GBP/USD at FXOpen.
- EUR/GBP started a fresh decline from the 0.8835 resistance zone.
- There is a major bearish trend line forming with resistance near 0.8740 on the hourly chart at FXOpen.
GBP/USD Technical Analysis
On the hourly chart of GBP/USD at FXOpen, the pair found support near the 1.2440 zone. The British Pound started a decent increase above the 1.2500 resistance against the US Dollar.
The pair gained bullish momentum above the 1.2550 resistance and climbed above the 50-hour simple moving average. A high is formed near 1.2653 and the pair is now consolidating gains above the 23.6% Fib retracement level of the upward move from the 1.2557 swing low to the 1.2653 high.
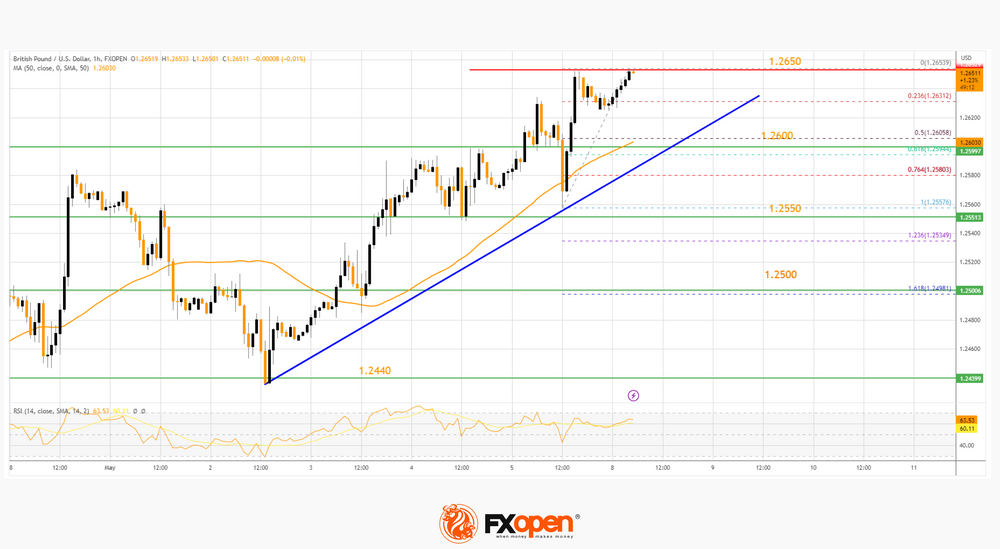
On the downside, there is a major support forming near the 50-hour simple moving average at 1.2600. There is also a key bullish trend line forming along with the 50% Fib retracement level of the upward move from the 1.2557 swing low to the 1.2653 high.
If there is a downside break below the 1.2600 support, the pair could accelerate lower. The next major support is near the 1.2550 level, below which the pair could test 1.2500. In the stated case, GBP/USD may perhaps revisit the 1.2440 support. Any more losses could lead the pair toward the 1.2350 support.
On the upside, resistance is near the 1.2650 zone. The next major resistance is near the 1.2700 level. A clear move above the 1.2700 level could spark a rally toward the 1.2840 level considering the current RSI position on the GBP/USD chart.
EUR/GBP Technical Analysis
On the hourly chart of EUR/GBP at FXOpen, the pair started a steady decline from the 0.8835 resistance. The Euro traded below the 0.8775 support to move into a bearish zone against the British Pound.
The EUR/GBP chart suggests that the pair settled below the 50-hour simple moving average and 0.8740. A low is formed near 0.8712 and the pair is slowly moving higher. The hourly RSI is also moving higher toward 45.
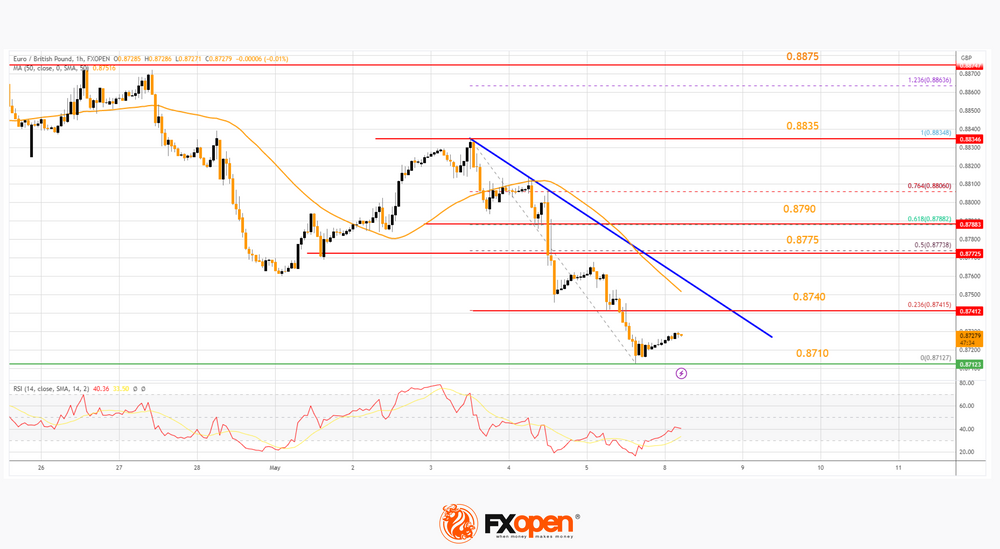
Immediate resistance is near a major bearish trend line at 0.8740. It coincides with the 23.6% Fib retracement level of the downward move from the 0.8835 swing high to the 0.8710 low.
The next major resistance for the bulls is near the 50% Fib retracement level of the downward move from the 0.8835 swing high to the 0.8710 low at 0.8775. A close above the 0.8775 level might accelerate gains.
In the stated case, the bulls may perhaps aim for a test of 0.8835. Any more gains might send the pair toward the 0.8875 level.
If there is no move above 0.8740, the pair could decline again. Immediate support sits at 0.8710. The next major support is near 0.8680. A downside break below the 0.8680 support might call for more downsides. In the stated case, the pair could decline toward the 0.8640 support level.
GBP/USD Reaches High Since the Beginning of the Year
Today, the British pound has updated its maximum since the beginning of the year. Here are the factors that contributed to this:
→ weakness of the US dollar due to the threat of default. The FT relays Yellen's words that the US Treasury Department's ability to bypass the default is running out;
→ the US dollar's weakness due to the banking crisis. According to media reports, 722 US banks have unrealized losses of more than 50% of capital;
→ the upcoming meeting of the Bank of England (Thursday, at 14:00 GMT+3). A rate increase is expected, which may not be the last.
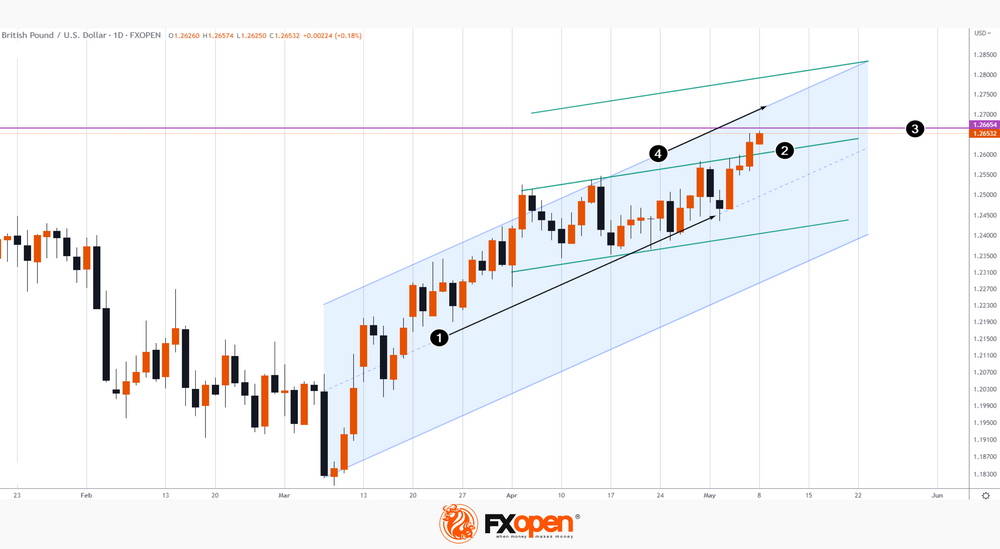
Technical analysis of the GBP/USD chart indicates that:
→ the median line of the growing channel (1) supports the market;
→ the rate has overcome the line (2), which offered resistance in April. Now the price can test this line from above;
→ the price is near the level of 1.2666 - this is an important peak on the GBP/USD forex chart in May 2022;
→ if the bullish trend strengthens, the price may reach the upper limit (4) of the ascending channel (shown in blue).
Gold Struggles to Make a Return to Record Highs
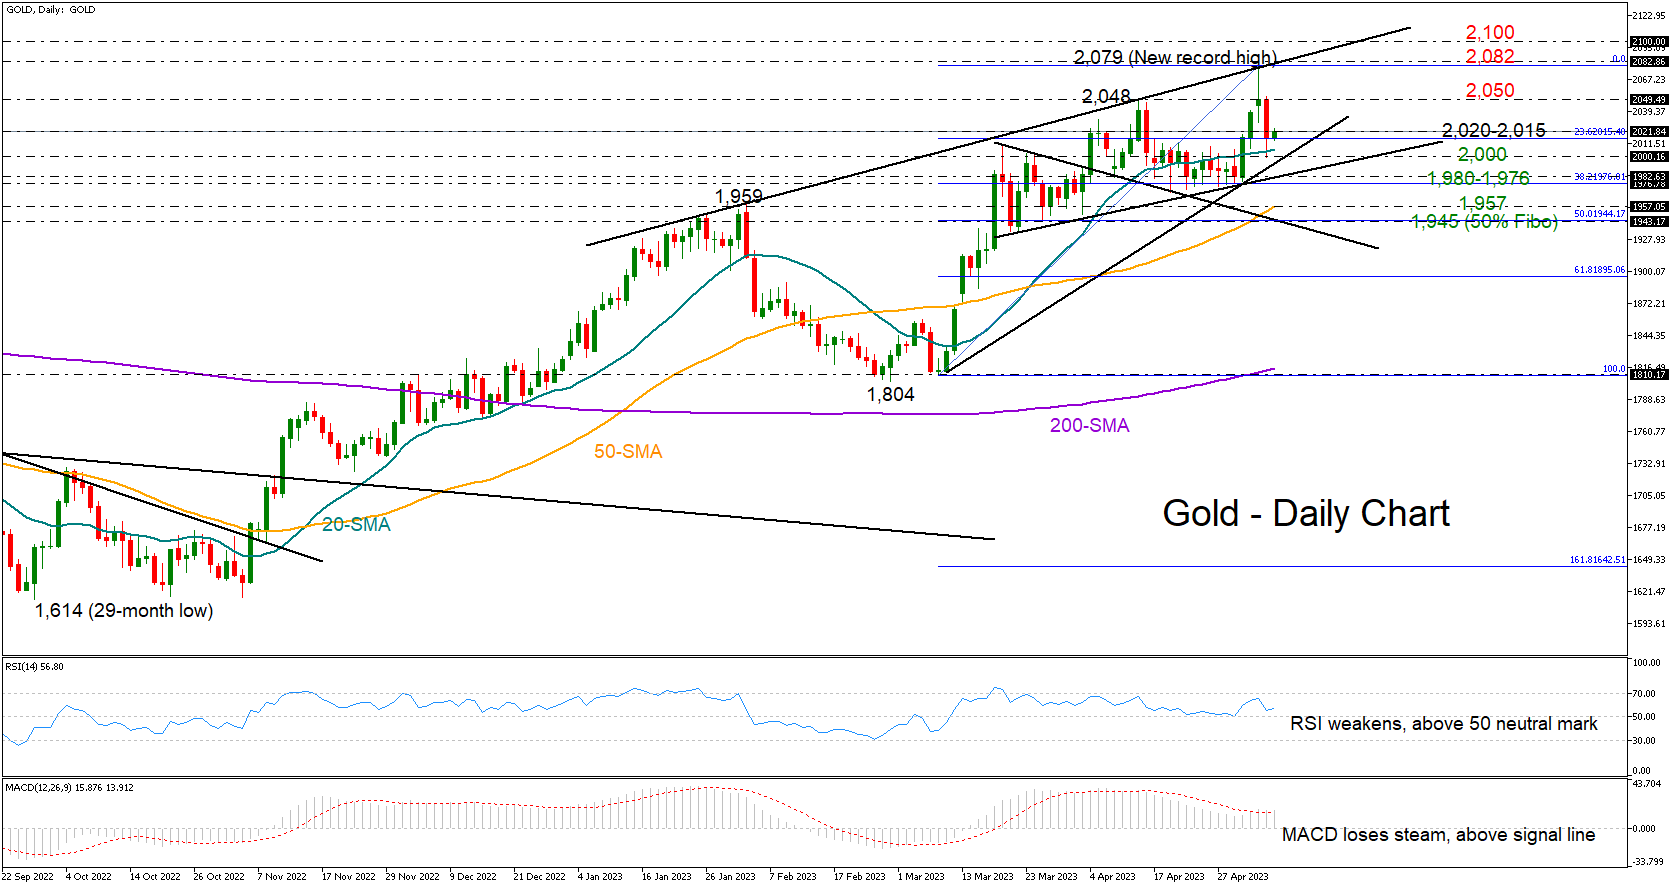
Gold faced brutal selling on Friday after an exciting run towards a record high of 2,079, but it managed to end the week within the 2,000 territory.
Although the precious metal is trying to heal its wounds at the moment, the technical picture cannot warrant a proper rebound to the uncharted zone. On the one hand, the RSI and the MACD, although weaker, keep promoting the positive scenario as the former is fluctuating above its 50 neutral mark, and the latter is hovering above its red signal line. On the other hand, the price seems to have created a bearish evening star candlestick pattern around its new all-time high, increasing the odds of a downside reversal.
The 23.6% Fibonacci retracement of the March-May upleg is currently providing a footing under the price around 2,015. Should that base crack, the bears may push for a close below 2,000 and beneath the tentative ascending trendline drawn from the March lows. A steeper decline could take a halt within the key 1,980-1,976 area, which includes the 38.2% Fibonacci level and the support trendline from March 22. Another failure here could boost selling pressures towards the 50-day simple moving average (SMA) at 1,957 or lower to the 50% Fibonacci of 1,945.
On the upside, the bulls will need to climb back above the former resistance of 2,020 in order to prompt a bounce towards the 2,050 barrier. A decisive close higher could be a prerequisite for a rally to record highs. Note that the extension of the 2023 resistance line is currently around 2,082, while the 2,100 number could be of psychological importance.
In brief, gold is sending mixed signals, with traders likely awaiting a close above 2,050 or below 2000, to drive the market accordingly.
EURCHF Stuck Inside a Wide Rectangle
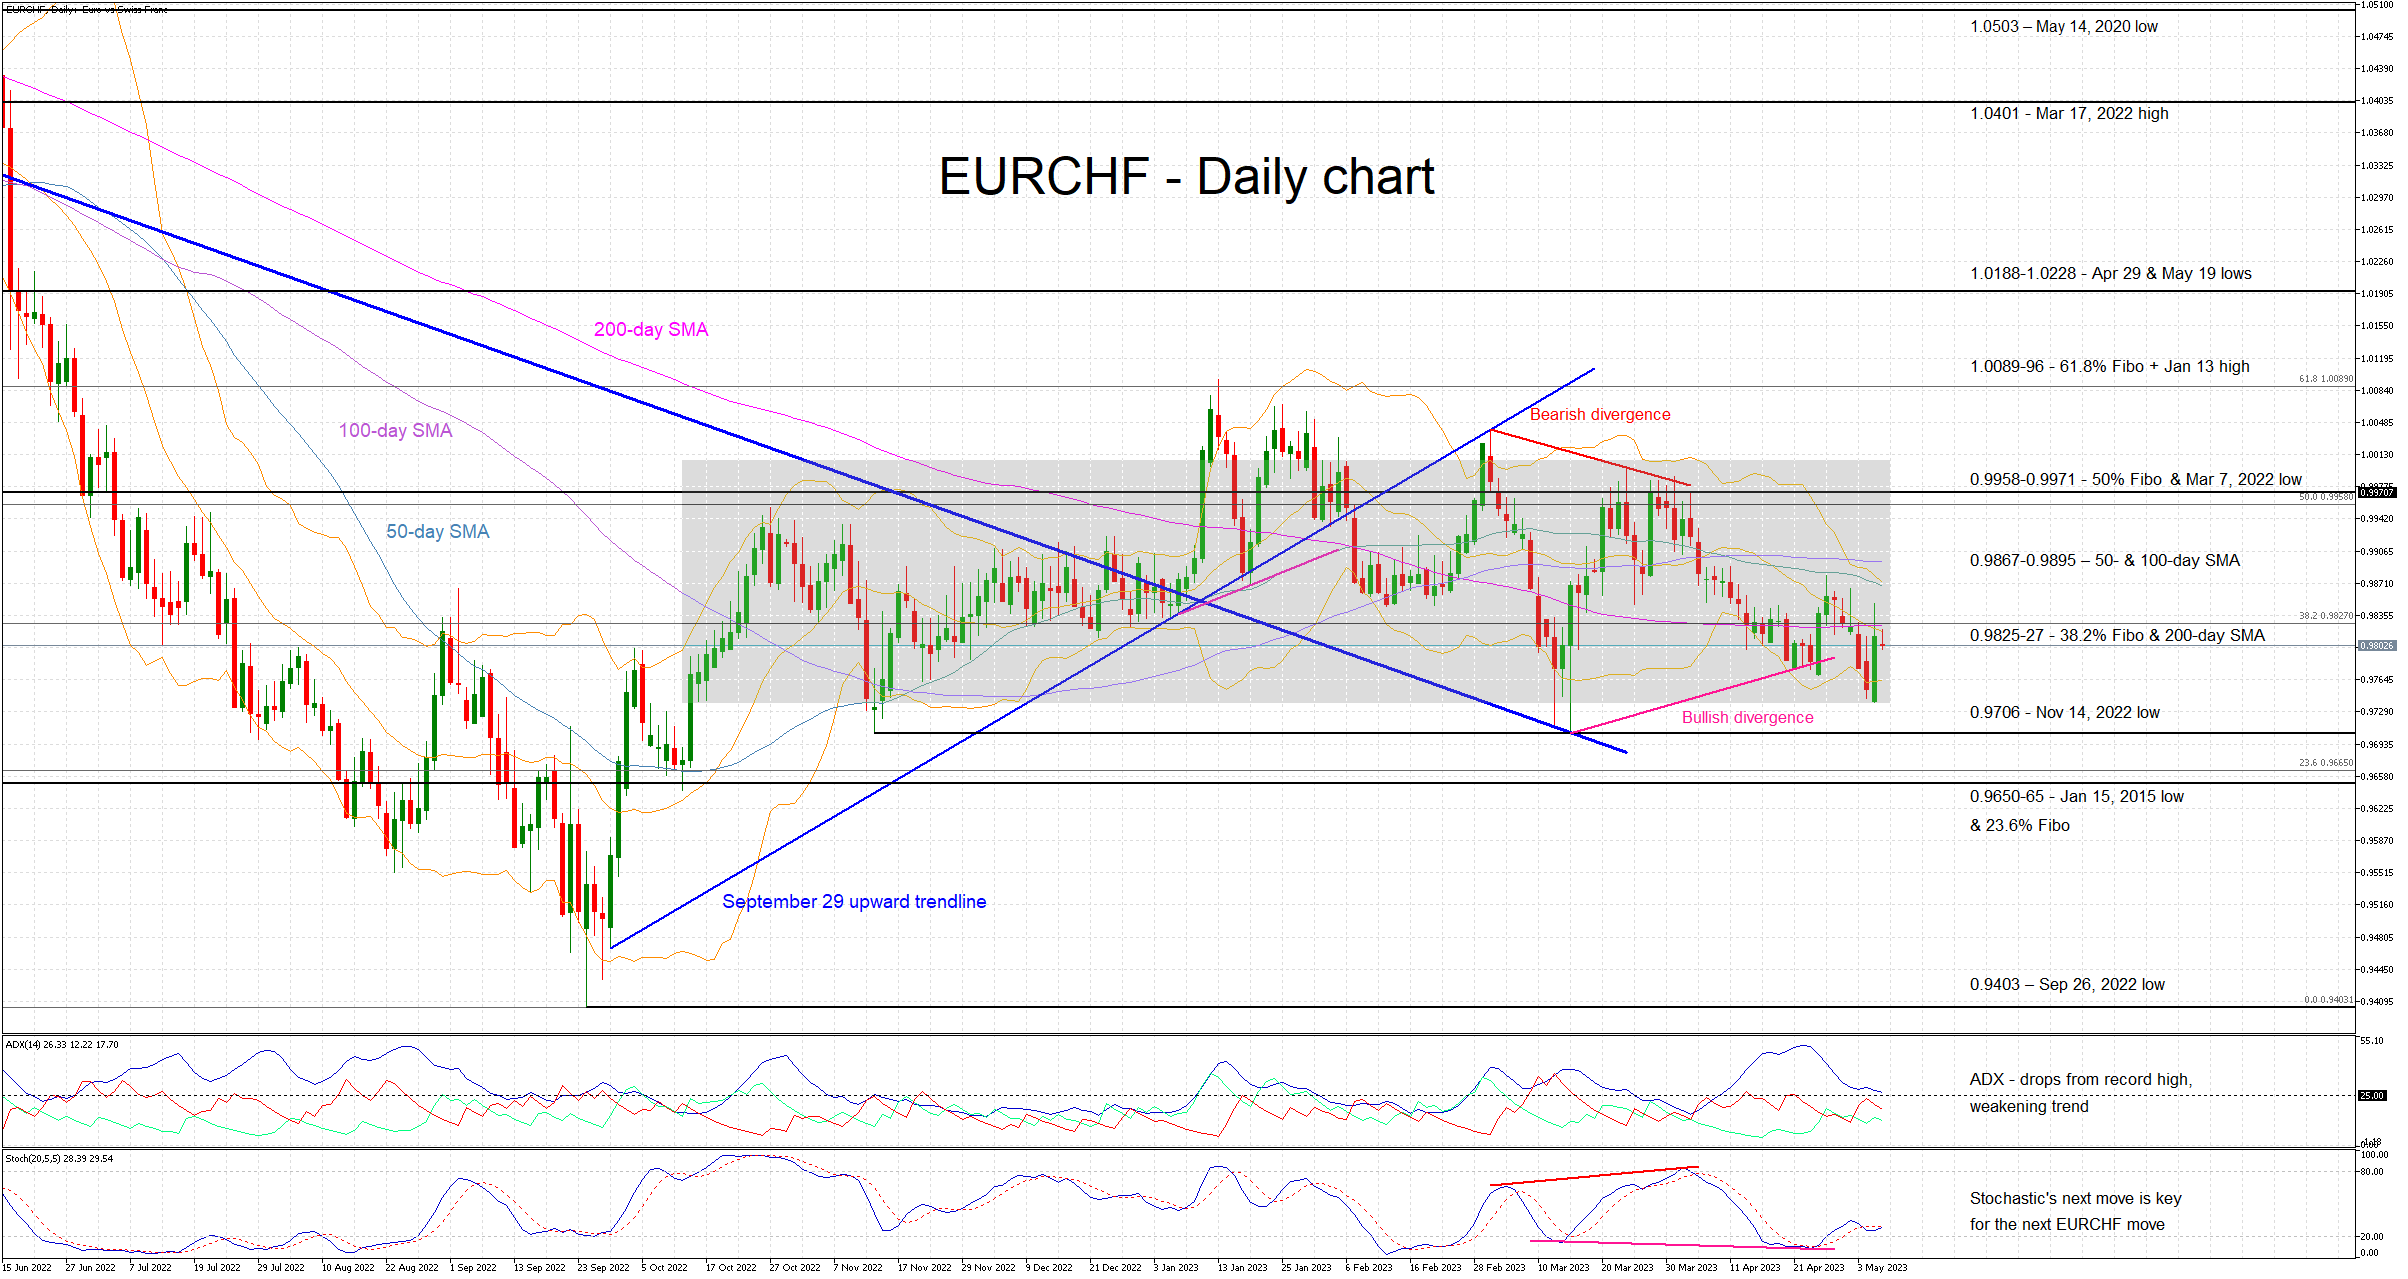
EURCHF has once again bounced off the lower boundary of the wide 0.9741-1.0006 rectangle. This rectangle has been dominating the price action since October 13, 2022, revealing a very delicate balance between buyers and sellers. Last week’s events contributed to the upmove, but the 0.9825-0.9827 area acted again as strong resistance.
This acute range-trading is evident in the various technical indicators used. The simple moving averages (SMAs) are converging, and the Bollinger bands are tightening aggressively. In addition, while the Average Directional Movement Index (ADX) is trading a tad above its 25-threshold, its respective subcomponents remain stuck at low levels. More interestingly, the stochastic oscillator is battling with its moving average and a break above it could be perceived as a bullish sign.
Should the bulls decide to push the market higher, they would have to overcome the 0.9825-0.9827 area populated by the 38.2% Fibonacci retracement and the 200-day SMA. The next resistance is defined by the 50- and 100-day SMAs at the 0.9867-0.9895 range. Even higher, the bulls could be faced with the busy 0.9958-0.9971 area set by 50% Fibonacci retracement of the June 9 – September 26 downtrend and the March 7, 2022 low.
On the other hand, the bears would prefer a retest of the lower boundary of the wide rectangle and the November 14, 2022 low at 0.9741 and 0.9706 respectively. A decisive move below these two levels could be a massive win for the bears. Even lower, the 0.9650-0.9665 area would probably be a key test for the bears’ resolve.
To sum up, EURCHF is still obeying the wide rectangle as both the bulls and the bears appear unable to stage a breakout. However, there are increasing signs of a sizeable move coming soon.
AUD/USD: Aussie Dollar Extends Rally on Weaker Dollar
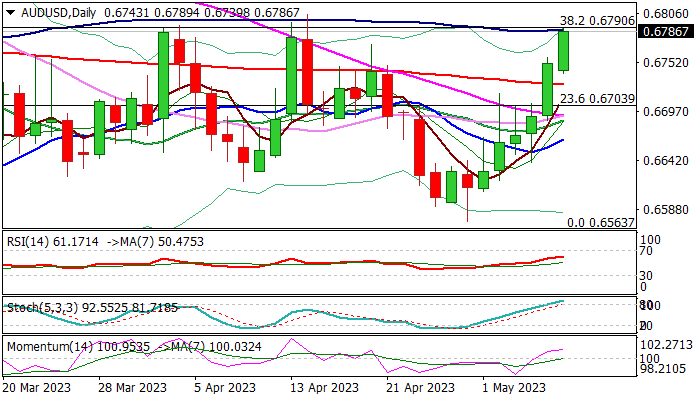
Australian dollar keeps firm tone and extends last week’s 2.1% advance, hitting a three-week high in early Monday.
Weaker US dollar on growing expectations that Fed’s tightening cycle might be over, lifted the Aussie dollar, while solid data on Monday showed robust Australian business conditions, adding to bullish stance.
Fresh bullish acceleration pushed the price action towards the top of a multi-week range, to pressure pivotal barriers at 0.6790/0.6805 (Fibo 38.2% of 0.7157/0.6563 bear-leg /100DMA / Apr 14 high), break of which is needed to signal a double-bottom (0.6563/73) and reversal and open way for stronger retracement of 0.7157/0.6563 fall.
Last Friday’s close above 200DMA (0.6726) and weekly bullish engulfing, generated bullish signals which look for a confirmation on sustained break of 0.6790/0.6805 barriers.
This would expose targets at 0.6860/0.6930 (daily Ichimoku cloud top/50%/61.8% retracement of 0.7157/0.6563 respectively) and unmask psychological 0.70 barrier on violation of these resistances.
Daily studies are turning to full bullish setup, though overbought stochastic provides headwinds and may pause bulls for consolidation before final push through 0.6790/0.6805 pivots.
Dips should find firm ground above broken 200DMA to keep bullish bias and offer better buying opportunities.
Caution on return and close below the base of thick daily cloud (0.6692) which would signal recovery stall and sideline bulls.
Res: 0.6805; 0.6860; 0.6930; 0.7000.
Sup: 0.6739; 0.6726; 0.6692; 0.6666.
GBP/JPY Daily Outlook
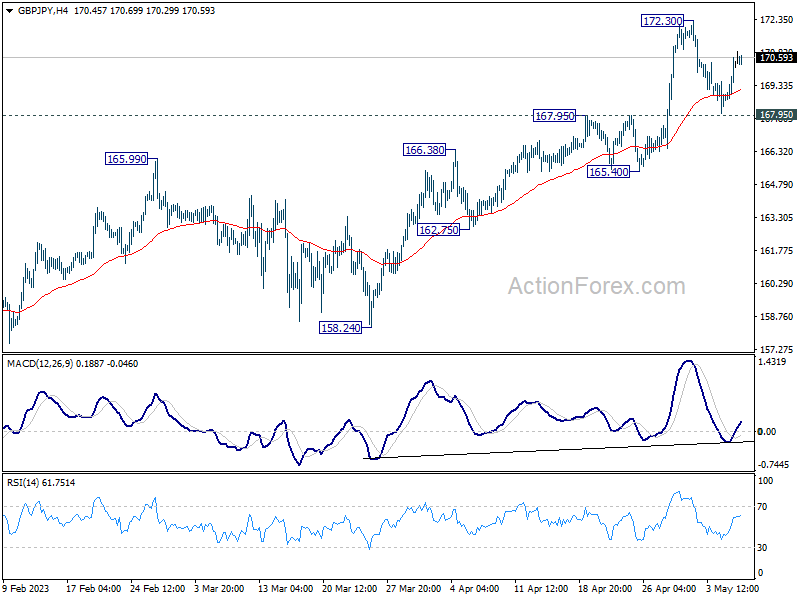
Daily Pivots: (S1) 169.11; (P) 169.87; (R1) 171.05; More...
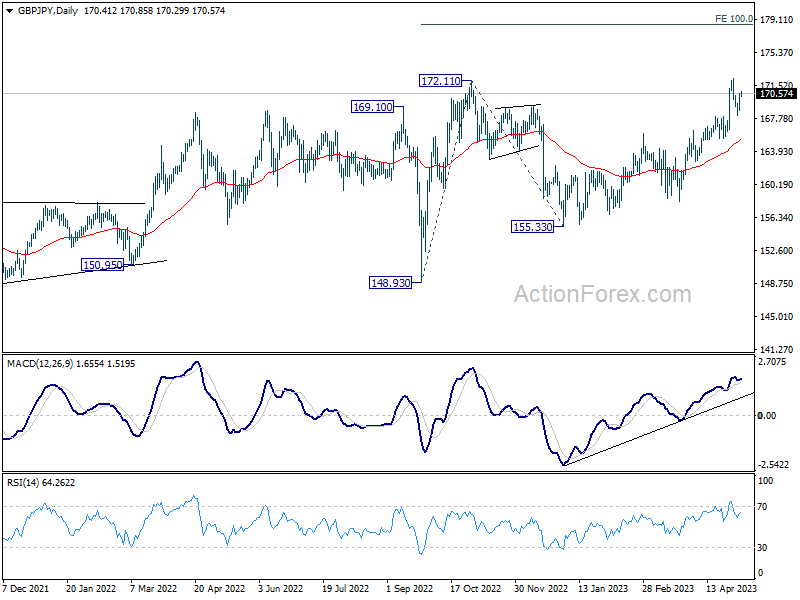
Intraday bias in GBP/JPY remains neutral for the moment, and further rally is in favor. On the upside, break of 172.30 will resume larger up trend to 100% projection of 148.93 to 172.11 from 155.33 at 178.51. Nevertheless, firm break of 167.95 should confirm short term topping, and turn bias back to the downside for deeper pull back to 165.40 support instead.
In the bigger picture, based on current momentum, up trend from 123.94 (2020 low) is likely ready to resume. Next target is 161.8% projection of 122.75 (2016 low) to 156.59 (2018 high) from 123.94 at 178.69. This will now remain the favored case as long as 165.40 support holds, in case of retreat.
EUR/JPY Daily Outlook
Daily Pivots: (S1) 147.94; (P) 148.32; (R1) 148.96; More....
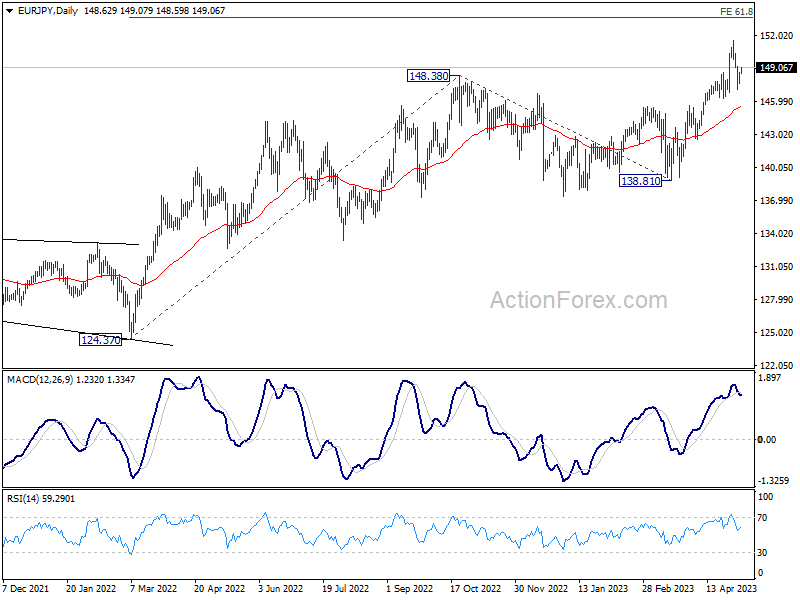
Intraday bias in EUR/JPY remains neutral for the moment, and outlook stays bullish. On the upside, break of 151.60 will resume larger up trend to 153.64 projection level. Nevertheless, firm break of 146.85 will confirm short term topping and turn bias to the downside for deeper pull back.
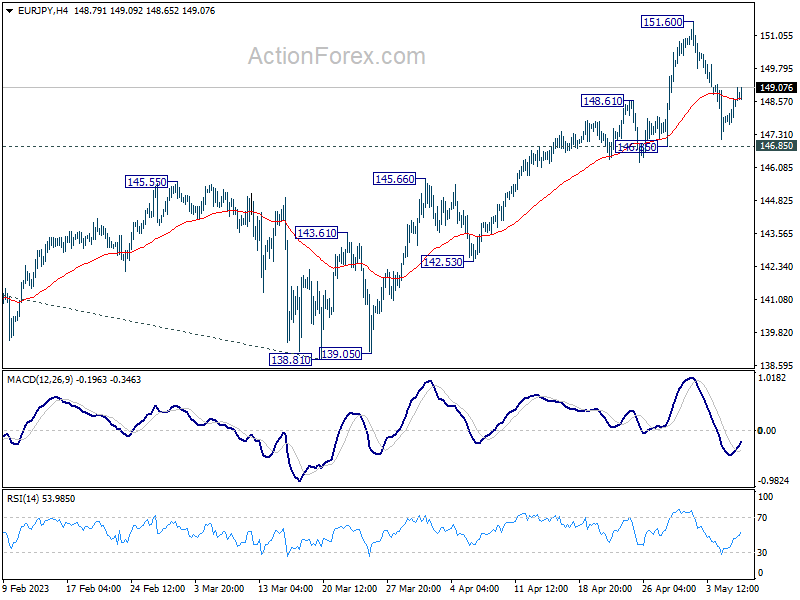
In the bigger picture, current development indicates that rise from 114.42 (2020 low) is in progress. Next target is 61.8% projection of 124.37 to 148.38 from 138.81 at 153.64. Sustained break there will pave the way to 100% projection at 162.82. For now, medium term outlook will remain bullish as long as 138.81 support holds, even in case of deep pull back.