Sample Category Title
AUD/USD Technical Analysis
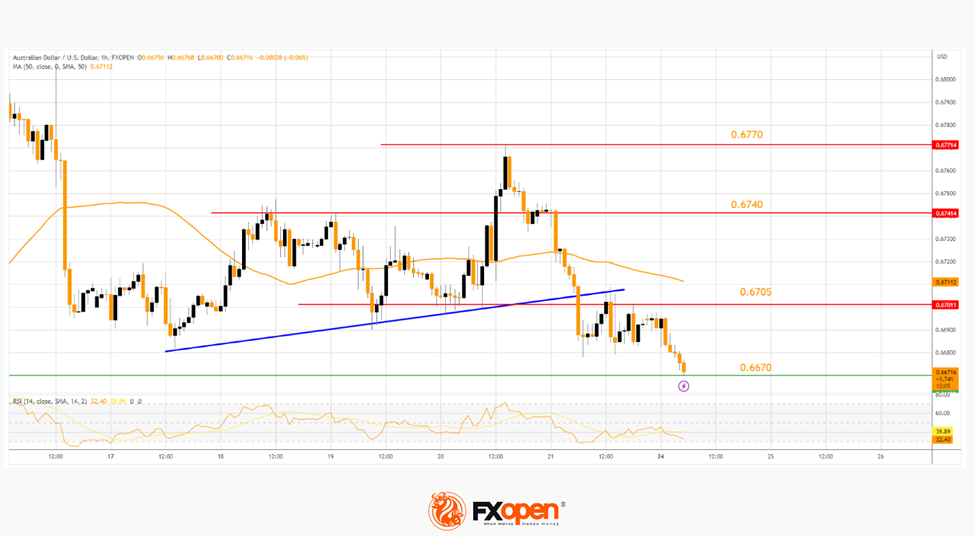
On the hourly chart of AUD/USD at FXOpen, the pair started a fresh decline from the 0.6770 resistance. The Aussie Dollar dropped below the 0.6740 support to move into a bearish zone.
There was a clear move below a major bullish trend line at 0.6705 and the 50-hour simple moving average. The pair is now consolidating near the 0.6670 zone. Immediate resistance is near the 0.6705 level.
The next major resistance is near the 0.6740 pivot level. If there is an upside break above the 0.6740 zone, the pair could rise steadily toward the 0.6770 level. Any more gains might send AUD/USD toward 0.6820.
Immediate support is near the 0.6670 level. The next key support is near the 0.6650 level. A downside break below the 0.6650 support might open the doors for a test of the 0.6600 support.
Market Trends Can be in Favour of USD Due to Inflation Concerns and Fed Speculation
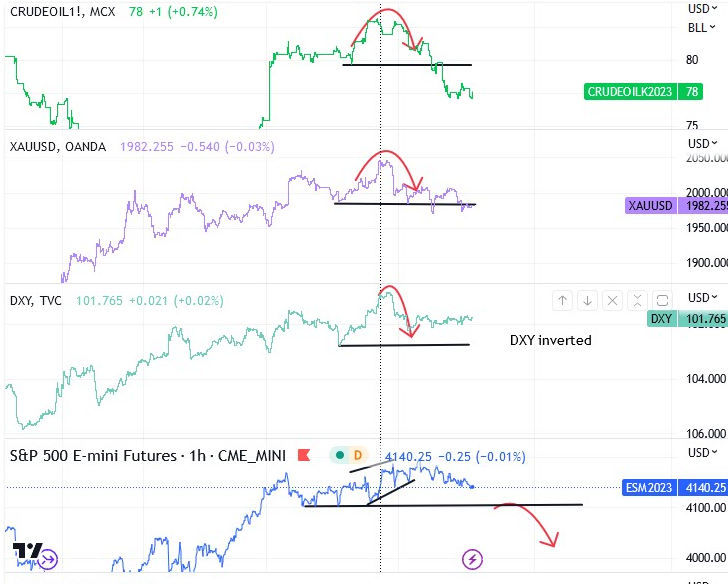
Last week's market movements remained confined to a narrow range. However, global inflation is still the main concern after last week UK CPI, and FED hawkish speculation have caused a slight rebound in US yields and the USD over the last two weeks. If stocks experience a descent from resistance levels, it is likely that we may see further growth in these markets.
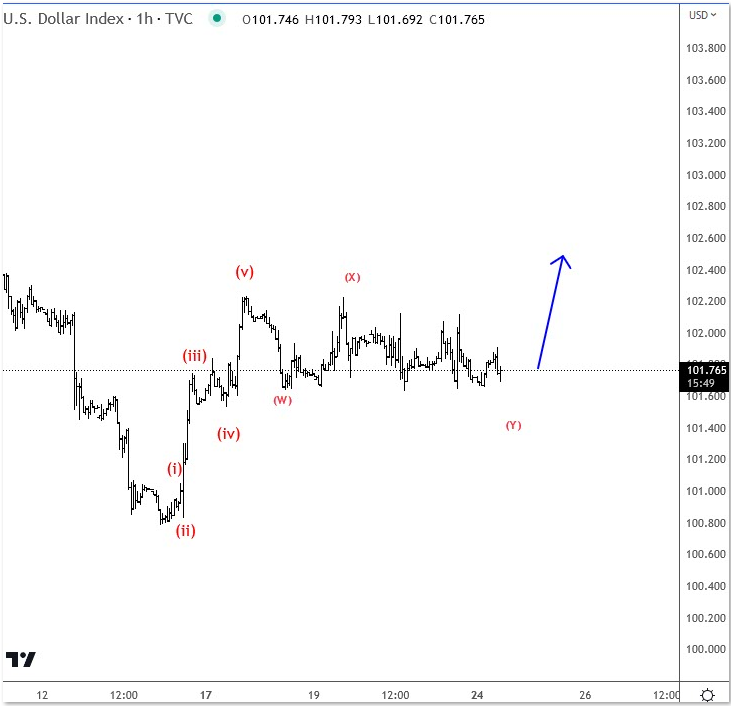
This week's market behavior will be significantly influenced by forthcoming GDP data, earnings reports, and BOJ decisions. Based on the latest Elliott wave price action, we can anticipate that these factors will favor the USD. Additionally, the DXY shows a strong intraday bullish impulse, signaling more upside potential after the current consolidation phase.
If a sharp break higher occurs, it may trigger a sell-off on the EUR, GBP, and already weak commodity currencies like AUD and NZD. Overall, the market outlook remains uncertain, and investors should keep a close eye on these key indicators for further insights into potential market trends.
Germany Ifo rose to 93.6, worries abating, but lacks dynamism
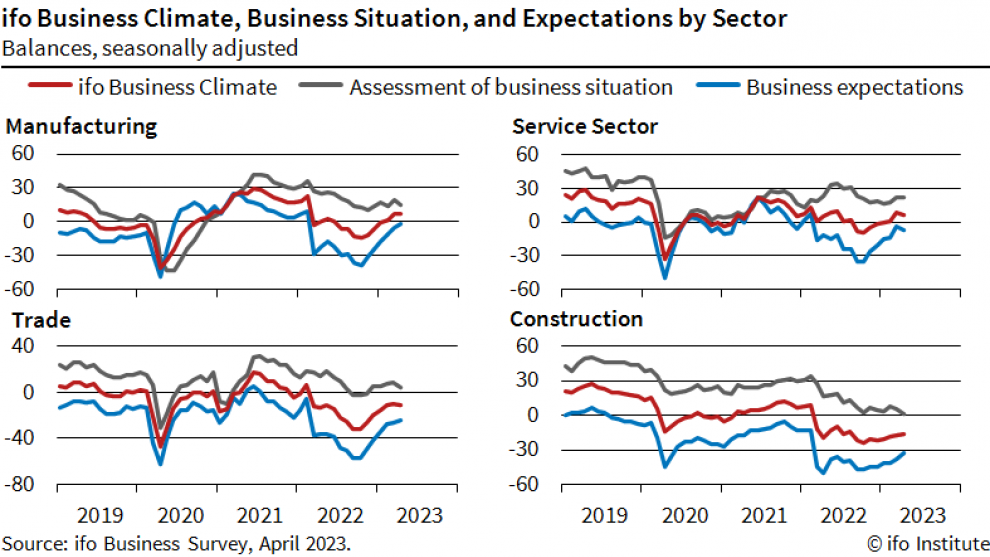
Germany Ifo Business Climate rose slightly from 93.2 to 93.6 in April, below expectation of 94.0. Current Assessment index dropped from 95.4 to 95.0, below expectation of 96.1. Expectations index rose from 91.0 to 92.2, above expectation of 91.6.
By sector, manufacturing rose from 6.5 to 6.7. Services dropped from 8.8 to 6.8. Trade dropped from -10.1 to -10.7. Construction rose from -17.5 to -16.7.
Ifo said: "German business's worries are abating, but the economy is still lacking dynamism.
GBP/USD Eyes Bullish Breakout While EUR/GBP Consolidates Losses
GBP/USD is eyeing a key upside break above the 1.2470 resistance zone. EUR/GBP is now consolidating losses above the 0.8825 support.
Important Takeaways for GBP/USD and EUR/GBP
- The British Pound is slowly moving higher from the 1.2365 support against the US Dollar.
- There is a key bearish trend line forming with resistance near 1.2440 on the hourly chart of GBP/USD at FXOpen.
- EUR/GBP started a downside correction from the 0.8860 resistance zone.
- There is a major bullish trend line forming with support near 0.8825 on the hourly chart at FXOpen.
GBP/USD Technical Analysis
On the hourly chart of GBP/USD at FXOpen, the pair found support near the 1.2365 zone. The British Pound formed a base and started a decent increase above the 1.2400 resistance against the US Dollar.
The pair even spiked above 1.2440 and the 50-hour simple moving average. However, upsides remained capped near the 1.2470 zone. The pair is now consolidating near the 50-hour simple moving average and the 23.6% Fib retracement level of the upward move from the 1.2367 swing low to the 1.2451 high.
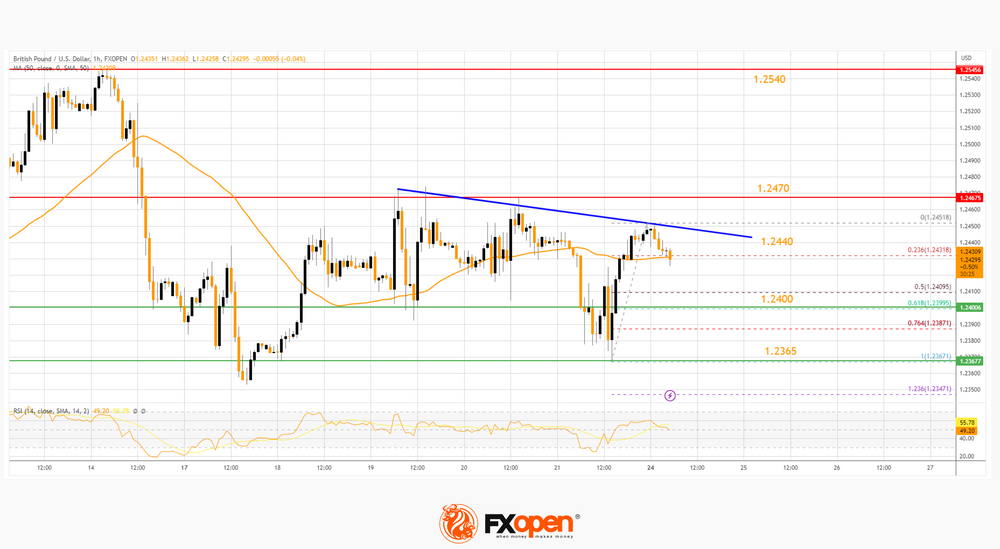
On the downside, there is a major support forming near the 61.8% Fib retracement level of the upward move from the 1.2367 swing low to the 1.2451 high at 1.2400.
The next major support is near the 1.2365 level. If there is a downside break below the 1.2365 support, there is a risk of a sharp decline. In the stated case, GBP/USD may perhaps revisit the 1.2300 support. Any more losses could lead the pair toward the 1.2250 support.
On the upside, resistance is near a key bearish trend line at 1.2440. The pair might attempt a fresh increase if the RSI stays above 50. The next major resistance is near the 1.2470 level. A clear move above the 1.2470 level could spark a rally toward the 1.2540 level.
EUR/GBP Technical Analysis
On the hourly chart of EUR/GBP at FXOpen, the pair started a decent increase above the 0.8825 resistance. The Euro climbed higher toward the 0.8860 resistance against the British Pound.
It traded as high as 0.8861 and recently started a downside correction. There was a move below the 23.6% Fib retracement level of the upward move from the 0.8791 swing low to the 0.8861 high.
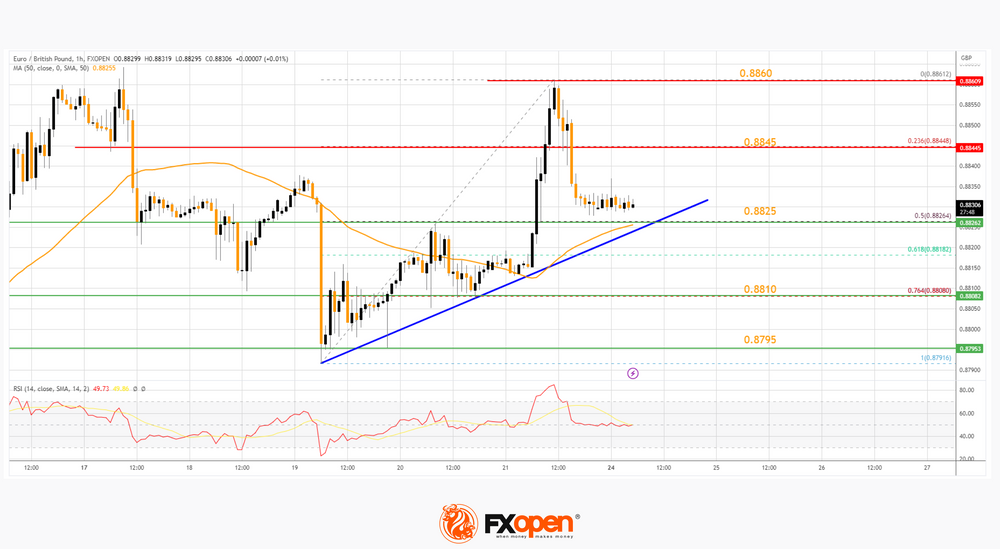
It is now consolidating losses, with immediate support near the 50% Fib retracement level of the upward move from the 0.8791 swing low to the 0.8861 high at 0.8826. There is also a major bullish trend line forming with support near 0.8825.
The next major support is near 0.8810. A downside break below the 0.8810 support might call for more downsides. In the stated case, the pair could decline toward the 0.8795 support level. Any more losses could open the doors for a move to 0.8720.
Conversely, the bulls could remain active above the 0.8825 support. Immediate resistance is near the 0.8845 level. The next major resistance for the bulls is near the 0.8860 level.
A close above the 0.8860 level might accelerate gains. In the stated case, the bulls may perhaps aim for a test of 0.8900. Any more gains might send the pair toward the 0.8920 level.
Gold Maintains Weak Bias in Near-Term; Broader Trend is Bullish
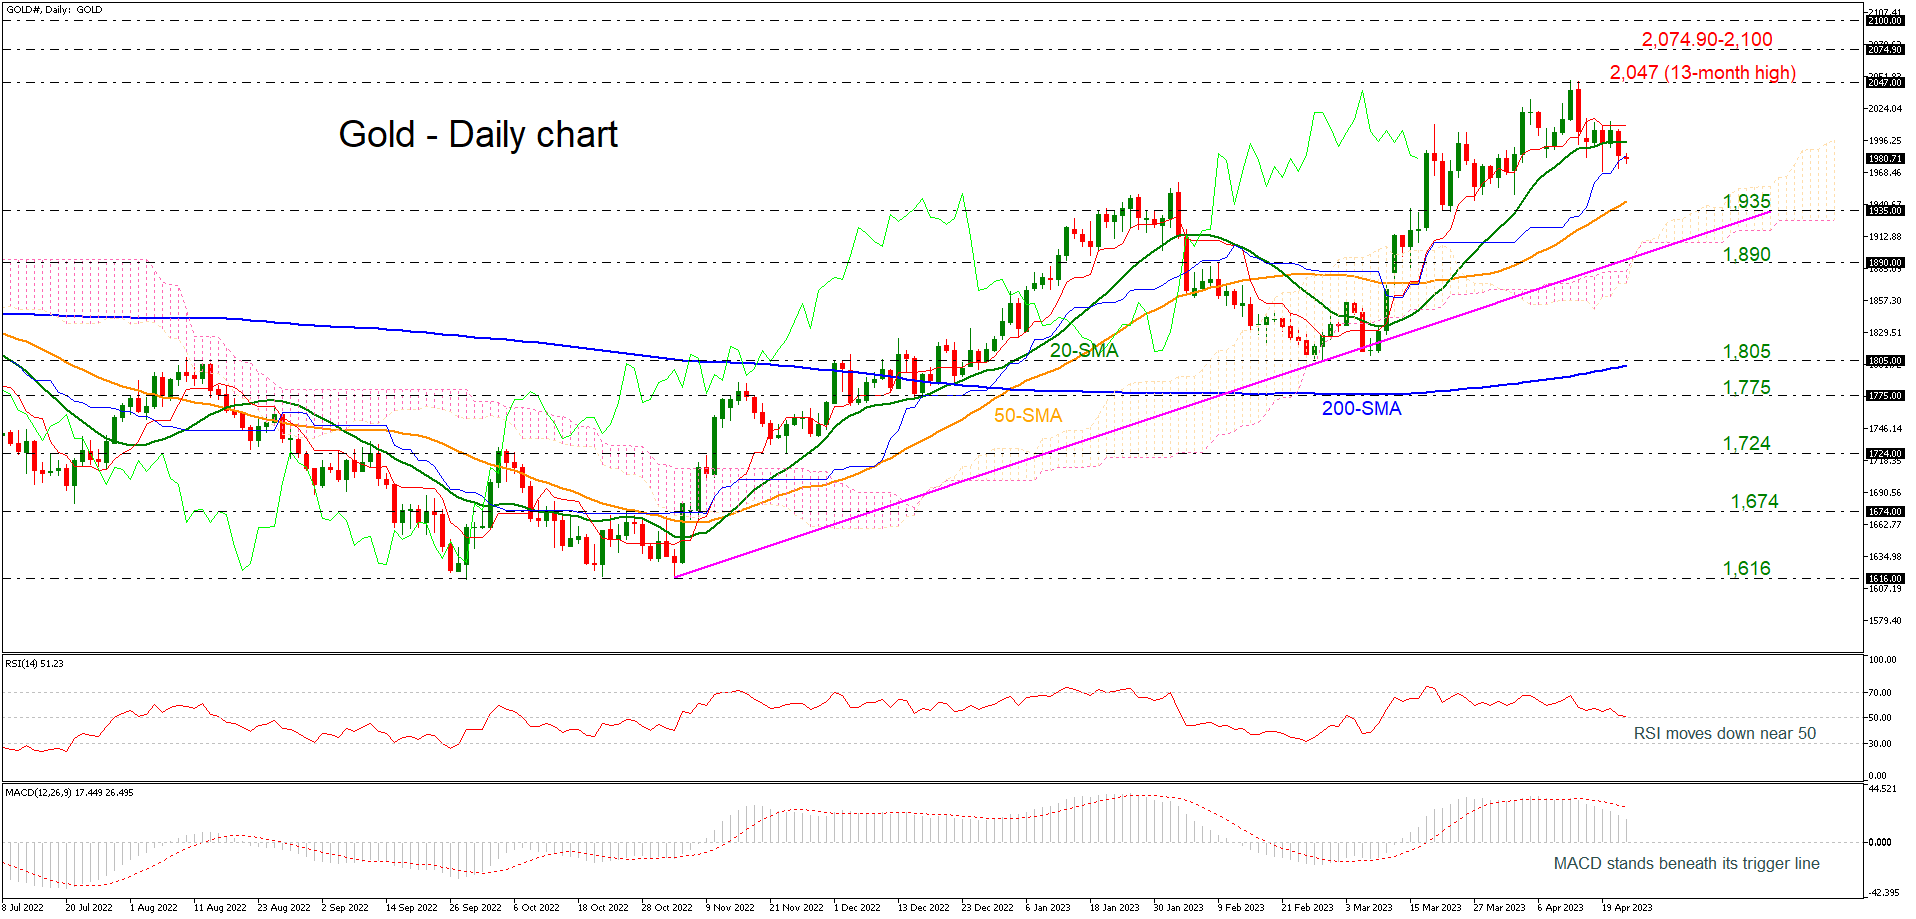
Gold has been underperforming in the past few days, breaking back below the 20-day simple moving average (SMA) around 1,985. When looking at the bigger picture, the price is strongly bullish in the long-term timeframe as it is holding well above the ascending trend line, which has been drawn from the low in November 2022.
Based on technical oscillators, momentum is titled to the downside as the RSI is approaching the neutral threshold of 50, while the MACD is standing beneath its trigger line in the positive region.
If price action remains above 1,935 (immediate support) and the 50-day SMA, there is scope to test the previous 13-month high of 2,047. Clearing this key level would see additional gains towards the restrictive region of 2,074.90-2,100.
If the 1,935 support fails, then the focus would shift to the downside towards the lower boundary of the Ichimoku cloud at 1,906, which overlaps with the uptrend line. If this line is breached, it would increase downside pressure and bring about a reversal of the trend. From here, the commodity would be on the path towards the 200-day SMA near 1,805.
Overall, gold has been positive since peaking at 2,047. Near-term weakness is expected to remain as long as price action takes place beneath 2,000.
Lack of Further Liquidity and Investors’ Positioning Put a Dent in China’s Stock Market Optimism
- Cyclical sectors have underperformed, and Real Estate is the worst.
- No clear signs to indicate the resurgence of a major bearish trend.
- China A50 is at risk of further downside pressure to retest key support at 12,300.
China’s stock market has started to show signs of fatigue after a magnificent three-month rally of 22% from the October 2022 low to January 2023 high as seen on its benchmark CSI 300 Index. Since 18 April 2023, it has declined by close to -4% and underperformed a basket of developed nations’ stock markets.
The recent bullish up move from the October 2022 low of 3,495 in the CSI 300 has been fueled by optimism from the removal of prior Covid-zero lockdown measures, the introduction of stimulus measures to boost domestic consumption and reduce the credit crunch faced by embattled property developers as well as the toned down of draconian regulatory measures imposed on Chinese technology platform firms.
Cyclical sectors are the worst performers with Real Estate at the bottom
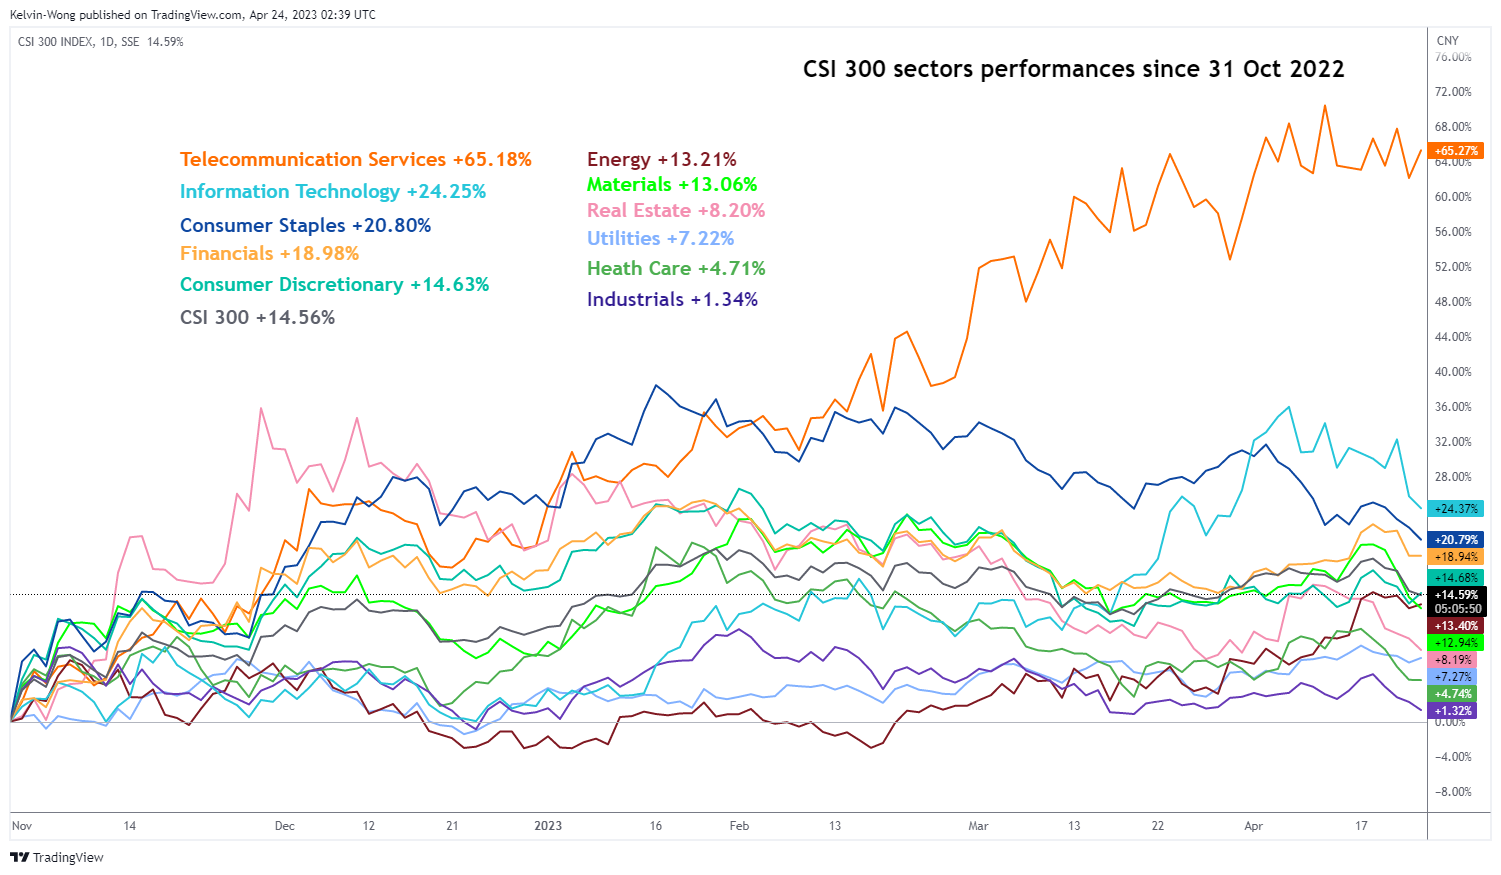
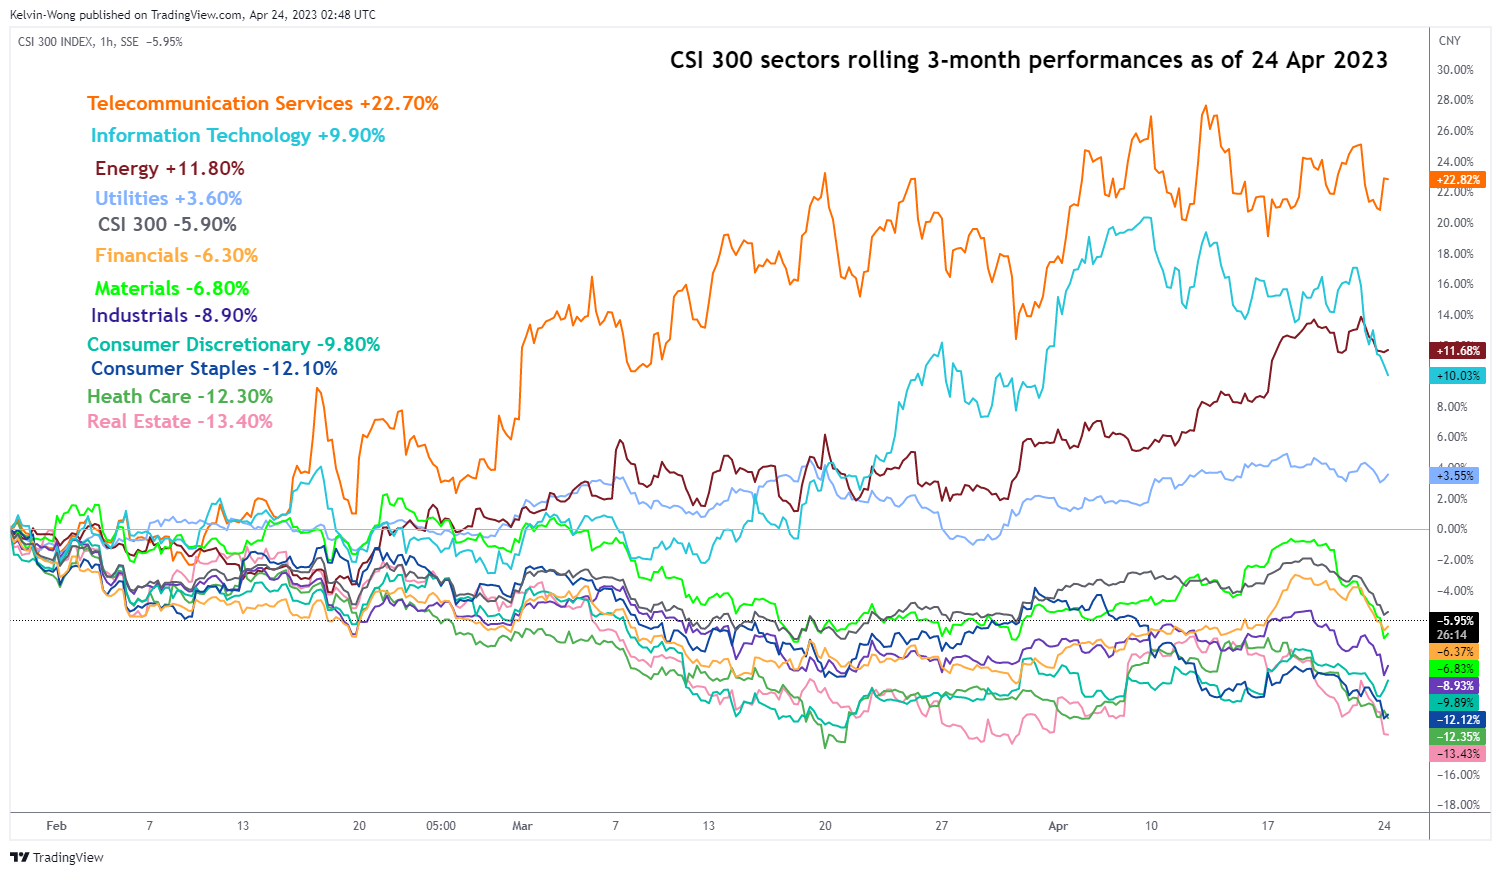
Source: TradingView as of 24 Apr 2023
As seen from the charts above, cyclical sectors such as Materials, Financials, Industrials, Consumer Discretionary, and Real Estate have underperformed against the benchmark CSI 300; the worst is the Real Estate which recorded a three-month rolling performance of -13.40% versus -5.90% recorded in the CSI 300.
Meanwhile, two defensive sectors; Telecommunication Services and Utilities together with Energy and Information Technology have managed to outperform with positive gains of 22.70%, 3.60%, 11.80%, and 9.90% respectively over the same period.
It’s all about liquidity and investors’ positioning
The latest slew of robust economic data; China’s Q1 GDP, industrial output, and consumer spending for March coupled with a rebound in new home prices over the same period that recorded its fastest pace of recovery in 21 months on a month-on-month basis; a 0.5% increase in March from a 0.3% rise in February has allowed China’s policymakers some breathing space to a adopt a “wait and see” approach.
Hence, China’s central bank, PBoC is likely in a no hurry mode to further loosen its liquidity taps to stimulate economic growth at this juncture. The latest monetary policy action of PBoC has shown evidence of such a “controlled accommodating” stance where it has left the key one-year medium-term lending facility interest rate (MLF), that is PBoC’s lending rate to big commercial banks unchanged at 2.75% for the fifth consecutive month.
In addition, it injected the least amount of medium-term cash into the banking system; a 20-billion-yuan net injection via the MLF facility in April, the smallest amount since November 2022. Also, it left its other benchmark interest rates; the one and five-year loan prime rates unchanged at 3.65% and 4.3% respectively for eight consecutive months.
To put a halt to the credit crunch problem that resurfaced in 2021 for property developers and prevent contagion and systemic risk outbursts in the domestic financial system, Chinese policymakers have allowed indebted property developers easier access to the onshore corporate bond market for fundraising with a slew of regulatory easing measures introduced in 2022. One of them was the full guarantees for property developers’ issued bonds backed by the state-owned China Bond Insurance Company.
However, this key guaranteed initiative has started to lose its fanfare, property developers have managed to raise only 5.9 billion yuan of guaranteed onshore corporate bonds; down by -29% from 8.3 billion yuan recorded in December 2022.
Interestingly, some of China’s top-performing hedge funds such as Shanghai Bulls Asset Management and Shanghai Silver Leaf Investment have exited from their lucrative bets on high-yield property bonds that reaped more than 100% returns in 2022 as per reported by Bloomberg News.
Hence, a lack of further liquidity-pumping measures from PBoC and dwindling optimism in the Chinese property developers have reinforced the recent round of profit-taking activities seen in the various China benchmark stock indices such as the CSI 300 and FTSE China A50.
Is it the start of another major bear market for China equities?
Right now, it is still too early to put an “all-out” warning that we are witnessing the start of another major bearish trend phase to breach below the October 2022 low of the mainland benchmark stock indices as recent economic data as per mentioned earlier are indicating a recovery stage and inter-market analysis via a potential further weakening of the US dollar in the medium-term tends to support the China stock market.
The next key economic data to watch to have a clearer picture of the crystal ball is the release of the official NBS Manufacturing and Non-Manufacturing PMIs for April on Sunday, 30 April 2023. Forecasts are expecting a continuation of manufacturing growth to 52 from 51.9 printed in March; likewise, for the non-manufacturing activities where it is expected to increase to 58.3 in April from 58.2 in March, and if it turns out as expected, it will be the fourth consecutive month of expansion.
Also, consumer spending data during the upcoming Golden Week holiday for the Labour Day celebrations that kickstarts on 29 April to 3 May to have the latest gauge on consumers’ optimism and spending power.
The main inherent risk is geopolitical where the relationship between US and China is still frosty. The US-China High Tech war is still “alive” since 2018, the Biden administration is set to unveil new investment curbs on China in the next upcoming G-7 meeting in May for endorsement. These new measures cover the fields of semiconductors, artificial intelligence, and quantum computing that limit investments from US firms, including venture capital and joint ventures.
China A50 Technical Analysis – at the risk of short-term bearish pressure to retest a key support
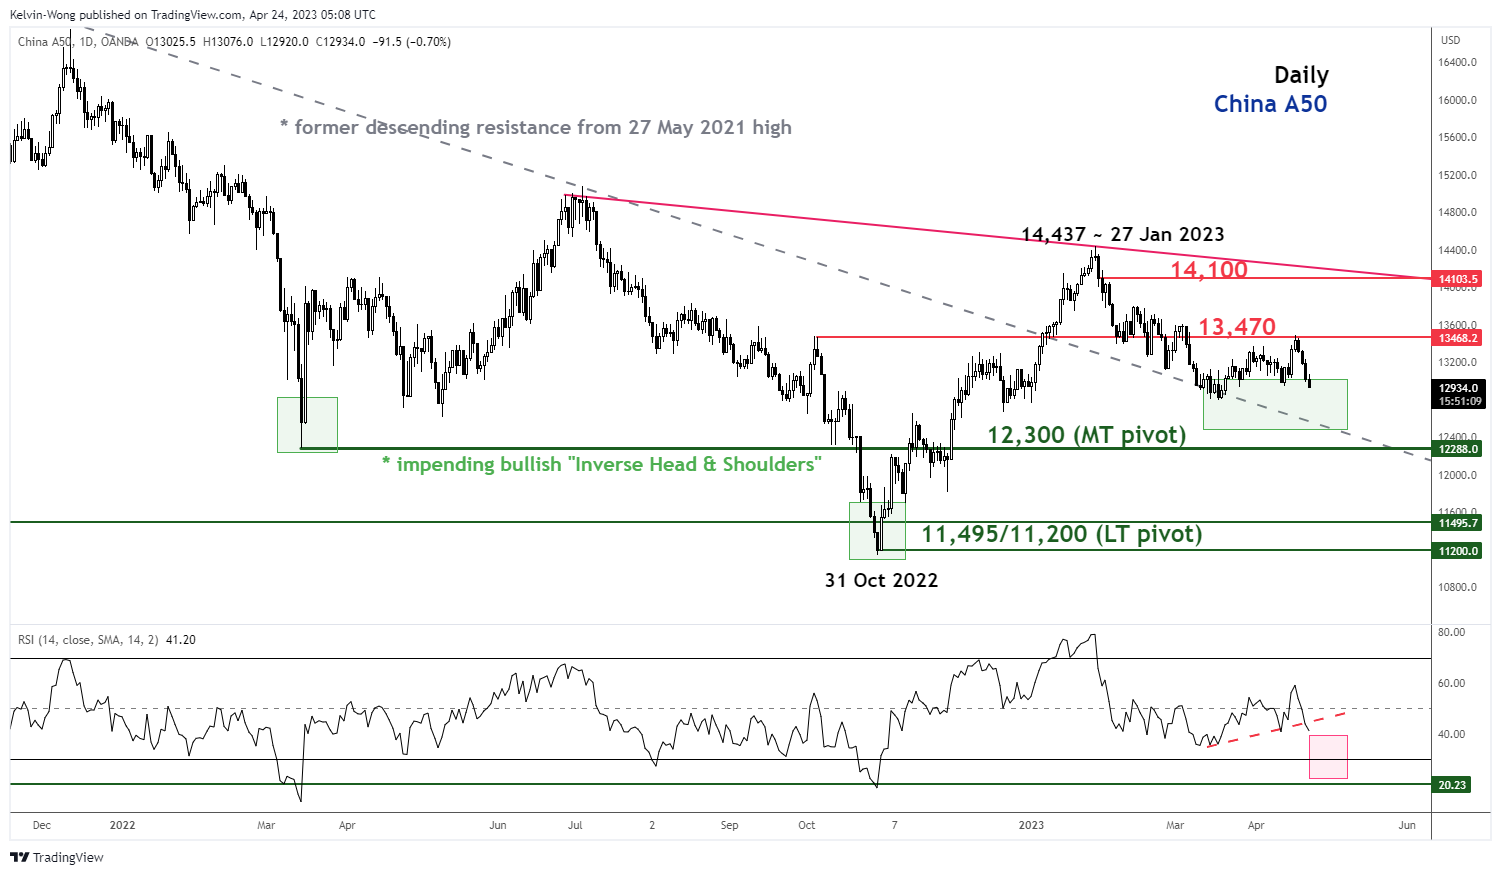
Source: TradingView as of 24 Apr 2023
Since its 27 January 2023 swing high of 14,437, the China A50 Index (a proxy for the FTSE China A50 futures) has declined by -11% and evolved into a short-term bearish trend with an intermediate resistance at 13,470.
Downside momentum remains intact as indicated by the daily RSI oscillator where it has just staged a bearish breakdown below a former corresponding ascending support at the 44% level and has the potential to inch lower before it reaches the oversold region of less than 30%.
If the 13,479 intermediate resistance is not surpassed to the upside, the Index may see the continuation of the short-term downtrend with support coming in at around 12,300, a medium-term pivotal level that also coincides with the former major descending resistance from the 27 May 2021 high.
A point to note is that the Index is still evolving in a potential long-term bullish impending “Inverse Head & Shoulders” configuration since the 15 March 2022 low.
CAD Under Pressure
USD/JPY pulls back
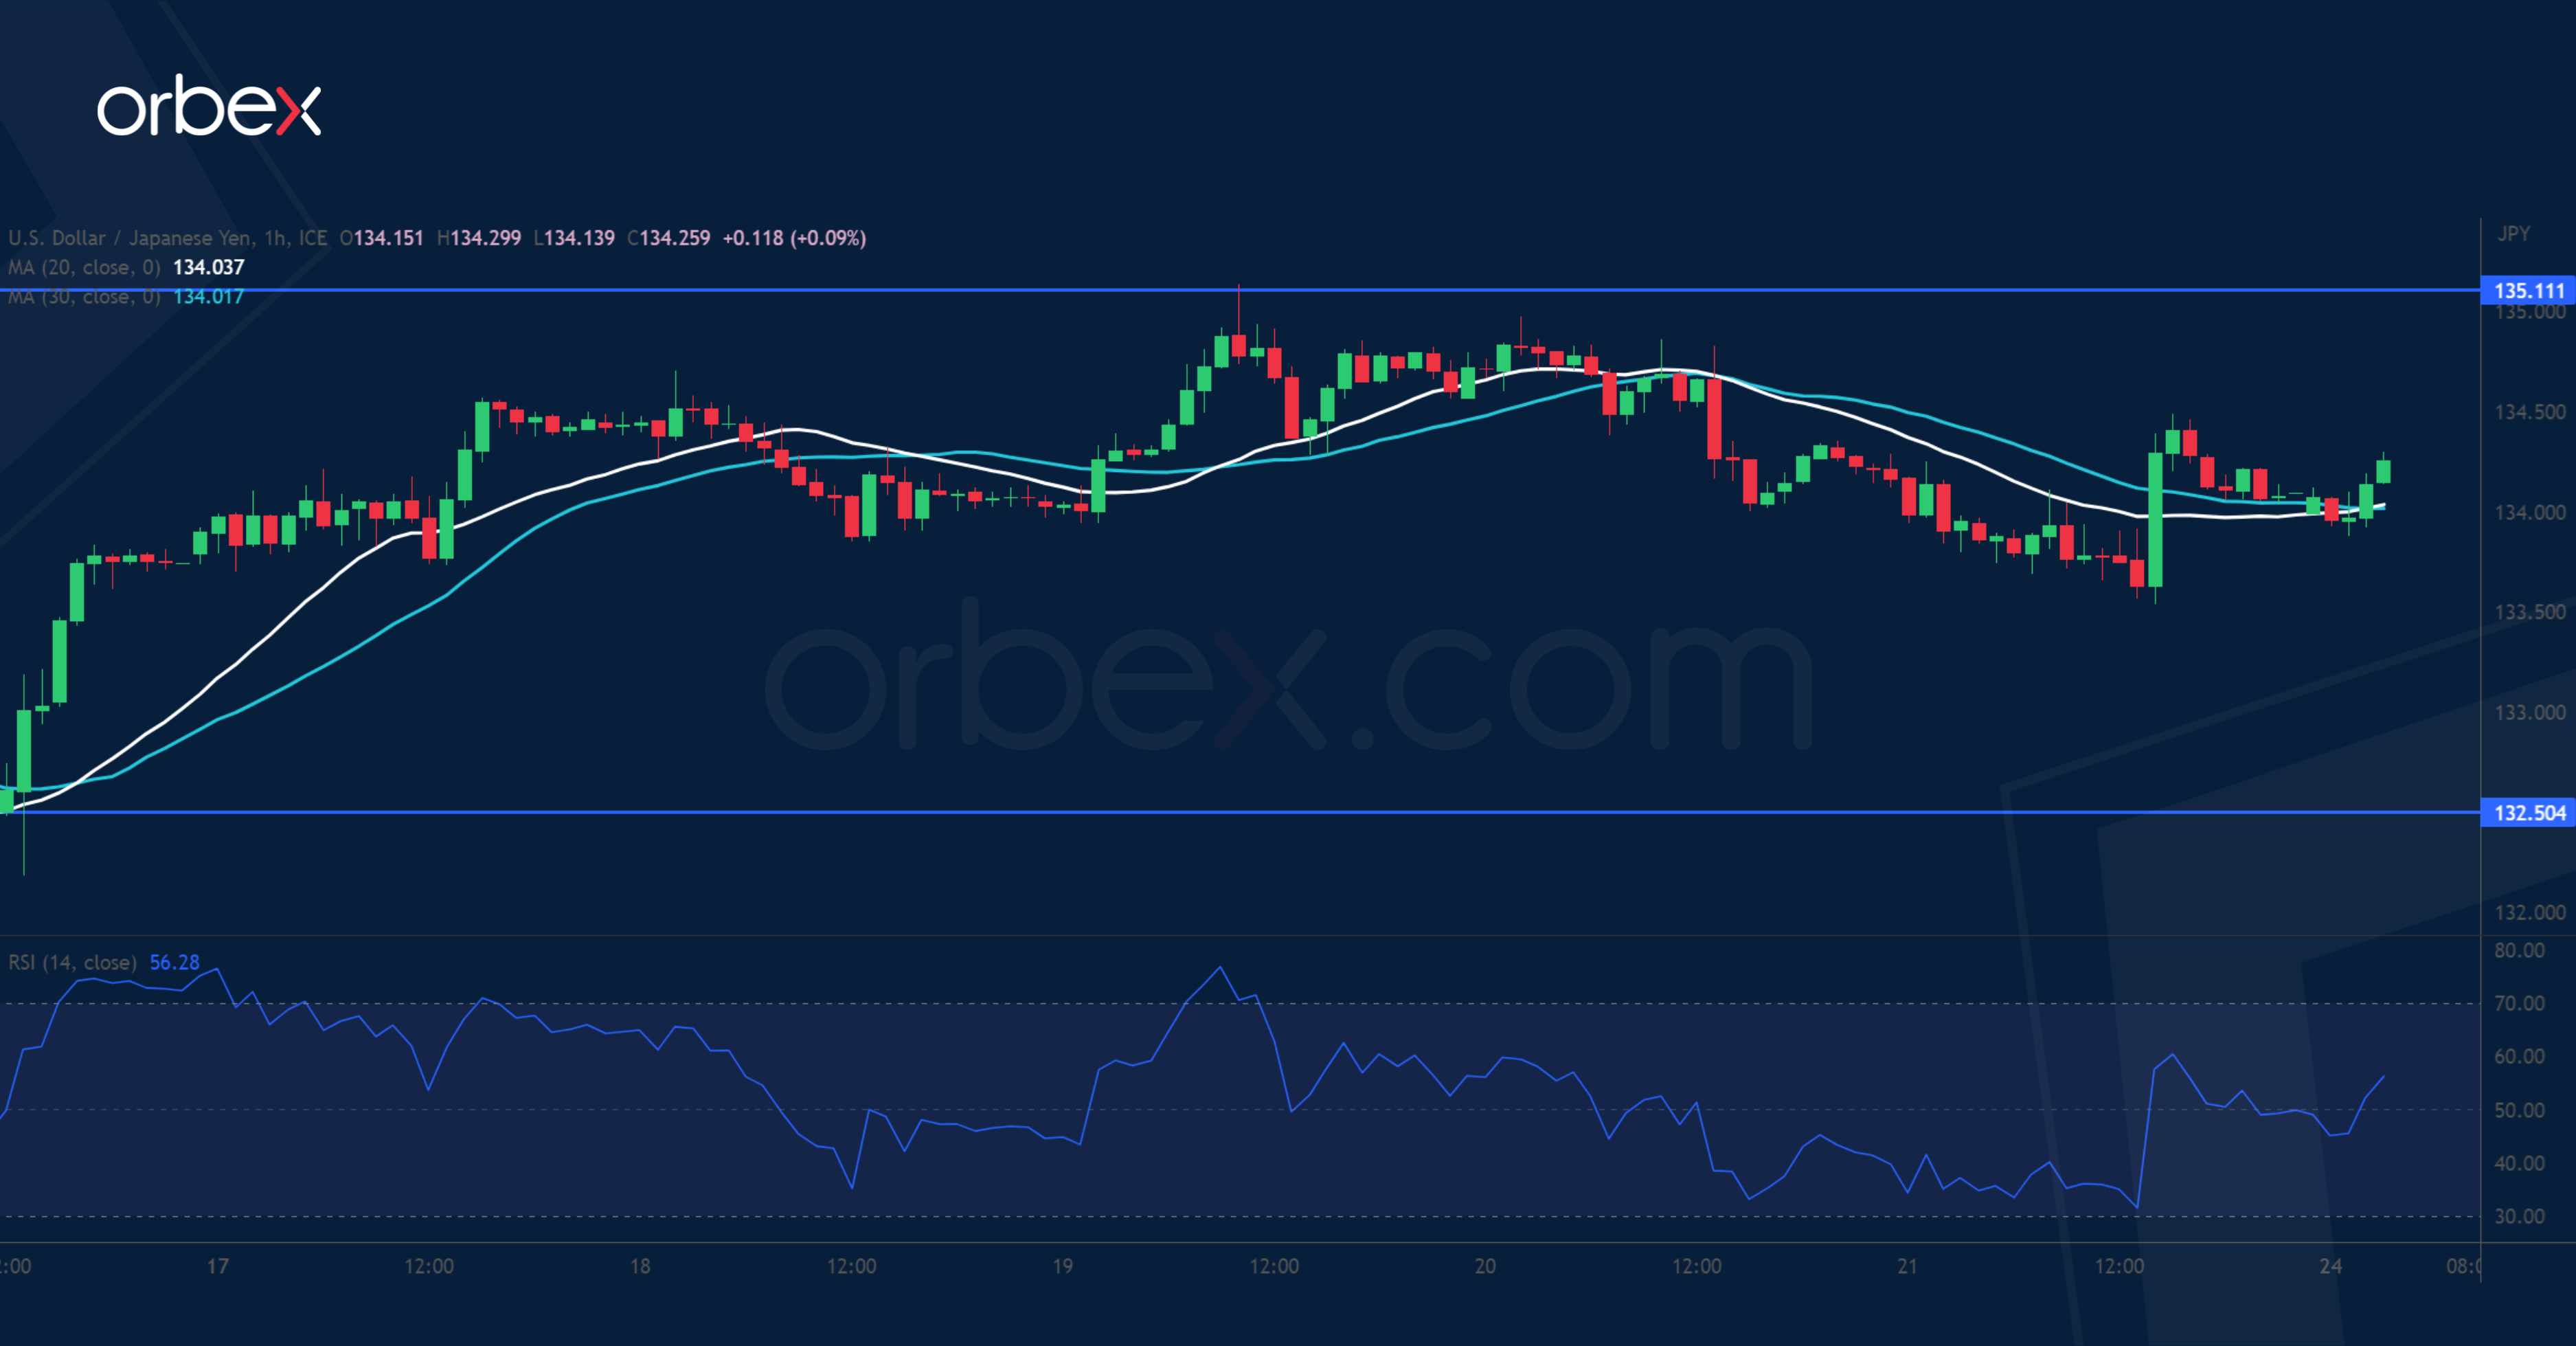
The Japanese yen edged higher as inflation in March gathered speed. The price has met stiff selling pressure at the start of the mid-March sell-off at 135.10. A shooting star pattern in this supply zone carries weight and indicates a strong rejection of that level. A fall below the immediate support and the round number of 134.00 might have given short-term bulls a signal to bag their profits, driving the quote lower. 132.50 is a daily support which coincides with the base of the recent bullish momentum, making it an important floor.
USD/CAD breaks key resistance
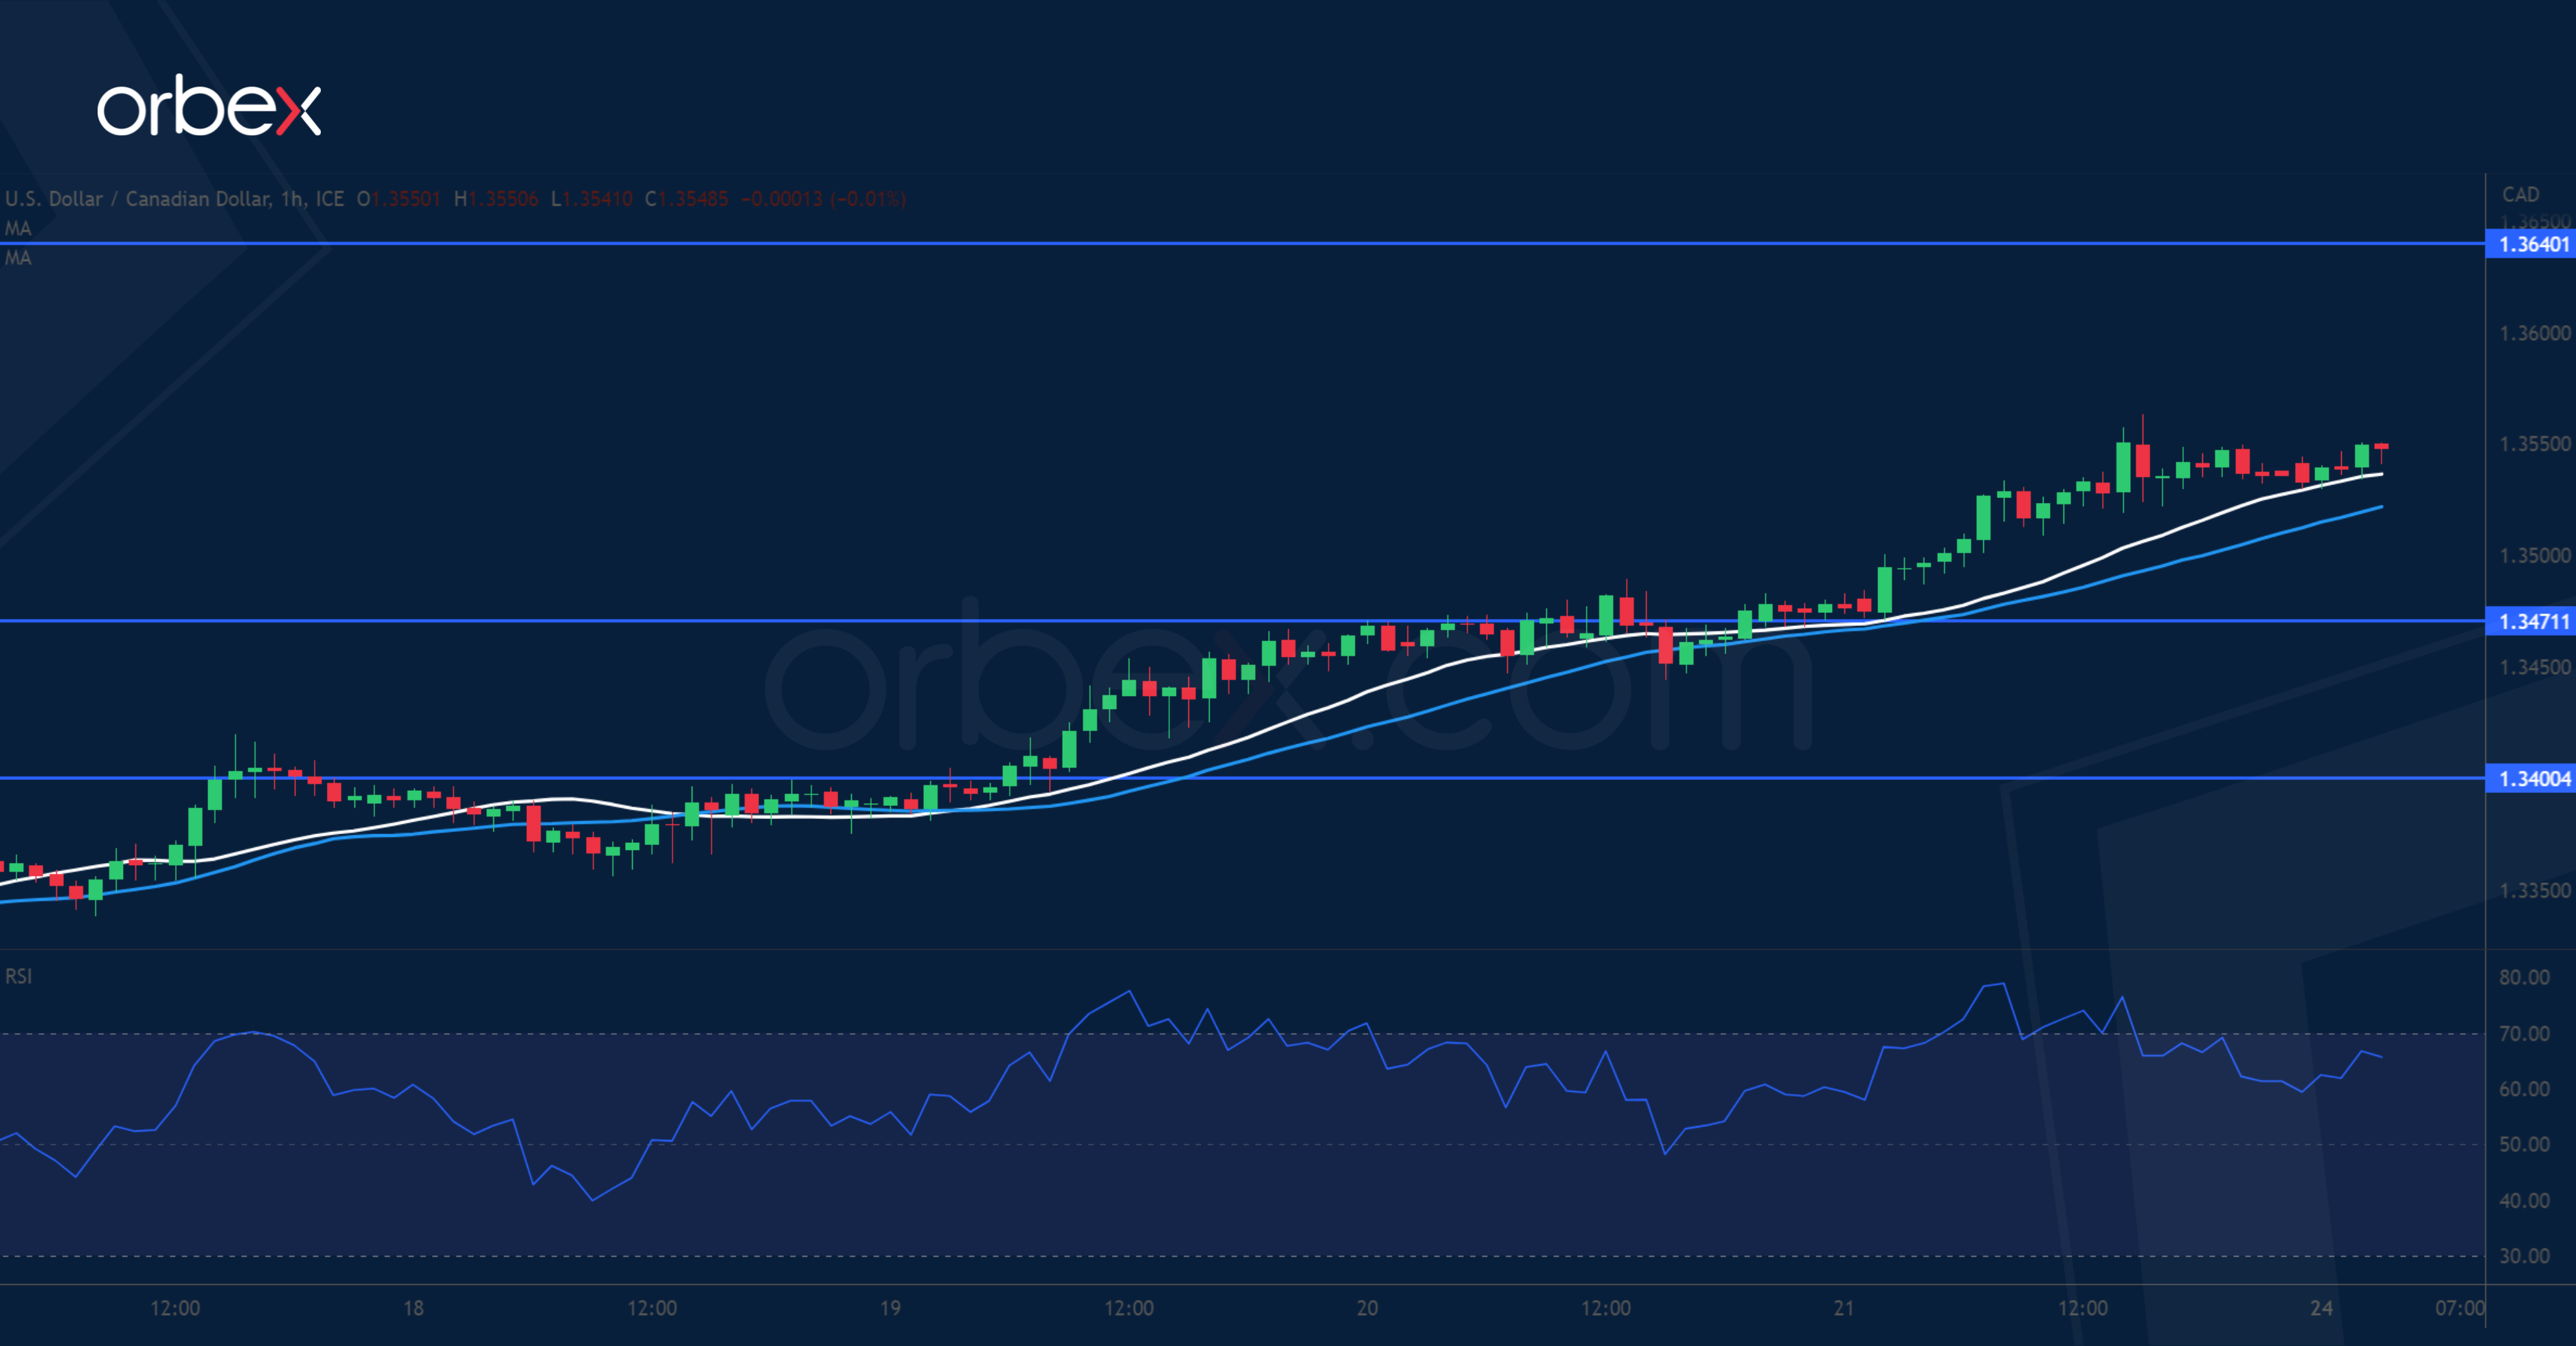
The Canadian dollar slipped after February’s retail sales fell well short of expectations. The pair has bounced back to the previous swing high of 1.3550 next to the 30-day SMA. A tentative breakout has prompted more sellers to cover and could pave the way for a potential extension towards 1.3640 and the recent peak near 1.3840. The RSI’s double top in the overbought area may temper the bullish drive. 1.3470 is the first level to expect a follow-through while 1.3400 is a second line of defence in case of a deeper pullback.
DAX 40 finds support
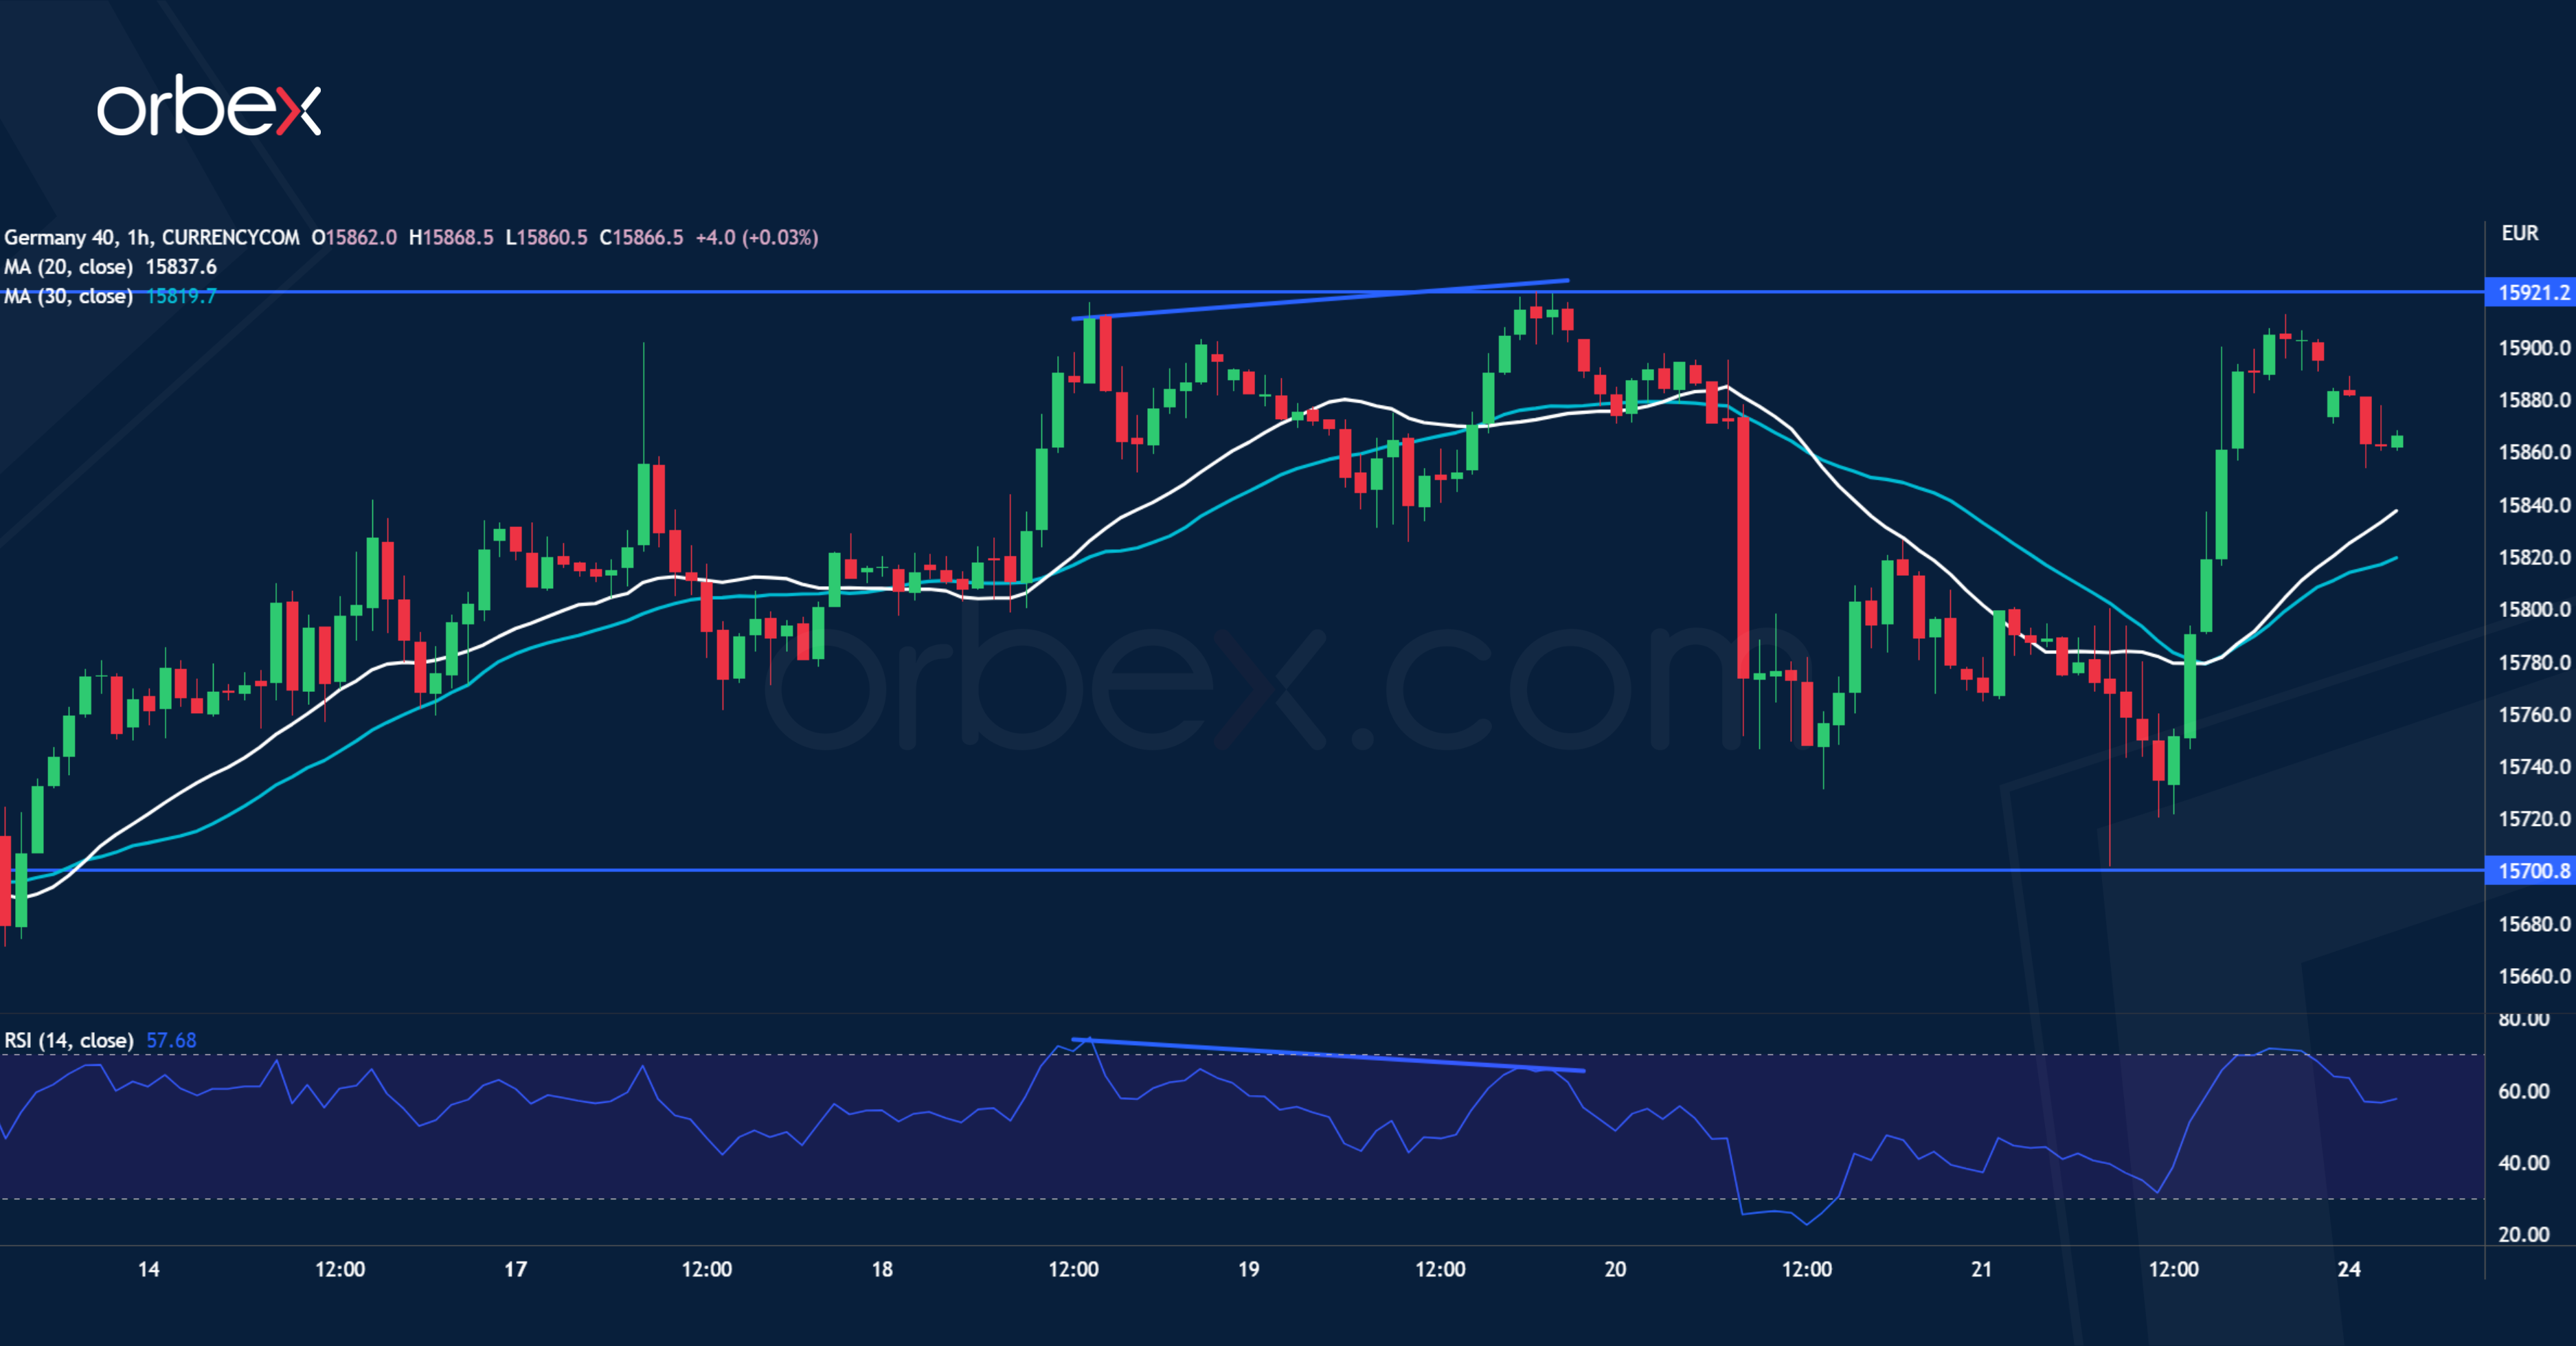
The Dax 40 bounces back on upbeat services PMI across Europe. Despite a bearish RSI divergence showing a slower momentum and a liquidation attempt below 15800, a sharp bounce off 15700 over the 20-day SMA suggests that trend followers were eager to buy the dip. A close above 15920 would resume the current rally and expose the psychological level of 16000 and the all-time high of 16300. On the downside, 15500 at the confluence of a previous swing low and the 30-day SMA is a major level to test the bulls’ resolve.
S&P Now Predicts Only a 0.5% Contraction in UK Real Output This Year
Markets
Friday’s consensus-beating EMU and US PMI’s caught the eye. European figures stressed the growing divergence between weakness in the manufacturing sector and resurging service sector activity. US data pointed to stronger demand conditions which support sharper growth in April and simultaneously bring around renewed inflation momentum. Markets especially responded to US figures given Fed market positioning. Markets discount a final 25 bps rate move by the Fed (as flagged in March dots), but also bet on significant rate cuts before year-end. After PMI’s, they stepped away from the latter idea somewhat. US Treasuries slightly underperformed German Bunds last Friday. US yields closed 3.5 bps to 4.2 bps higher across the curve. German yields increased by 2.6 bps (2-yr) to 4.4 bps (30-yr). Main US and European equity benchmarks gained up to 0.5%. EUR/USD’s attempt to regain the 1.10 figure was blocked by US PMI’s. Any rebound (USD supportive action) didn’t reach further than 1.0950 though. Fresh attacks are highly likely this week while the downside in EU and US yields should be protected ahead of next week’s policy meetings.
News flow is thin this weekend. We retain an FT article with active Belgian ECB member Wunsch. He wouldn’t be surprised if the ECB would have to go to 4%. Before the ECB can think about pausing its policy rate cycle, they need evidence that wage growth and core inflation are coming down. Our base case is for the ECB to deliver another 50 bps rate hike next week with a 4% peak rate likely during summer. Don’t look for that much additional clues on outcomes of next week’s ECB and Fed meetings this week. Fed members are already in their black-out period, with very few ECB policy makers scheduled on monetary-related topics ahead of Wednesday’s Purdah start.
Today’s eco calendar contains German Ifo business sentiment. Decent outcomes are expected after last week’s PMI’s. The Belgian debt agency holds its regular OLO auction. They tap OLO 85 (0.8% Jun2028), OLO 97 (3% Jun2033) and OLO 98 (3.3% Jun2054) for a combined €3-3.5bn. Year-to-Date, the Kingdom already raised €16.41bn in OLO funding compared to a €45bn target. Q1 earnings result from First Republic bank (after market close) are a wildcard for risk sentiment. Later this week, focus turns to US consumer confidence (tomorrow), Q1 GDP readings in the US (Thursday) and Europe (Friday), early national (April) European inflation figures (starting Thursday), PCE deflators (Friday) and the Bank of Japan policy meeting (Friday).
News and views
Rating Agency S&P upwardly revised the outlook on the UK’s AA credit rating from negative to stable as near term negative downside risks have reduced. The stable outlook reflects the UK’s stronger recent economic performance. S&P now predicts only a 0.5% contraction in UK real output this year. It also forecasts more contained budget deficits over the next two years as the UK government’s decision to abandon most of the unfunded budgetary measures proposed in September bolstered the fiscal outlook. S&P takes notice that the government’s energy support scheme has cost significantly less than anticipated because of the fall in energy prices. S&P now forecasts the general government deficit to average 3.7% of GDP over the 2023-25 period compared to 5.5% projected in September last year. S&P expects the government debt to begin declining from a high 97.7% of GDP in 2023.
Moody’s upwardly revised the Irish long term domestic and foreign credit rating to Aa3 from A1. The outlook on the rating was changed from positive to stable. Moody’s said the rating action was driven by a significant improvement of Ireland’s key fiscal and debt metrics and the agency’s expectation that this improvement will be resilient to potential shocks. S&P affirmed the long- and short-term local and foreign currency Greek credit ratings at BB+/B but revised its outlook to positive from stable Amongst others, the agency mentions structural reforms and economic resilience, along with EU support, have improved government finances and financial sector stability. S&P on Friday also affirmed Italy’s BBB rating. The outlook remains stable. The agency expects growth to decelerate in 2023 on the back of high inflation and tightening of credit conditions, before recovering in 2024. It mentions that fiscal consolidation is likely to be gradual and contingent upon growth outcomes or political pressures.
Modest Movements in Financial
Market movers today
The week starts off with a thin data calendar, German Ifo Index will be released for April, consensus is looking for a modest rise following the upbeat PMIs last Friday.
Later in the week, the focus turns to central banks. We expect Riksbank to hike rates by 50bp on Wednesday and Bank of Japan to make no changes on Friday (BoJ Preview, 21 April).
On the data front, Q1 GDP flash estimates will be released for euro area on Friday, and the US and Sweden on Thursday. On Friday, preliminary inflation data from Germany, France and Spain will also give us the first hints on how euro area inflation developed in April.
The FOMC has already entered the blackout period ahead of the meeting next week, but ECB's Panetta will be on the wires today.
The 60 second overview
It has been a mixed opening in the Asian equity markets with some modest gains in the Japanese equity market and modest losses in the Chinese and Hong Kong equity markets. US Treasury yield declined modestly this morning after having risen on Friday on the back of stronger US PMI data.
ECB's Wuncsh stated in a Financial Times interview that he could see ECB go to 4% and that ECB had to tighten monetary policy until they saw wage growth and core inflation decline. This supports our expectations that 4% will be the peak for ECB.
The cash balance at the US Treasury rose to the highest amount since March and is currently at USD 280bn. It was just USD 99bn on April 13. The recent rise was due to more tax payments rolling in, and help push the time limit further out before the Treasury runs out of money in order not reach the debt limit. Furthermore, the Republicans are looking to pass a bill that will increase the debt ceiling by USD 1.5tn, but President Biden is against the plan.
Ireland was upgraded on Friday by Moody from A1 to Aa3 and the outlook is stable. The upgrade was driven by the solid improvement in the public finances and reduction of the debt.
We have lifted our GDP forecast for 2023 to 6.2% from 5.5%, see China Macro Monitor - 2023 growth revised up to 6.2%, 24 April. It mainly reflects that Q1 was stronger than expected and thus provides a higher base for the year. However, we see growth momentum moving lower from here but still stay above potential growth for the rest of year. We see more pent-up demand in consumption, property and manufacturing investments. The recovery is still in its' early phase, though, where uncertainty and jitters over the sustainability is likely to remain. We expect the government will add more stimulus if needed to put the recovery on a firmer footing. For 2024 we have lowered the forecast from 5.2% to 5.0%.
Equities struggled for direction with bunches of earnings, a shift of tail risk focus from banks to debt ceiling and a difficult batch of macro data not providing much help either. S&P 500 closed up 0.1% and Stoxx 500 0.3%. With a lack of direction, defensives took the lead with staples and health care among the better performers. In fact, defensives beat the tape throughout the week with staples doing particularly well. US futures are a tad lower this morning too.
FI: US Treasury yields rose on Friday after stronger than expected US PMI data. 10Y Treasuries ended up 4bp higher and 2Y Treasuries ended up 3bp higher. However, the levels is still much lower than before the problems in the US banking sector, where 2Y US Treasury yields were up at 5% compared to today's level of 4.18%. This morning we have seen a modest decline in US Treasury yields in Asian trading hours.
FX: It is wait-and-see for FX markets before big central bank monetary policy meetings the coming weeks. EUR/SEK trades in the 11.30-35 range before the Riksbank meeting this week. USD/JPY holds steady close to 134 before Bank of Japan meets on Friday - new governor Ueda's first meeting. And EUR/USD trades in 1.09-1.10 range before next week's ECB and Fed meetings, where Fed may deliver the final hike of this cycle. NOK needs to clear this week's announcement on May's fiscal transactions by Norges Bank before attention turns to next week's meeting.
Credit: In an overall quite muted session, credit markets recovered somewhat from Thursday's sell-off, with iTraxx Xover 2bp tighter and Main 0.4bp. Primary market activity was subdued with only a couple of issuers coming to the market.
EUR/AUD Daily Outlook
Daily Pivots: (S1) 1.6299; (P) 1.6364; (R1) 1.6484; More...
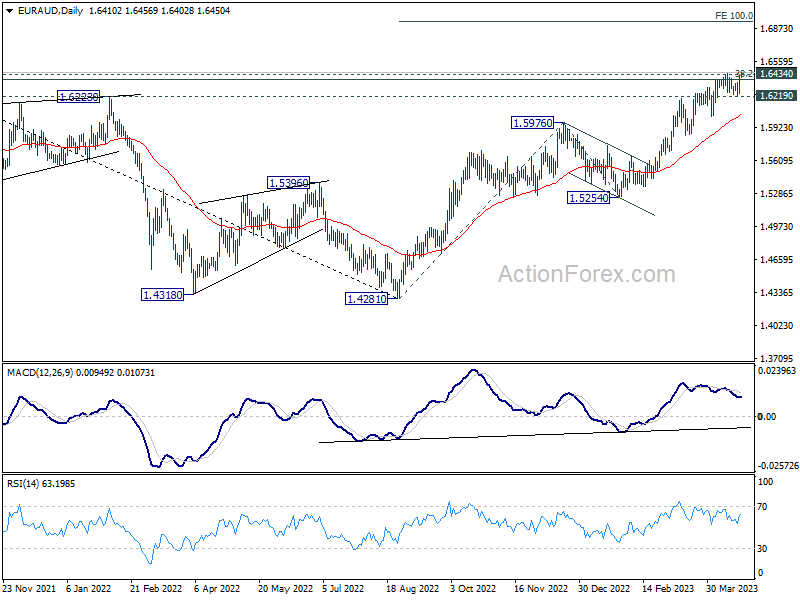
EUR/AUD's break of 1.6444 resistance suggests that up trend from 1.4281 is resuming. Intraday bias is now back on the upside for 100% projection of 1.4281 to 1.5976 from 1.5254 at 1.6949. For now, near term outlook will remain bullish as long as 1.6219 support holds, in case of retreat. Also, sustained trading above 1.6434/44 resistance will carry larger bullish implications.
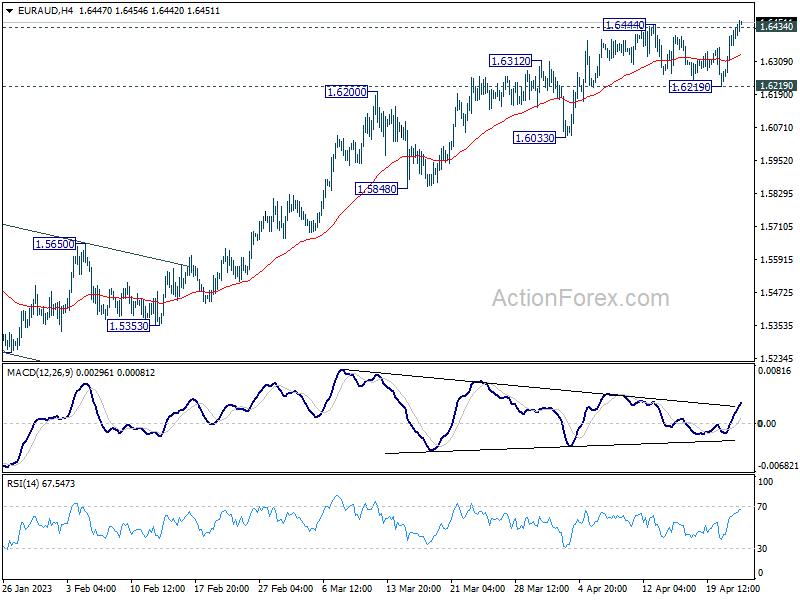
In the bigger picture, focus stays on 1.6389/6434 cluster resistance (38.2% retracement of 1.9799 to 1.4281 at 1.6389). Sustained break there should confirm that whole down trend from 1.9799 (2020 high) has completed. Further rally should then be seen to 61.8% retracement at 1.7691. However, rejection by this cluster resistance will make medium term outlook neutral at best.