

Sample Category Title
EUR/JPY Daily Outlook
Daily Pivots: (S1) 146.68; (P) 147.12; (R1) 147.84; More....
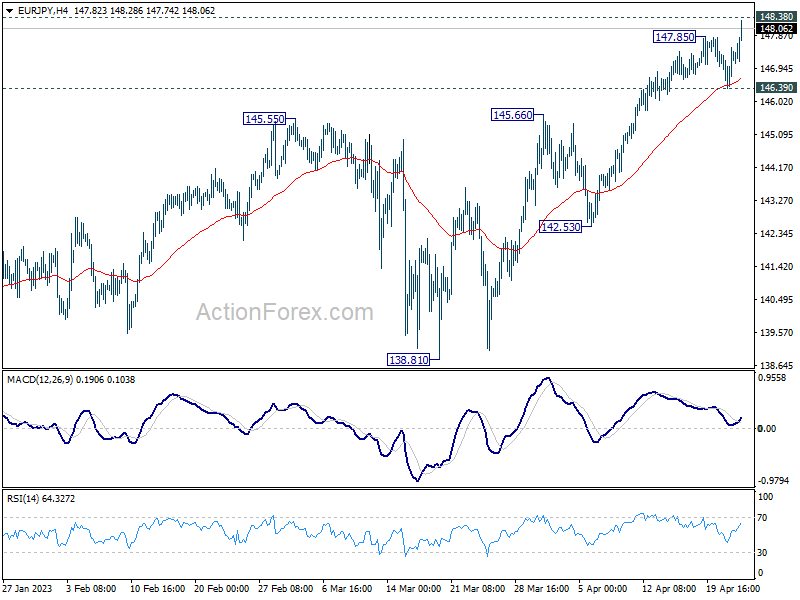
EUR/JPY's rally resumed by breaking through 147.85 and intraday bias is back on the upside. Decisive break of 148.38 will resume larger up trend to 149.75 long term resistance. For now, outlook will remain bullish as long as 146.39 support holds, in case of retreat.
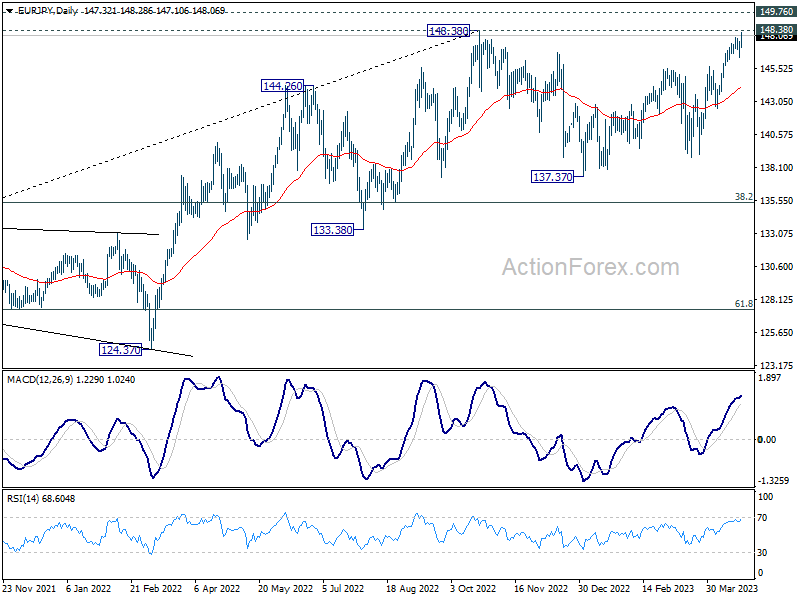
In the bigger picture, as long as 55 W EMA (now at 140.44) holds, larger up trend from 114.42 (2020 low) is still in progress for 149.76 long term resistance. Decisive break there will resume long term up trend. However, sustained break of 55 W EMA will bring deeper fall to 38.2% retracement of 114.42 to 148.38 at 135.40.
GBP/JPY Daily Outlook
Daily Pivots: (S1) 165.92; (P) 166.50; (R1) 167.48; More...
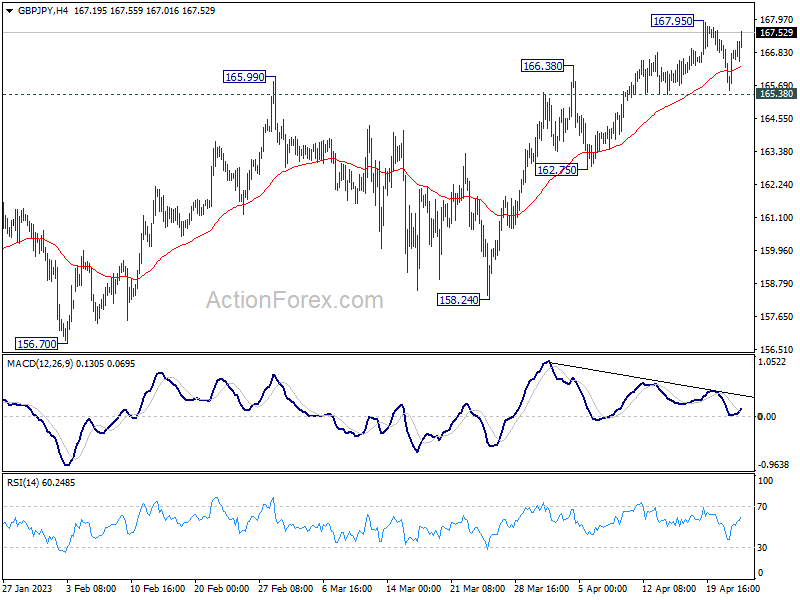
Intraday bias in GBP/JPY remains neutral for the moment, and further rally is expected as long as 165.38 support holds. On the upside, break of 167.95 will resume the rebound from 155.33 to 169.26 resistance. However, firm break of 165.38 will argue that the corrective pattern from 172.11 is starting another falling leg. Intraday bias will be back on the downside for 162.75 support and below.
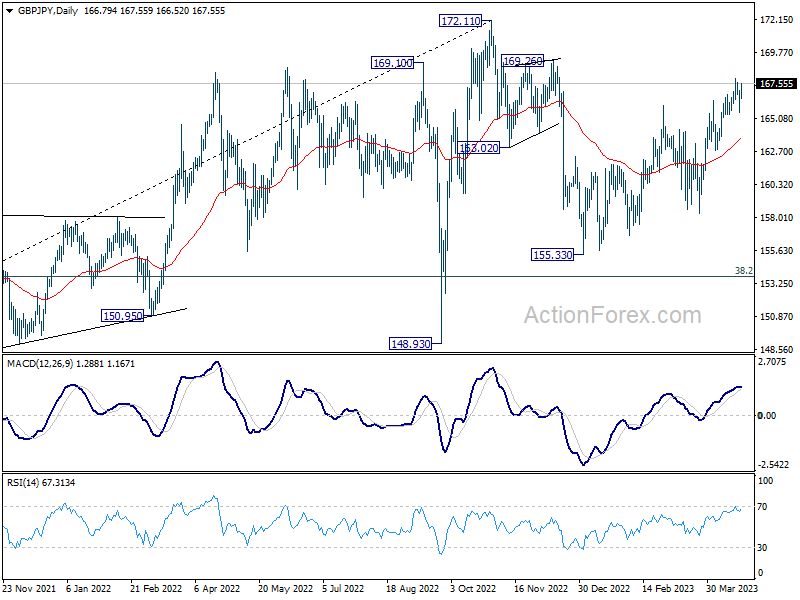
In the bigger picture, as long as 38.2% retracement of 123.94 (2020 low) to 172.11 (2022 high) at 153.70 holds, medium term bullishness is retained. That is, larger up trend from 123.94 (2020 low) is still in progress. Break of 172.11 high to resume such up trend is expected at a later stage.
EUR/CHF Daily Outlook
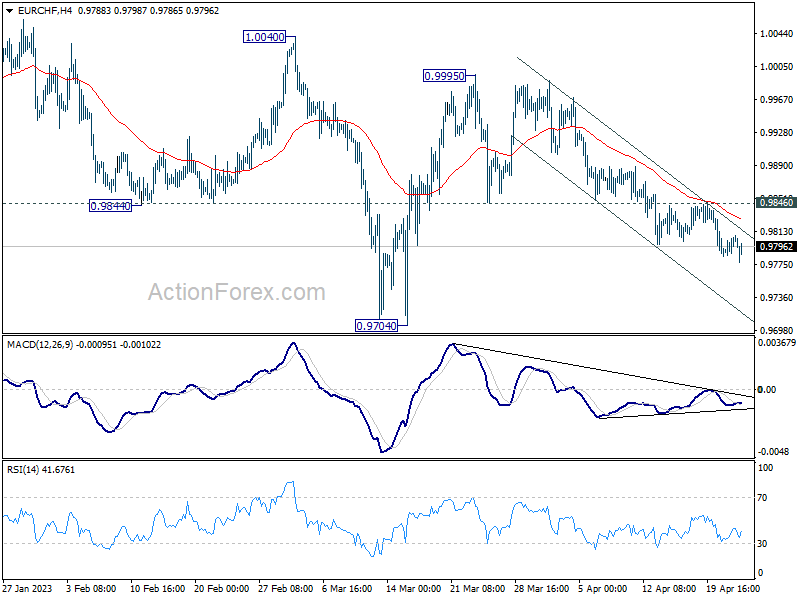
Daily Pivots: (S1) 0.9792; (P) 0.9800; (R1) 0.9814; More...
Intraday bias in EUR/CHF remains on the downside as the decline from 0.9996 is in progress. The fall is seen as part of the whole correction from 1.0095. Deeper fall would be seen to 0.9704 and below. On the upside, however, break of 0.9846 resistance will indicate short term bottoming, and turn bias back to the upside for stronger rebound.
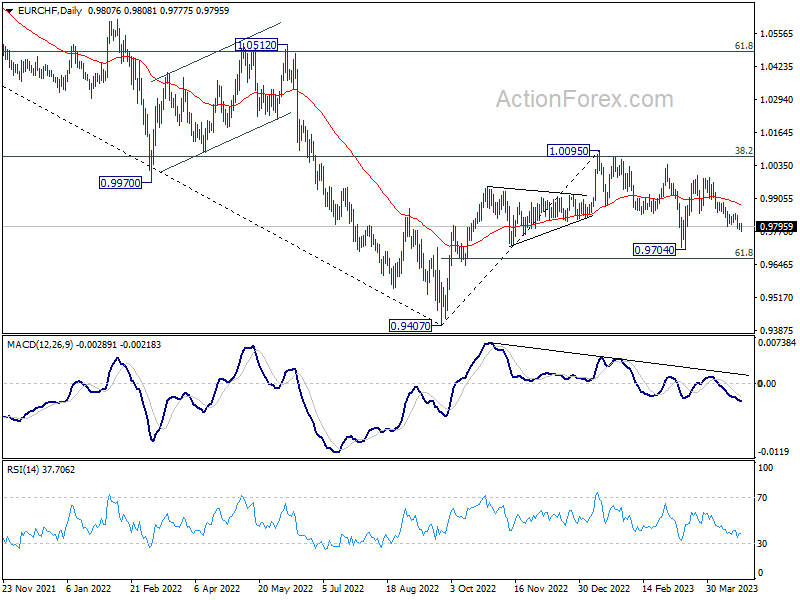
In the bigger picture, prior rejection by 55 W EMA (now at 0.9989) and 38.2% retracement of 1.1149 to 0.9407 at 1.0072 suggests that medium term outlook is staying bearish. That is, down trend from 1.2004 is not completed yet and is in favor to resume through 0.9407 at a later stage. However, decisive break of 1.0095 resistance will raise the chance of bullish trend reversal. Rise from 0.9407 should then target 1.0505 cluster resistance (2020 low at 1.0505, 61.8% retracement of 1.1149 to 0.9407 at 1.1484).
EUR/GBP Daily Outlook
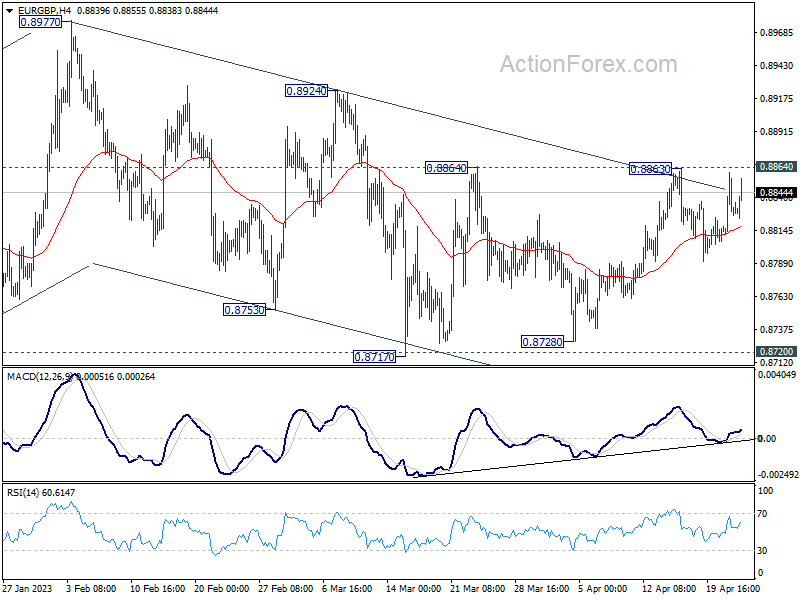
Daily Pivots: (S1) 0.8810; (P) 0.8835; (R1) 0.8858; More...
EUR/GBP is still staying in range below 0.8864 resistance and intraday bias remains neutral for the moment. On the upside, firm break of 0.8864 will extend the rebound from 0.8717 to 0.8924 resistance. Further break there should confirm completion of the choppy decline from 0.8977, and should resume larger rise from 0.8545 through 0.8977 high. However, decisive break of 0.8717 support will resume the decline from 0.8977 instead.
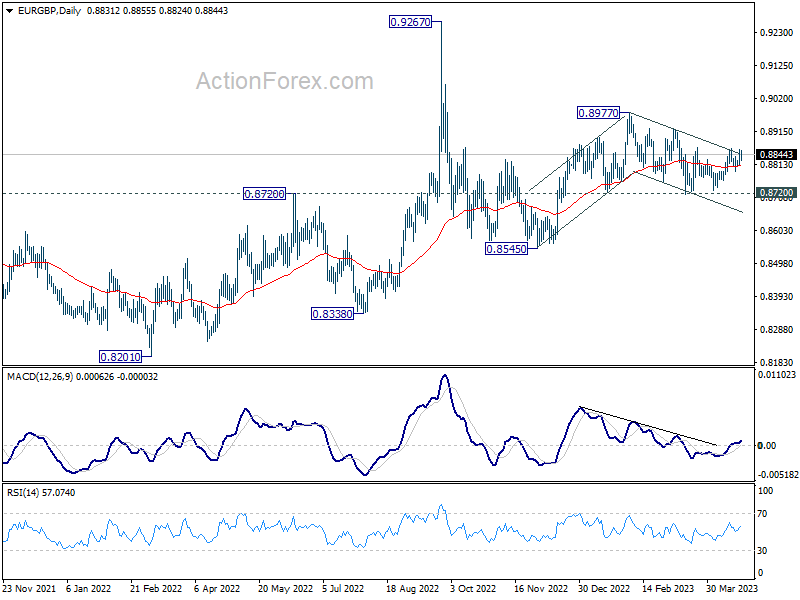
In the bigger picture, outlook remains rather mixed for now, except that price actions from 0.9267 (2022 high) are part of the long term range pattern from 0.9499 (2020 high). With 0.8720 support intact, rise from 0.8545 is in favor to continue through 0.8977. However, firm break of 0.8720 will argue that such rebound has completed, and open up deeper fall through this support level.
EURCHF Bears’ Resolve is About to be Tested
EURCHF is hovering around the 0.9790 area, having recorded a good move since the March 31 high of 0.9989. It is trading well inside the wide 0.9741-1.0006 rectangle that has dominated price action since October 13, 2022, but EURCHF is closing in on the lower boundary for this structure. EUR bears may enjoy another bearish breakout, but the overall technical picture is not on their side at the moment.
The Average Directional Movement Index (ADX) is trading at the highest since the significant September-December 2021 downleg. This means that a sideways move or a dip in the ADX would result in a pause in the current bearish move. It could get even worse for EUR bears as the stochastic oscillator is sending a double message. A bullish divergence has formed as the higher low in the EURCHF has been matched with a lower low in the stochastic. In addition, this indicator is hovering at its oversold area and hence a break higher would offer the EUR bulls sufficient evidence to take over the market reins.
Should this be the case, EUR bulls would have to overcome the 0.9823-27 range first. This is defined by the 200-day simple moving average (SMA) and the 38.2% Fibonacci retracement of the June 9, 2022 – September 26, 2022 downtrend respectively. Higher, the 50- and 100-day (SMAs) at the 0.9886-0.9899 area could prove tougher to crack.
On the other hand, the bears would have to deal with the 0.9741 level first, the lower boundary of the current rectangle. If successful, the November 14, 2022 low at 0.9706 appears to be a stronger support area, as seen at the mid-March breakout. Even lower, the 0.9650-0.9665 range, set by the January 15, 2015 low and the 23.6% Fibonacci retracement, could be targeted.
To sum up, EURCHF bears would prefer a continuation of the current short-term bearish move. However, strong evidence points to a sideways move, and potentially a reversal, soon.
Bundesbank: Inflation to remain high overall in coming months
In its latest monthly report, Bundesbank revealed that German economy performed better than anticipated in the first quarter of 2023. Despite persistently high inflation negatively impacting private consumption, industry experienced a stronger recovery. Additionally, goods exports saw a sharp increase, and construction industry temporarily boosted production. Improved economic performance during the winter months was also reflected in the labor market. Early indicators suggest further positive developments ahead.
Inflation rate fell notably to 7.8% in March, a 1.5 percentage point decrease from February. Bundesbank attributes this decline to a base effect. However, core inflation rate, excluding energy and food, climbed by 0.5 percentage points to reach a historic high of 5.9%. In the coming months, Bundesbank expects inflation rate to continue falling somewhat, particularly due to decreasing energy prices and a potential gradual easing in prices of food, other goods, and services. However, underlying price pressure is expected to remain high overall in the coming months.
BTC/USD Analysis: Is Bitcoin a Reserve Currency?
According to the IMF, at the end of 2022, the share of USD in the reserves of national banks of different countries was 58%; to compare, in 1999, its share was over 70%. At the same time, more and more countries are calling for abandoning the dollar in trade.
Bloomberg writes that USD value is under pressure because of:
→ tough Fed policy;
→ banking crisis in the US;
→ strengthening of the yen and yuan.
At the same time, Arthur Hayes, co-founder of the BitMEX exchange, has opined that bitcoin can become a reserve currency — in his opinion, the exchange rate of the main cryptocurrency against the US dollar can reach 1 million.
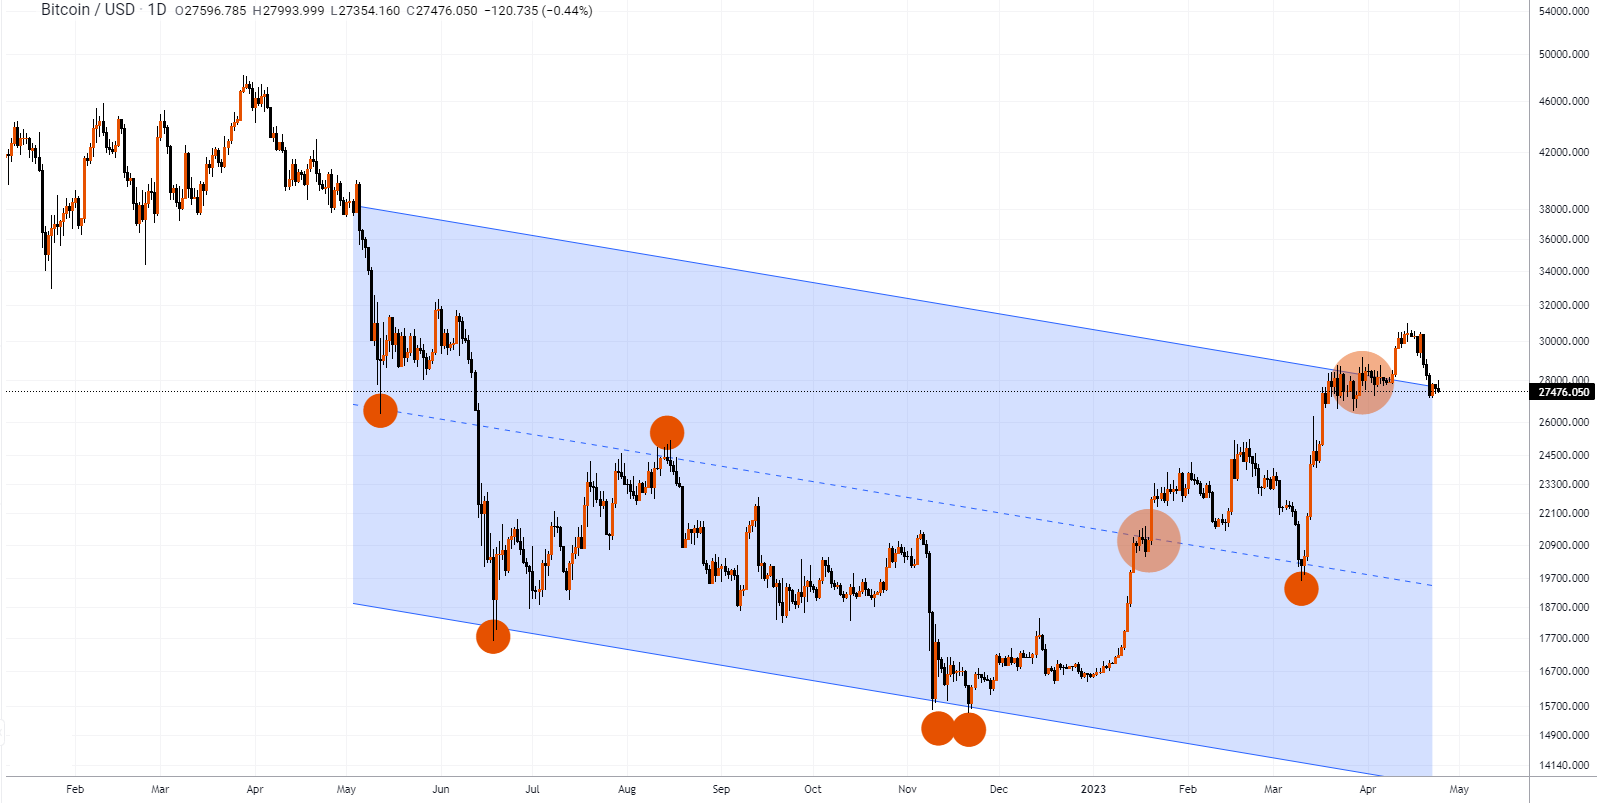
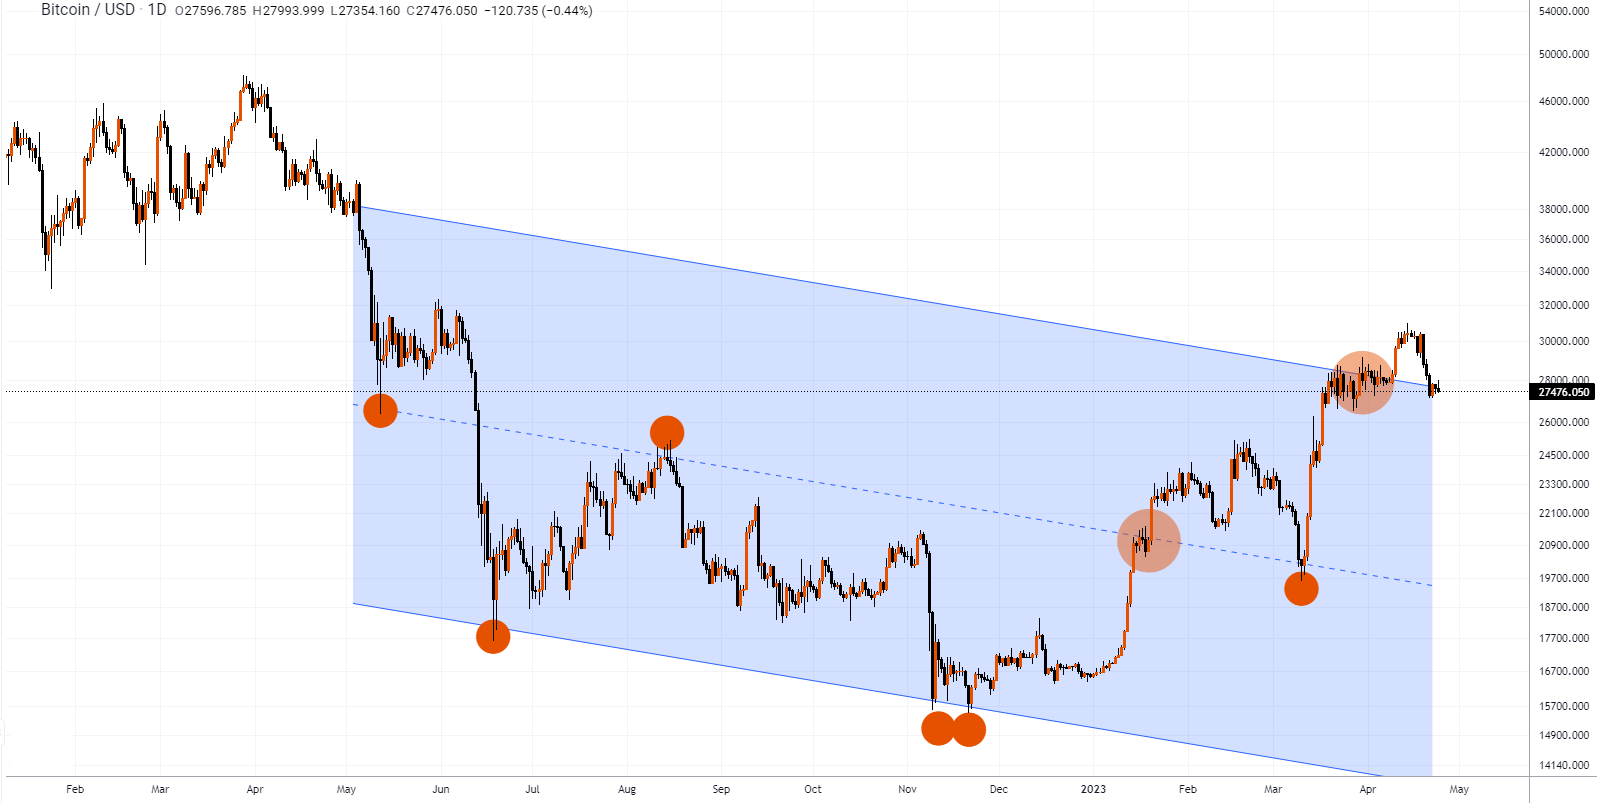
The bold predictions of crypto enthusiasts are becoming more fantastic as the BTCUSD chart forms a bearish pattern — a false bullish breakout of a long-term downward channel. Orange marks indicate price action, which confirms the validity of the channel: if the price continues to move within it, the scenario of a decline to the USD 20k level will become more realistic.
S&P 500 Analysis: A Hot Week of the Reporting Season Is Coming
More than a third of the companies whose shares are included in the S&P 500 index will report their earnings this week.
Bank of America analysts note that of the companies that have already released their first-quarter earnings, 27 have raised their earnings-per-share expectations — the best start to the season since 2012.
However, despite a promising start to the reporting season, the S&P 500 was down last week (and has also been bearish since Monday morning). According to Business Insider, this could be due to several factors:
→ reports look positive because forecasts were initially lower;
→ the impact of the banking crisis is not yet fully reflected in the results of companies;
→ the growing risk of default on federal debt is factored into the stock market valuation. The cost of CDS (insurance against default) updates multi-month highs.
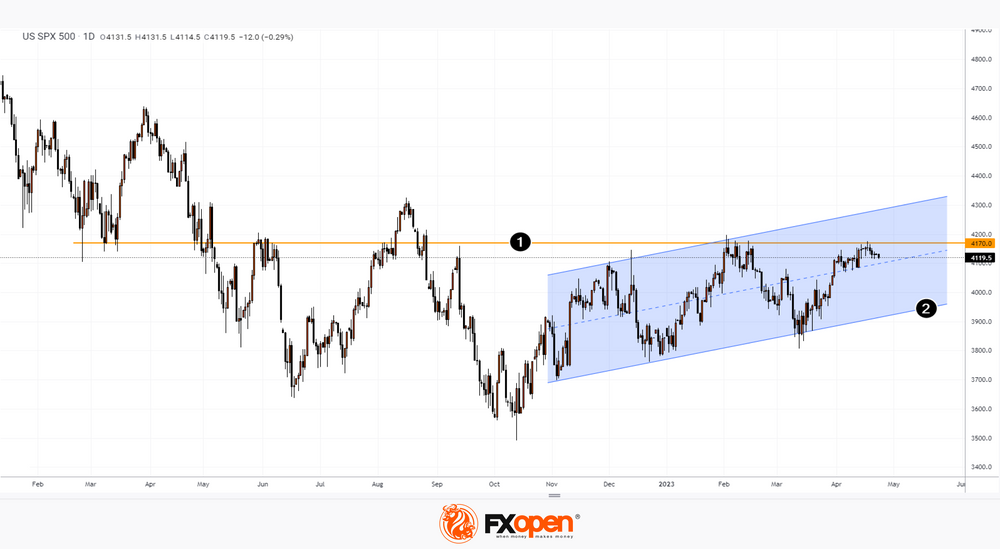
Also, from the technical side, note the restraining influence of the resistance line (1) 4,170, which we have pointed out several times. If the reports this week turn out to be disappointing, this may lead to a bearish breakdown of the median line of the current channel (shown in blue), which will open up the prospect of another descent to its lower border (2).
EURUSD Sustains Hopes for Bullish Continuation
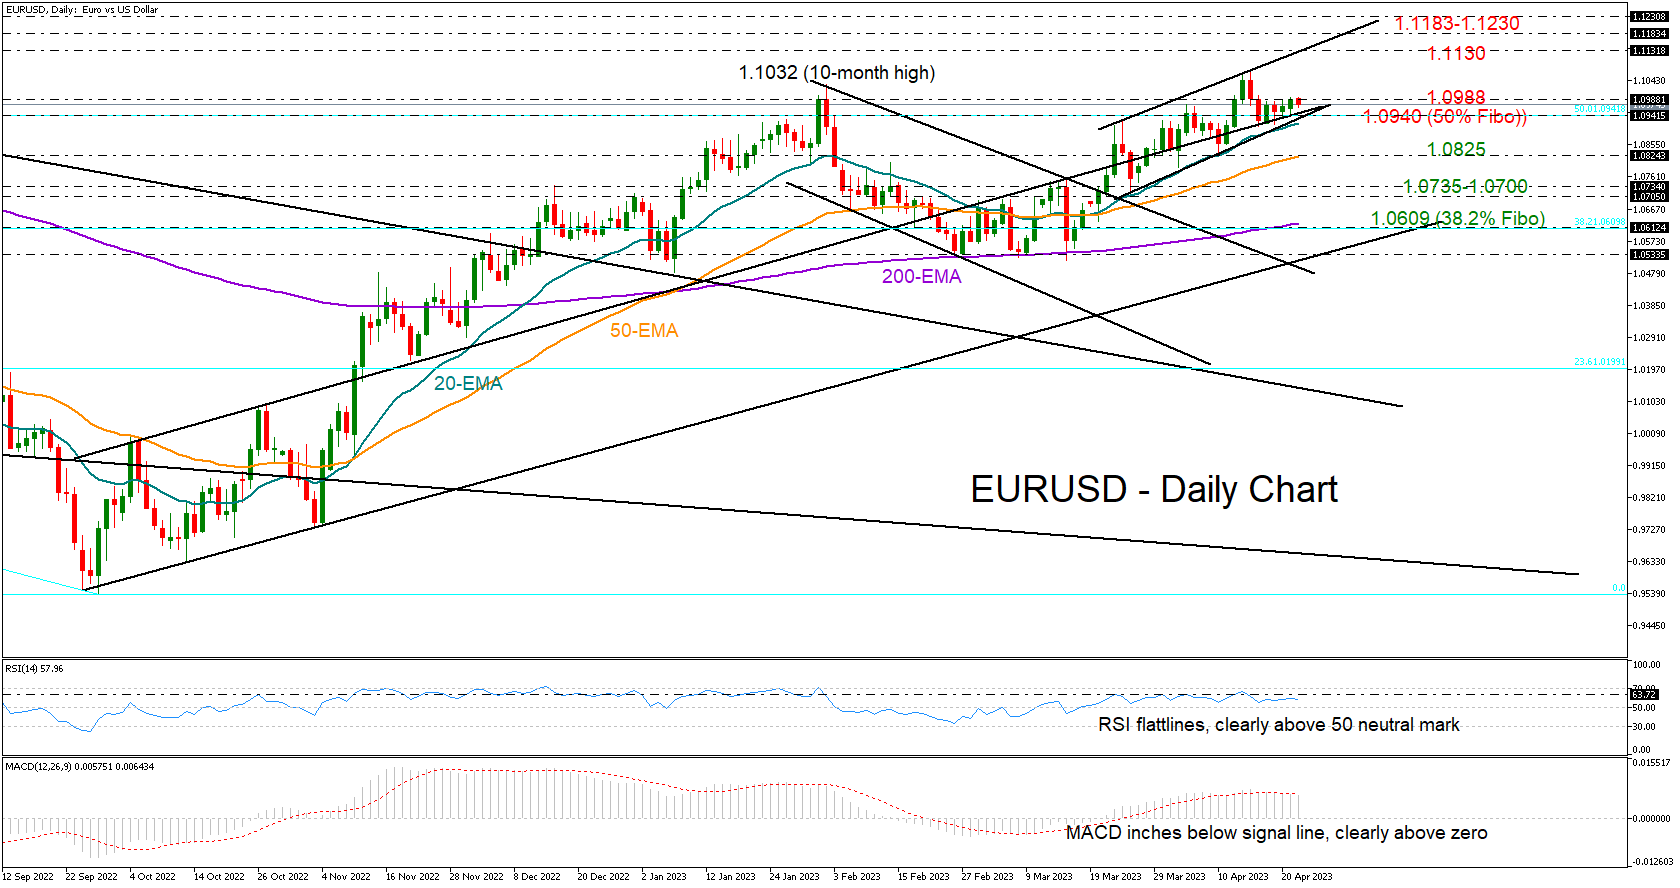
EURUSD opened with weak momentum on Monday, tiptoeing sideways within last week’s tight range of 1.0940-1.0988.
Despite the muted tone in the market, the technical picture remains encouraging. The price has been trading within a short-term bullish channel over the past month and slightly above its exponential moving averages (EMAs), while it recently secured a strong foothold around the 50% Fibonacci retracement of the 2021-2022 downtrend and the ascending line from October.
Meanwhile, some caution might be necessary as the RSI and the MACD seem to be losing impetus. Yet, the former is still fluctuating comfortably above its 50 neutral mark, while the latter is also clearly above its zero line, endorsing the positive trajectory in the market.
If the bulls cross above the 1.0988 border, which they could not successfully claim in February, the recovery may speed up towards the channel’s upper boundary seen around 1.1130. A continuation above the 1.1183-1.1230 zone could then clear the way towards the 1.1365 resistance and the 61.8% Fibonacci of 1.1450.
Alternatively, the pair may come under renewed selling pressure if the 1.0940 support region collapses and the price slides below its 20-day EMA. If that proves to be the case, the 50-day EMA currently at 1.0825 may immediately attract attention ahead of the 1.0735-1.0700 area. Moving lower, the bears may next target the 200-day EMA and the 38.2% Fibonacci level of 1.0609.
In brief, the short-term risk for EURUSD remains skewed to the upside, sustaining hopes for a bounce up to the channel’s upper bar despite the latest horizontal move in the price.
Cryptocurrencies Have Cleared Overbought Conditions
Market Picture
The total capitalisation of the crypto market fell 8.6% last week to $1.16 trillion, according to CoinMarketCap, returning to consolidation levels in early April.
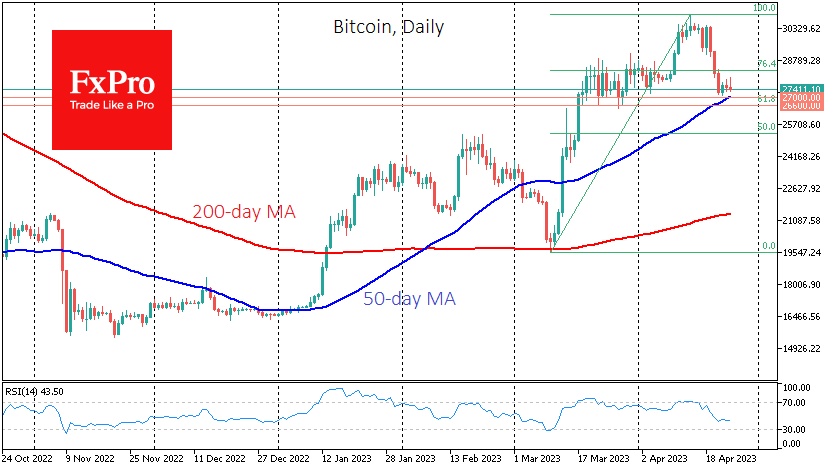
Bitcoin has fallen 8.2% in the last seven days to $27.4K but is consolidating near levels from the second half of March. The market has erased its previous growth momentum and is now testing the strength of the medium-term uptrend in the form of the 50-day moving average (now at $27K). A break below this would call into question the bull market’s strength, while a consolidation below $26.6K could be the prologue to a more profound decline.
Ethereum lost 11.7% to $1850, also approaching a test of its 50-day at $1800, while other leading altcoins in the top 10 fell between 5.7% (BNB) and 16.2% (Solana).
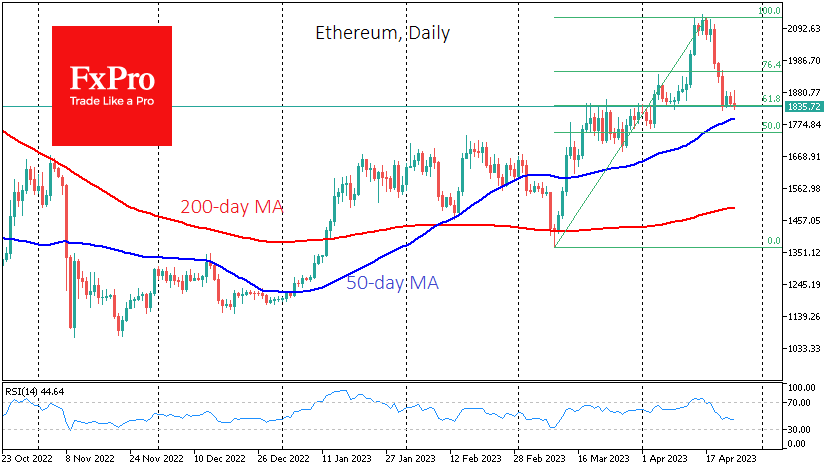
Technically, the pullback in cryptocurrencies has cleared the accumulated overbought conditions, which is good for potential buyers. However, short-term traders would be wise to keep an eye on the near term as the risk of a sharp decline has increased.
News background
The US Congress is aiming for a bipartisan cryptocurrency bill. According to The Block, a bill could be drafted by the end of May.
According to ultrasound.money, the Ethereum market supply has dropped by more than 100,000 ETH since The Merge update. The deflation on the network after the move to PoS was 0.15% on a year-over-year basis.
Metropolitan Commercial Bank, one of the top 10 most efficient banks in the US in 2022, has notified the SEC of its withdrawal from cryptocurrency-related business due to the recent collapse of Silvergate Bank, Silicon Valley Bank and Signature Bank and regulatory pressure.
The Canadian Teachers’ Pension Fund of Ontario (OTPP) withdrew from cryptocurrency investments after investing $95 million in the bankrupt FTX crypto exchange.
Wallet developers have added the ability to buy Bitcoin via the Telegram messenger’s web interface. Previously, the feature was only available through a text bot in the messenger.