
Sample Category Title
AUD/USD Daily Report
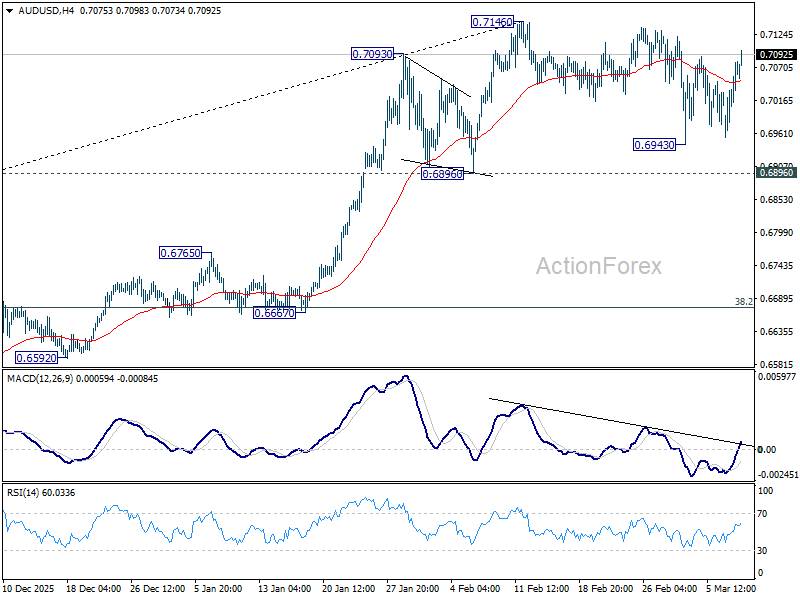
Daily Pivots: (S1) 0.6995; (P) 0.7037; (R1) 0.7119; More...
AUD/USD is still bounded in established range below 0.7146 despite some volatility. Intraday bias stays neutral for the moment. Outlook stays bullish with 0.6896 support intact. On the upside, break of 0.7146 will resume larger up trend to 0.7206 fibonacci level. However, firm break of 0.6896 will indicate that a larger scale correction is underway, and target 38.2% retracement of 0.5913 to 0.7146 at 0.6675.
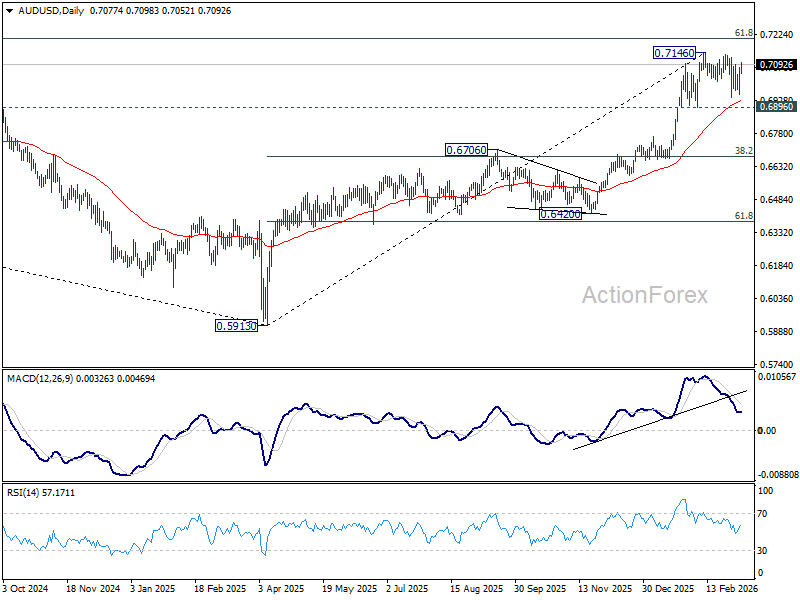
In the bigger picture, current development argues that rise from 0.5913 (2024 low) is reversing whole down trend from 0.8006 (2021 high). Further rally should be seen to 61.8% retracement of 0.8006 to 0.5913 at 0.7206. This will remain the favored case as long as 0.6706 resistance turned support holds, even in case of deep pullback.
EUR/USD Daily Outlook
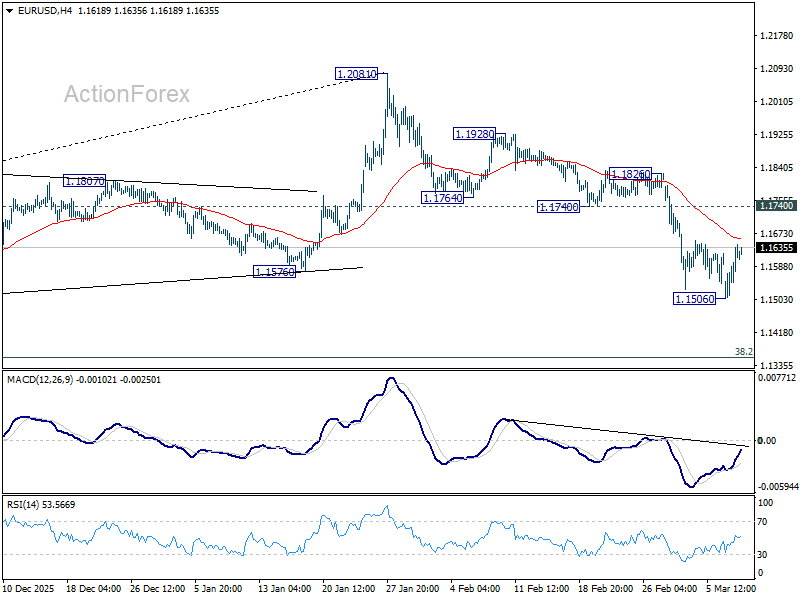
Daily Pivots: (S1) 1.1548; (P) 1.1594; (R1) 1.1681; More….
Intraday in EUR/USD is turned neutral again with current recovery, and more consolidations would be seen above 1.1506. Still, outlook stays bearish with 1.1740 support turned resistance intact. On the downside, below 1.1506 will resume the fall from 1.2081 to 38.2% retracement of 1.0176 to 1.2081 at 1.1353 next.
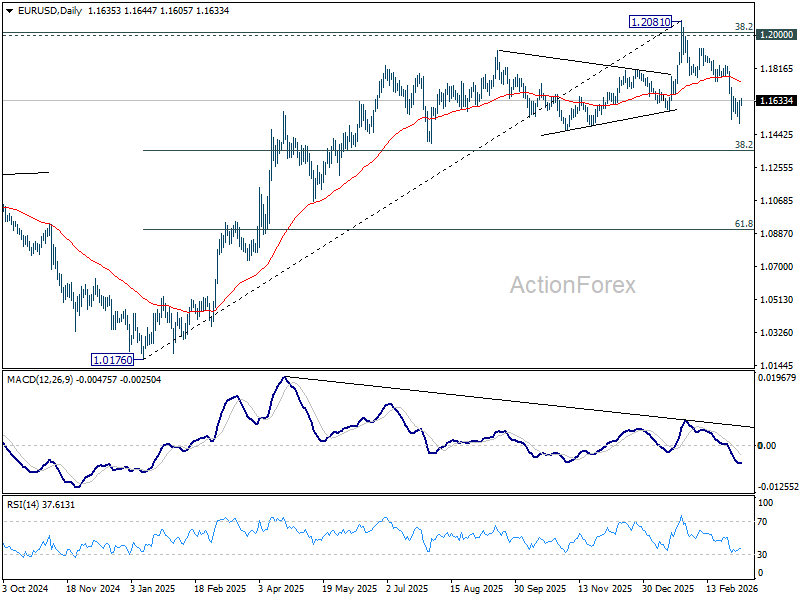
In the bigger picture, a medium term top should be in place at 1.2081 on bearish divergence condition in D MACD. Sustained trading below 55 W EMA (now at 1.1500) should confirm rejection by 1.2 key cluster resistance level. That would also raise the chance that whole up trend from 0.9534 (2022 low) has completed as a three wave corrective bounce too. For now, medium term outlook is neutral at best as long as 1.2081 holds, even in case of rebound.
GBP/USD Daily Outlook
Daily Pivots: (S1) 1.3332; (P) 1.3389; (R1) 1.3497; More...
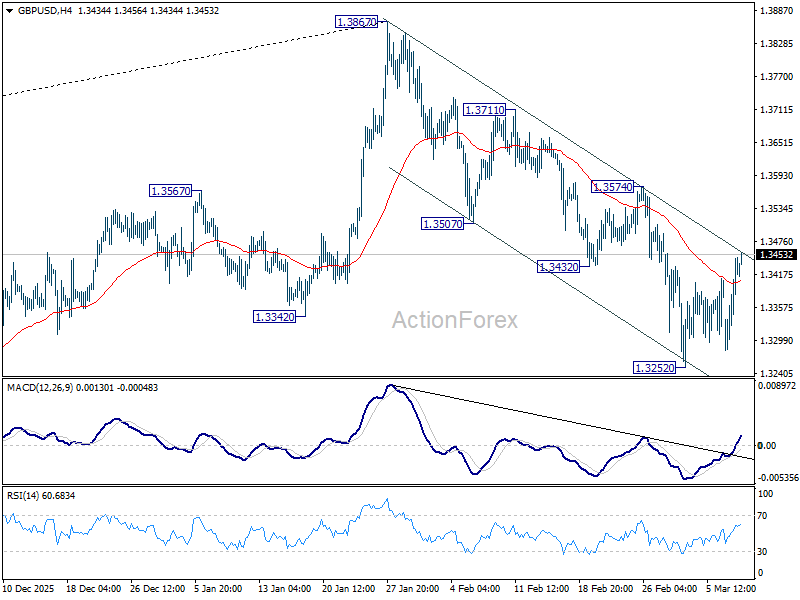
Intraday bias in GBP/USD stays neutral at this point. Risk remains on the downside with 1.3574 resistance intact, and further fall is in favor. On the downside, below 1.3252 will extend the decline from 1.3867 to 1.3008 structural support. Decisive break there will carry larger bearish implications.
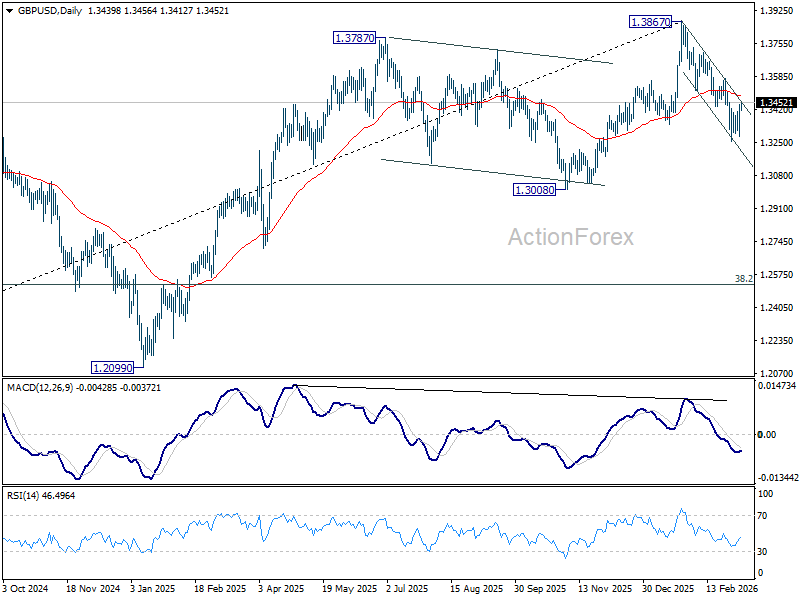
In the bigger picture, considering bearish divergence condition in both D and W MACD, a medium term top should be in place from 1.3867. Firm break of 1.3008 support will argue that fall from 1.3867 is at least corrective the whole rise from 1.0351 (2022 low) with risk of bearish reversal. That would open up further decline to 38.2% retracement of 1.0351 to 1.3867 at 1.2524. For now, medium term outlook will be neutral at best as long as 1.3867 resistance holds, or under further development.
USD/CHF Daily Outlook
Daily Pivots: (S1) 0.7751; (P) 0.7792; (R1) 0.7814; More….
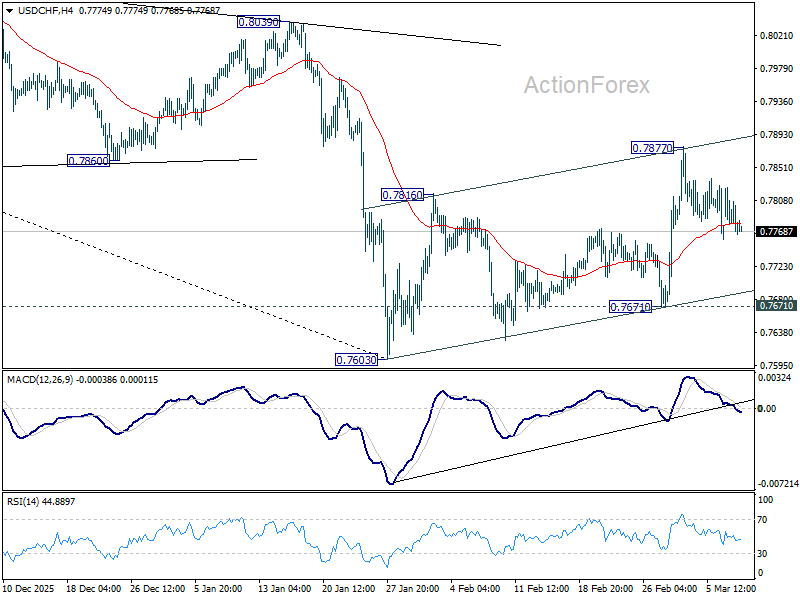
Intraday bias in USD/CHF stays neutral as range trading continues. On the downside, break of 0.7671 support will revive near term bearishness and bring retest of 0.7603 low. Decisive break there will resume larger down trend. On the upside, though, break of 0.7877 will bring stronger rally to 0.8039 resistance next.
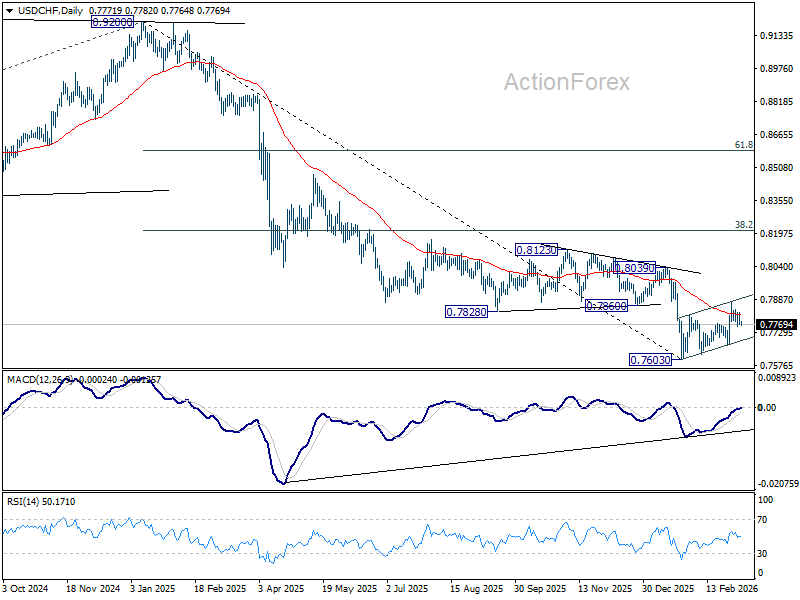
In the bigger picture, a medium term bottom could be in place at 0.7603 on bullish convergence condition in D MACD, Firm break of 0.8039 resistance will argue that it's at least correcting the down trend from 0.9002. Stronger rebound would then be seen to 38.2% retracement of 0.9200 to 0.7603 at 0.8213. However, break of 0.7603 will resume the down trend to 100% projection of 1.0146 (2022 high) to 0.8332 from 0.9200 at 0.7382.
USD/JPY Daily Outlook
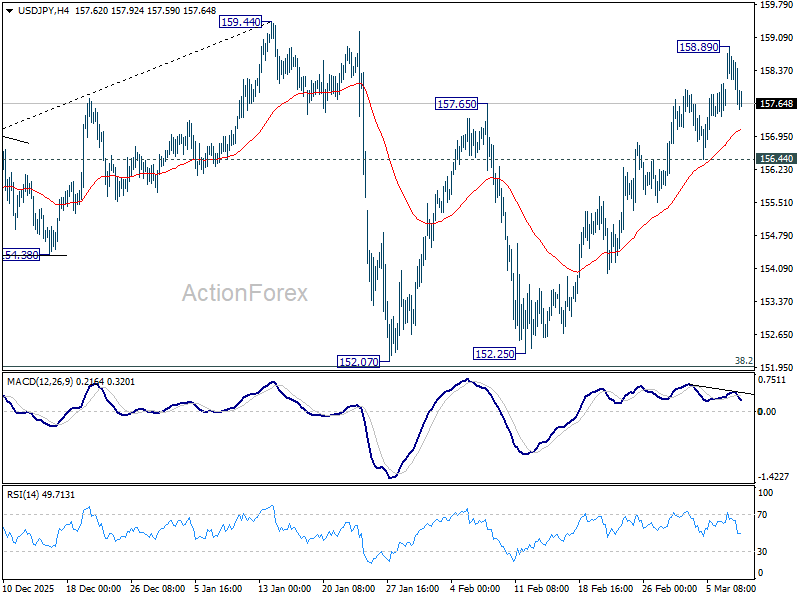
Daily Pivots: (S1) 157.23; (P) 158.06; (R1) 158.50; More...
Intraday bias in USD/JPY is turned neutral with current retreat. On the upside, above 158.89 will extend the rise from 152.07 to 159.44 resistance. Decisive break there will target 161.94 high next. However, considering bearish divergence condition in 4H MACD, firm break of 156.44 support will argue that the rebound has completed, and turn bias back to the downside for 152.07 support. Overall, price actions from 159.44 are viewed as a near term consolidation pattern. Outlook will remain bullish as long as 38.2% retracement of 139.87 to 159.44 at 151.96 holds.
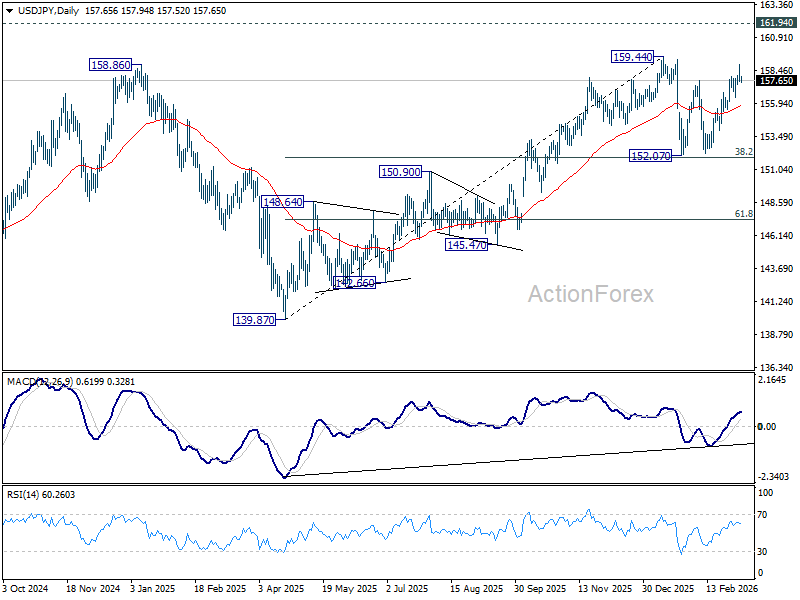
In the bigger picture, outlook is unchanged that corrective pattern from 161.94 (2024 high) should have completed with three waves at 139.87. Larger up trend from 102.58 (2021 low) could be ready to resume through 161.94. This will remain the favored case as long as 55 W EMA (now at 152.16) holds. However, sustained break of 55 W EMA will argue that the pattern from 161.94 is extending with another falling leg.
Dollar Weakens as Oil Shock Repriced Into Managed Conflict
Global markets have begun to regain stability after Monday’s oil-driven turmoil, with Asian equities rallying today following a rebound in US markets overnight. Investors appear to be shifting away from the extreme scenario of a catastrophic oil supply collapse toward a more contained outlook for the Iran conflict.
The change reflects a fundamental dynamic in financial markets: investors tend to react most aggressively to uncertainty rather than to bad news itself. Once the broad contours of a crisis become clearer—even if the situation remains dangerous—markets start pricing risk more rationally rather than responding through panic.
Another factor behind the calmer tone was the verbal intervention from the G7 and the International Energy Agency. The possibility of a coordinated release of strategic reserves helped cap oil’s rally and encouraged profit-taking in energy markets, easing pressure on risk assets.
The shift in sentiment also triggered a reversal in safe-haven positioning. Dollar retreated notably as investors rotated back into risk-sensitive assets. So far this week, Aussie has emerged as the strongest performer, followed by Kiwi and Sterling. At the other end of the spectrum, Swiss Franc has lagged the most, Loonie and Dollar also underperforming.
Despite the rebound, the geopolitical outlook remains far from settled. A significant gap has emerged between the political narrative coming from Washington and the signals from Tehran. US President Donald Trump has suggested that the military operation is progressing “very far ahead of schedule” and that the conflict could end soon.
However, Iran’s Islamic Revolutionary Guard Corps has issued a starkly different message. In a statement, the IRGC declared that it would determine the end of the war, directly challenging the notion that the conflict is nearing resolution. This rhetoric suggests that Iran may rely on asymmetric strategies, which tend to be prolonged and unpredictable. Such an approach could transform the conflict from a short-lived geopolitical shock into a drawn-out regional disruption.
For now, financial markets appear to be pricing what could be described as a “V-shaped” geopolitical event—a rapid escalation followed by a relatively quick stabilization. Yet the IRGC’s stance implies that the reality could be closer to a “U-shaped” scenario or even a prolonged period of intermittent disruption. If that proves to be the case, the current market calm may turn out to be fragile.
In that sense, the stabilization seen across global markets may be less a sign of resolution and more a reflection of investors temporarily accepting the US narrative of how the conflict will evolve.
In Asia, at the time of writing, Nikkei is up 2.53%. Hong Kong HSI is up 1.56%. China Shanghai SSE is up 0.39%. Singapore Strait Times is up 1.44%. Japan 10-year JGB yield is down -0.005 at 2.181. Overnight, DOW rose 0.50%. S&P 500 rose 0.83%. NASDAQ rose 1.38%. 10-year yield rose 0.003 to 4.136.
Australia Westpac consumer sentiment edges Up, but war fears slam late responses
Australia’s Westpac Consumer Sentiment index edged up 1.2% mom to 91.6 in March. While sentiment remains firmly in pessimistic territory, the survey indicates that consumers have responded less negatively than expected to the RBA’s 25 bps increase in February.
However, daily responses collected during the survey week point to steep deterioration in confidence as geopolitical conflicts intensified. According to Westpac, responses gathered in the final three days of the survey were consistent with a much weaker sentiment reading of around 84.
Looking ahead to the RBA’s March 16–17 policy meeting, a rate hike remains possible but is not the base case. While policymakers are likely to be concerned about how rising petrol prices could feed into domestic inflation, the rapidly evolving global situation may encourage caution. Westpac expects the central bank to hold rates steady this month, with the next rate increase more likely to come in May once the external environment becomes clearer.
Australia NAB business confidence turns negative after RBA hike
Australia’s NAB Business confidence fell sharply by five points to -1 February, slipping into negative territory for the first time in eleven months. In contrast, business conditions held steady at +7, roughly in line with the long-run average. The split suggests that firms are still experiencing stable trading conditions but are becoming increasingly cautious about the outlook.
Cost pressures also showed signs of firming again during the month. Labour costs rose to 1.5% on a quarterly equivalent basis. Retail price growth accelerated to 1.0% from just 0.3% previously. The rebound in price indicators suggests that underlying inflation pressures in the business sector may still be present.
The deterioration in sentiment has largely been attributed to the RBA’s 25 basis point rate hike in February to 3.85%, which marked the first increase in two years. NAB analysts noted that the survey only partially captured the subsequent escalation in Middle East tensions and the surge in global energy prices, meaning business confidence could face additional pressure in the months ahead.
China trade surges as exports jump 21.8% and imports beat forecasts
China’s trade activity accelerated sharply in the first two months of 2026, according to data released by the country’s Customs agency. Exports surged 21.8% yoy, far exceeding expectations of a 7.1% increase. Imports climbed 19.8% yoy, also well above the 6.3% consensus forecast.
The stronger-than-expected figures suggest both resilient global demand for Chinese goods and solid domestic consumption of imported materials. China typically combines January and February trade figures to minimize the distortions created by the shifting Lunar New Year holiday period.
Despite the overall strength, trade flows with the US continued to decline. Chinese exports to the U.S. fell about -11% yoy, while imports from the U.S. dropped nearly 27%. In response, Chinese manufacturers have increasingly redirected exports toward emerging markets, particularly Southeast Asia, Africa, and Latin America, highlighting an ongoing reorientation of China’s global trade network.
WTI oil settles into 80–100 new normal as supply vacuum fears ease
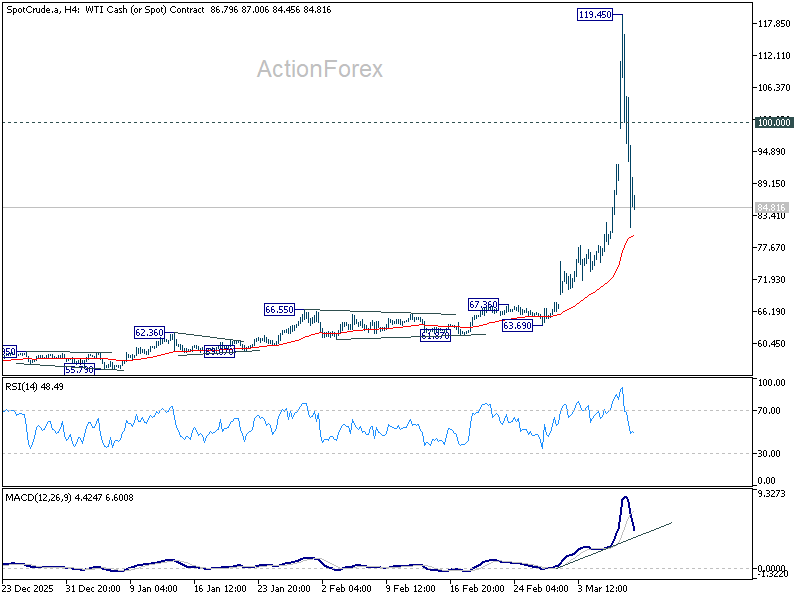
WTI crude’s rapid fall from near 120 yesterday to around the 85 area suggests that the oil market is beginning to reassess the scale of the supply shock triggered by the Middle East conflict.
The earlier surge had reflected fears that the Strait of Hormuz could face a prolonged blockade, potentially removing a massive portion of global supply from the market. That worst-case scenario now appears less dominant in market thinking. Instead of pricing a "catastrophic supply vacuum", traders are increasingly shifting toward a “managed conflict” framework in which oil continues to flow, albeit under greater logistical and geopolitical friction.
This transition marks a classic shift often seen in commodity markets during geopolitical crises. Early in a conflict, prices tend to surge as traders hedge against extreme supply disruptions. As more information becomes available and governments signal their responses, markets gradually move toward pricing the most likely operational scenario rather than the worst-case outcome.
One key catalyst for the sudden reversal was remarks from US President Donald Trump in an interview with CBS. Trump said the military operation was “very complete” and “very far ahead of schedule,” suggesting the conflict could end sooner than many traders had feared. Those comments effectively punctured the “forever war” scenario that had driven oil prices sharply higher.
At the same time, Trump issued a stark warning that Iran would face consequences “much, much harder” if it attempted to block oil supplies. The message was interpreted as a strong deterrent against Iran attempting to sustain a long-term closure of the Strait of Hormuz.
Policy signals from major economies also helped cap the rally. Following discussions with the International Energy Agency, G7 officials said they stand ready to take “necessary measures,” including the release of strategic oil reserves to support global supply.
Although no release has been formally announced, the statement itself carries considerable weight in the oil market. Member countries of the IEA collectively hold roughly 1.2 billion barrels of public emergency reserves, which could theoretically offset the loss of Iranian and Iraqi exports for months.
The signal effectively created a policy ceiling for oil prices, giving speculative traders a clear reason to unwind bullish positions. Many hedge funds had built large long positions betting that prices could quickly surge toward 150. Once governments signaled a willingness to intervene, the risk-reward balance shifted sharply.
With these developments, the oil market now appears to be converging on a new equilibrium range between 80 and 100 per barrel. This range reflects a significant geopolitical risk premium without assuming that the conflict will completely sever global supply chains.
The lower bound near 80 effectively represents the embedded “war premium.” Before the conflict erupted, WTI was trading closer to the mid-60s. The current floor therefore implies roughly 15–20 per barrel of geopolitical risk, reflecting higher insurance costs, freight disruptions, and the persistent possibility of military escalation around key shipping lanes.
In other words, the market is still pricing the conflict—but only as a source of operational friction rather than a systemic supply collapse. As long as tanker traffic remains somewhat constrained and insurance premiums stay elevated, oil prices are unlikely to fall back to their pre-conflict levels.
For oil to fall meaningfully below 80 level, markets would need clear evidence that those risks are disappearing. A ceasefire agreement, normalization of tanker traffic through the Strait of Hormuz, or credible diplomatic progress could remove the premium currently supporting prices.
On the other side of the range, the 100 level represents the escalation trigger. A move above that threshold would signal that markets are once again pricing the risk of severe supply disruption. Such a breakout would likely require renewed attacks on shipping, direct strikes on energy infrastructure, or evidence that tanker traffic through Hormuz has been materially halted. In that scenario, traders would again begin hedging against a much deeper supply shock.
USD/JPY Daily Outlook
Daily Pivots: (S1) 157.23; (P) 158.06; (R1) 158.50; More...
Intraday bias in USD/JPY is turned neutral with current retreat. On the upside, above 158.89 will extend the rise from 152.07 to 159.44 resistance. Decisive break there will target 161.94 high next. However, considering bearish divergence condition in 4H MACD, firm break of 156.44 support will argue that the rebound has completed, and turn bias back to the downside for 152.07 support. Overall, price actions from 159.44 are viewed as a near term consolidation pattern. Outlook will remain bullish as long as 38.2% retracement of 139.87 to 159.44 at 151.96 holds.
In the bigger picture, outlook is unchanged that corrective pattern from 161.94 (2024 high) should have completed with three waves at 139.87. Larger up trend from 102.58 (2021 low) could be ready to resume through 161.94. This will remain the favored case as long as 55 W EMA (now at 152.16) holds. However, sustained break of 55 W EMA will argue that the pattern from 161.94 is extending with another falling leg.
China trade surges as exports jump 21.8% and imports beat forecasts
China’s trade activity accelerated sharply in the first two months of 2026, according to data released by the country’s Customs agency. Exports surged 21.8% yoy, far exceeding expectations of a 7.1% increase. Imports climbed 19.8% yoy, also well above the 6.3% consensus forecast.
The stronger-than-expected figures suggest both resilient global demand for Chinese goods and solid domestic consumption of imported materials. China typically combines January and February trade figures to minimize the distortions created by the shifting Lunar New Year holiday period.
Despite the overall strength, trade flows with the US continued to decline. Chinese exports to the U.S. fell about -11% yoy, while imports from the U.S. dropped nearly 27%. In response, Chinese manufacturers have increasingly redirected exports toward emerging markets, particularly Southeast Asia, Africa, and Latin America, highlighting an ongoing reorientation of China’s global trade network.
WTI oil settles into 80–100 new normal as supply vacuum fears ease
WTI crude’s rapid fall from near 120 yesterday to around the 85 area suggests that the oil market is beginning to reassess the scale of the supply shock triggered by the Middle East conflict.
The earlier surge had reflected fears that the Strait of Hormuz could face a prolonged blockade, potentially removing a massive portion of global supply from the market. That worst-case scenario now appears less dominant in market thinking. Instead of pricing a "catastrophic supply vacuum", traders are increasingly shifting toward a “managed conflict” framework in which oil continues to flow, albeit under greater logistical and geopolitical friction.
This transition marks a classic shift often seen in commodity markets during geopolitical crises. Early in a conflict, prices tend to surge as traders hedge against extreme supply disruptions. As more information becomes available and governments signal their responses, markets gradually move toward pricing the most likely operational scenario rather than the worst-case outcome.
One key catalyst for the sudden reversal was remarks from US President Donald Trump in an interview with CBS. Trump said the military operation was “very complete” and “very far ahead of schedule,” suggesting the conflict could end sooner than many traders had feared. Those comments effectively punctured the “forever war” scenario that had driven oil prices sharply higher.
At the same time, Trump issued a stark warning that Iran would face consequences “much, much harder” if it attempted to block oil supplies. The message was interpreted as a strong deterrent against Iran attempting to sustain a long-term closure of the Strait of Hormuz.
Policy signals from major economies also helped cap the rally. Following discussions with the International Energy Agency, G7 officials said they stand ready to take “necessary measures,” including the release of strategic oil reserves to support global supply.
Although no release has been formally announced, the statement itself carries considerable weight in the oil market. Member countries of the IEA collectively hold roughly 1.2 billion barrels of public emergency reserves, which could theoretically offset the loss of Iranian and Iraqi exports for months.
The signal effectively created a policy ceiling for oil prices, giving speculative traders a clear reason to unwind bullish positions. Many hedge funds had built large long positions betting that prices could quickly surge toward 150. Once governments signaled a willingness to intervene, the risk-reward balance shifted sharply.
With these developments, the oil market now appears to be converging on a new equilibrium range between 80 and 100 per barrel. This range reflects a significant geopolitical risk premium without assuming that the conflict will completely sever global supply chains.
The lower bound near 80 effectively represents the embedded “war premium.” Before the conflict erupted, WTI was trading closer to the mid-60s. The current floor therefore implies roughly 15–20 per barrel of geopolitical risk, reflecting higher insurance costs, freight disruptions, and the persistent possibility of military escalation around key shipping lanes.
In other words, the market is still pricing the conflict—but only as a source of operational friction rather than a systemic supply collapse. As long as tanker traffic remains somewhat constrained and insurance premiums stay elevated, oil prices are unlikely to fall back to their pre-conflict levels.
For oil to fall meaningfully below 80 level, markets would need clear evidence that those risks are disappearing. A ceasefire agreement, normalization of tanker traffic through the Strait of Hormuz, or credible diplomatic progress could remove the premium currently supporting prices.
On the other side of the range, the 100 level represents the escalation trigger. A move above that threshold would signal that markets are once again pricing the risk of severe supply disruption. Such a breakout would likely require renewed attacks on shipping, direct strikes on energy infrastructure, or evidence that tanker traffic through Hormuz has been materially halted. In that scenario, traders would again begin hedging against a much deeper supply shock.
Gold at Make-or-Break Support, Bounce Setup Forming?
Key Highlights
- Gold started a fresh decline from $5,420 and traded below $5,200.
- A major bullish trend line is forming with support at $5,040 on the 4-hour chart.
- WTI Crude Oil surged toward $120 before there was a sharp correction.
- USD/JPY extended gains and traded above 158.50.
Gold Price Technical Analysis
Gold remained well bid above $4,950 against the US Dollar. The price climbed above $5,250 and $5,350 before it started a fresh decline.
The 4-hour chart of XAU/USD indicates that the price trimmed gains from $5,419 and traded below $5,200. There was a spike below the 100 Simple Moving Average (red, 4 hours) and the 200 Simple Moving Average (green, 4 hours).
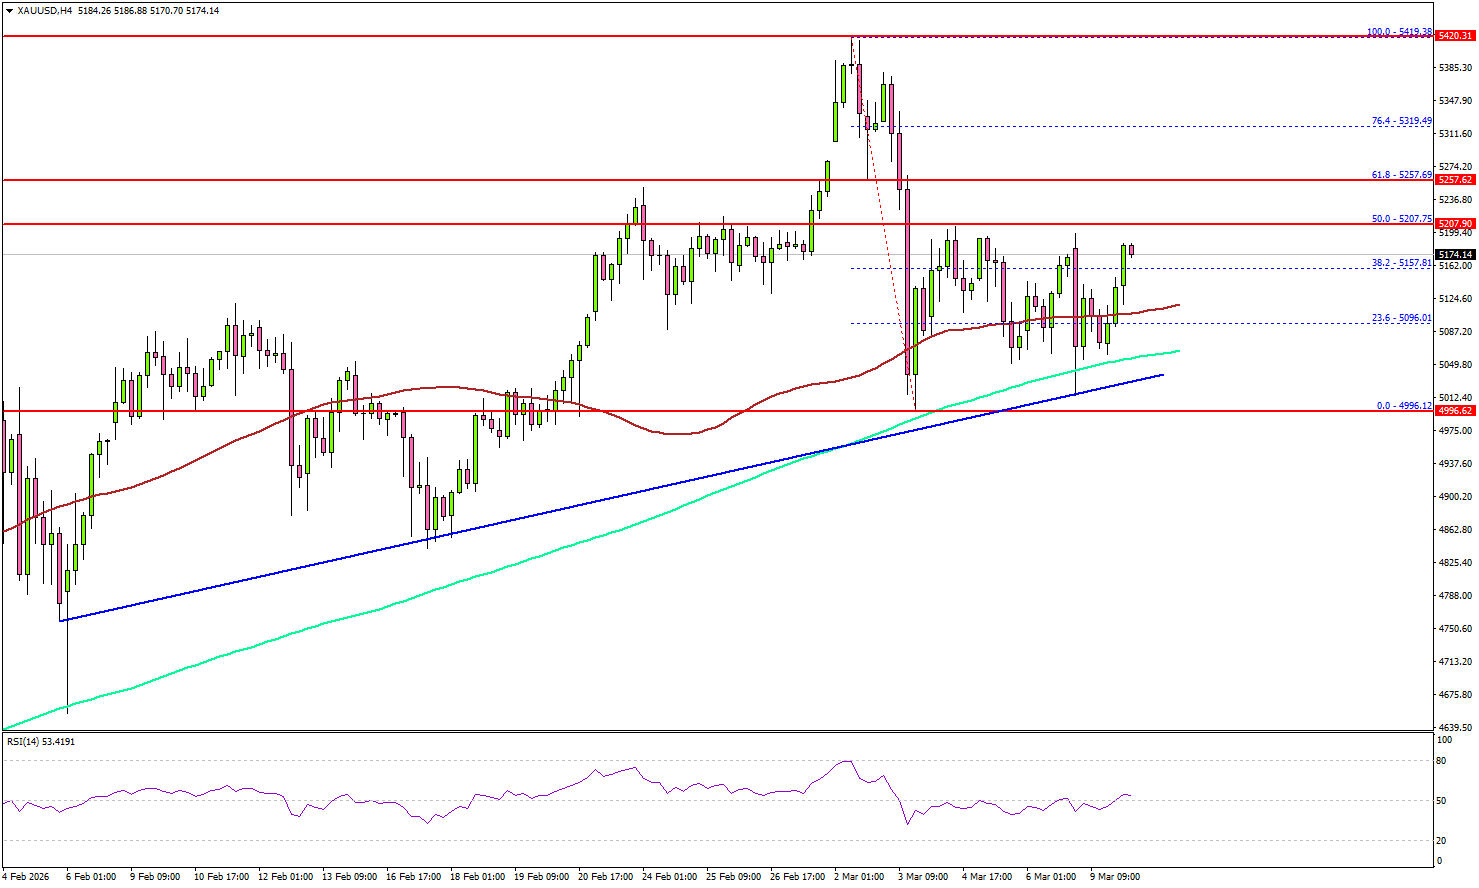
The price traded as low as $4,996 and is currently consolidating losses. There is also a major bullish trend line forming with support at $5,040.
On the upside, immediate resistance is $5,180. The next major resistance sits near $5,200. A clear move above $5,200 could open the doors for more upside. In the stated case, the bulls could aim for a move toward $5,255 and the 61.8% Fib retracement level of the downward move from the $5,419 swing high to the $4,996 low.
The main target for the bulls could be $5,320. If there is another decline, Gold might find bids near the $5,050 level. The first major support sits at $5,020, below which the price might slide to $5,000.
The main support sits at $4,950. Any more losses might call for a test of $4,880 or even $4,820 in the coming days.
Looking at WTI Crude Oil, the price rallied over 40% amid the ongoing Iran war before the bears took a stand near the $120 level.
Economic Releases to Watch Today
- US Existing Home Sales for Feb 2026 (MoM) - Forecast -2.5%, versus -8.4% previous.
- US ADP Employment Change 4-week average - Forecast 10K, versus 12.8K previous.
Australia NAB business confidence turns negative after RBA hike
Australia’s NAB Business confidence fell sharply by five points to -1 February, slipping into negative territory for the first time in eleven months. In contrast, business conditions held steady at +7, roughly in line with the long-run average. The split suggests that firms are still experiencing stable trading conditions but are becoming increasingly cautious about the outlook.
Cost pressures also showed signs of firming again during the month. Labour costs rose to 1.5% on a quarterly equivalent basis. Retail price growth accelerated to 1.0% from just 0.3% previously. The rebound in price indicators suggests that underlying inflation pressures in the business sector may still be present.
The deterioration in sentiment has largely been attributed to the RBA’s 25 basis point rate hike in February to 3.85%, which marked the first increase in two years. NAB analysts noted that the survey only partially captured the subsequent escalation in Middle East tensions and the surge in global energy prices, meaning business confidence could face additional pressure in the months ahead.