Sample Category Title
Australia Westpac consumer sentiment edges Up, but war fears slam late responses
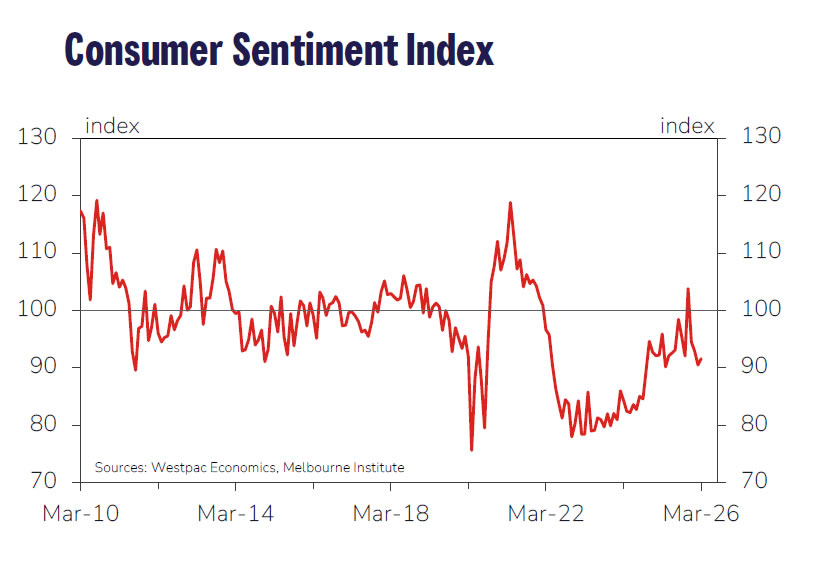
Australia’s Westpac Consumer Sentiment index edged up 1.2% mom to 91.6 in March. While sentiment remains firmly in pessimistic territory, the survey indicates that consumers have responded less negatively than expected to the RBA’s 25 bps increase in February.
However, daily responses collected during the survey week point to steep deterioration in confidence as geopolitical conflicts intensified. According to Westpac, responses gathered in the final three days of the survey were consistent with a much weaker sentiment reading of around 84.
Looking ahead to the RBA’s March 16–17 policy meeting, a rate hike remains possible but is not the base case. While policymakers are likely to be concerned about how rising petrol prices could feed into domestic inflation, the rapidly evolving global situation may encourage caution. Westpac expects the central bank to hold rates steady this month, with the next rate increase more likely to come in May once the external environment becomes clearer.
Is Petrodollar Trade Over After Trump’s Comment? EUR/USD, AUD/USD and Dollar Index (DXY) Overview
The US Dollar has been on a significant run since the beginning of the US-Iran-Israel war, quickly breaching its prior 2026 records.
When the night falls, the wolves step out – Dollar bears had dominated the narrative since early 2025 and have kept insisting on a weaker dollar despite largely rangebound action since July.
This bearishness had largely been covered throughout our previous Dollar analyses and reached a peak after the recent Bank of America's Fund Manager survey.
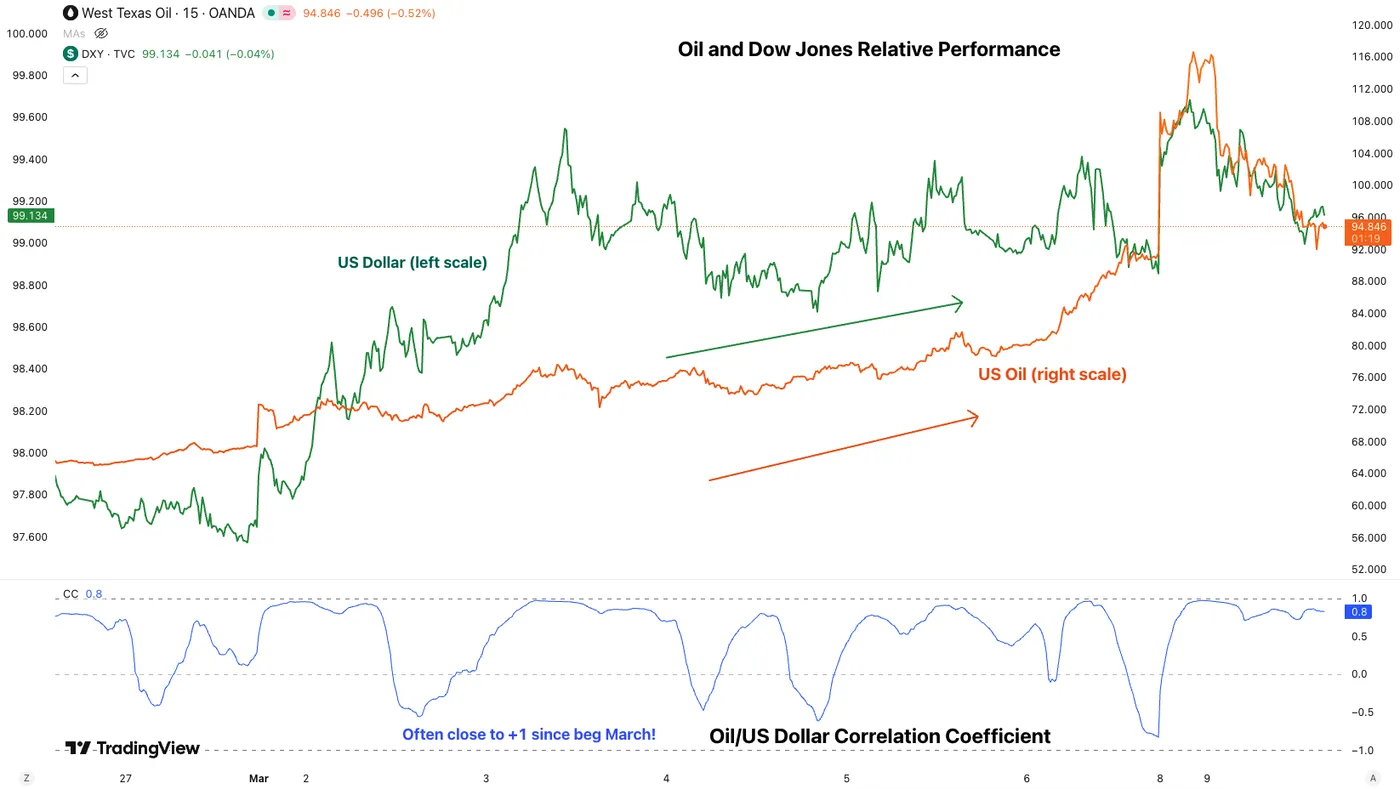
When the Market is short and a catalyst for shortage lands, it leads to explosive moves, and that's precisely what happened with the USD.
The US-Iran war sparked a swift need for dollars to protect against currency volatility, particularly to purchase oil at a much higher price. Hence, firms and institutions require dollar hedging to defend against a double-edged squeeze.
Source: TradingView
This added to the Momentum throughout last week's Globex Open and this week's spike.
In case you missed the historic moves, WTI and Brent Oil prices have moved 25% on both sides throughout the overnight and morning session and are now settling closer to $95 as G7 nations expressed a desire to control the situation by releasing strategic reserves, as Maritime traffic near the Strait of Hormuz slowly picks up again.
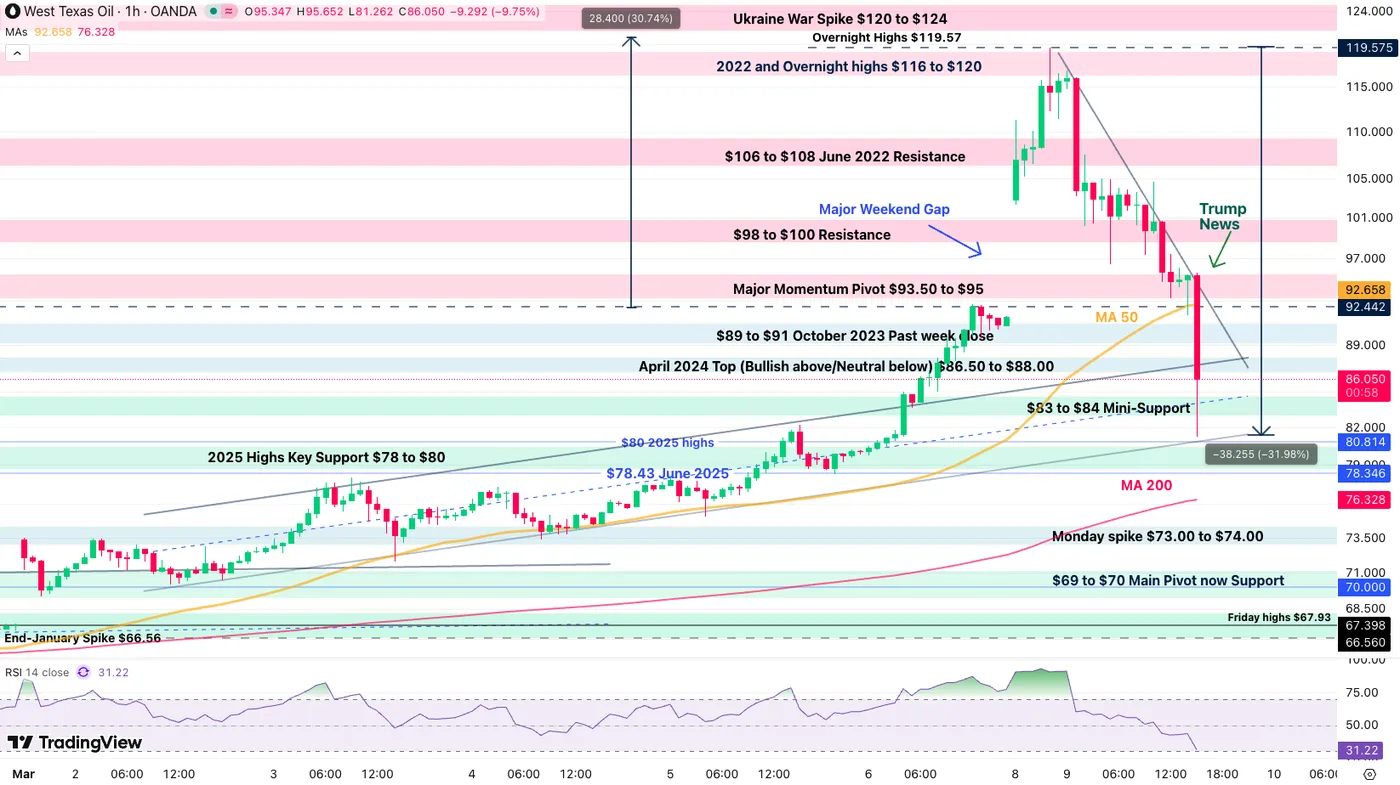
WTI (US) Oil 1H Chart – March 9, 2026. Source: TradingView
Note: Things just took an unexpected turn as I just posted this chart, Oil gapped lower to $83 – Remaining below $85 would bring back sellers in control, but tomorrow's close will be necessary; Expect volatility to remain high before that.
We will look at the Dollar Index, EUR/USD, and AUD/USD to assess the current state of the Market and whether more upside is warranted for the Dollar after its Market-sweeping rises.
Dollar Index 1H Chart
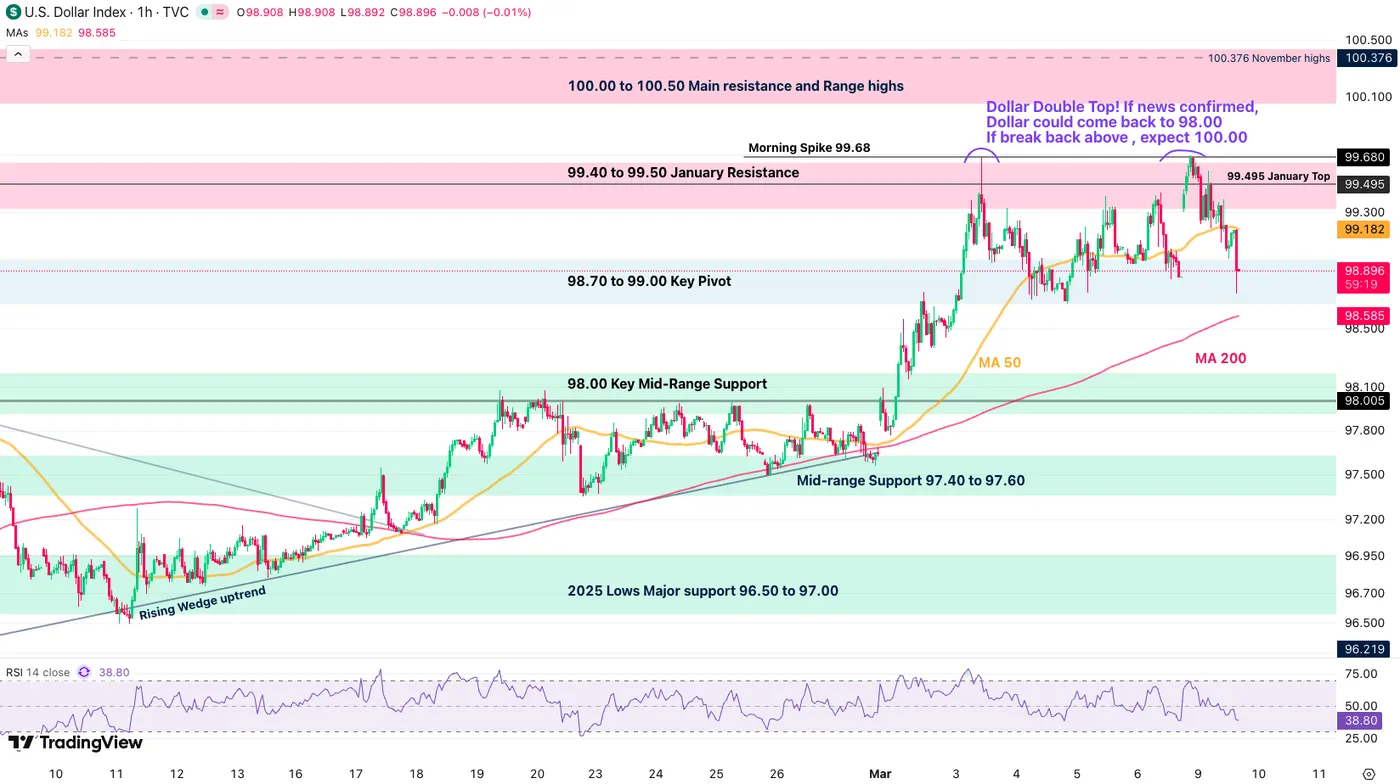
Dollar Index 1H Chart, March 9, 2026 – Source: TradingView
The US Dollar just took a swift turn lower after the Market shaking Trump announcement.
The overnight/morning action now points towards a clear double-top, pointing at a drop back towards 98.00, however, the 200-Hour MA (98.56) could act as support, so a rebound there will have to be monitored!
Three levels are to be watched:
- The 98.56 200-Hour MA – Bouncing from here would maintain the rangebound picture in the Dollar (which would invite to trade ranges in related USD Pairs)
Breaking the level lower points to:
- 98.00 – The pre-War resistance. As long as prices remain above this level, the outlook for the Dollar is neutral and could still see a grind back towards 99.00
- Morning highs: 99.70 – Breaking back above would imply further chaos in the Middle East, hence, could see a breakout back towards November highs at 100.376.
Levels of interest for the Dollar Index:
Resistance Levels
- Morning Spike 99.70 and Double Top
- 99.40 to 99.50 January Resistance
- 100.00 to 100.50 Main Resistance Zone
- 100.376 November highs
Support Levels
- 98.70 to 99.00 Key Pivot (acting as mini-support)
- 98.56 200-Hour MA
- 98.00 Key Mid-Range Support
- December Lows 97.75
- 97.40 to 97.80 August Range Support
- 2025 Lows 96.40 to 96.80 Support
AUD/USD 4H Chart and Technical Levels
AUD/USD 4H Chart, March 9, 2026 – Source: TradingView
AUD/USD is attempting a bounce but is facing resistance at its 4H 50-period MA (0.7060) – closing above the MA in tomorrow's session should launch it back towards the February highs (0.7140).
Levels of interest for AUD/USD:
Resistance Levels
- Immediate Resistance 4H MA 50 – 0.7060; Bullish above
- 2023 Highs from 0.71 to 0.7150 Resistance (next resistance)
- 0.71470 February highs
- June 2022 Extremes 0.72 to 0.7230
Support Levels
- 0.69566 Overnight lows
- 0.69 to 0.6945 Early Feb Support (if War drags on, could return here)
- Micro-support 0.6850 (+/- 30 pips)
- October 2024 Mini-support 0.6750 (+/- 100 pips)
EUR/USD 4H Chart and Technical Levels
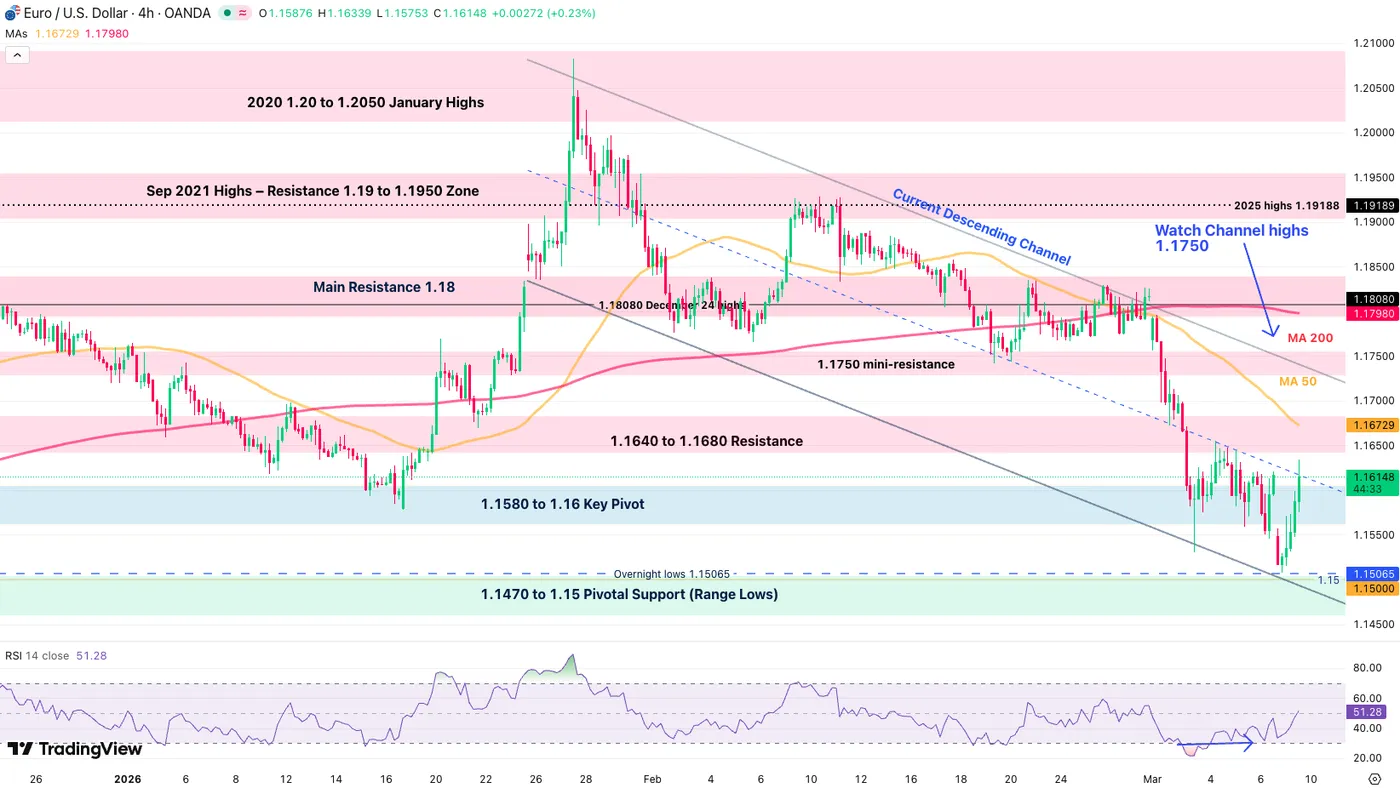
EUR/USD 4H Chart, March 9, 2026 – Source: TradingView
EUR/USD is now bouncing off of its clean downward channel – It will also face its 4H 50-period MA (1.16730).
If it breaks above, keep a very close eye on the downward channel top around 1.1750 to spot if the Channel holds.
Levels to place on your EUR/USD charts:
Resistance Levels
- 1.1640 to 1.1680 Resistance (4H 50-MA)
- 1.1750 mini-resistance and Channel Top
- Resistance Zone around 1.18 (+/- 150 pips)
Support Levels
- 1.1580 to 1.16 Key Pivot
- Overnight and Channel lows 1.15065
- 1.1470 to 1.15 Pivotal Support
- 1.1350 to 1.14 Support
Safe Trades and keep a close eye on Middle East developments!
Oil Gaps Lower to $83 After a Wild Session! Trump – “The War Could be Over Soon”
As I was completing an upcoming piece on the US Dollar, things just changed swiftly (coming up soon)
Trump just said during an interview that the War was "pretty much complete", implying a significant advance on his initial 4-5 week estimate.
It seems a bit early for the warning however, so this report and move will have to be treated with caution.
Check out this insane Oil chart!
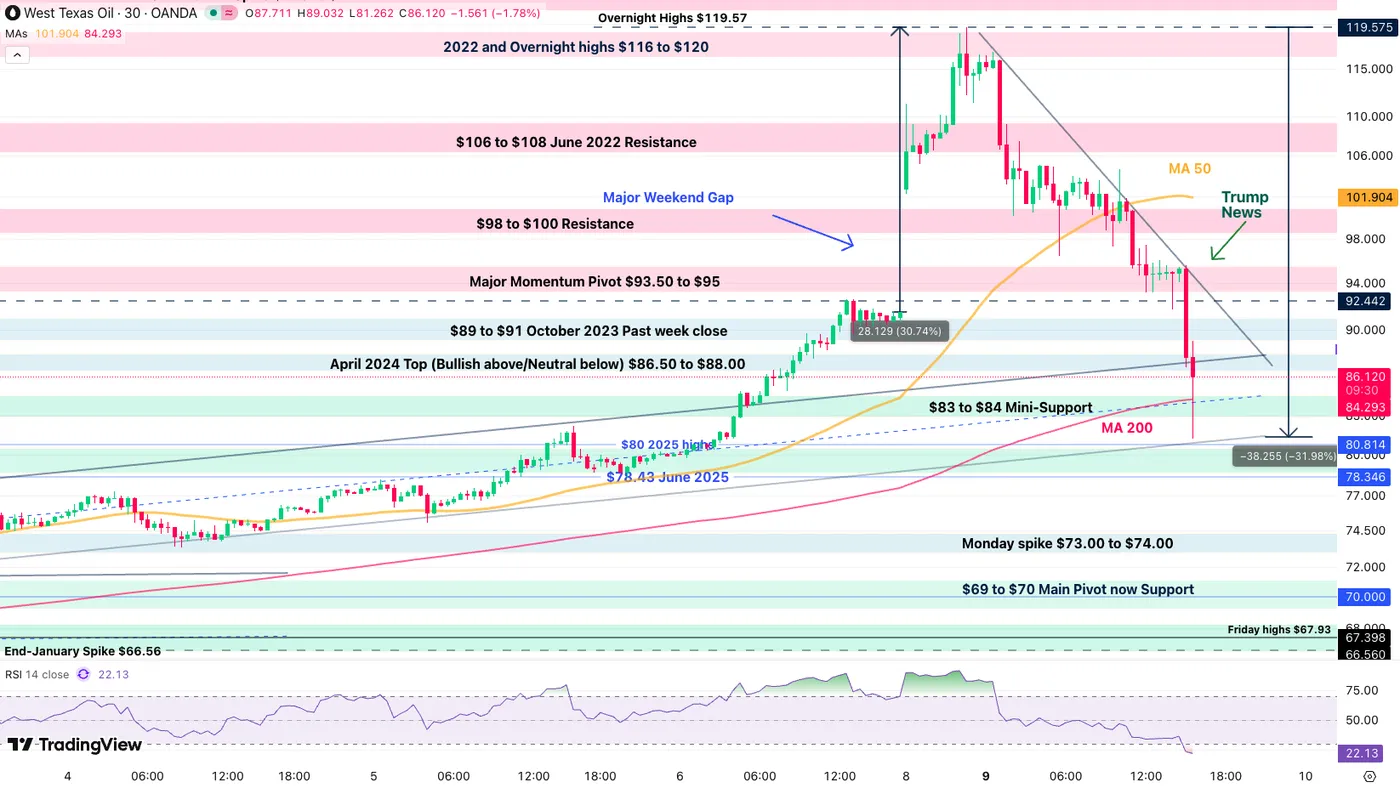
WTI (US) Oil 30M Chart – March 9, 2026. Source: TradingView
Some feathers must have been lost today with the 30% up and down swings in Oil prices.
Traders, make sure to keep your risk tight and size accordingly with the extent of the events.
For those tracking live geopolitics, following what the IDF announces could provide somewhat less erratic news flows in order to trade the commodity.
Keep a close eye on the $85 level.
If you want to access more trading levels around the current trading area, check out our Friday analysis.
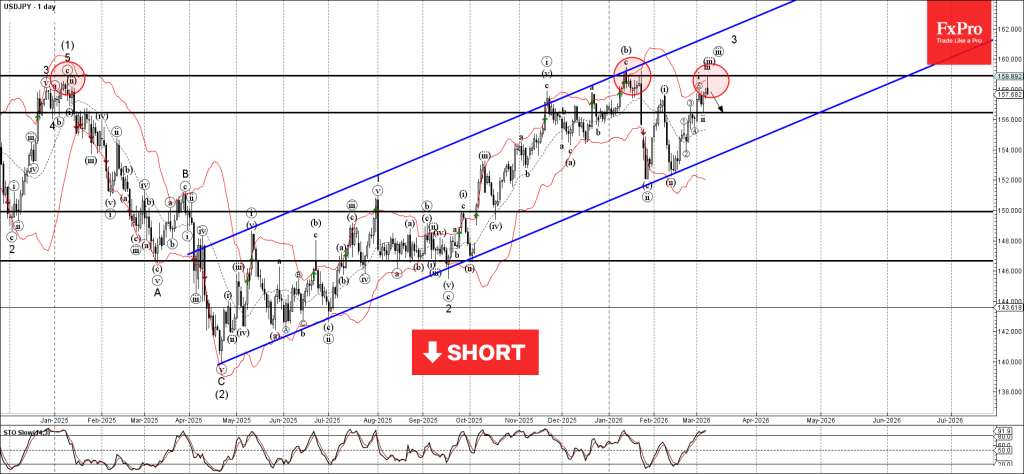
USDJPY Wave Analysis
USDJPY: ⬇️ Sell
- USDJPY reversed from resistance area
- Likely to fall to support level 158.1
USDJPY currency pair recently reversed from the resistance area between the long-term resistance level 159.00 (which has been reversing the pair from the start of 2025) and the upper daily Bollinger Band.
The downward reversal from this resistance area is currently forming the daily Shooting Star reversal pattern – strong sell signal for USDJPY.
Given the strength of the resistance level 159.00 and the overbought daily Stochastic, USDJPY currency pair can be expected to fall to the next support level 158.1.
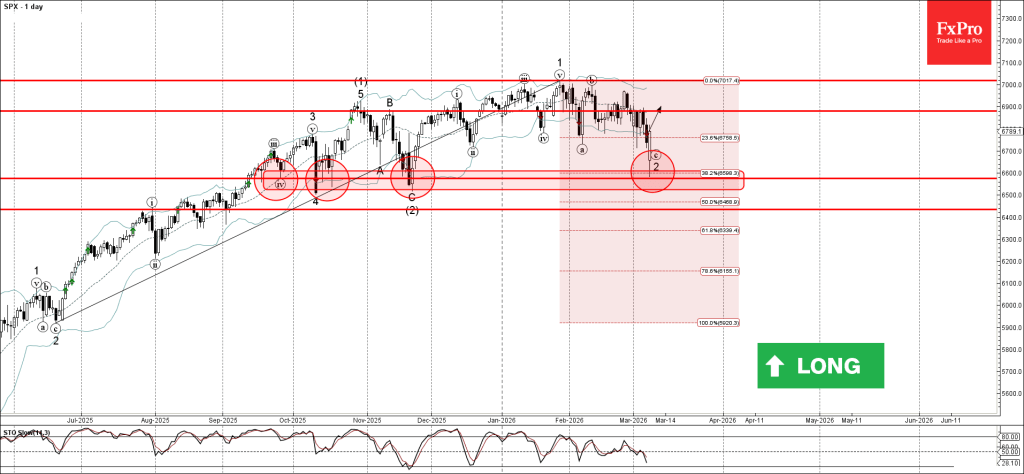
S&P 500 Wave Analysis
S&P 500: ⬆️ Buy
- S&P 500 reversed from support zone
- Likely to rise to resistance level 6900.00
S&P 500 index recently reversed from the support zone between the key support level 6600,00 (which has been reversing the price from September), lower daily Bollinger Band and the 38.2% Fibonacci correction of the extended upward impulse from June.
The upward reversal from the support level 6600,00 stopped the previous short-term ABC correction 2 from January.
Given the strong daily uptrend, S&P 500 index can be expected to rise to the next resistance level 6900.00.
Eco Data 3/10/26
| GMT | Ccy | Events | Act | Cons | Prev | Rev |
|---|---|---|---|---|---|---|
| 23:30 | AUD | Westpac Consumer Confidence Mar | 1.20% | -2.60% | ||
| 23:30 | JPY | Household Spending Y/Y Jan | -1.00% | 2.50% | -2.60% | |
| 23:50 | JPY | GDP Q/Q Q4 F | 0.30% | 0.30% | 0.10% | |
| 23:50 | JPY | GDP Deflator Y/Y Q4 F | 3.40% | 3.40% | 3.40% | |
| 23:50 | JPY | Money Supply M2+CD Y/Y Feb | 1.70% | 1.50% | 1.60% | |
| 00:01 | GBP | BRC Like-For-Like Retail Sales Y/Y Feb | 0.70% | 2.40% | 2.30% | |
| 00:30 | AUD | NAB Business Confidence Feb | -1 | 3 | 4 | |
| 00:30 | AUD | NAB Business Conditions Feb | 7 | 7 | ||
| 03:00 | CNY | Trade Balance (USD) Feb | 213.6B | 175.0B | 114.1B | |
| 06:00 | JPY | Machine Tool Orders Y/Y Feb P | 24.20% | 25.30% | ||
| 07:00 | EUR | Germany Trade Balance (EUR) Jan | 21.2B | 15.2B | 17.1B | |
| 10:00 | USD | NFIB Business Optimism Index Feb | 98.8 | 99.7 | 99.3 | |
| 14:00 | USD | Existing Home Sales Feb | 4.09M | 3.90M | 3.91M | 4.02M |
| 23:30 | AUD |
| Westpac Consumer Confidence Mar | |
| Actual | 1.20% |
| Consensus | |
| Previous | -2.60% |
| 23:30 | JPY |
| Household Spending Y/Y Jan | |
| Actual | -1.00% |
| Consensus | 2.50% |
| Previous | -2.60% |
| 23:50 | JPY |
| GDP Q/Q Q4 F | |
| Actual | 0.30% |
| Consensus | 0.30% |
| Previous | 0.10% |
| 23:50 | JPY |
| GDP Deflator Y/Y Q4 F | |
| Actual | 3.40% |
| Consensus | 3.40% |
| Previous | 3.40% |
| 23:50 | JPY |
| Money Supply M2+CD Y/Y Feb | |
| Actual | 1.70% |
| Consensus | 1.50% |
| Previous | 1.60% |
| 00:01 | GBP |
| BRC Like-For-Like Retail Sales Y/Y Feb | |
| Actual | 0.70% |
| Consensus | 2.40% |
| Previous | 2.30% |
| 00:30 | AUD |
| NAB Business Confidence Feb | |
| Actual | -1 |
| Consensus | |
| Previous | 3 |
| Revised | 4 |
| 00:30 | AUD |
| NAB Business Conditions Feb | |
| Actual | 7 |
| Consensus | |
| Previous | 7 |
| 03:00 | CNY |
| Trade Balance (USD) Feb | |
| Actual | 213.6B |
| Consensus | 175.0B |
| Previous | 114.1B |
| 06:00 | JPY |
| Machine Tool Orders Y/Y Feb P | |
| Actual | 24.20% |
| Consensus | |
| Previous | 25.30% |
| 07:00 | EUR |
| Germany Trade Balance (EUR) Jan | |
| Actual | 21.2B |
| Consensus | 15.2B |
| Previous | 17.1B |
| 10:00 | USD |
| NFIB Business Optimism Index Feb | |
| Actual | 98.8 |
| Consensus | 99.7 |
| Previous | 99.3 |
| 14:00 | USD |
| Existing Home Sales Feb | |
| Actual | 4.09M |
| Consensus | 3.90M |
| Previous | 3.91M |
| Revised | 4.02M |
USD/JPY Mid-Day Outlook
Daily Pivots: (S1) 157.42; (P) 157.76; (R1) 158.13; More...
Intraday bias in USD/JPY stays on the upside as rise fro 152.25 is in progress for 159.44 resistance. Decisive break there will target 161.94 high next. On the downside, below 157.38 minor support will turn intraday bias neutral again first. Overall, price actions from 159.44 are viewed as a near term consolidation pattern. Outlook will remain bullish as long as 38.2% retracement of 139.87 to 159.44 at 151.96 holds.
In the bigger picture, outlook is unchanged that corrective pattern from 161.94 (2024 high) should have completed with three waves at 139.87. Larger up trend from 102.58 (2021 low) could be ready to resume through 161.94. This will remain the favored case as long as 55 W EMA (now at 152.16) holds. However, sustained break of 55 W EMA will argue that the pattern from 161.94 is extending with another falling leg.
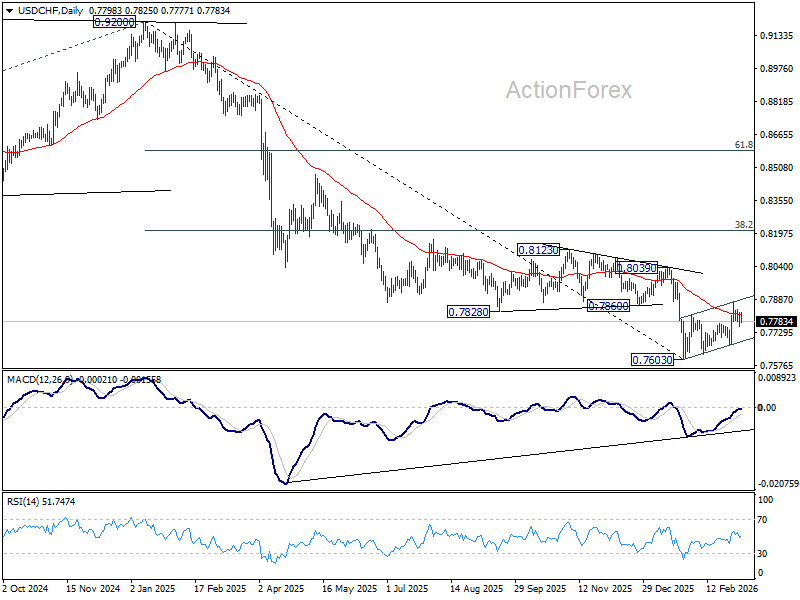
USD/CHF Mid-Day Outlook
Daily Pivots: (S1) 0.7781; (P) 0.7810; (R1) 0.7838; More….
Range trading continues in USD/CHF and intraday bias stays neutral. On the downside, break of 0.7671 support will revive near term bearishness and bring retest of 0.7603 low. Decisive break there will resume larger down trend. On the upside, though, break of 0.7877 will bring stronger rally to 0.8039 resistance next.
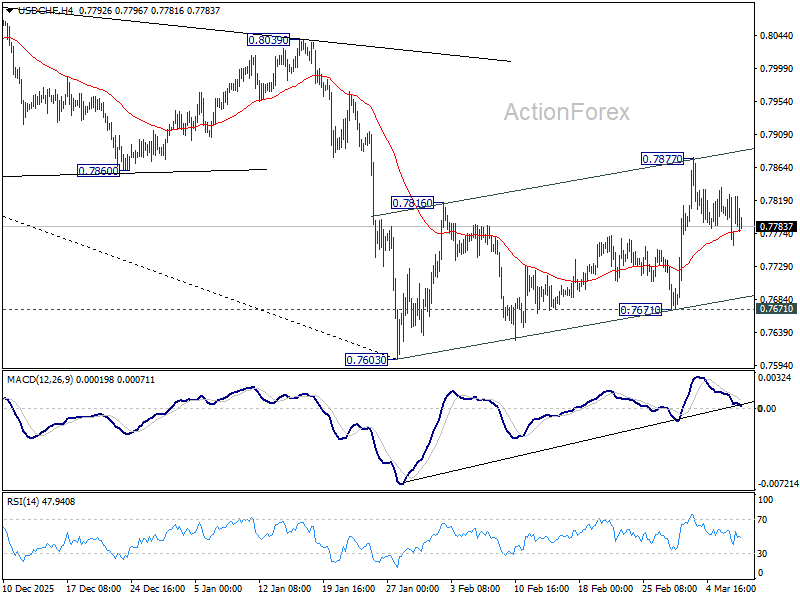
In the bigger picture, a medium term bottom could be in place at 0.7603 on bullish convergence condition in D MACD, Firm break of 0.8039 resistance will argue that it's at least correcting the down trend from 0.9002. Stronger rebound would then be seen to 38.2% retracement of 0.9200 to 0.7603 at 0.8213. However, break of 0.7603 will resume the down trend to 100% projection of 1.0146 (2022 high) to 0.8332 from 0.9200 at 0.7382.
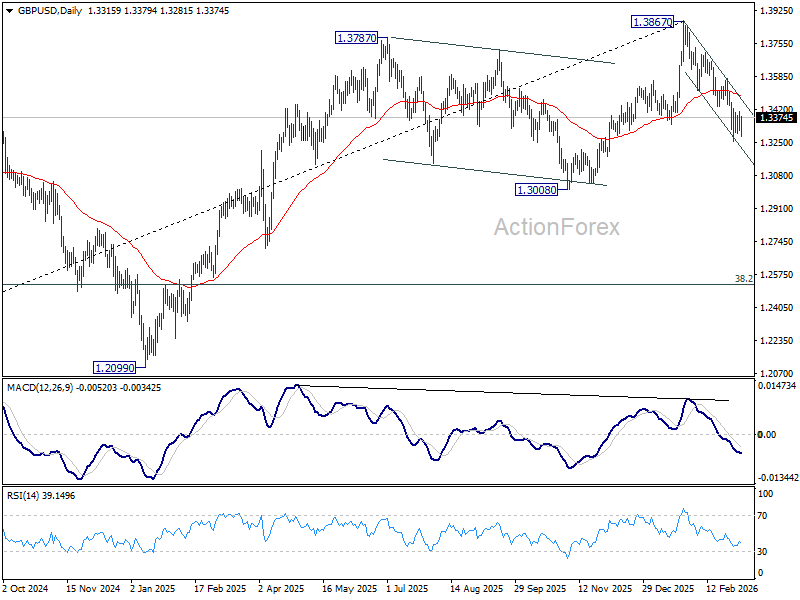
GBP/USD Mid-Day Outlook
Daily Pivots: (S1) 1.3333; (P) 1.3372; (R1) 1.3431; More...
GBP/USD is still bounded in range above 1.3252 and intraday bias remains neutral. Risk will stay on the downside as long as 1.3574 resistance holds, in case of stronger rebound. On the downside, below 1.3252 will extend the fall from 1.3867 to 1.3008 structural support. Decisive break there will carry larger bearish implications.
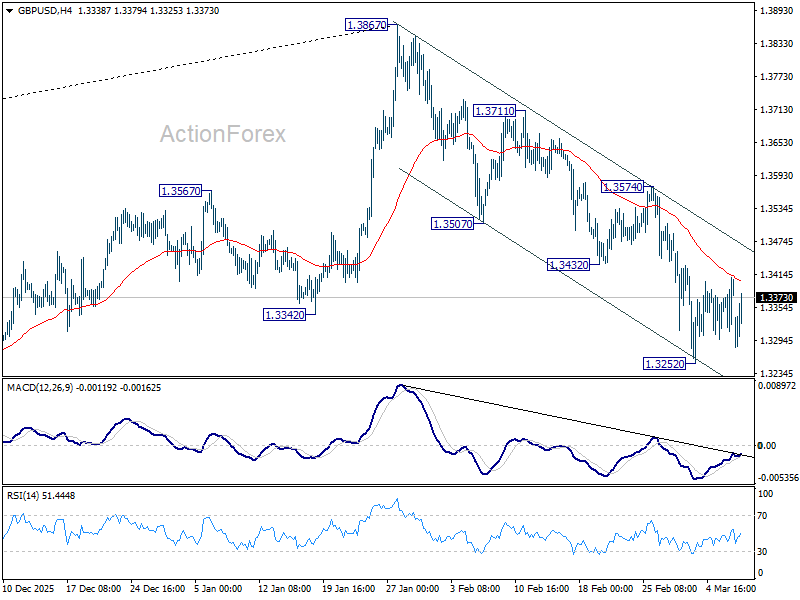
In the bigger picture, considering bearish divergence condition in both D and W MACD, a medium term top should be in place from 1.3867. Firm break of 1.3008 support will argue that fall from 1.3867 is at least corrective the whole rise from 1.0351 (2022 low) with risk of bearish reversal. That would open up further decline to 38.2% retracement of 1.0351 to 1.3867 at 1.2524. For now, medium term outlook will be neutral at best as long as 1.3867 resistance holds, or under further development.
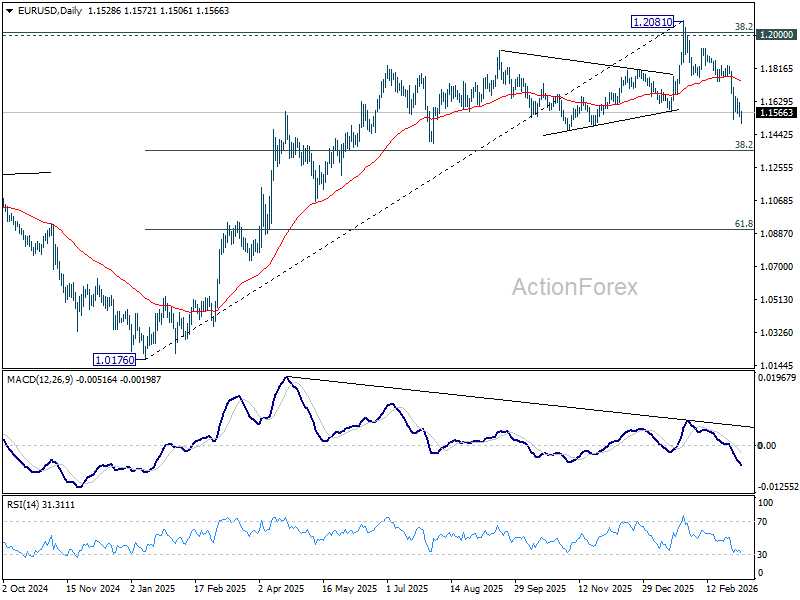
EUR/USD Mid-Day Outlook
Daily Pivots: (S1) 1.1563; (P) 1.1594; (R1) 1.1641; More….
Intraday bias in EUR/USD remains on the downside for the moment. Current decline from 1.2081 should target 38.2% retracement of 1.0176 to 1.2081 at 1.1353 next. On the upside, above 1.1653 minor resistance will turn intraday bias neutral again first. But outlook will remain bearish as long as 1.1740 support turned resistance holds, in case of another recovery.
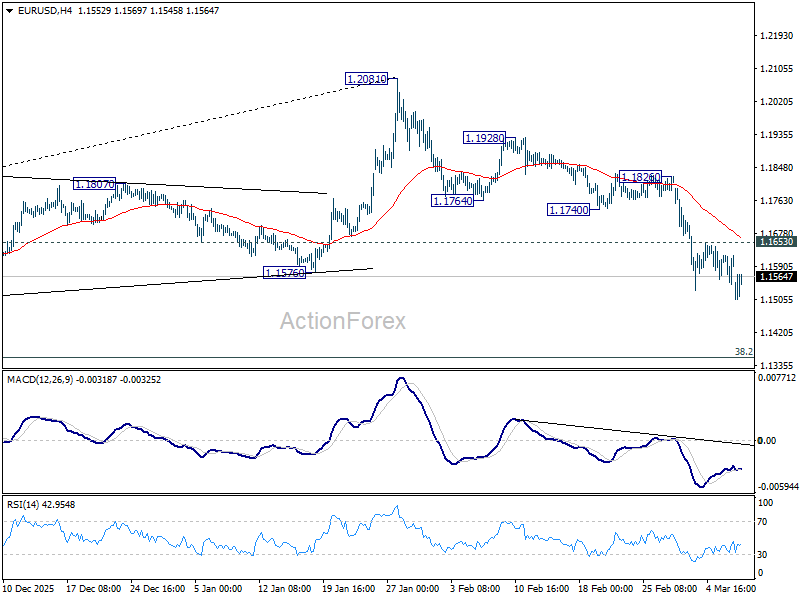
In the bigger picture, a medium term top should be in place at 1.2081 on bearish divergence condition in D MACD. Sustained trading below 55 W EMA (now at 1.1500) should confirm rejection by 1.2 key cluster resistance level. That would also raise the chance that whole up trend from 0.9534 (2022 low) has completed as a three wave corrective bounce too. For now, medium term outlook is neutral at best as long as 1.2081 holds, even in case of rebound.