Sample Category Title
AUD/USD Daily Report
Daily Pivots: (S1) 0.6623; (P) 0.6645; (R1) 0.6680; More...
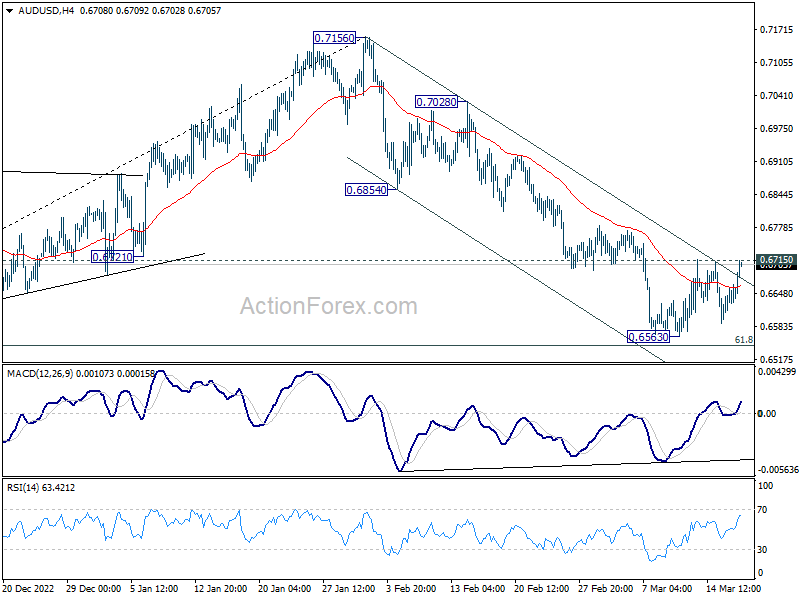
Intraday bias in AUD/USD stays neutral first with focus on 0.6715 resistance. Decisive break there will confirm short term bottoming at 0.6563, just ahead of 0.6546 fibonacci level. Intraday bias will be back on the upside for 55 day EMA (now at 0.6784). Sustained break there will pave the way back to retest 0.7156 high. On the downside, however, sustained break of 0.6546 will carry larger bearish implication and target 0.6169 low.
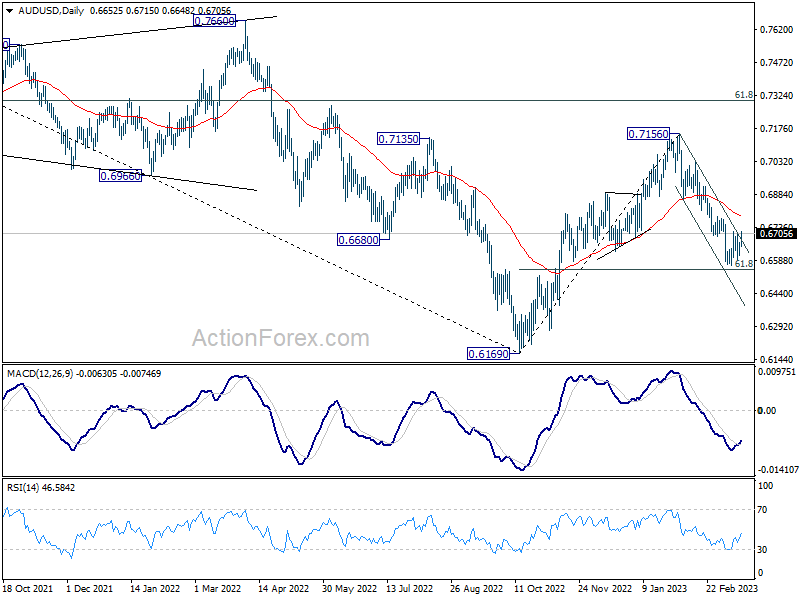
In the bigger picture, rise from 0.6169 (2022 low) has completed at 0.7156, after rejection by 55 month EMA (now at 0.7158). Deeper decline would then be see back to 61.8% retracement of 0.6169 to 0.7156 at 0.6546, even as a corrective fall. Sustained break there will raise the chance of long term down trend resumption through 0.6169 low.
Aussie Gaining Momentum, Dollar Pressured as Banking Fears Subside
Dollar faces renewed selling pressure as Asian markets exhibit a positive tone, following the overnight rebound in US stocks. The question remains: is the banking crisis over? It seems likely, at least temporarily, as major banks rushed to support First Republic and the situation surrounding Credit Suisse stabilized. If Wall Street's rebound continues to gain momentum, the greenback could face further downside risk today. However, given that FOMC rate decision is less than a week away, investors may opt to take profits and adopt a more cautious stance in the meantime.
Currently, Australian Dollar leads as the best performer for the week, closely followed by New Zealand Dollar. Both currencies appear to be gaining momentum. Despite struggling to extend earlier gains, Japanese Yen remains the third strongest currency. Swiss Franc, on the other hand, is the weakest performer, followed by Dollar. The post-ECB selloff in Euro didn't last but it lacks momentum for rebound, and it's now the third weakest. Both the British Pound and the Canadian Dollar are mixed for the week.
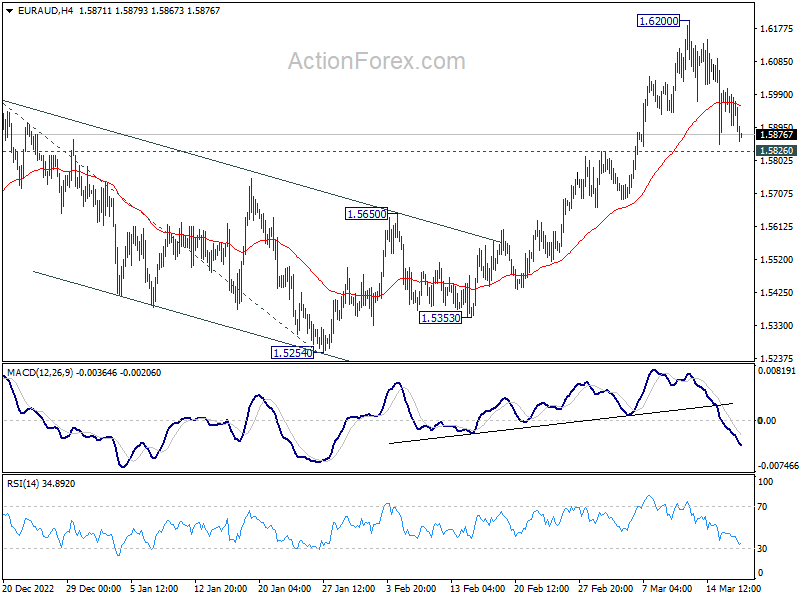
Technically, Aussie is worth a watch before the weekly. AUD/USD is now pressing 0.6715 resistance and firm break there will indicate short term bottoming at 0.6563. On the other hand, EUR/AUD is holding just slightly above 1.5826 support. Firm break of this support will indicate short term topping 1.6200. In this case, deeper decline would be seen back to 1.5650 resistance turned support and possibly below. Let's see how Aussie goes.
In Asia, Nikkei rose 1.20%. Hong Kong HSI is up 1.12%. China Shanghai SSE is up 0.58%. Singapore Strait Times is up 0.67%. Japan 10-year JGB yield is down -0.0062 at 0.291. Overnight, DOW rose 1.17%. S&P 500 rose 1.76%. NASDAQ rose 2.48%. 10-year yield rose 0.093 to 3.585.
NASDAQ displays bullish sign after major banks rescue First Republic
US stocks experienced a notable rebound overnight as major banks stepped in to rescue the beleaguered First Republic Bank, preventing the potential contagion from evolving into a full-blown banking crisis.
Bank of America, Goldman Sachs, JP Morgan, and others have collectively agreed to deposit USD 30B in First Republic, which has faced a mass withdrawal of customer funds in the wake of Silicon Valley Bank's collapse and concerns that First Republic could be next.
In a joint statement on Thursday, the banks expressed their confidence in the US banking system, stating, "Together, we are deploying our financial strength and liquidity into the larger system, where it is needed the most."
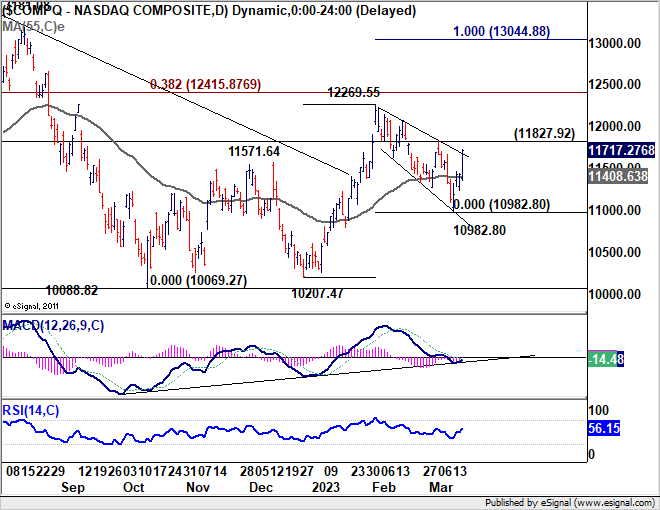
Among the major US stock indexes, NASDAQ led the way with an impressive 2.48% rally. From a technical perspective, there are indications of bullish momentum, as the index closed above the near-term trend line resistance. This development suggests that the corrective pullback from 12269.55 may have concluded at 10982.80 already.
In the coming days, reaction to the 11827.92 resistance level should be closely monitored. A firm break above this threshold would solidify the bullish case, potentially leading to a resumption of the rally from 10207.47 through the 12269.55 resistance level.
Bitcoin broke key resistance, safe-haven asset or tech sector barometer?
Bitcoin has showcased remarkable resilience amid recent turmoil in financial markets, prompting discussions about its potential status as a safe-haven asset. The leading cryptocurrency has outperformed traditional safe havens such as gold this week, further fueling this debate.
Interestingly, Bitcoin has displayed a correlation with the NASDAQ index, suggesting that it may serve as a leading indicator or confirmation signal for risk appetite, particularly in the technology sector. It's could still be more of a tech sector barometer.
In either case, the breakthrough of 25242 resistance indicates that rally from 15452 is resuming. More significantly, the break above the 55 week EMA and 25198 structural resistance suggests that Bitcoin is now in the midst of correcting the entire downtrend from its 2021 record high of 68986, as a medium term move.
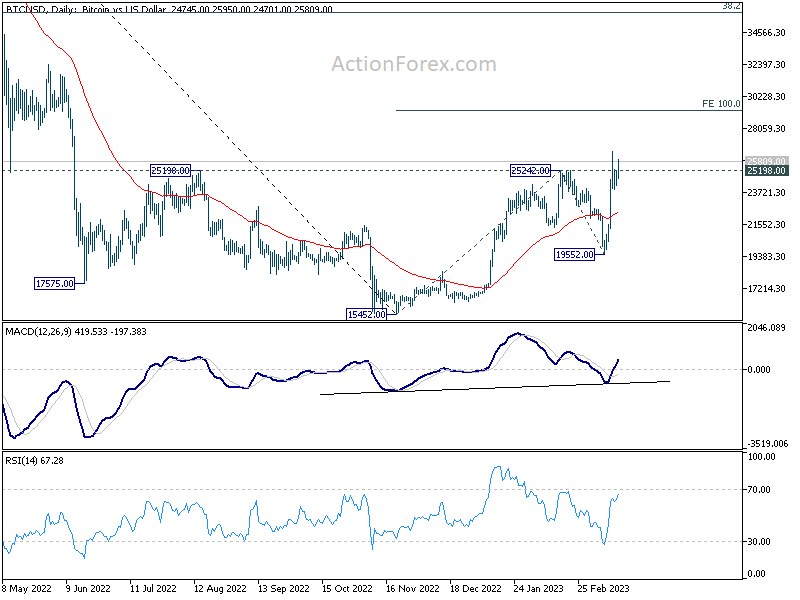
In the short term, further gains are expected, with a target of 100% projection of 15452 to 25242 from 19552 at 29342. The market's reaction at this level will provide insight into the potential trajectory of the medium-term rise from 15452.
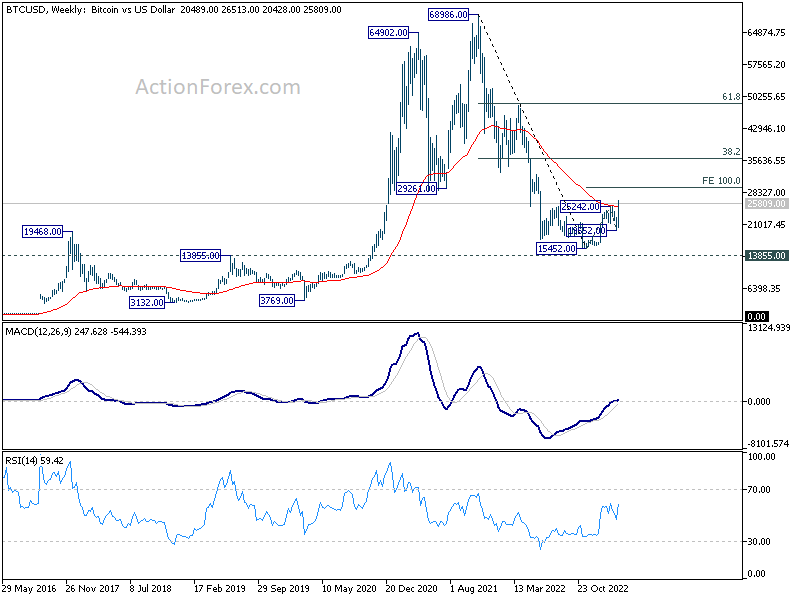
Additionally, the momentum of Bitcoin's ascent could be an important factor in determining the likelihood of NASDAQ breaking through the 12269.55 resistance level.
As market participants keep a close eye on these developments, Bitcoin's performance may hold broader implications for the technology sector and the overall market sentiment.
Looking ahead
Italy trade balance and Eurozone CPI final will be released in European session. Later in the day, Canada will release IPPI and RMPI. US will release industrial production and U of Michigan consumer sentiment.
AUD/USD Daily Report
Daily Pivots: (S1) 0.6623; (P) 0.6645; (R1) 0.6680; More...
Intraday bias in AUD/USD stays neutral first with focus on 0.6715 resistance. Decisive break there will confirm short term bottoming at 0.6563, just ahead of 0.6546 fibonacci level. Intraday bias will be back on the upside for 55 day EMA (now at 0.6784). Sustained break there will pave the way back to retest 0.7156 high. On the downside, however, sustained break of 0.6546 will carry larger bearish implication and target 0.6169 low.
In the bigger picture, rise from 0.6169 (2022 low) has completed at 0.7156, after rejection by 55 month EMA (now at 0.7158). Deeper decline would then be see back to 61.8% retracement of 0.6169 to 0.7156 at 0.6546, even as a corrective fall. Sustained break there will raise the chance of long term down trend resumption through 0.6169 low.
Economic Indicators Update
| GMT | Ccy | Events | Actual | Forecast | Previous | Revised |
|---|---|---|---|---|---|---|
| 04:30 | JPY | Tertiary Industry Index M/M Jan | 0.90% | 0.30% | -0.40% | |
| 09:00 | EUR | Italy Trade Balance (EUR) Jan | 1.50B | 1.07B | ||
| 09:30 | GBP | Consumer Inflation Expectations | 4.80% | |||
| 10:00 | EUR | Eurozone CPI Y/Y Feb F | 8.60% | 8.60% | ||
| 10:00 | EUR | Eurozone CPI Core Y/Y Feb F | 5.60% | 5.60% | ||
| 12:30 | CAD | Industrial Product Price M/M Feb | -0.30% | 0.40% | ||
| 12:30 | CAD | Raw Material Price Index Feb | -0.20% | -0.10% | ||
| 13:15 | USD | Industrial Production M/M Feb | 0.60% | 0.00% | ||
| 13:15 | USD | Capacity Utilization Feb | 78.50% | 78.30% | ||
| 15:00 | USD | Michigan Consumer Sentiment Index Mar P | 67 | 67 |
Bullish Elliott Wave Outlook in Gold (XAUUSD)
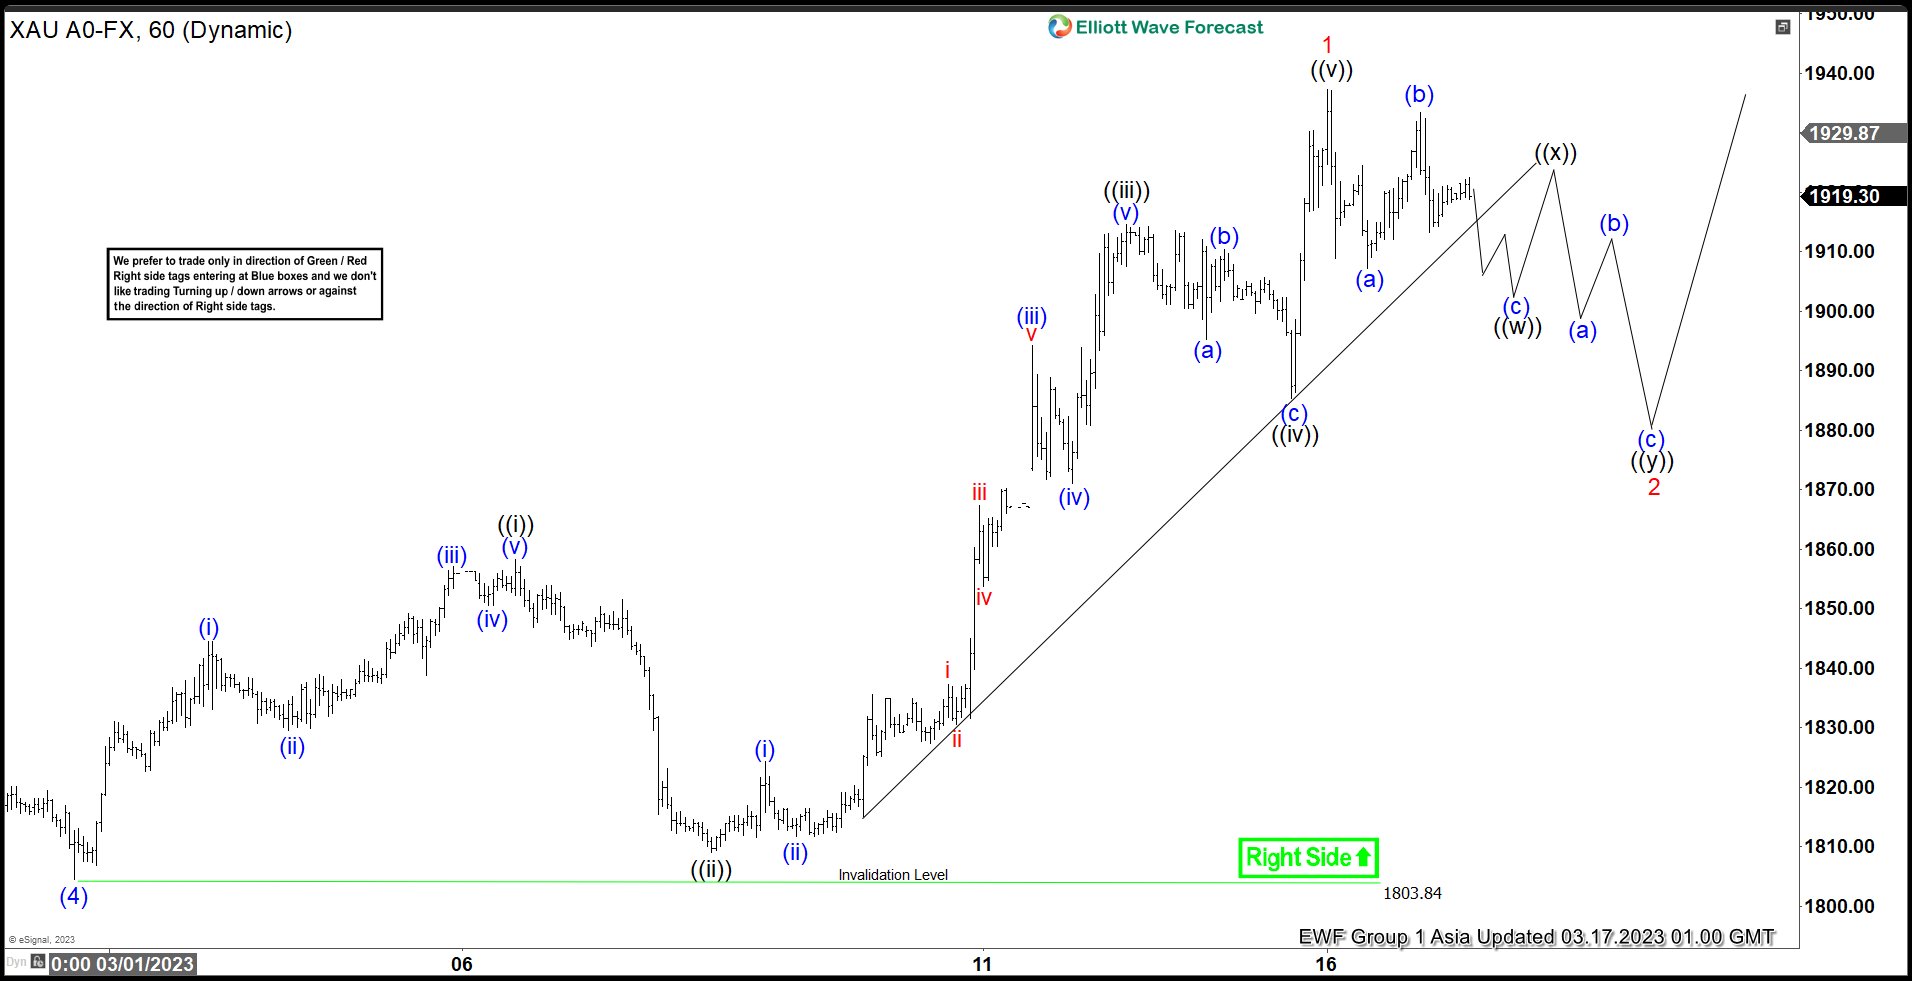
Gold (XAUUSD) ended wave (4) at 1803.84. From here, it rallies as a 5 waves impulse Elliott Wave structure. Up from wave (4), wave ((i)) ended at 1858.33 and pullback in wave ((ii)) ended at 1809. The metal then resumes higher in wave ((iii)) towards 1914.60. Pullback in wave ((iv)) ended at 1885.40. Final leg higher wave ((v)) ended at 1937.31 which completed wave 1.
Wave 2 pullback is now in progress to correct cycle from 2.28.2023 low in larger degree 3, 7, or 11 swing before the rally resumes. Wave 2 is proposed to be unfolding as a double three Elliott Wave structure. Down from wave 1, wave (a) ended at 1907.1 and wave (b) rally ended at 1933.42. While below wave 1 at 1937.31, expect Gold to extend lower in wave (c) of ((w)). Afterwards, it should rally in wave ((x)) before turning lower again in 3 waves to end wave ((y)) of 2. If Gold breaks above 1937.31 instead, then that means Gold is still in the process of ending wave 1. Near term, as far as pivot at 1803.84 low stays intact, expect dips to find support in 3, 7, or 11 swing for further upside.
Gold 60 Minutes Elliott Wave Chart
XAUUSD Elliott Wave Video
https://www.youtube.com/watch?v=t_Z94QCqPUI
Technical Outlook and Review
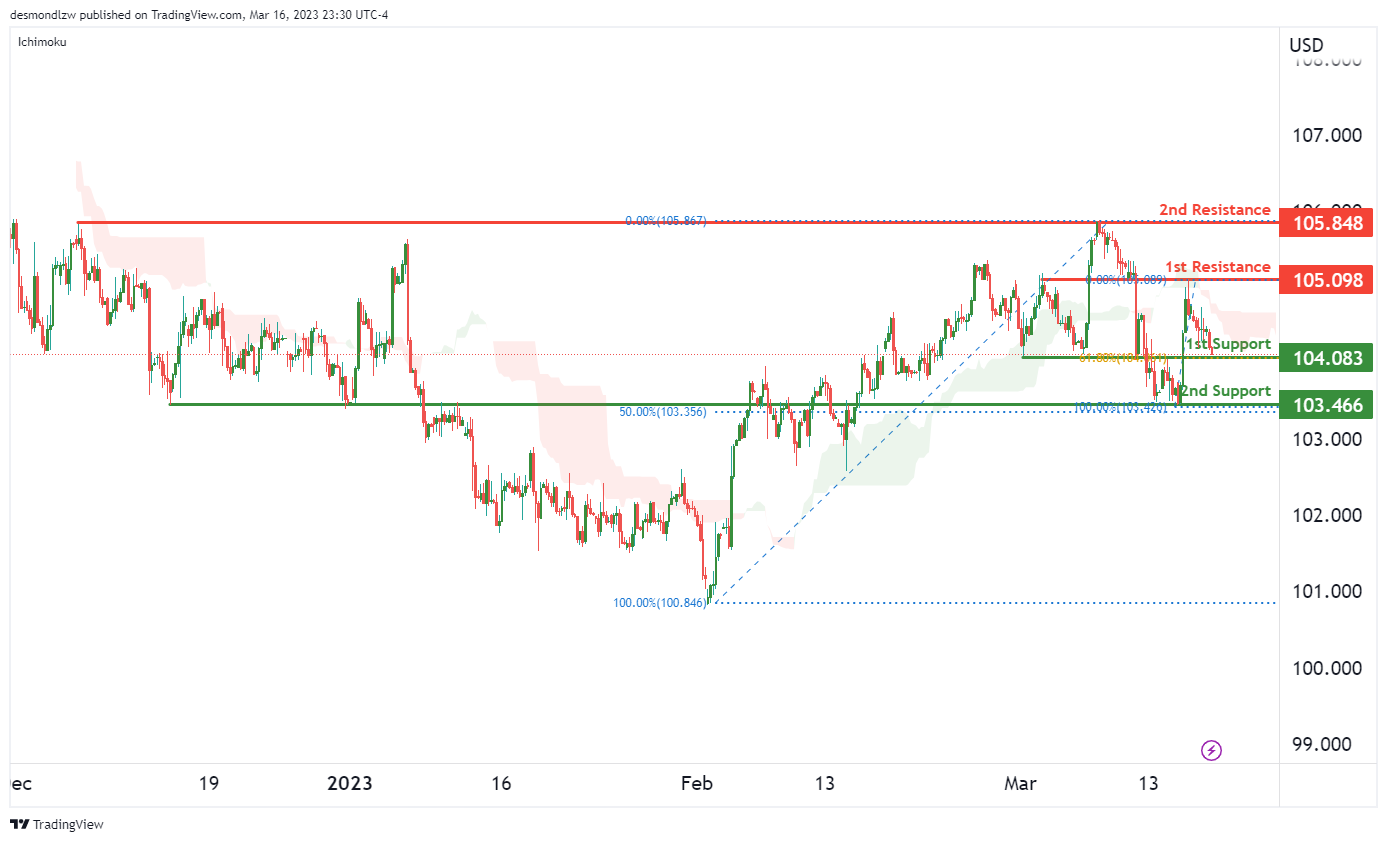
DXY:
The DXY chart shows a bearish momentum with price currently below the bearish Ichimoku cloud. There is a potential for a bearish break off the 1st support level at 104.08, which is a strong overlap support and coincides with a 61.80% Fibonacci retracement. If price were to drop below this level, it could head towards the 2nd support at 103.46, which is another overlap support and lines up with a 50% Fibonacci retracement.
On the other hand, if price were to rise, it could face resistance at the 1st resistance level of 105.09, which is a swing high resistance level. The 2nd resistance level is 105.84, which is a multi-swing high resistance level.
EUR/USD:
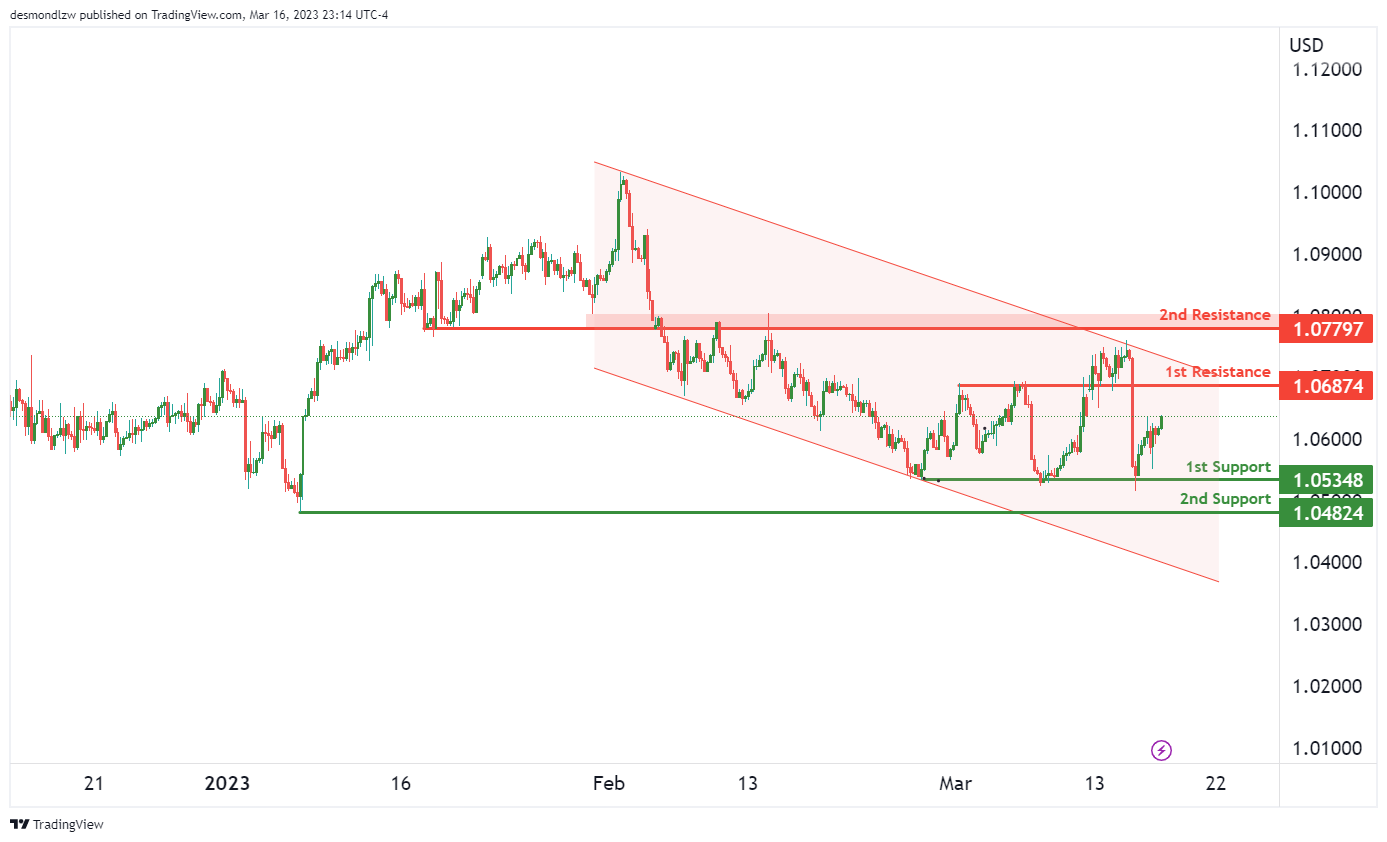
EUR/USD Could See Short-Term Rise Before Resuming Bearish Trend
The overall momentum of EUR/USD is bearish, with the price currently below the bearish Ichimoku cloud. Additionally, the price is trading within a bearish channel, which suggests that the bearish momentum could continue.
However, in the short term, the price could potentially rise towards the first resistance level at 1.0678 before reversing off it and dropping towards the first support level at 1.0534.
The first support level is a multi-swing low support, which makes it a strong level of support. The second support level is a swing low support, which adds to its strength.
The first resistance level is an overlap resistance, which means that it has acted as both support and resistance in the past. Additionally, it coincides with the bearish channel, which further strengthens its significance as a resistance level. The second resistance level is also an overlap resistance, adding to its strength as a potential barrier to price movement.
It’s worth noting that the price may experience a short-term rise towards the first resistance level before resuming its bearish trend towards the first support level. Traders may want to keep an eye on these key support and resistance levels, as they could offer potential trade opportunities in the EUR/USD pair.
GBP/USD:
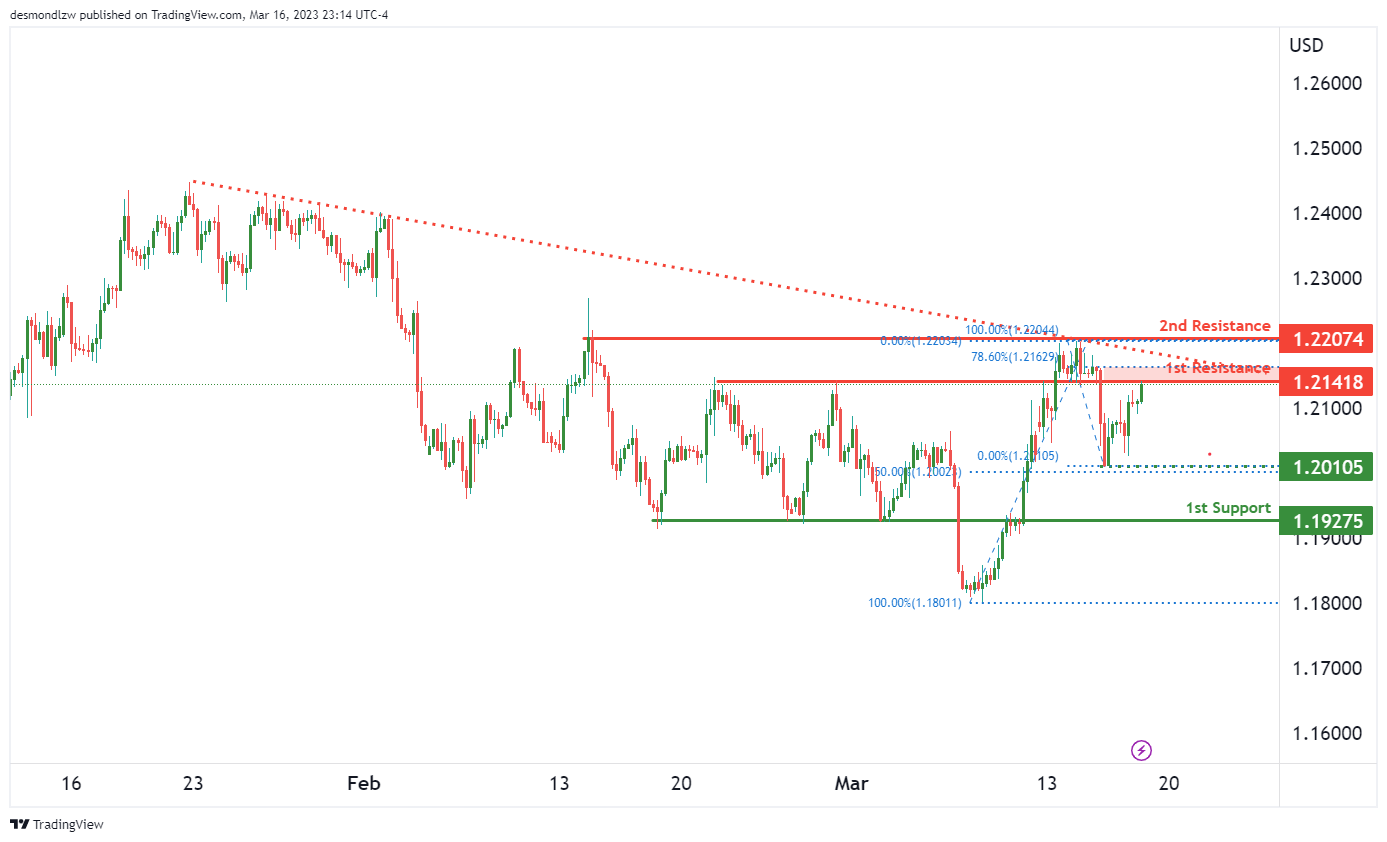
GBP/USD Continues to Face Bearish Momentum
The GBP/USD chart is currently showing bearish momentum, with price below a major descending trend line. This suggests that the currency pair may continue to experience downward pressure in the short term.
If the price were to rise, it could potentially make a bearish reaction off the 1st resistance level and drop to the 1st support. The 1st support level is at 1.1927, which is a strong overlap support. Meanwhile, the intermediate support level at 1.2010 is also a good level to watch as it represents a swing low support and a 50% Fibonacci retracement.
On the other hand, if the price were to break above the 1st resistance level at 1.2141, it could potentially rise to the 2nd resistance level at 1.22074, which is a multi-swing high resistance.
USD/JPY:
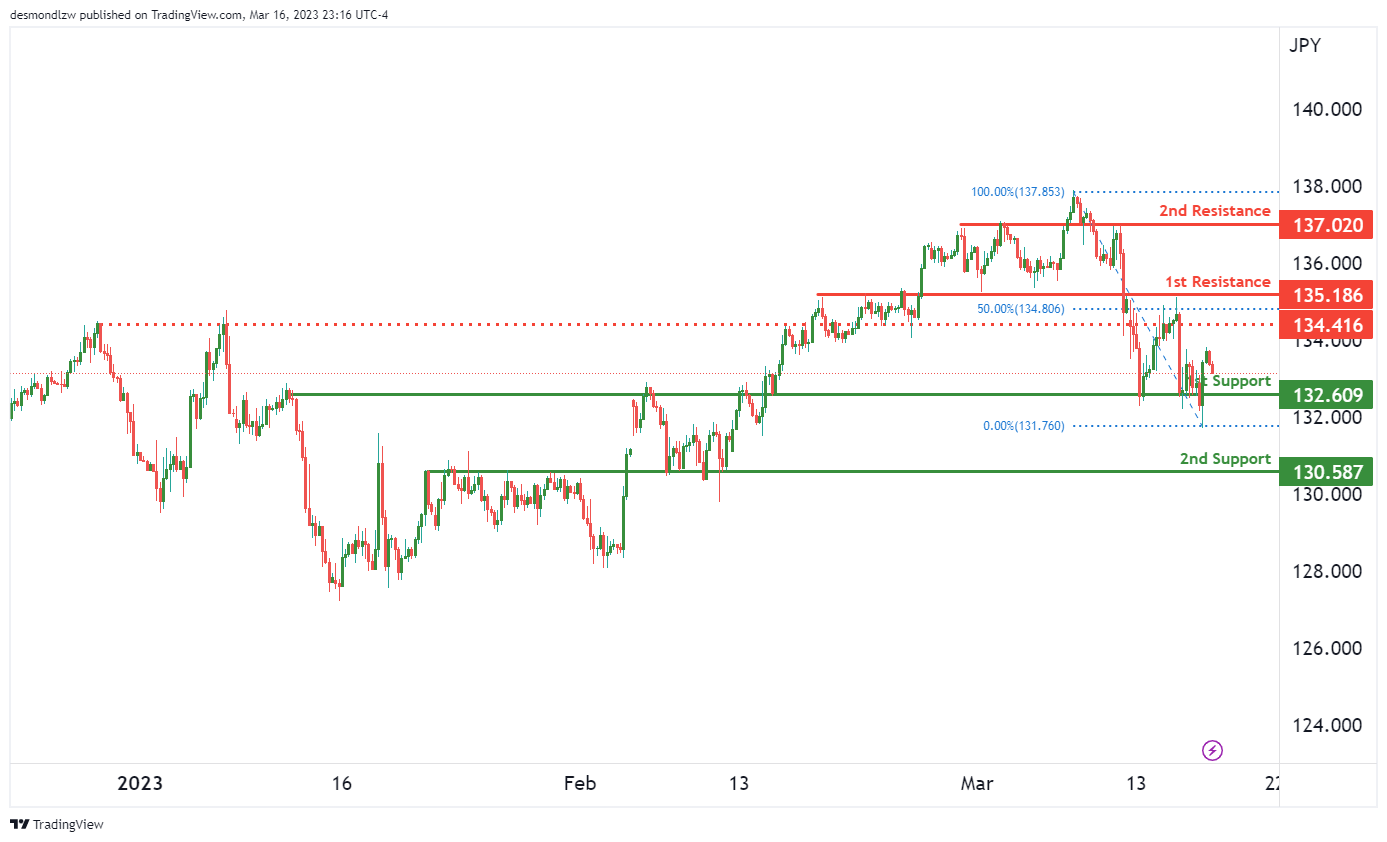
The USD/JPY chart is currently showing a bearish momentum, with price below major resistance levels and the Ichimoku cloud. This suggests that the pair may continue to move lower in the short term.
Looking at the support and resistance levels, the first support level is at 132.6000, which is an overlap support and could potentially provide a bounce if price were to drop to that level. The second support level is at 130.5800, which is also an overlap support and could provide additional support if price were to continue dropping.
On the other hand, the first resistance level is at 135.1800, which is an overlap resistance level that price would need to break above in order to indicate a potential bullish reversal. The second resistance level is at 137.02, which is a multi-swing high resistance level and would require significant momentum for price to break above.
Additionally, there is an intermediate resistance level at 134.4100, which is an overlap resistance and could provide some resistance if price were to rise towards the first resistance level.
AUD/USD:
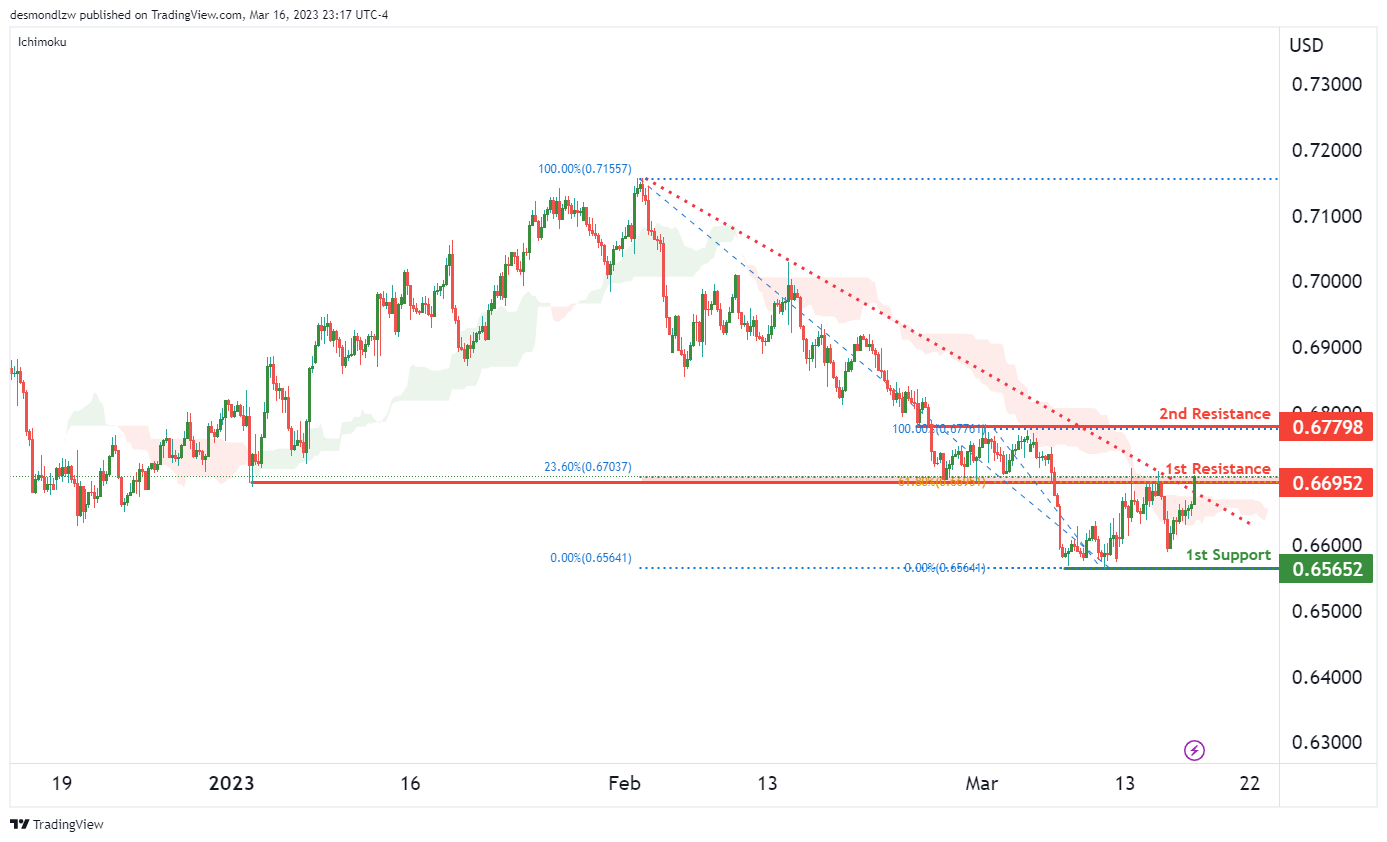
The AUD/USD chart is showing a bullish momentum. The price has broken above a descending resistance line and crossed above the Ichimoku cloud, which is a bullish indication.
The potential price action for AUD/USD could be a bullish break through of the first resistance at 0.6695 and a rise towards the second resistance at 0.6779. The first support is at 0.6565, which is a multi-swing low support.
The first resistance at 0.6695 is a significant level as it coincides with a 38.2% Fibonacci retracement. If the price breaks above this resistance, it could trigger further bullish momentum towards the second resistance level at 0.6779, which is also an overlap resistance level.
NZD/USD:
NZD/USD Chart Shows Bullish Momentum with Potential for Further Upside
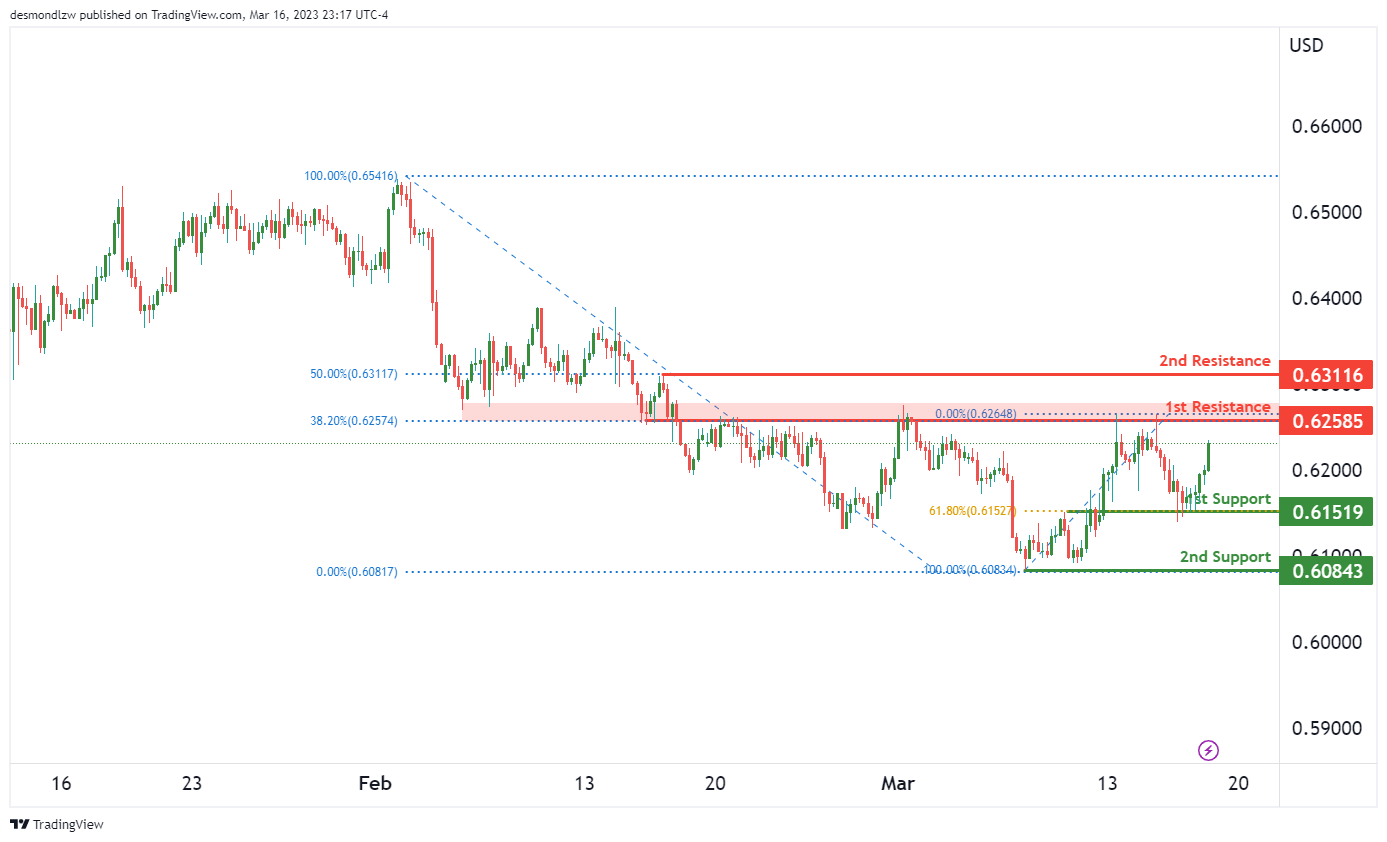
The NZD/USD chart is currently showing strong bullish momentum, with potential for further upside in the short term. Price is currently above the Ichimoku cloud and there is a long-term ascending support line indicating that the overall bias is bullish.
If the current momentum continues, price could potentially continue to rise towards the 1st resistance level at 0.6258, which coincides with a 38.20% Fibonacci retracement level and a major overlap resistance. A break above this level could trigger a move towards the 2nd resistance level at 0.6311, which is also an overlap resistance and lines up with a 50% Fibonacci retracement.
On the other hand, if price were to drop, the 1st support level at 0.6151 could provide a strong support as it is an overlap support and has a 61.80% Fibonacci retracement level lining up with it. The 2nd support level at 0.6084 is also a swing low support and could potentially provide additional support if price were to drop below the 1st support.
USD/CAD:
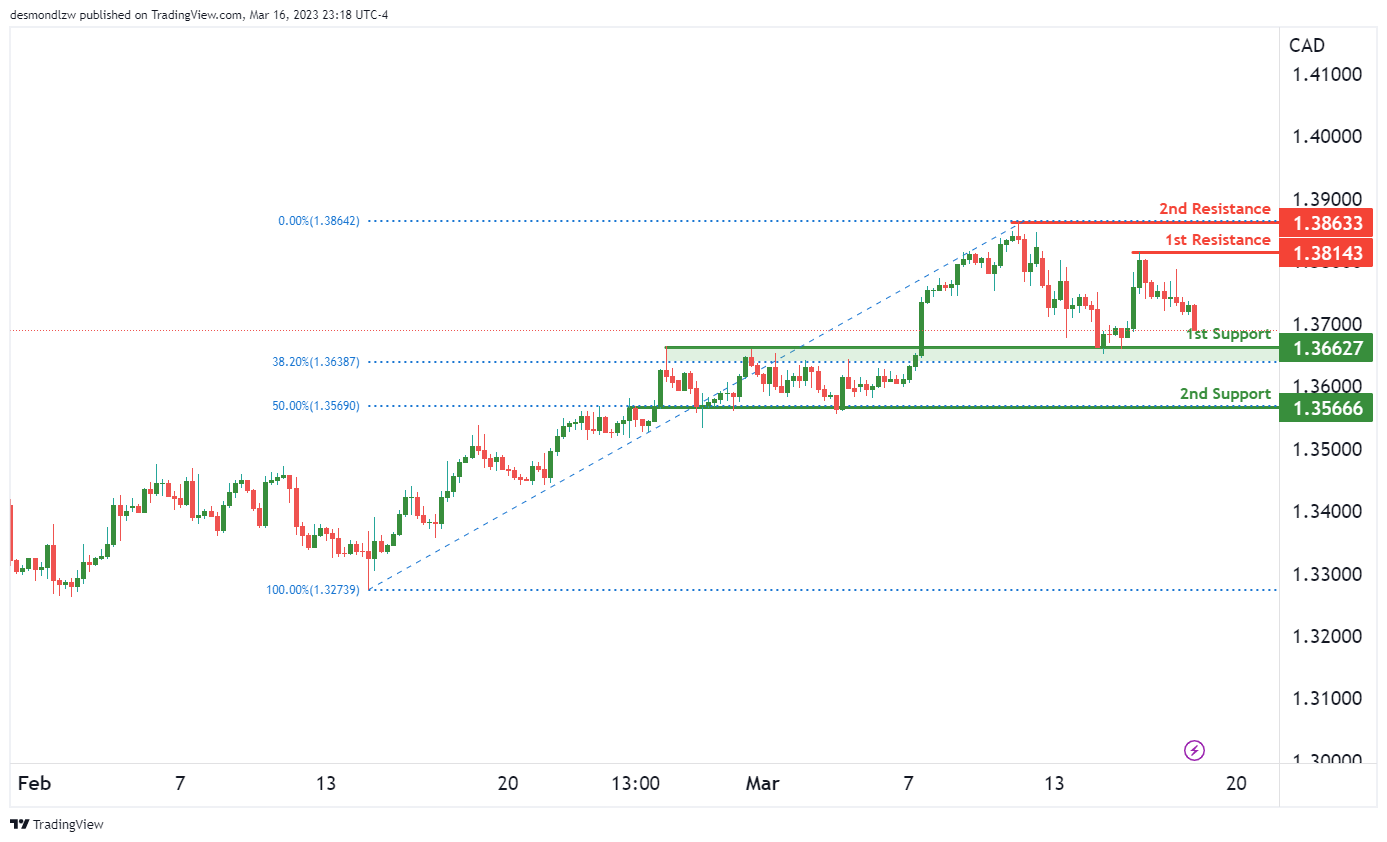
The USD/CAD currency pair has been showing bearish momentum recently, with price currently below major resistance levels. In terms of support and resistance, price could potentially continue its bearish momentum and drop towards the first support level at 1.3662. This level is a strong overlap support, with a 38.20% Fibonacci retracement lining up with it. If price breaks through this support level, the next level it could drop to is the second support level at 1.3566. This level is also a strong overlap support, with a 50% Fibonacci retracement lining up with it.
On the resistance side, we can see price approaching a strong resistance level of 1.3814, which is our first resistance level. This resistance level is a swing high resistance, indicating a potential reversal to push prices down to our first support level. If price manages to break through the first resistance level, it could potentially rise towards the second resistance level at 1.3863, which is another swing high resistance level.
DJ30:
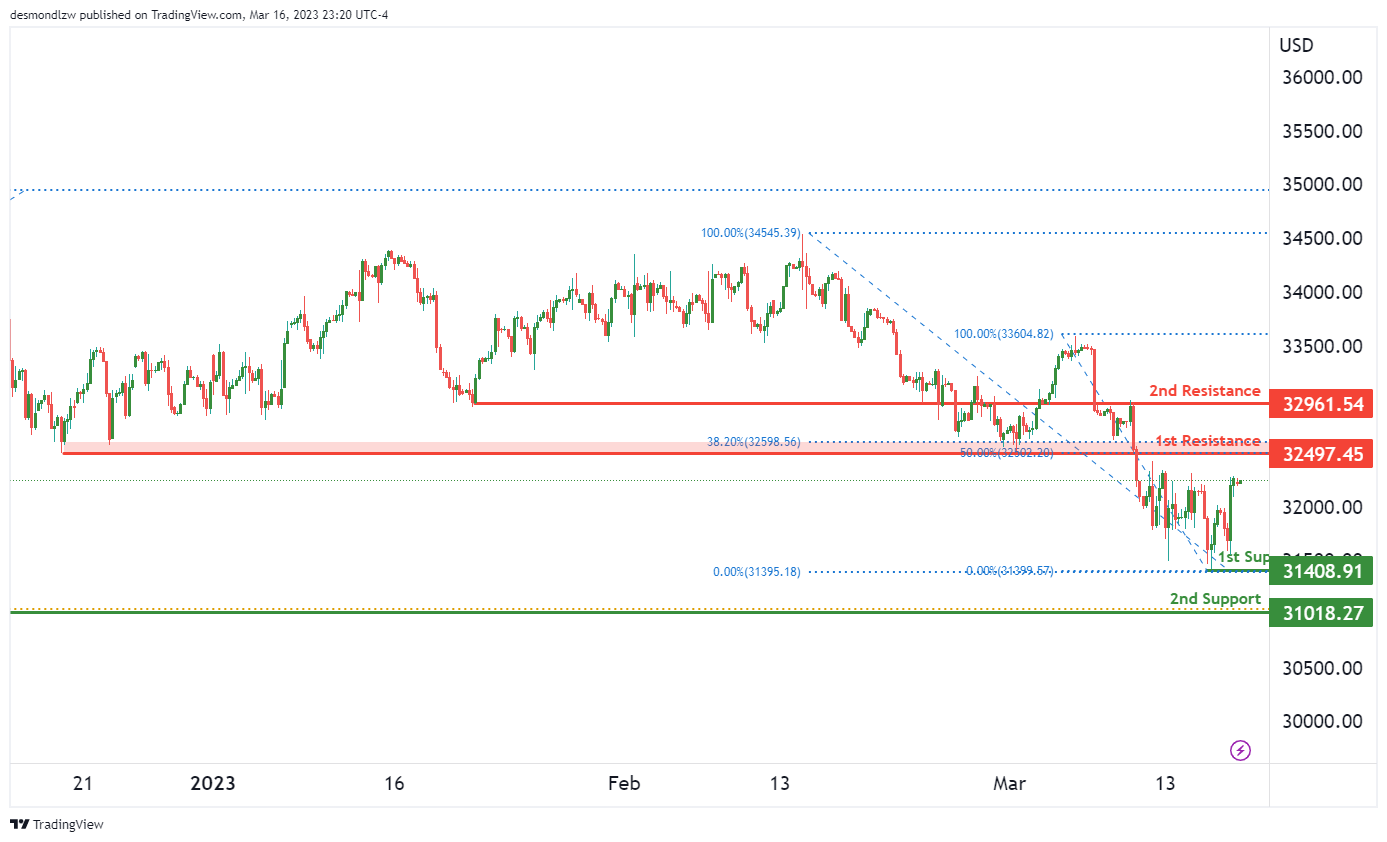
The DJ30 has been experiencing bearish momentum as it remains below the Ichimoku cloud. Price is potentially poised for a short-term rise towards the first resistance level before reversing off it and dropping towards the first support.
The first support level is at 31408, which is a strong swing low support. If the price were to break this level, the next support level could be at 31018, another swing low support level. On the other hand, the first resistance level is at 32497, which is an overlap resistance level that coincides with a 38.20% Fibonacci retracement. A break of this resistance could lead to a potential rise towards the second resistance level at 32961, which is also an overlap resistance level.
It’s important to note that the DJ30 has been experiencing bearish momentum due to various factors contributing to the trend, including the fact that it remains below the Ichimoku cloud. This suggests that the bearish momentum may continue. However, if the price were to break through the first resistance level and rise towards the second resistance level, this could potentially signal a shift in momentum towards a more bullish trend.
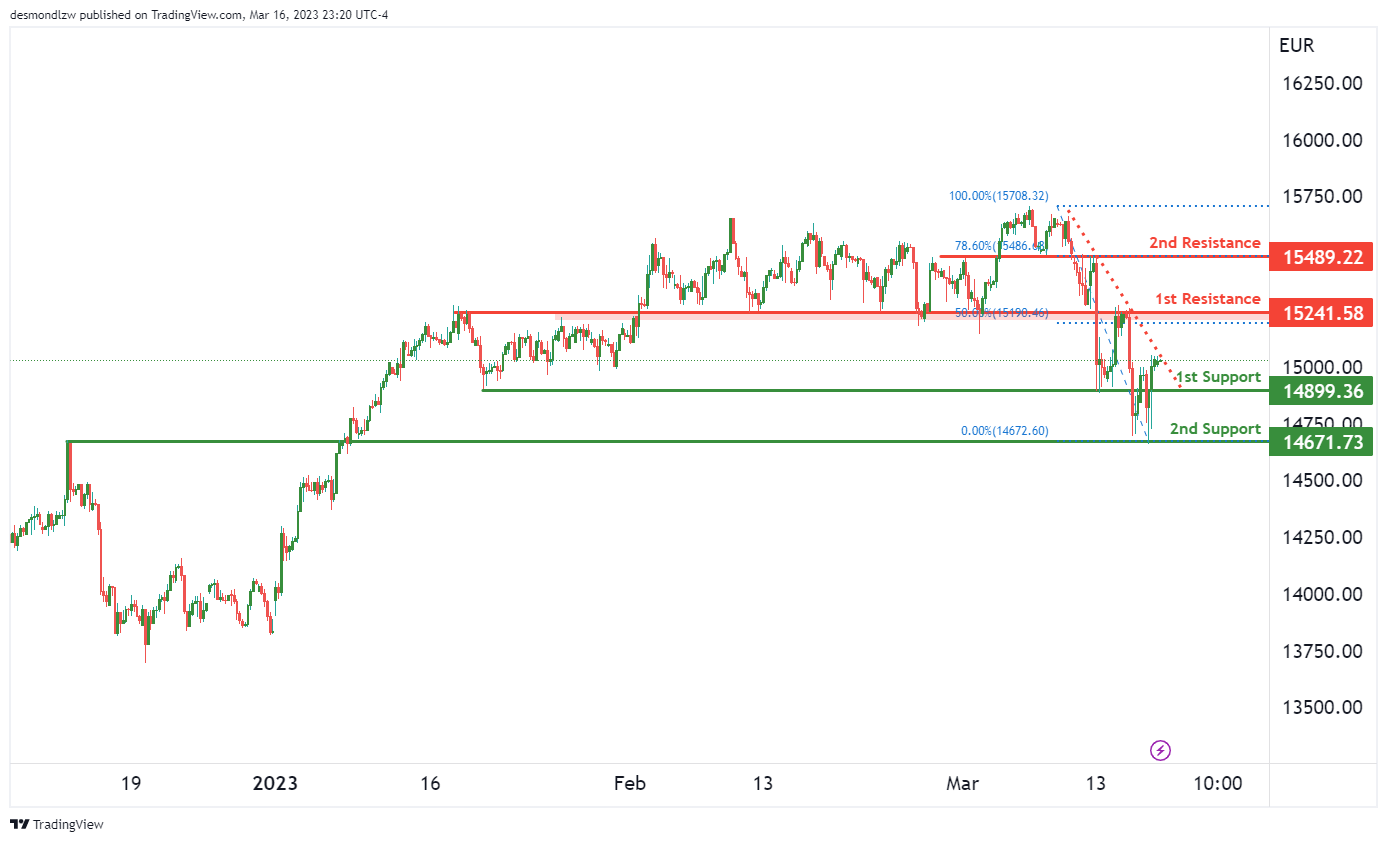
GER30:
The GER30 chart is currently showing bullish momentum, with price potentially making a continuation towards the first resistance level. This is supported by the fact that price is currently above both the Ichimoku cloud and a descending resistance line.
If the bullish trend continues, the first resistance at 15241 is a significant level to watch, as it coincides with a 50% Fibonacci retracement. A break above this level could lead to further bullish acceleration towards the second resistance at 15489, which is an overlap resistance and coincides with a 78.60% Fibonacci retracement.
On the downside, the first support at 14899 is a strong overlap support that price has bounced off of multiple times in the past. If price were to break this support, the next support level it could drop to is the second support at 14671, which is also an overlap support.
BTC/USD:
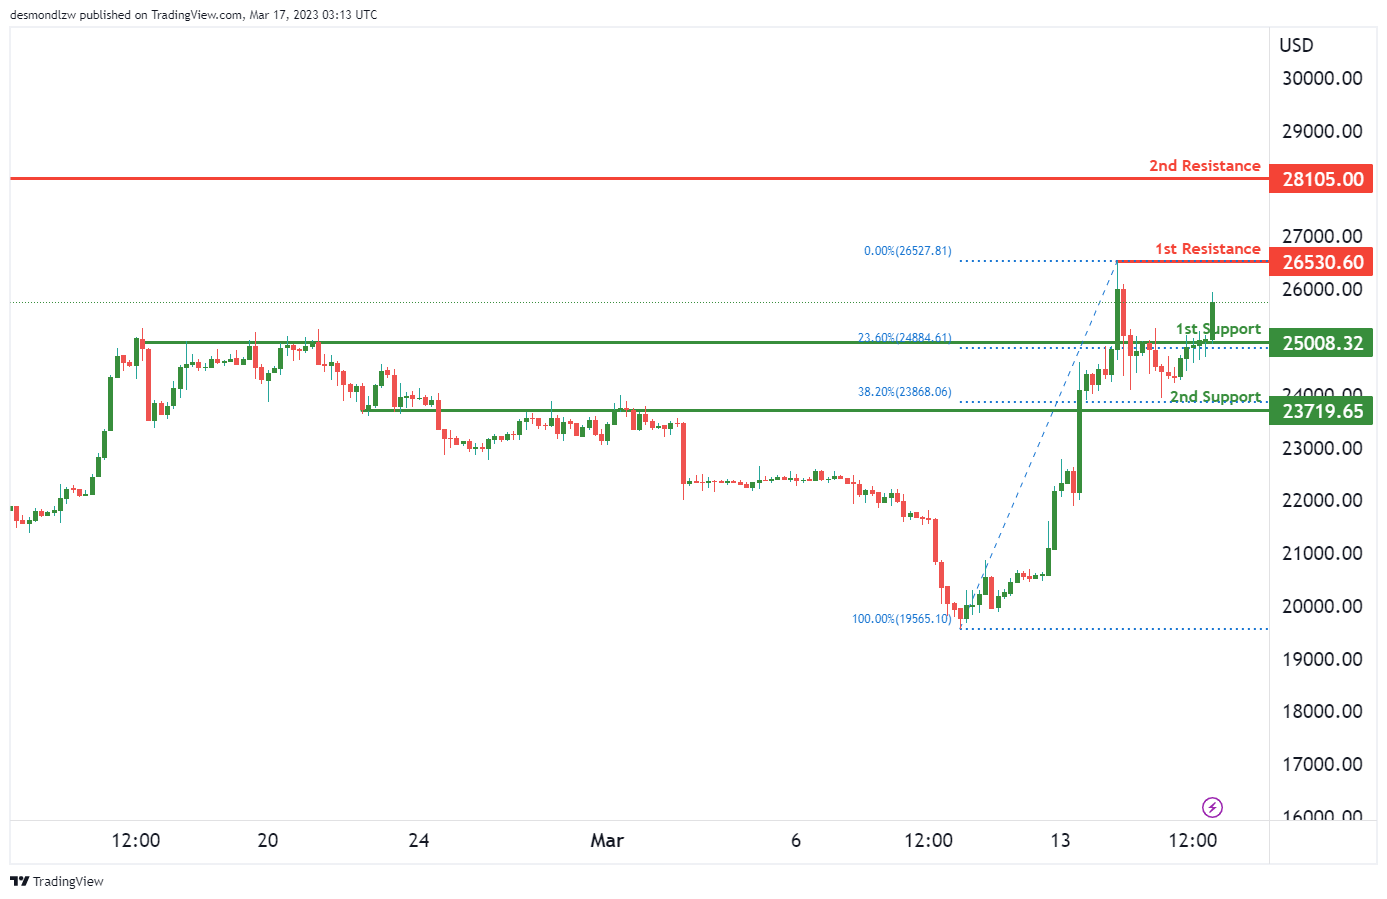
Bitcoin (BTC/USD) continues to display strong bullish momentum, with high confidence for further upside potential. The overall momentum of the chart is bullish, and price is showing no signs of slowing down.
Price has the potential to make a bullish continuation towards the first resistance level at 26530, and potentially towards the second resistance level at 28105.
For support levels, we have the first support level at 25008, which is an overlap support level and a 23.60% Fibonacci retracement. The second support level is at 23719, which is also an overlap support level and a 38.20% Fibonacci retracement.
It is important to note that Bitcoin is a highly volatile asset, and price movements can be unpredictable. However, the strong bullish momentum and high confidence in further upside potential make it a promising investment opportunity for those who are bullish on the cryptocurrency.
US500
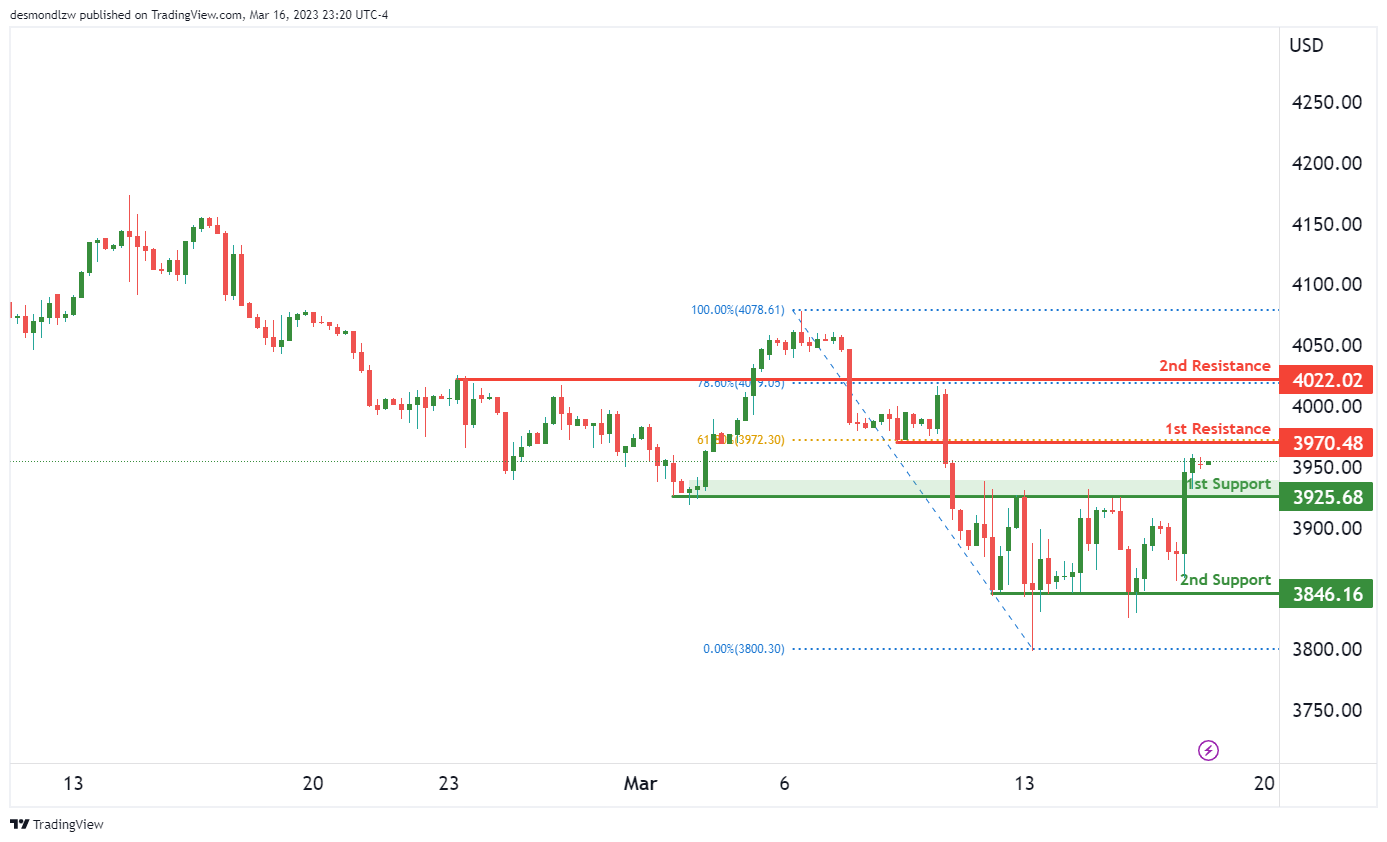
The US500 has been showing a strong bullish momentum. The price is potentially poised for a bullish continuation towards the 1st resistance level.
The first support level is seen at 3925 which is an overlap support. The second support level is at 3846, which is a multi-swing low support. These levels are important to keep an eye on in case of any potential pullbacks.
On the upside, the first resistance level is at 3970, which is an overlap resistance and coincides with the 61.80% Fibonacci retracement level. The second resistance level is at 4022, which is also an overlap resistance and coincides with the 78.60% Fibonacci retracement level.
Overall, the bullish momentum in the US500 is likely to continue towards the first resistance level, with the support levels at 3925 and 3846 providing potential buying opportunities in case of any pullbacks. It is important to keep an eye on the resistance levels at 3970 and 4022 as they will determine the strength of the bullish momentum.
ETH/USD:
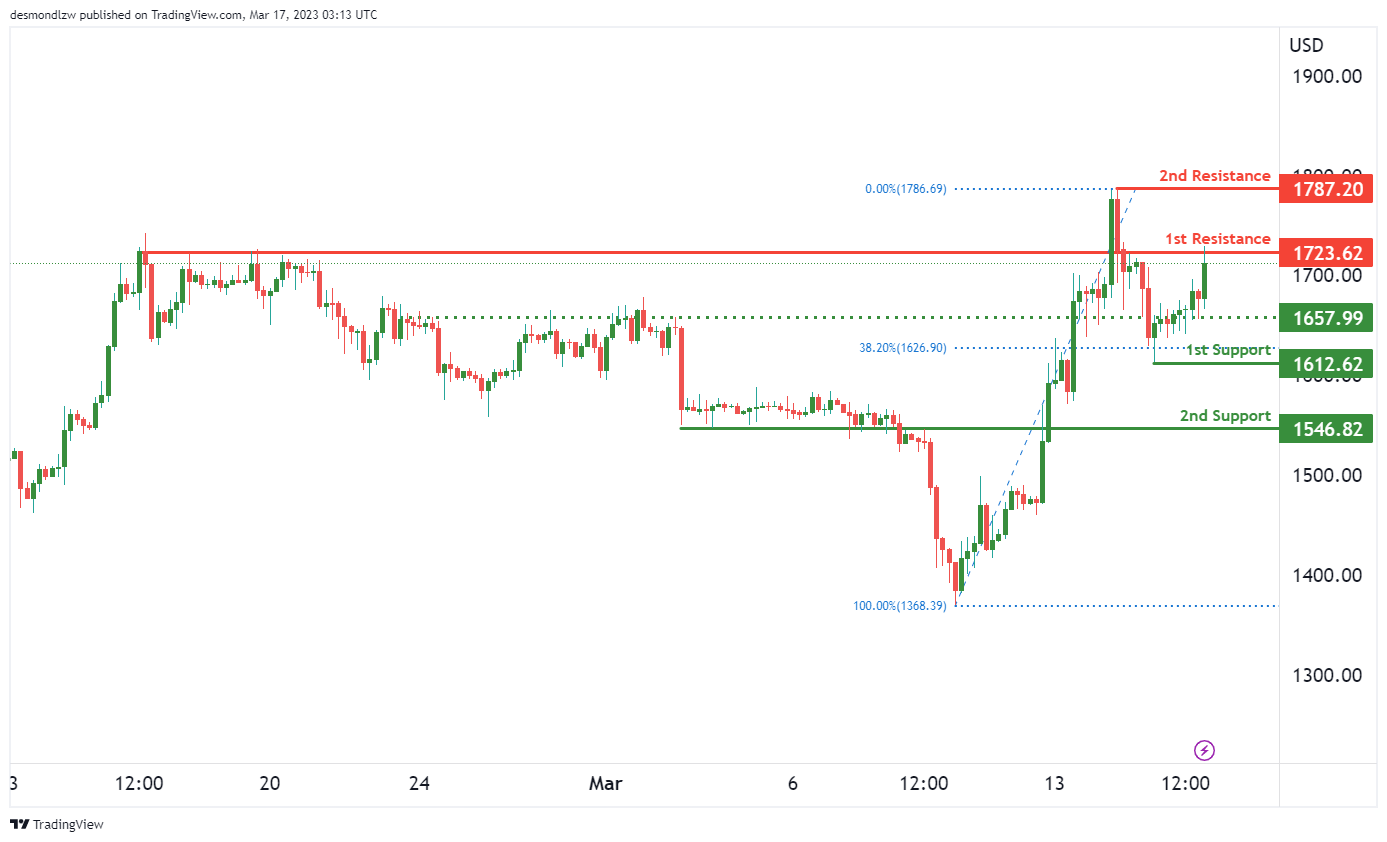
ETH/USD Shows Bearish Momentum, Potential for Drop Towards First Support
The overall momentum of the ETH/USD chart is bearish, with factors contributing to the momentum such as price being below any major resistance line. This suggests that the bears are in control of the market.
Price could potentially make a bearish reaction off of the first resistance level and drop to the first support level. The first support level sits at 1612, which is a swing low support level and a 38.20% Fibonacci retracement. This level is expected to provide strong support as it has previously acted as a reversal point.
If the price drops below the first support level, the next level of support is at 1546, which is an overlap support level.
On the other hand, the first resistance level is at 1723, which is an overlap resistance level. If the price manages to break through this resistance, it could potentially rise towards the next resistance level at 1787, which is a swing high resistance level.
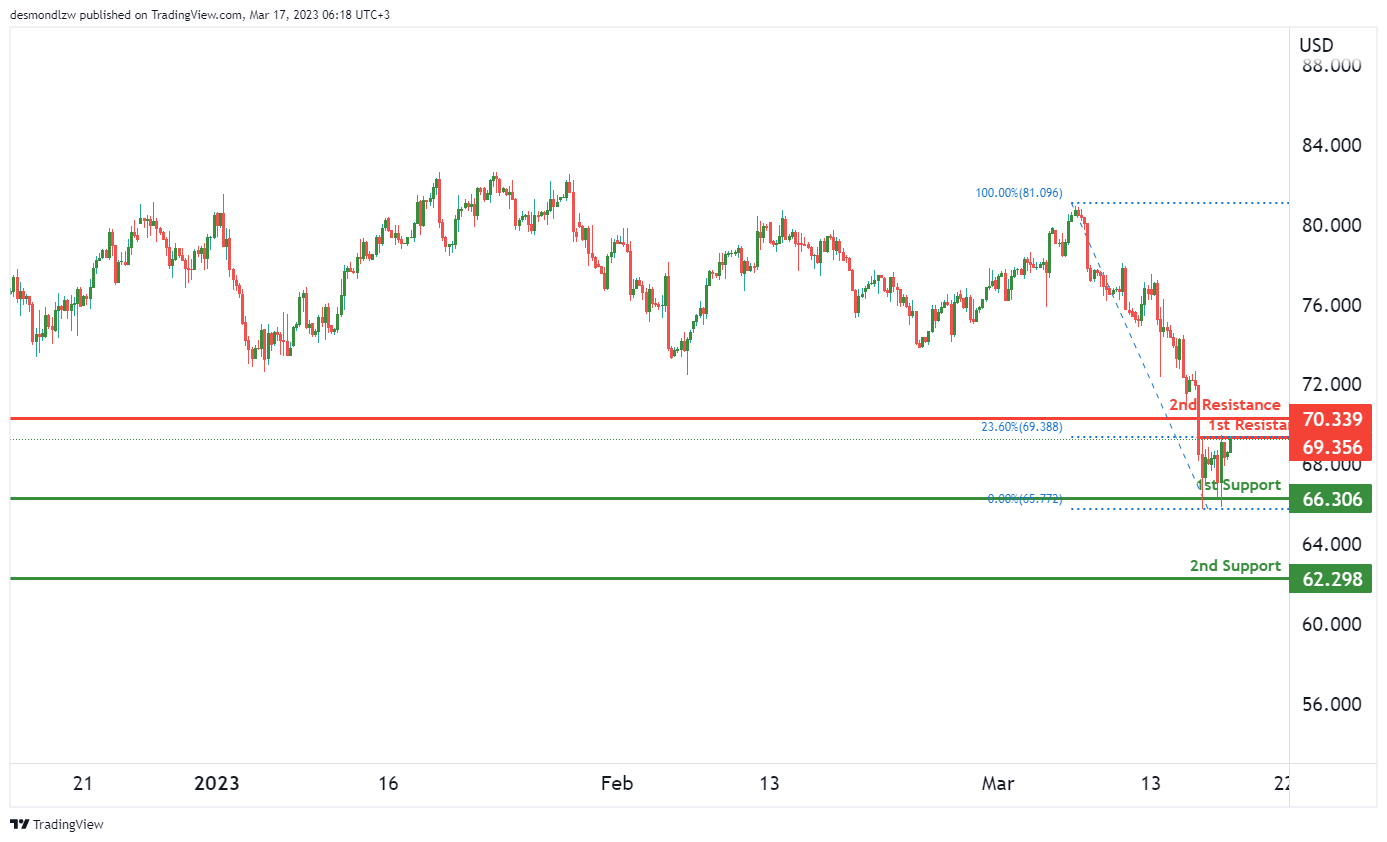
WTI/USD:
WTI chart has a bearish momentum. This is supported by the fact that the price is currently within the bearish Ichimoku cloud, which suggests that there is bearish resistance in place.
Looking at the potential price action, there is a possibility that price could make a bearish reaction off the first resistance level and drop towards the first support level. The first support level is at 66.30, which is a multi-swing low support level. The second support level is at 62.29, which is a swing-low support level.
On the upside, the first resistance level is at 69.35, which is an overlap resistance level and also coincides with the 23.60% Fibonacci retracement level. The second resistance level is at 70.33, which is also an overlap resistance level.
XAU/USD (GOLD):
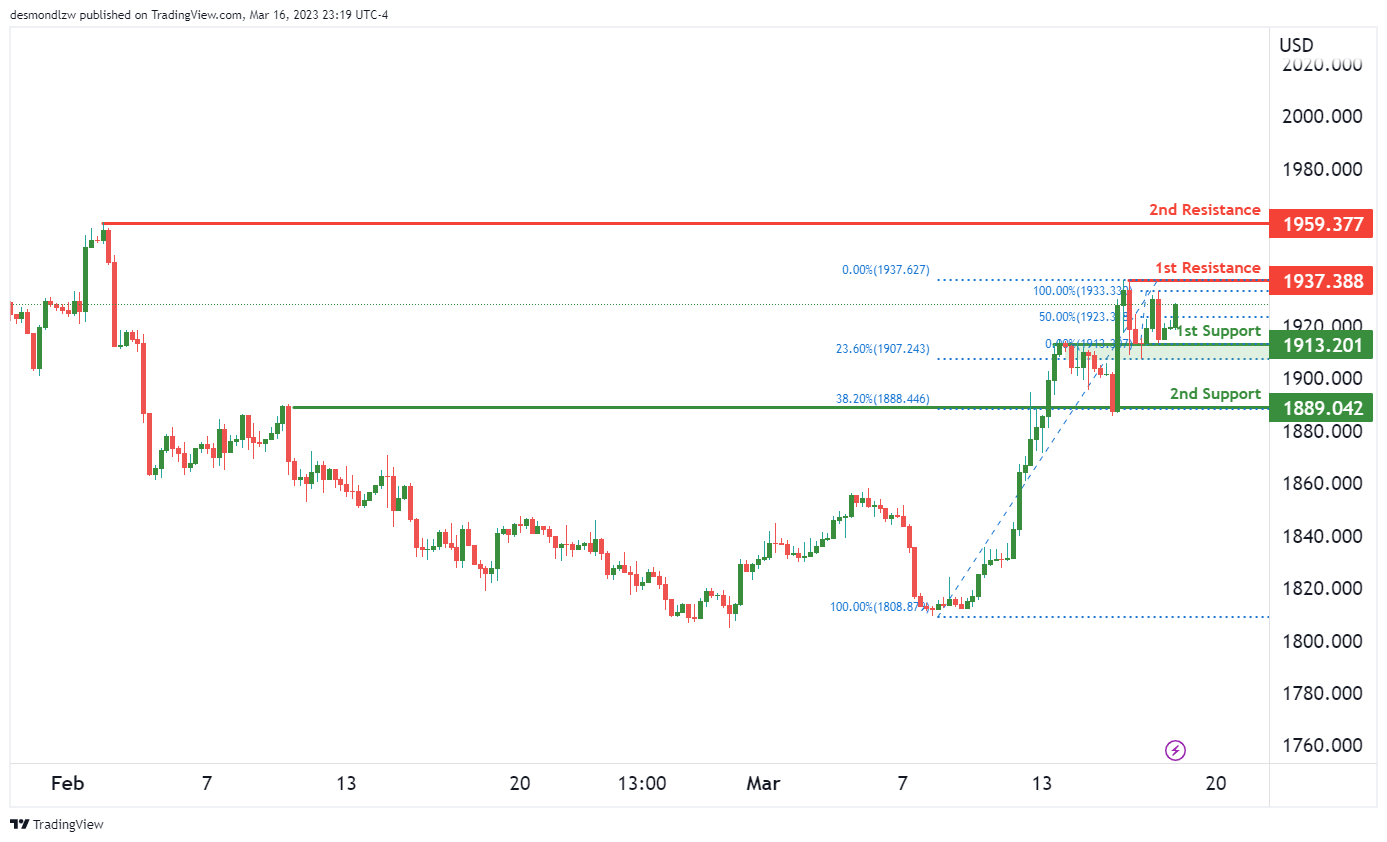
XAU/USD is currently bullish. The chart analysis identifies that the price may potentially make a bullish continuation towards the 1st resistance level. The 1st support level is identified at 1913, which is considered to be an overlap support and at the 23.60% Fibonacci retracement level. The 2nd support level is identified at 1889, which is also an overlap support and at the 38.20% Fibonacci retracement level. On the other hand, the 1st resistance level is identified at 1937, which is considered to be a multi-swing high resistance. The 2nd resistance level is identified at 1959, which is a swing high resistance.
Bitcoin broke key resistance, safe-haven asset or tech sector barometer?
Bitcoin has showcased remarkable resilience amid recent turmoil in financial markets, prompting discussions about its potential status as a safe-haven asset. The leading cryptocurrency has outperformed traditional safe havens such as gold this week, further fueling this debate.
Interestingly, Bitcoin has displayed a correlation with the NASDAQ index, suggesting that it may serve as a leading indicator or confirmation signal for risk appetite, particularly in the technology sector. It's could still be more of a tech sector barometer.
In either case, the breakthrough of 25242 resistance indicates that rally from 15452 is resuming. More significantly, the break above the 55 week EMA and 25198 structural resistance suggests that Bitcoin is now in the midst of correcting the entire downtrend from its 2021 record high of 68986, as a medium term move.
In the short term, further gains are expected, with a target of 100% projection of 15452 to 25242 from 19552 at 29342. The market's reaction at this level will provide insight into the potential trajectory of the medium-term rise from 15452.
Additionally, the momentum of Bitcoin's ascent could be an important factor in determining the likelihood of NASDAQ breaking through the 12269.55 resistance level.
As market participants keep a close eye on these developments, Bitcoin's performance may hold broader implications for the technology sector and the overall market sentiment.
NASDAQ displays bullish sign after major banks rescue First Republic
US stocks experienced a notable rebound overnight as major banks stepped in to rescue the beleaguered First Republic Bank, preventing the potential contagion from evolving into a full-blown banking crisis.
Bank of America, Goldman Sachs, JP Morgan, and others have collectively agreed to deposit USD 30B in First Republic, which has faced a mass withdrawal of customer funds in the wake of Silicon Valley Bank's collapse and concerns that First Republic could be next.
In a joint statement on Thursday, the banks expressed their confidence in the US banking system, stating, "Together, we are deploying our financial strength and liquidity into the larger system, where it is needed the most."
Among the major US stock indexes, NASDAQ led the way with an impressive 2.48% rally. From a technical perspective, there are indications of bullish momentum, as the index closed above the near-term trend line resistance. This development suggests that the corrective pullback from 12269.55 may have concluded at 10982.80 already.
In the coming days, reaction to the 11827.92 resistance level should be closely monitored. A firm break above this threshold would solidify the bullish case, potentially leading to a resumption of the rally from 10207.47 through the 12269.55 resistance level.
Cliff Notes: US and European Banking Sector Uncertainty to Limit Central Bank Actions
Key insights from the week that was.
The US banking system was in the spotlight this week, with fragility emerging amongst the regional banks, shocking global interest rate expectations. Domestically, data received was broadly in line with our views on the economy.
Beginning in Australia, the Westpac-MI Consumer Sentiment survey delivered yet another dismal update on confidence. That the headline index remained at 78.5 for a second consecutive month indicates sentiment is firmly entrenched in deeply pessimistic territory, a situation only comparable to the major economic dislocations observed during the 1980s-90s. With inflation and interest rates remaining the dominant concern for households, the survey reported a further weakening in expectations for family finances, intentions to purchase a major household item, and the medium-term economic outlook.
Most notable, however, was the sharp deterioration in homebuyer sentiment. The ‘time to buy a dwelling’ sub-index fell 11.1% in February to 65.7, the weakest reading since 1989 – an era where standard variable mortgage rates were in excess of 15%. Exacerbated by a curious lift in house price expectations (+8.6%), it seems price-led improvements in affordability are no longer providing a buffer to the severe impact of rising interest rates on housing market confidence. Despite recent softening, household’s views around the labour market remain broadly supportive, with expectations for unemployment still below the long-run average.
On employment, the February labour force survey reported an expected bounce-back in jobs as a larger-than-usual number of people who were waiting to start a new job – identified in the January survey – returned to work. The gains were evident across most areas of the survey: the 64.6k lift in employment growth more than reversing the 27.5k decline reported in the prior two months; the unemployment rate falling from 3.7% to 3.5% as a surge in full-time work saw the underemployment rate fall 0.4ppts to 5.8%; and accordingly, seasonally adjusted hours worked lifting by a substantial 3.9%. Taken together, it suggests that the labour market has begun the year on a firm footing; however, the outlook remains challenging, with slack to emerge in the labour market into the second half of 2023.
Into the longer-term, the recovery in immigration flows should provide some underlying support to the problem of labour unavailability. Indeed, according to official population data, the estimate for net overseas migration in Q3 2022 printed a record +106.2k for the quarter. This, in addition to the upward revisions for Q1 and Q2, aligns with our view that net overseas migration is set to print at a historic high in 2022. Looking at 2023, Australia’s overseas arrivals and departures data also continues to reflect substantial progress, with strong net inflows of temporary workers and a sizeable lift in international student arrivals, up +120k in February. From the removal of COVID-zero restrictions, the nascent strength in inflows from China is also becoming increasingly apparent, indicating that immigration will remain highly supportive of labour supply over the next few years.
Given the sustained pressures around business conditions, the fragility of business confidence re-emerged as a key issue in the latest NAB business survey. Indeed, the survey reports that high inflation and rising interest rates remain a clear drag on the strength of demand, as evinced by the continued cooling in forward orders growth and the downtrend in general business conditions. As a consequence of these mounting headwinds, the business confidence index declined by 10pts, and is once again reflective of a pessimistic business mood. With the domestic outlook gloomy, business confidence will struggle to earn significant reprieve over the period ahead.
Taking into consideration the sum of domestic conditions and the global uncertainties discussed below, we have changed our RBA view. As discussed by Chief Economist Bill Evans, we now expect a pause in April to be followed by a 25bp hike at the May meeting to 3.85% which we now expect will be the peak rate for this cycle. We continue to believe an extended pause will prove necessary into 2024 given inflation’s persistence after which 150bps of easing is expected, 25bps a quarter from Q1 2024 to 2.35% in Q2 2025.
Moving offshore, the closure of Silicon Valley Bank (SVB) last Friday shocked global financial markets given its significance to both the tech sector and the national economy. Signature Bank in New York was also closed within days, and a cascading crisis of confidence ensued. Mid-week, the threat of rapid outflows and a dramatic decline in its share price saw another regional bank, First Republic, downgraded to junk by both S&P and Fitch despite there being no known similarities with SVB or Signature, nor obvious concern regarding its business practices. This also occurred despite authorities’ swift action to guarantee the deposits of both SVB and Signature after they re-opened under the control of the FDIC. Overnight then, a combined effort by US banks and regulators was needed to sure up confidence in First Republic and the sector more broadly, banks across the country depositing a cumulative $30bn of deposits to show trust and provide liquidity.
Along with the measures already in place, this action should go a long way to restoring trust in the regional banks amongst households and businesses. However, the hit to broader confidence is likely to have a lasting impact on economic activity and employment, particularly given the economy has been growing below trend for a year and there are downside risks for the period ahead.
Inflation also remains a risk though. While core CPI inflation (ex food and energy) surprised to the upside in February at 0.5%, this was a result of shelter which contributed close to 0.3ppts by itself. For the policy outlook, this is not a concern as all leading indicators of rents point to an abrupt deceleration ahead. The remaining detail was also constructive for the medium-term. Goods inflation was negligible overall, and key sub-categories such as food witnessed to easing commodity and wage pressures – note, the latter was also evinced last Friday by the February nonfarm payrolls report where both hourly and weekly earnings decelerated, keeping real wage growth negative. Albeit volatile and still high versus history, on a multi-month basis, growth in the price of airfares is also in a downtrend. New car prices meanwhile were little changed and used car prices continue to fall. Incorporating this information into our forecasts, we continue to expect a return to near-target inflation in the second half of 2023.
So for the FOMC, while there is still cause to raise by 25bps next week, this is likely to be the last hike for the cycle, with the uncertainty around the banking sector to also tighten financial conditions. A lengthy pause is still expected into early-2024 however, as it will take time for inflation risks to fully subside. Over 2024 and 2025, we then expect the fed funds rate to be brought back near neutral, allowing growth to slowly accelerate back towards trend.
While the market currently has considerable doubts over the outlook for the FOMC given the uncertainties around US banks, the ECB’s decision to still raise by 50bps at their March meeting despite Credit Suisse’s woes and fears over the implications for the European financial system highlights that central banks have confidence and also like to keep their monetary and financial stability decision making separate. In the press conference that followed the Council’s decision, ECB President Lagarde made clear that the ECB and regulators stood ready to do what is necessary to avert any risk of crisis or disfunction in the banking system; but she also highlighted the need to make sure that risks to the welfare of the economy from inflation are dealt with. Without incorporating the effects of current developments, inflation was forecast by the ECB to come back to target in late-2025 even with growth above trend in both 2024 and 2025 (1.6%). As for the US, recent instability is likely to soften growth and dampen inflation, reducing the need for further policy action from the Governing Council. We now also only see one more hike of 25bps by the ECB at their next meeting, with policy to then remain on hold to 2024 before a progressive return to a neutral level by mid-2025.
Data from China this week was thankfully very constructive. Following the end of COVID-zero and despite the usual disruptions of lunar new year, fixed asset investment surprised to the upside, growing 5.5% year-to-date at February. This included a significant positive surprise for residential construction, fuelled by a return to growth for property sales, 3.5% year-to-date, and with confidence also aided by house price gains. The consumer was also shown to be in robust shape and willing to spend at February, retail sales gaining 3.5%. Together with the burgeoning trade opportunities apparent across Asia, these nascent domestic demand trends point to strong growth in 2023 and an ability to sustain growth near authorities’ 2023 target for a number of years to come.
USD/JPY Turns Red, Oil Price Takes Major Hit
Key Highlights
- USD/JPY started a fresh decline below the 135.00 support.
- It could extend losses below the 131.50 support zone.
- Crude oil price declined heavily and traded below $68.
- Gold price remains supported above the $1,910 support zone.
USD/JPY Technical Analysis
The US Dollar struggled to stay in a positive zone above 136.00 against the Japanese Yen. USD/JPY traded below the 135.00 support to move into a bearish zone.
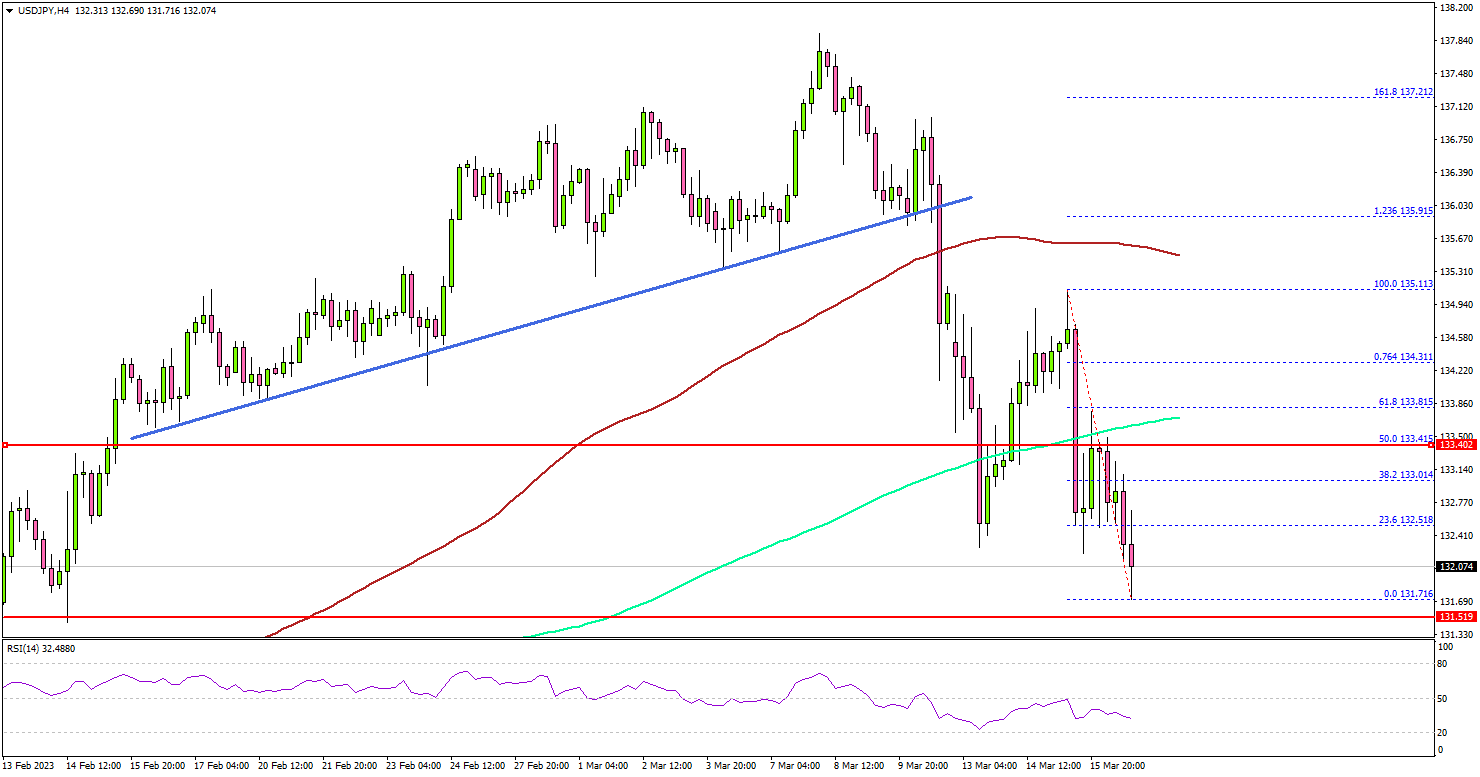
Looking at the 4-hours chart, the pair gained pace below the 134.20 support zone and the 100 simple moving average (red, 4-hours). Besides, the pair broke a key bullish trend line with support at 136.00.
Finally, the pair settled below the 133.50 support zone and the 200 simple moving average (green, 4-hours). On the downside, an immediate support is near the 131.50. The next major support is near the 130.50 level, below which there is a risk of a move towards the 129.20 level.
On the upside, an immediate resistance is near the 132.50 level. The next major resistance is near the 133.50 level and the 200 simple moving average (green, 4-hours).
A clear move above the 133.50 resistance might start another increase towards the 135.00 zone. Any more gains might send the pair towards 136.50.
Looking at crude oil price, there was a sharp decline below the $70 support and there is a risk of more downsides in the near term.
Economic Releases
- US Industrial Production for Feb 2023 (MoM) – Forecast 0.2%, versus 0% previous.
- US Capacity Utilization for Feb 2023 – Forecast 78.4%, versus 78.3% previous.
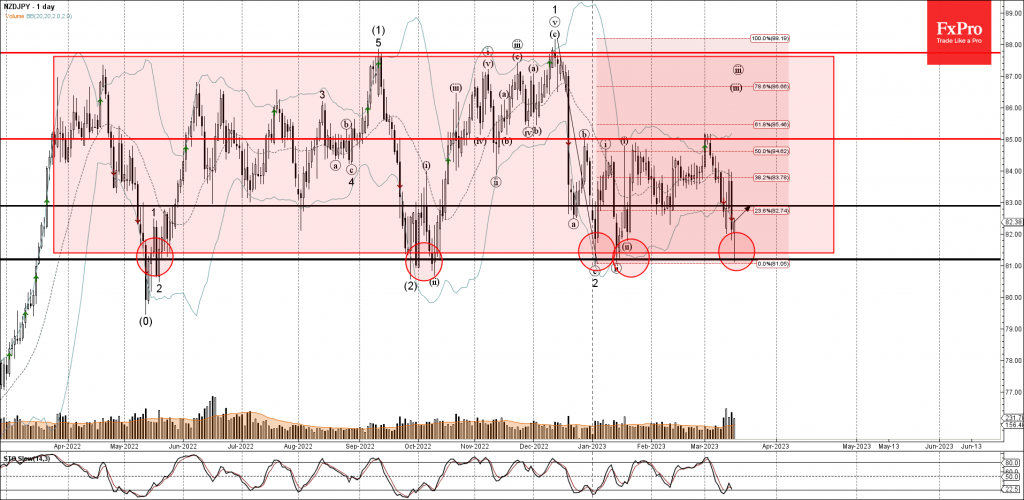
NZDJPY Wave Analysis
- NZDJPY reversed from support level 81.20
- Likely to rise to resistance level 83.00
NZDJPY currency pair recently reversed up from the key support level 81.20 (lower boundary of the wide sideways price range inside which the price has been moving from last April).
The upward reversal from the support level 81.20 created the daily candlesticks reversal pattern Hammer.
NZDJPY currency pair can be expected to rise further toward the next resistance level 83.00 (former support from the start of February).
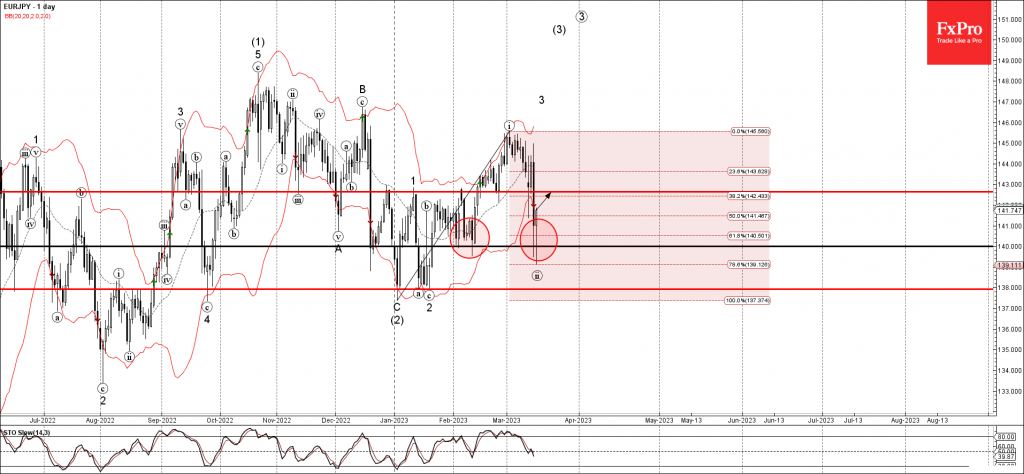
EURJPY Wave Analysis
- EURJPY reversed from round support level 140.00
- Likely to rise to resistance level 142.65
EURJPY currency pair recently reversed up from the round support level 140.00 (previous Double Bottom from the start of February).
The support level 140.00 coincided with the 61.8% Fibonacci correction of the previous sharp upward impulse from the start of January.
EURJPY currency pair can be expected to rise further toward the next resistance level 142.65 (former support from the end of February).