Sample Category Title
GBP/JPY Daily Outlook
Daily Pivots: (S1) 158.67; (P) 161.41; (R1) 163.59; More...
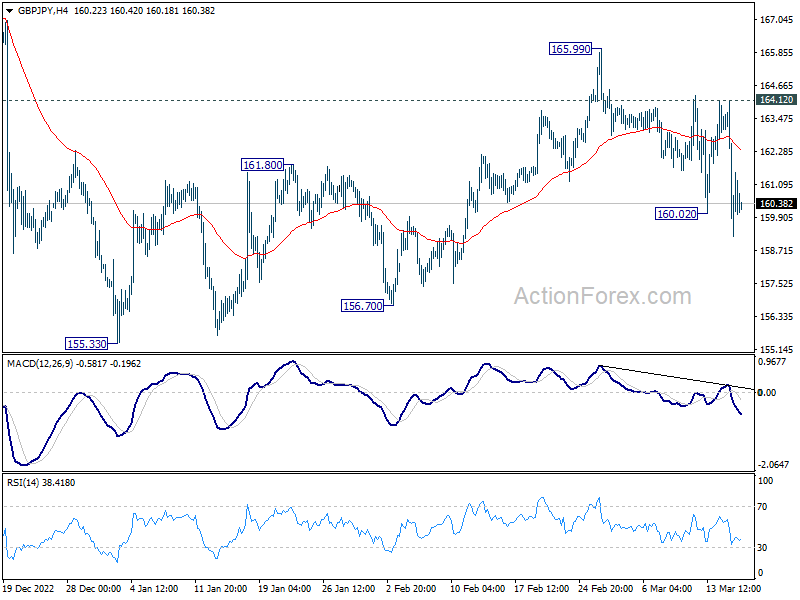
GBP/JPY's break of 160.02 indicates resumption of fall from 165.99. The development also argues that this decline is part of the larger correction from 172.11. Intraday bias is back on the downside for 156.70 support first. Break will target 155.33 low. For now, risk will remain on the downside as long as 164.12 resistance holds, in case of recovery.
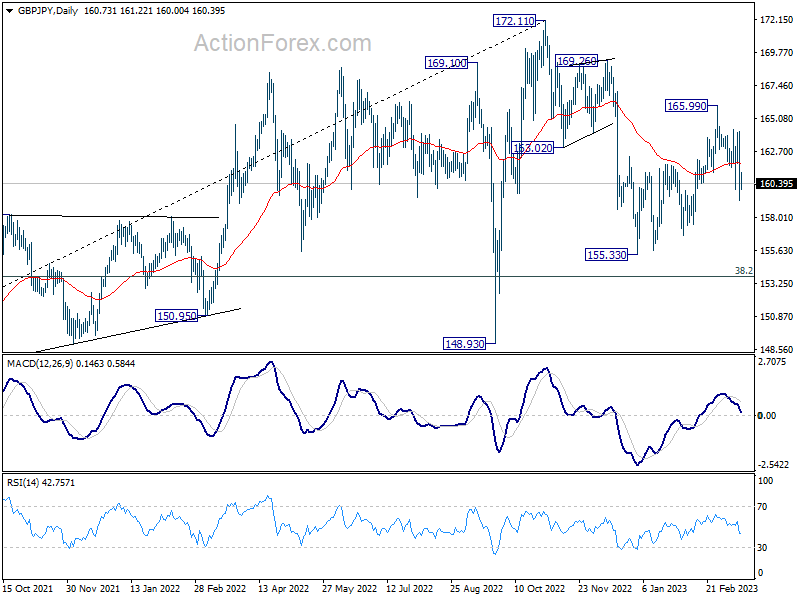
In the bigger picture, as long as 38.2% retracement of 123.94 (2020 low) to 172.11 (2022 high) at 153.70 holds, medium term bullishness is retained. That is, larger up trend from 123.94 (2020 low) is still in progress. Break of 172.11 high to resume such up trend is expected at a later stage.
Technical Outlook and Review
DXY:
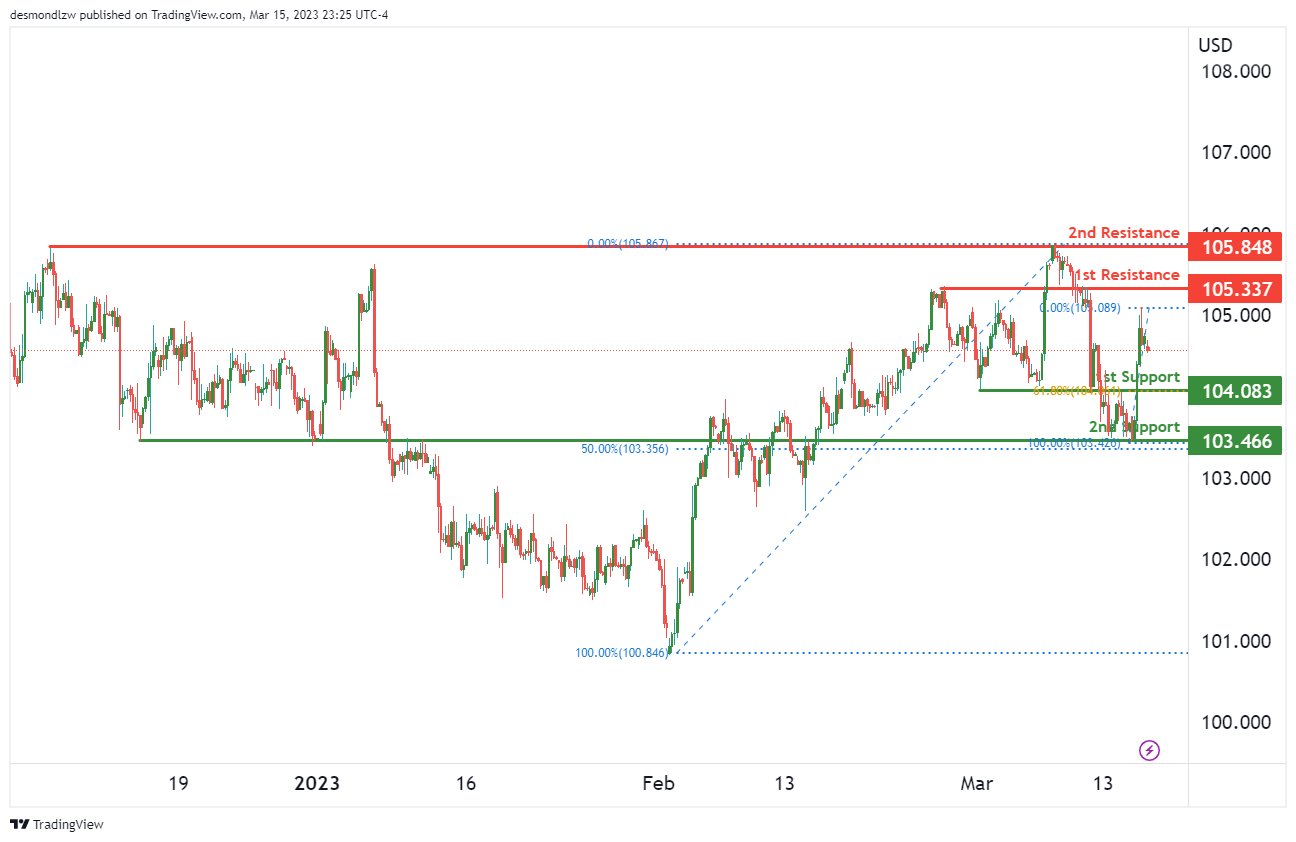
The DXY chart is currently showing bearish momentum, with potential for a bearish reaction off the first resistance level at 105.33, dropping to the first support level at 104.08.
The first support level at 104.08 is an overlap support level, coinciding with a 61.80% Fibonacci retracement, which may provide strong support for the price if it drops.
If the price were to break below the first support level, it could drop to the second support level at 103.46, which is also an overlap support level, coinciding with a 50% Fibonacci retracement.
There is also a first resistance level at 105.33, which is an overlap resistance level. If the price were to react bearishly off this level, it could potentially pave the way for further downside potential.
There is also a second resistance level at 105.84, which is a multi-swing high resistance level. If the price were to break above this level, it could potentially invalidate the bearish scenario.
EUR/USD:
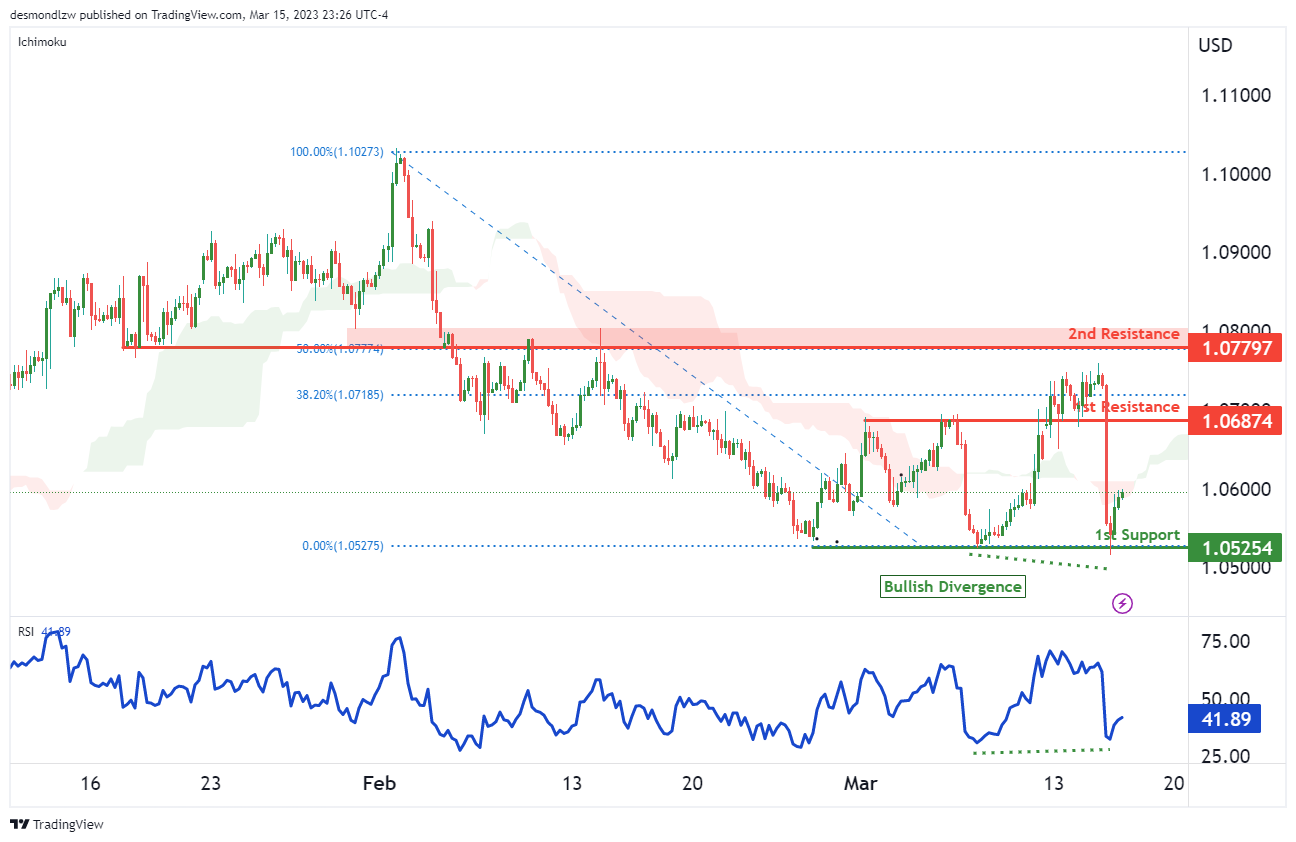
The EUR/USD chart is currently showing a bullish momentum, with the potential for a bullish bounce off the first support level at 1.0525, heading towards the first resistance level at 1.0687.
The first support level at 1.0525 is a multi-swing low support, which may provide strong support for the price if it drops. Furthermore, the price is currently within the bullish Ichimoku cloud, which often suggests that it might bounce from there, further supporting the bullish scenario.
If the price were to bounce off the first support, it could rise to the first resistance level at 1.0687, which is an overlap resistance level.
There is also a second resistance level at 1.0779, which is an overlap resistance level, coinciding with a 50% Fibonacci retracement. If the price were to break above this level, it could potentially pave the way for further upside potential.
The RSI is also displaying bullish divergence versus price, suggesting that a bounce might occur soon, potentially further supporting the bullish scenario.
GBP/USD:
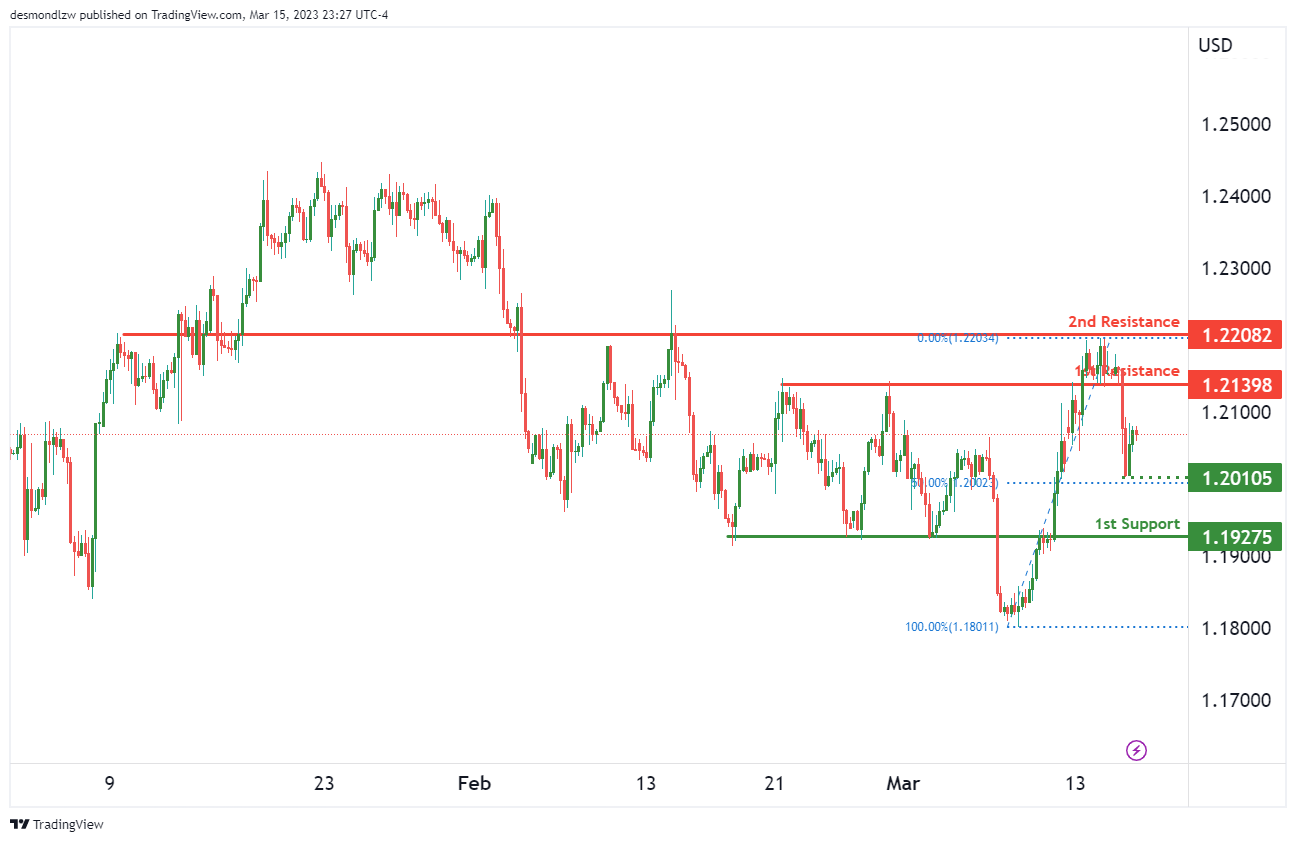
The GBP/USD chart is currently in a a neutral range, with potential for price to fluctuate between the first resistance level at 1.2139 and the first support level at 1.1927.
The first support level at 1.1927 is an overlap support level, which may provide strong support for the price if it drops. There is also an intermediate support level at 1.2010, which is an overlap support level coinciding with a 50% Fibonacci retracement.
On the other hand, the first resistance level at 1.2139 is an overlap resistance level. If the price were to break above this level, it could potentially rise towards the second resistance level at 1.2208.
USD/CHF:
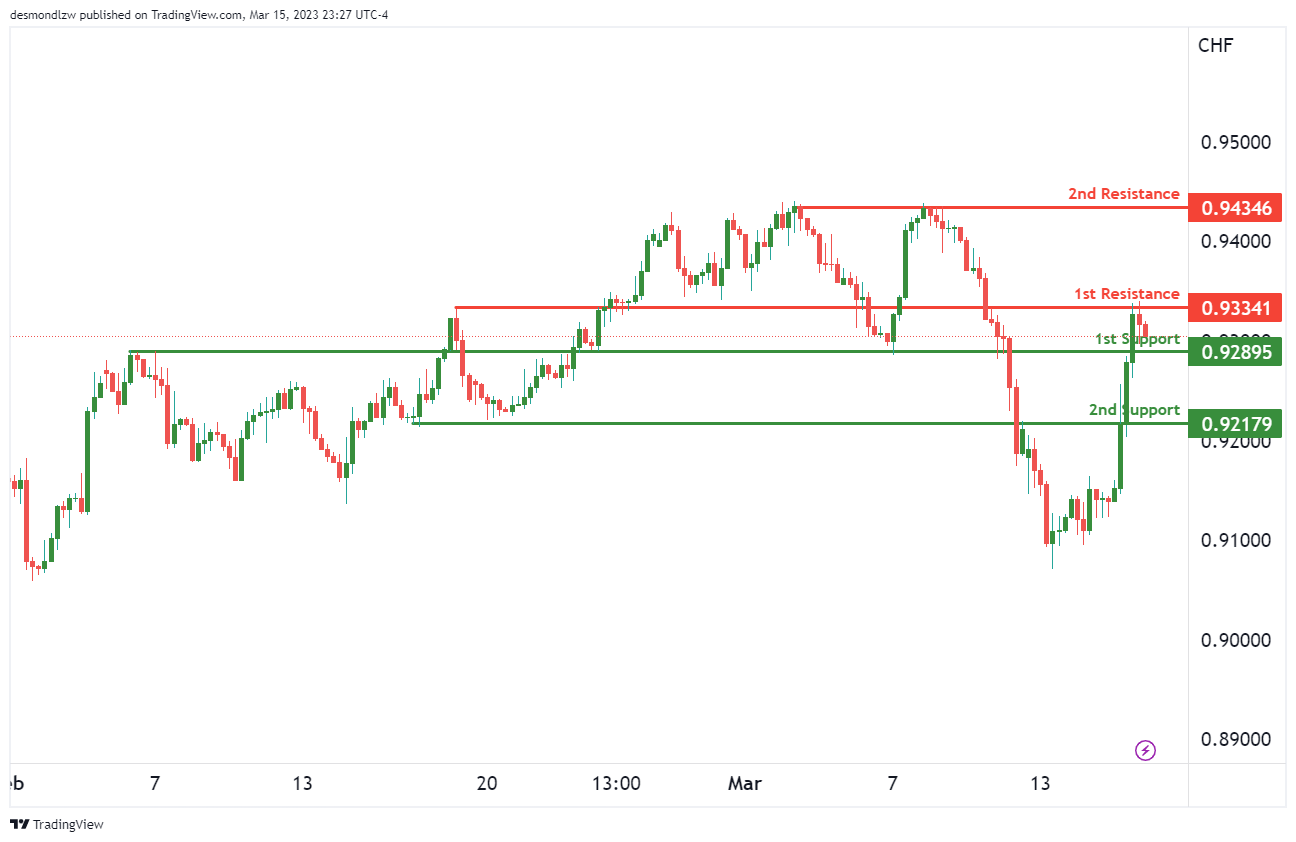
The USD/CHF chart is currently showing bearish momentum, with potential for a bearish reaction off the first resistance level at 0.9334, dropping to the first support level at 0.9289.
The first support level at 0.9289 is an overlap support level, which may provide strong support for the price if it drops. Additionally, there is a second support level at 0.9217, which is also an overlap support level.
If the price were to break below the first support level, it could potentially drop to the second support level at 0.9217, which is also an overlap support level.
On the other hand, the first resistance level at 0.9334 is an overlap resistance level. If the price were to react bearishly off this level, it could potentially pave the way for further downside potential.
There is also a second resistance level at 0.9434, which is a multi-swing high resistance level. If the price were to break above this level, it could potentially invalidate the bearish scenario.
USD/JPY:
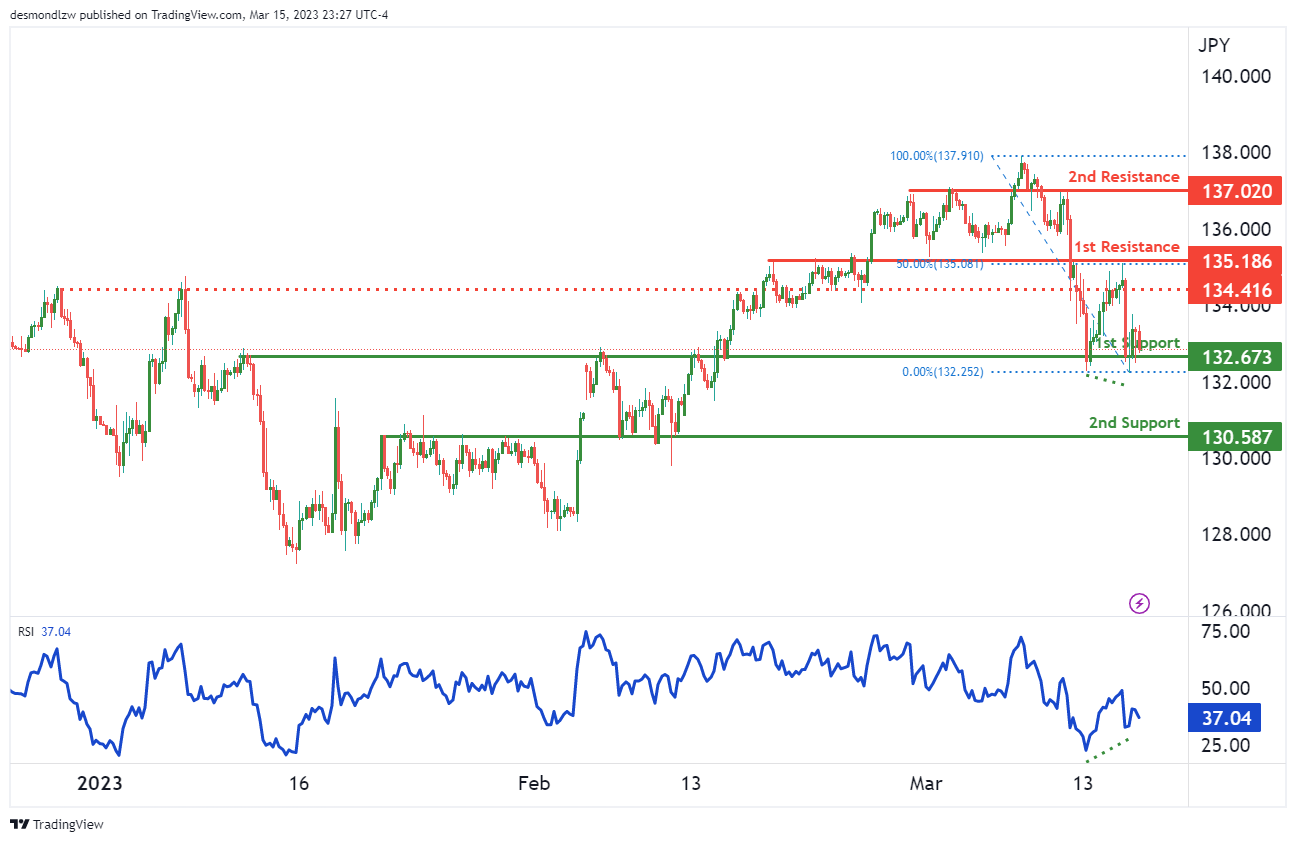
The USD/JPY chart is currently showing bullish momentum, with potential for a bullish bounce off the first support level at 132.67, heading towards the first resistance level at 135.18.
The first support level at 132.67 is an overlap support level, which may provide strong support for the price if it drops. Additionally, there is a second support level at 130.58, which is also an overlap support level.
If the price were to break below the first support level, it could potentially drop to the second support level at 130.58, which is also an overlap support level.
On the other hand, the first resistance level at 135.18 is an overlap resistance level, coinciding with a 50% Fibonacci retracement. If the price were to break above this level, it could potentially rise towards the second resistance level at 137.02, which is a multi-swing high resistance level.
There is also an intermediate resistance level at 134.41, which may provide a minor obstacle before the price potentially breaks above the first resistance level.
The RSI is displaying bullish divergence versus price, suggesting that a bounce might occur soon.
AUD/USD:
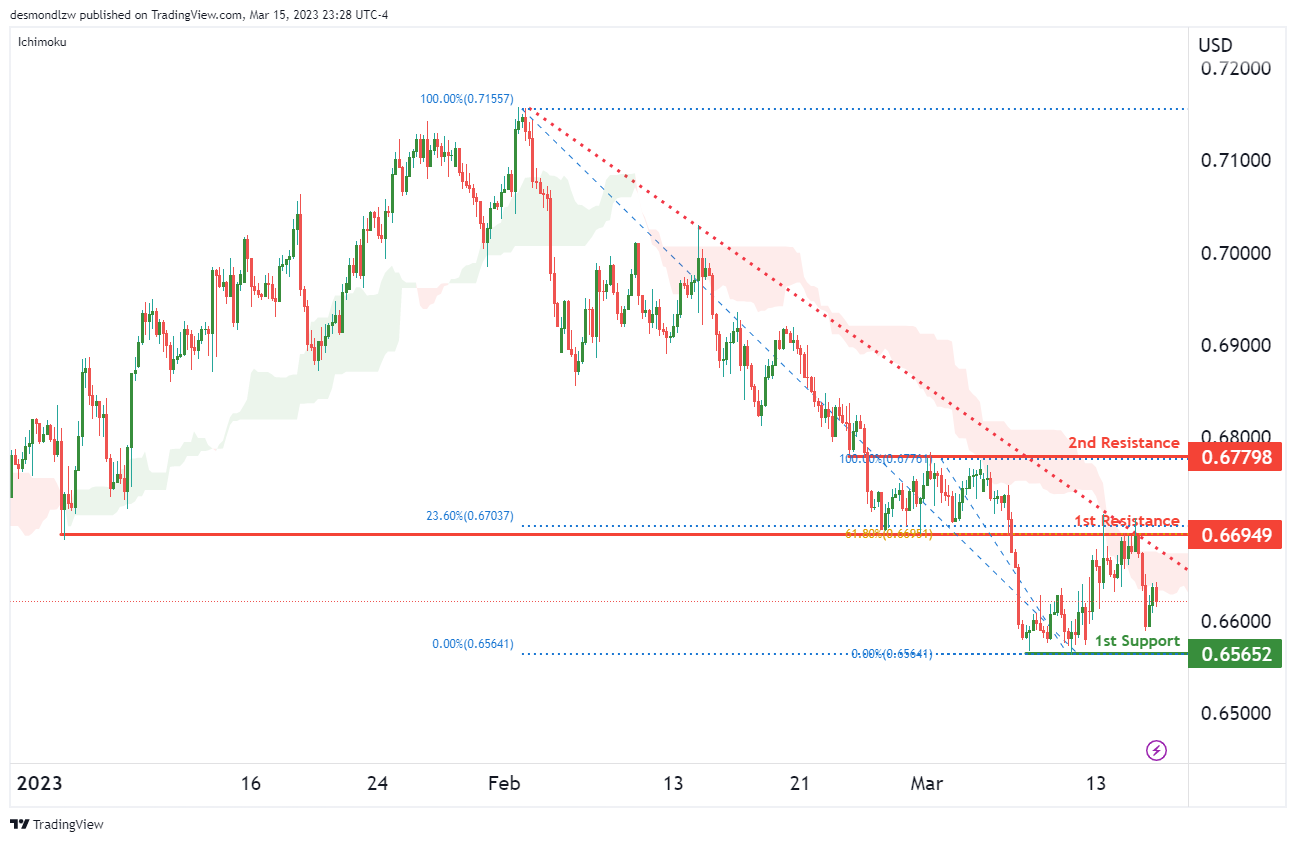
The AUD/USD chart is currently showing bearish momentum, with potential for a bearish reaction off the first resistance level at 0.6694, dropping to the first support level at 0.6565.
The first support level at 0.6565 is a multi-swing low support level, which may provide strong support for the price if it drops.
On the other hand, the first resistance level at 0.6694 is an overlap resistance level, coinciding with a 61.80% Fibonacci retracement. Additionally, it is right below the bearish Ichimoku cloud, which usually suggests that the price might reverse from there. If the price were to react bearishly off this level, it could potentially drop to the first support level at 0.6565.
There is also a second resistance level at 0.6779, which is an overlap resistance level.
NZD/USD:
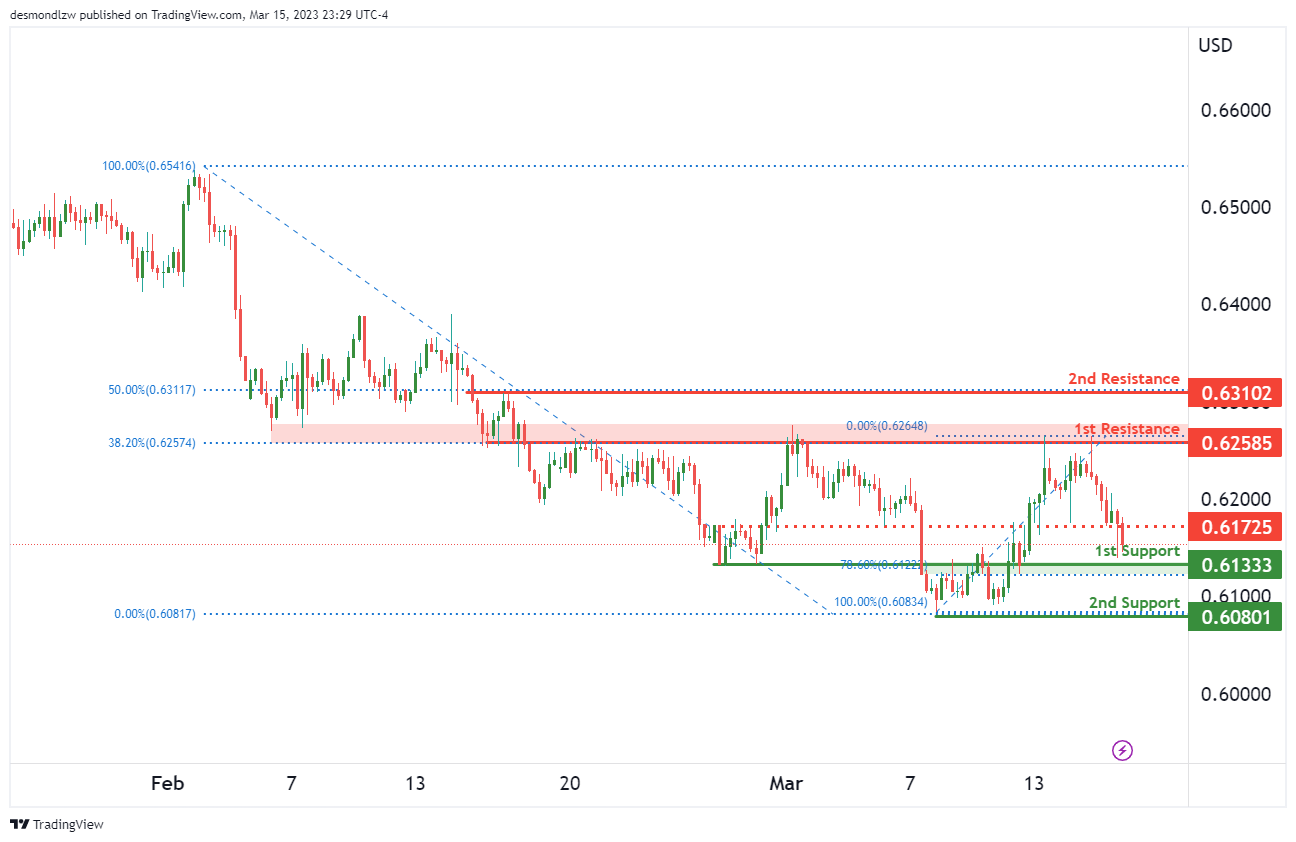
The NZD/USD chart is currently showing bearish momentum, with potential for a bearish reaction off the first resistance level at 0.6258, dropping to the first support level at 0.6133.
The first support level at 0.6133 is a pullback support level, coinciding with a 78.60% Fibonacci retracement, which may provide strong support for the price if it drops.
If the price were to break below the first support level, it could potentially drop to the second support level at 0.6080, which is a multi-swing low support level.
On the other hand, the first resistance level at 0.6258 is an overlap resistance level, coinciding with a 38.20% Fibonacci retracement. There is also a second resistance level at 0.6310, which is a swing high resistance level.
USD/CAD:
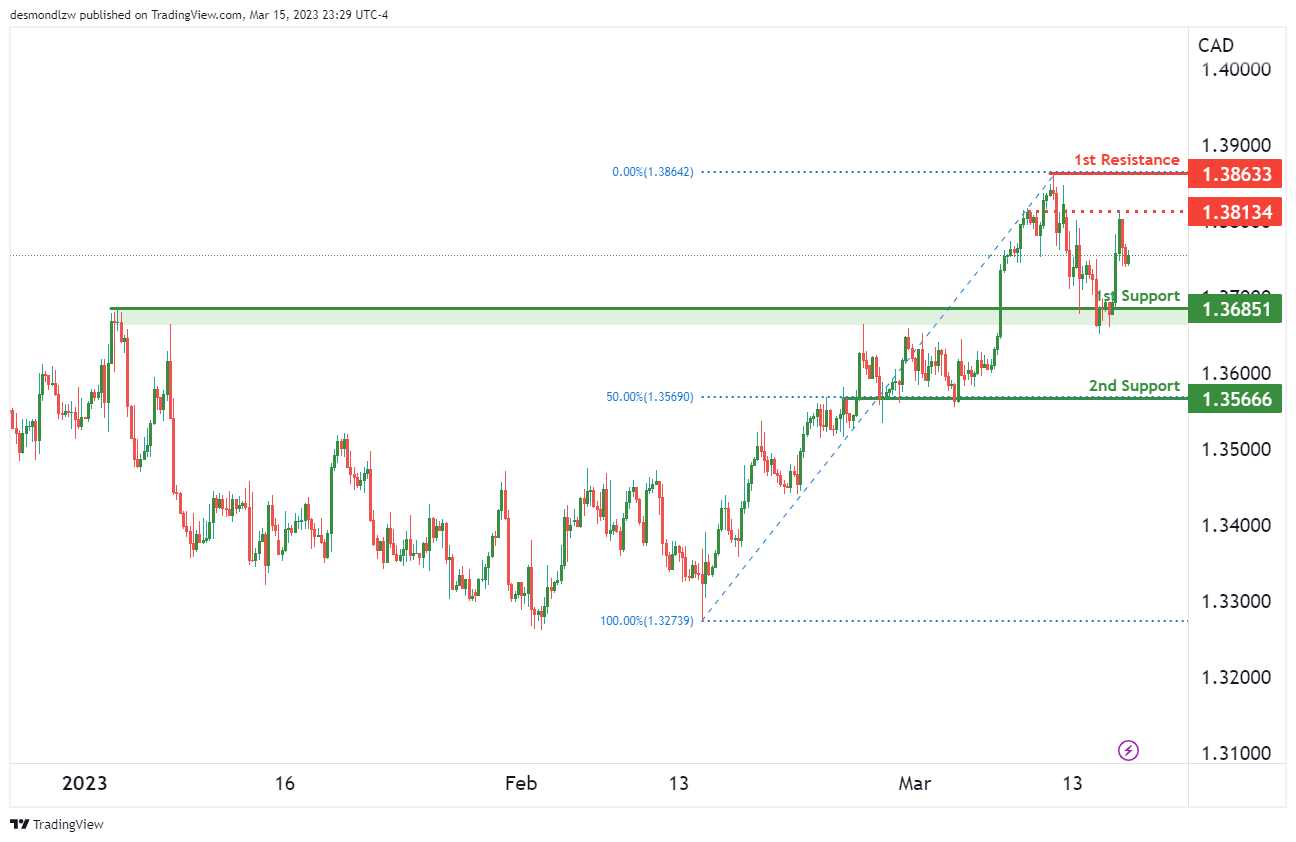
The USD/CAD chart is currently showing bullish momentum with potential for a bullish bounce off the first support level at 1.3685, heading towards the first resistance level at 1.3863.
The first support level at 1.3685 is an overlap support level, which may provide strong support for the price if it drops. If the price were to break below this level, it could drop to the second support level at 1.3566, which is a multi-swing low support level coinciding with a 50% Fibonacci retracement.
There is also a first resistance level at 1.3863, which is a swing high resistance level. If the price were to break above this level, it could potentially pave the way for further upside potential.
There is also an intermediate resistance level at 1.3813, which is an overlap resistance level. If the price were to break above this level, it could potentially provide additional support for the bullish scenario.
DJ30:
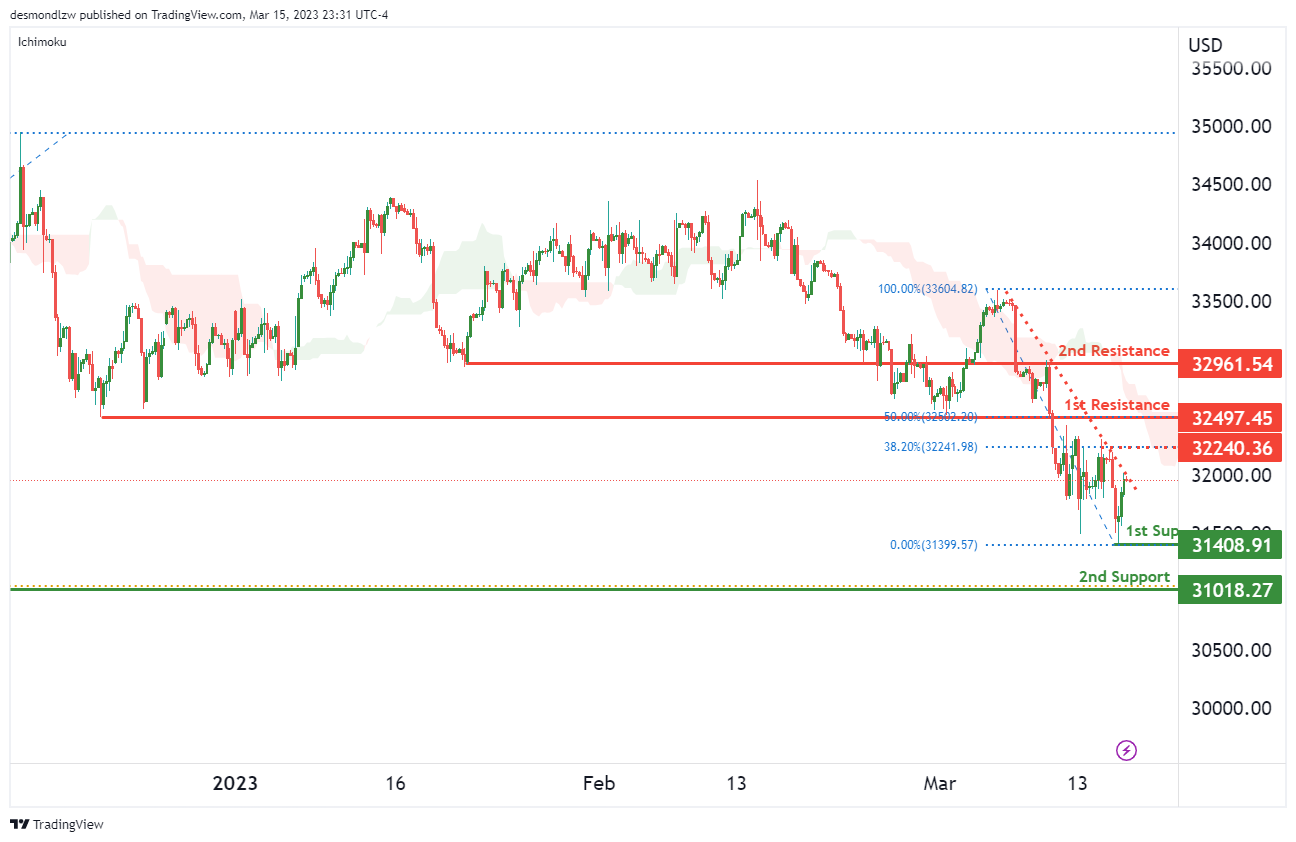
The DJ30 chart currently shows bearish momentum, with the potential for a bearish continuation towards the first support level at 31480.
The first support level at 31480 is a swing low support level, which may provide strong support for the price if it drops.
If the price were to break below the first support level, it could drop to the second support level at 31018, which is also an overlap support level and coincides with a 61.80% Fibonacci retracement.
There is also a first resistance level at 32497, which is a pullback resistance level. If the price were to react bearishly off this level, it could potentially pave the way for further downside potential. This level is also right below the bearish Ichimoku cloud, which usually suggests that the price might reverse from there.
There is also an intermediate resistance level at 32240, which is a multi-swing high resistance level, and a second resistance level at 32961, which is an overlap resistance level. If the price were to break above these levels, it could potentially invalidate the bearish scenario.
GER30:
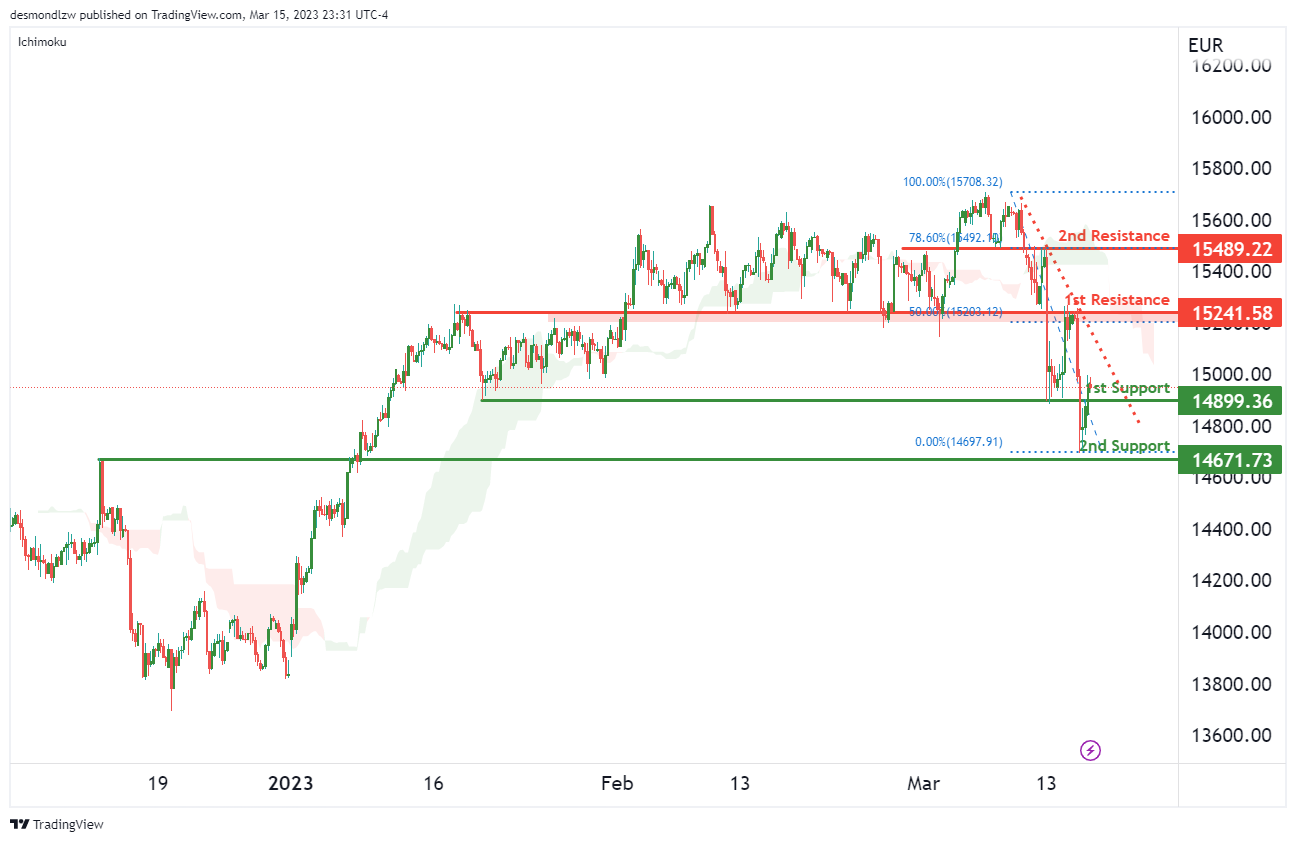
The GER30 chart is currently showing bearish momentum, with potential for a bearish continuation towards the first support level at 14899.
The first support level at 14899 is an overlap support level, which could provide strong support for the price if it continues to drop.
If the price were to break below the first support level, it could drop to the second support level at 14671, which is also an overlap support level.
There is also a first resistance level at 15241, which is an overlap resistance level. If the price were to react bearishly off this level, it could potentially pave the way for further downside potential. This resistance level is also right below the bearish Ichimoku cloud, which usually suggests that the price might reverse from there. Additionally, the level is testing a descending trend line that acts as resistance and coincides with the 50% Fibonacci retracement level.
There is also a second resistance level at 15489, which is an overlap resistance level and coincides with the 78.60% Fibonacci retracement level. If the price were to break above this level, it could potentially invalidate the bearish scenario.
BTC/USD:
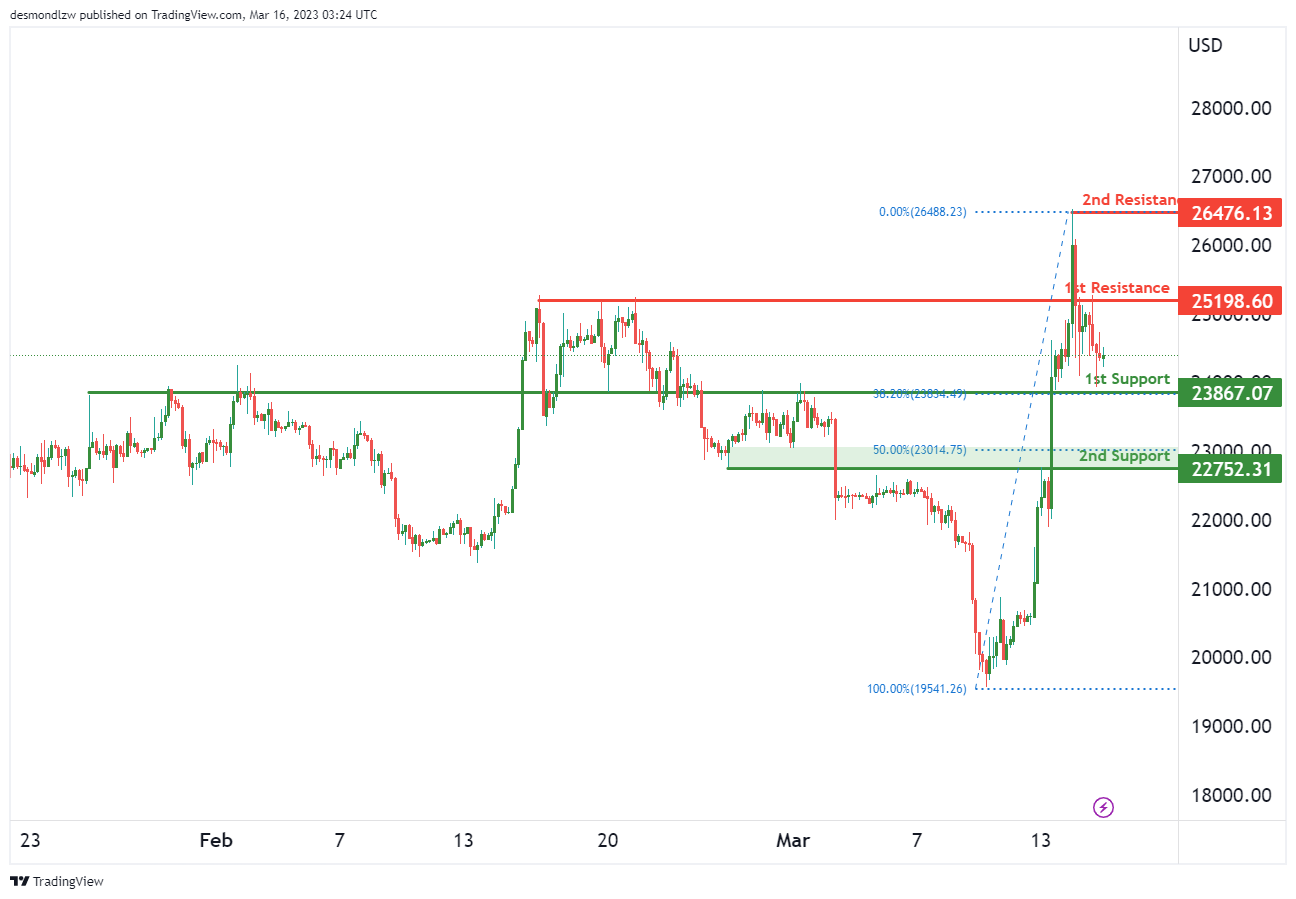
The BTC/USD chart is currently showing bearish momentum with the potential for a bearish continuation towards the first support level at 23865. This level is an overlap support and coincides with a 38.20% Fibonacci retracement, which could provide strong support for the price if it drops.
If the price were to break below the first support level, it could drop to the second support level at 22752, which is also an overlap support level and coincides with a 50% Fibonacci retracement.
There is a first resistance level at 25198, which is an overlap resistance level. If the price were to react bearishly off this level, it could potentially pave the way for further downside potential.
There is also a second resistance level at 26476, which is a swing high resistance level. If the price were to break above this level, it could potentially invalidate the bearish scenario.
US500
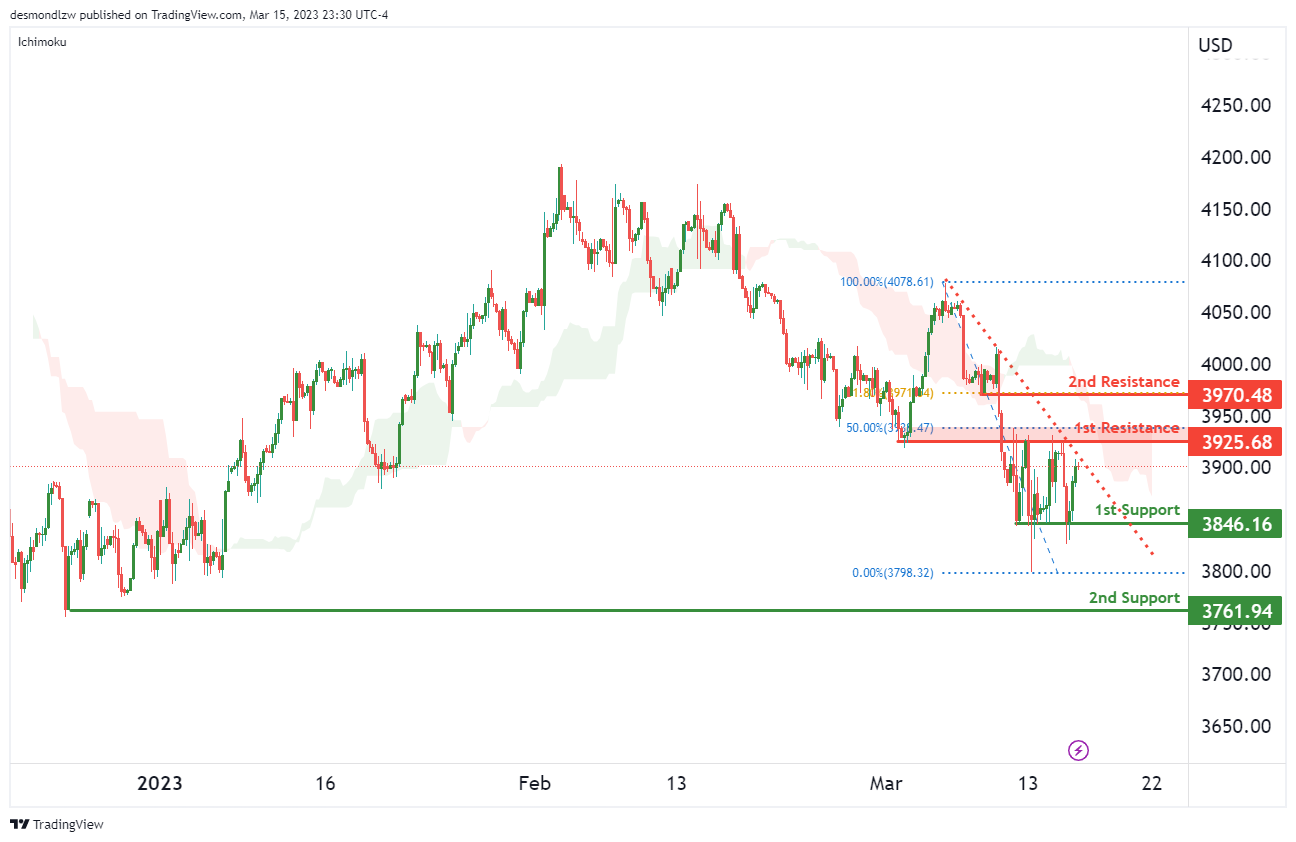
The US500 chart is showing bearish momentum, with potential for a bearish continuation towards the first support level at 3846.
The first support level at 3846 is a multi-swing low support level, which may provide strong support for the price if it drops.
If the price were to break below the first support level, it could drop to the second support level at 3761, which is also a swing low support level.
There is also a first resistance level at 3925, which is an overlap resistance level. If the price were to react bearishly off this level, it could potentially pave the way for further downside potential. Additionally, the first resistance level is right below the bearish Ichimoku cloud, which usually suggests that the price might reverse from there. Furthermore, the price is testing a descending trend line which acts as resistance, adding to the potential resistance at this level.
There is also a second resistance level at 3970, which is a pullback resistance level, coinciding with a 61.80% Fibonacci retracement.
Overall, the US500 chart suggests a bearish continuation bias, with potential for the price to drop from the first resistance level towards the first support level.
ETH/USD:
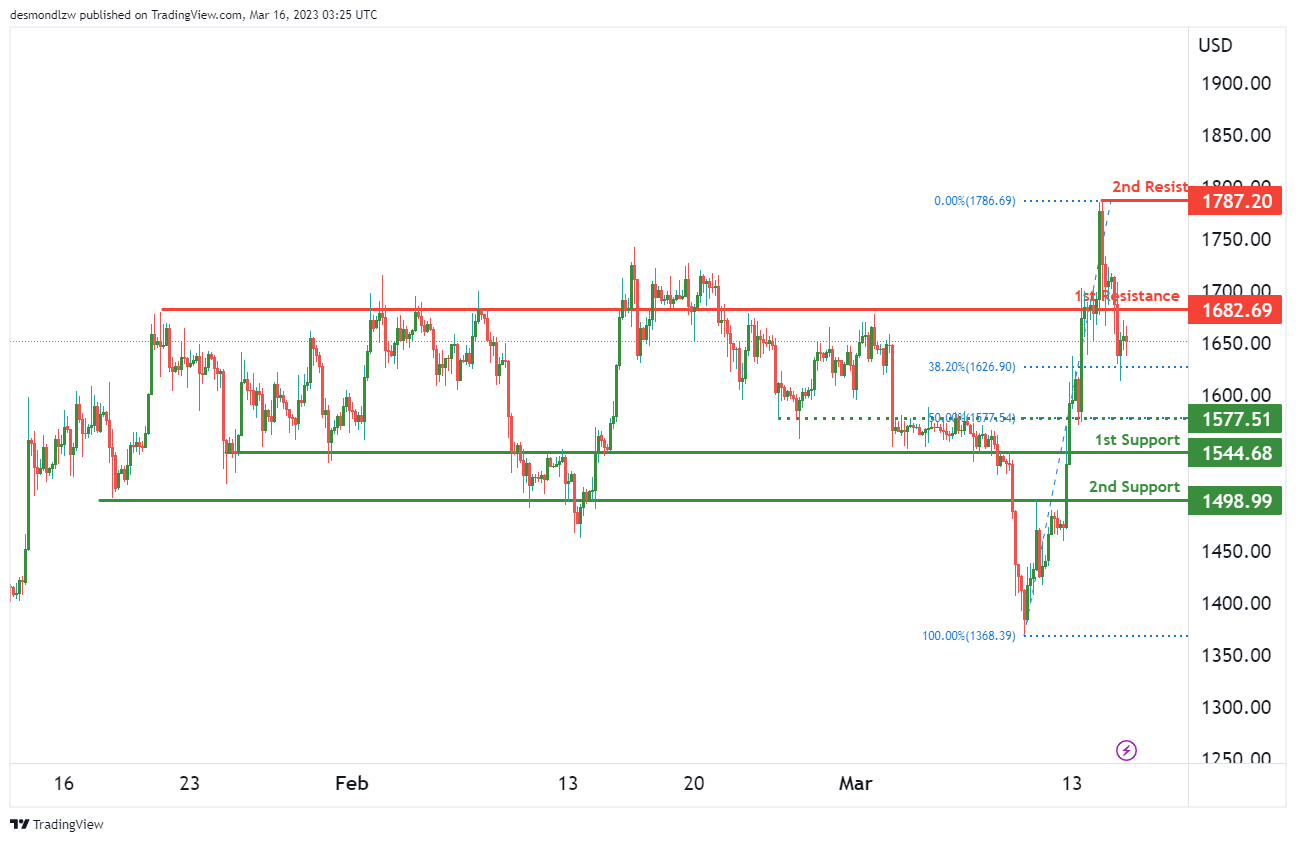
ETH/USD chart is currently bearish. The price could potentially make a bearish reaction off the first resistance level at 1782 and drop to the first support level at 1577.
The first support level at 1577 is a pullback support level and could provide strong support for the price if it drops.
If the price were to break below the first support level, it could drop to the second support level at 1498, which is also a pullback support level.
There is also a first resistance level at 1782, which is an overlap resistance level. If the price were to react bearishly off this level, it could potentially pave the way for further downside potential.
There is also a second resistance level at 1787, which is a swing high resistance level. If the price were to break above this level, it could potentially invalidate the bearish scenario.
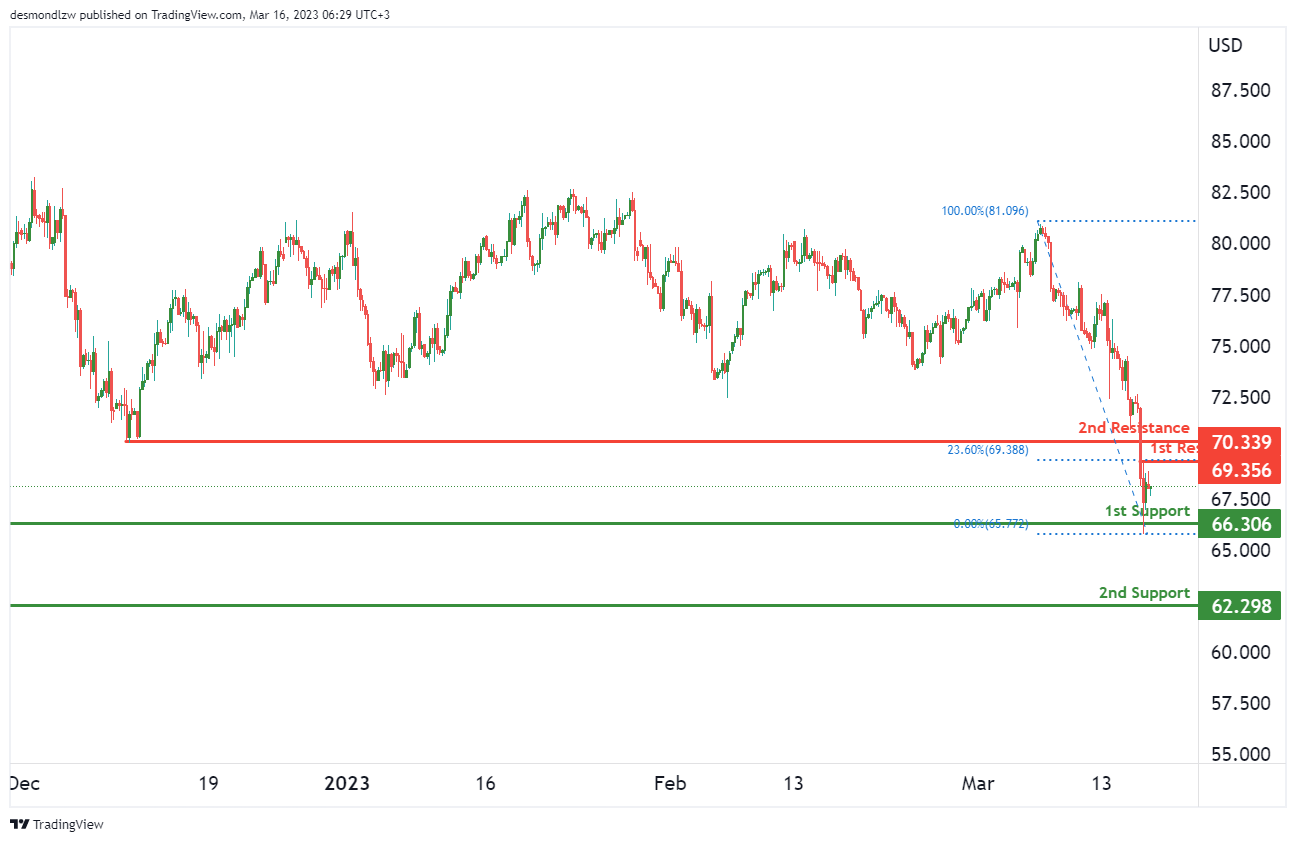
WTI/USD:
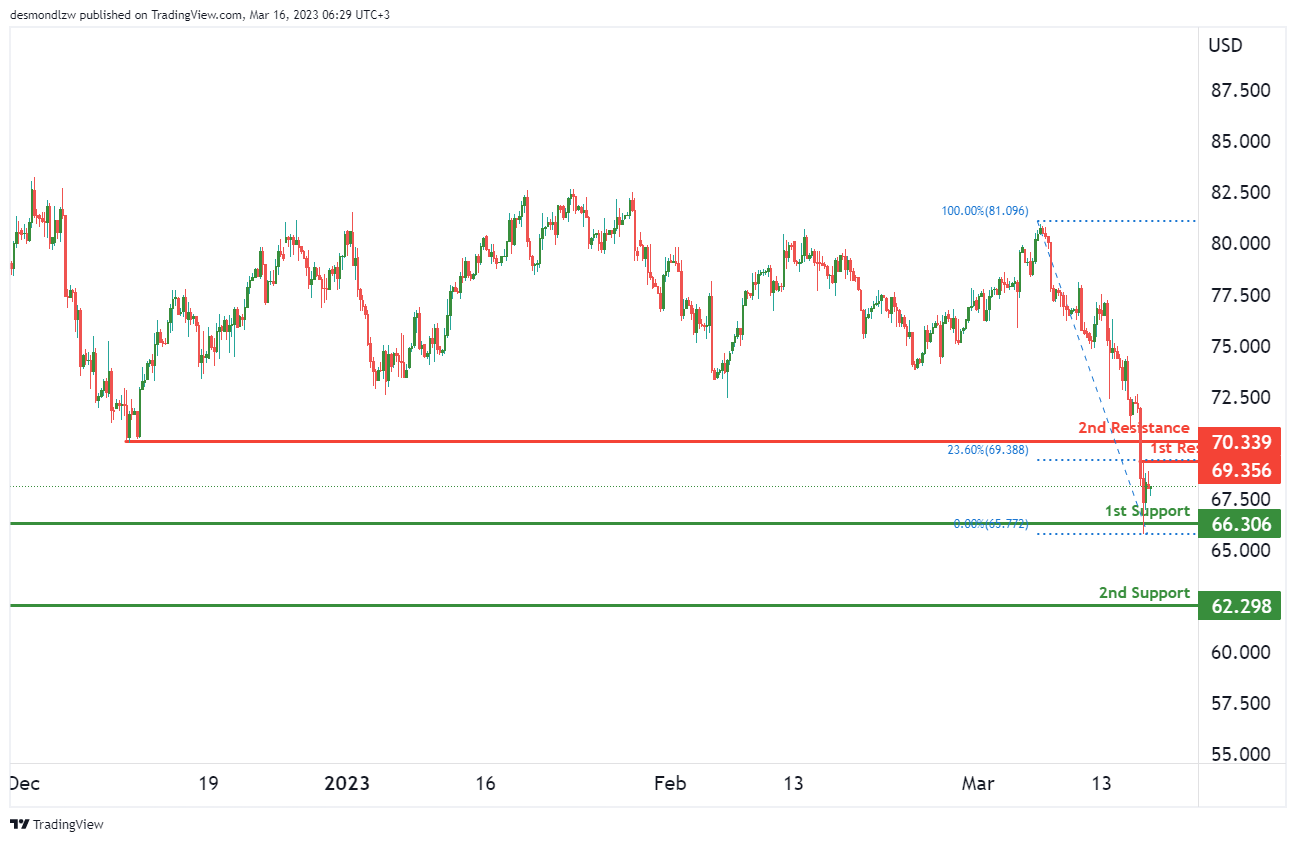
WTI chart is currently showing bullish momentum. There is potential for a bullish bounce off the first support level at 66.30, heading towards the first resistance level at 69.35.
The first support level at 66.30 is a swing low support level, which may provide strong support for the price if it drops.
If the price were to break below the first support level, it could drop to the second support level at 62.29, which is also a swing low support level.
There is also a first resistance level at 69.35, which is a swing high resistance level and coincides with a 23.60% Fibonacci retracement level. If the price were to break above this level, it could potentially pave the way for further upside potential.
There is also a second resistance level at 70.33, which is a pullback resistance level. If the price were to break above this level, it could further confirm the bullish scenario.
XAU/USD (GOLD):
XAU/USD is bearish, and the price could potentially make a bearish reaction off the first resistance level at 1937.00 and drop to the first support level at 1890.00.
The first support level at 1890.00 is an overlap support level coinciding with a 38.20% Fibonacci retracement, which may provide strong support for the price if it drops. If the price were to break below this level, it could drop to the second support level at 1861.00, which is also an overlap support level and coincides with a 61.80% Fibonacci retracement.
There is also a first resistance level at 1937.00, which is a swing high resistance level. If the price were to react bearishly off this level, it could potentially pave the way for further downside potential. There is also a second resistance level at 1959.00, which is also a swing high resistance level.
An intermediate support level at 1907.00, which is a swing low support level and coincides with a 23.60% Fibonacci retracement, could potentially provide a minor support level if the price were to drop.
EUR/JPY Daily Outlook
Daily Pivots: (S1) 138.74; (P) 141.86; (R1) 144.23; More....
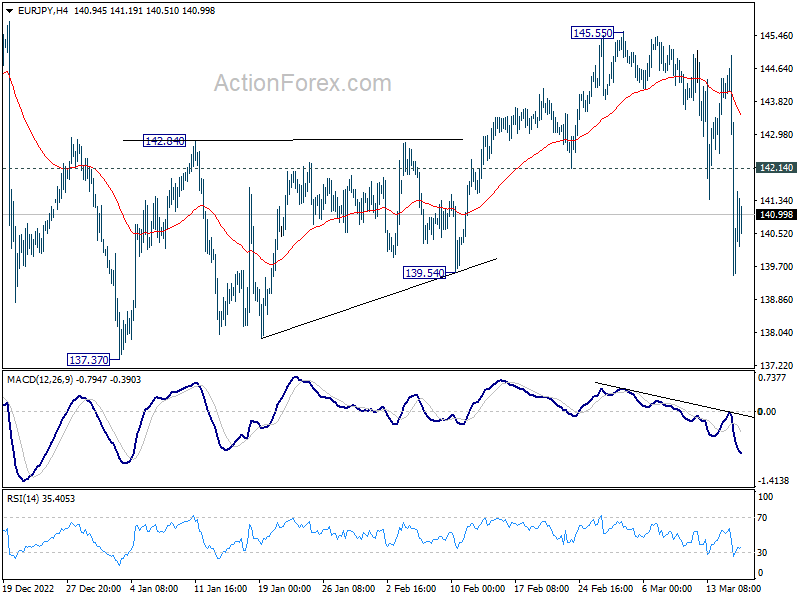
Intraday bias in EUR/JPY remains on the downside for the moment. Fall from 145.55 is seen as the third leg of the whole correction from 148.38 high. Deeper decline would be seen to for retesting 137.37 low, and then 135.40 fibonacci level. On the upside, above 142.14 minor resistance will turn intraday bias neutral first, and could bring recovery. But near term risk will remain on the downside as long as 4 hour 55 EMA (now at 143.47) holds
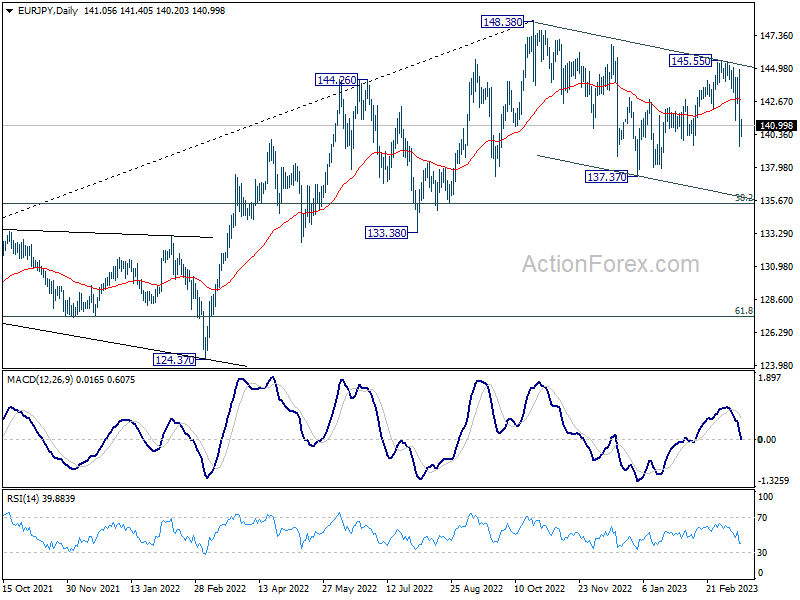
In the bigger picture, as long as 55 week EMA (now at 139.54) holds, larger up trend from 114.42 (2020 low) is still in progress for 149.76 long term resistance. However, firm break of 55 week EMA will bring deeper fall to 38.2% retracement of 114.42 to 148.38 at 135.40. Sustained break there will raise the chance of trend reversal, and target 61.8% retracement at 127.39.
Euro and Swiss Franc Struggle as Markets Eye ECB Rate Decision Amid Ongoing Uncertainty
Daily Report:
Despite regaining some ground in the Asian session, Euro continues to trade as the week's weakest performer alongside Swiss Franc. Today's ECB rate announcement is the primary focus for investors, as uncertainty looms over the extent of the anticipated rate hike. The SNB's efforts to stabilize the markets in response to Credit Suisse's problems may have temporarily curbed negative sentiment, but the potential trigger for a crisis remains unknown.
In its February statement, ECB unambiguously signaled its intention to increase rates by 50bps at today's meeting, a message reiterated repeatedly by officials, including President Christine Lagarde. However, following recent market turmoil, investors are now pricing in only a 30% chance of the 50bps hike, with a more modest 25bps increase seeming increasingly plausible. In addition to the rate decision, market participants will be closely monitoring ECB's updated economic projections, adding further complexity to the day's proceedings.
Elsewhere in the currency markets, Yen has emerged as the week's strongest performer so far, due to rally resumption yesterday. Surprisingly, commodity currencies such as Australian Dollar, New Zealand Dollar, and Canadian Dollar have also demonstrated resilience, albeit with limited gains. As these currencies are not at the epicenter of the market selloff, their performance has been relatively stable. Meanwhile, Dollar remains mixed as traders grapple with ongoing volatility in both treasury yields and stocks, leaving them hesitant to fully commit to a particular direction.
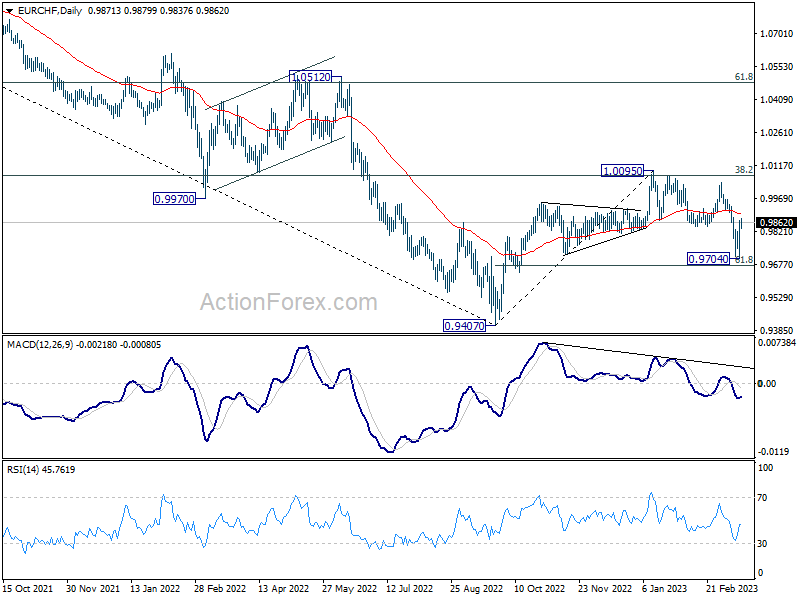
Technically, EUR/CHF has exhibited a robust rebound from 0.9704 (yesterday's low), but that could be attributed more to Swiss Franc's own problems. Despite this recovery, downside risk remains as long as it trades below 55 day EMA (now at 0.9901). The prevailing decline from 1.0095 peak is expected to persist, potentially extending towards the 61.8% retracement level of 0.9407 to 1.0095 at 0.9670. A further decline may even prompt a retest of the 0.9407 low. However, sustained break above the 55-day EMA would invalidate near-term bearishness and could trigger a more substantial rally towards the 1.0095 resistance level.
In Asia, at the time of writing, Nikkei is down -0.97%. Hong Kong HSI is down -1.25%. China Shanghai SSE is down -0.49%. Singapore Strait Times is down -0.78%. Japan 10-year JGB yield is down -0.0161 at 0.300. Overnight, DOW dropped -0.87%. S&P 500 dropped -0.70%. NASDAQ rose 0.05%. 10-year yield dropped -0.146 to 3.492, after hitting as low as 3.388.
Credit Suisse to borrow from SNB to calm markets
Credit Suisse's measures to ease investor concerns over potential contagion and a banking crisis have failed to lift market pressures, with the Asian markets remaining under pressure.
The bank announced it would borrow up to CHF50B from the SNB, calling it a "decisive action to pre-emptively strengthen its liquidity." The loan and a repurchase of billions of dollars of Credit Suisse debt aim to manage its liabilities and interest payment expenses.
Earlier, in a joint statement with the Swiss financial market regulator FINMA, the SNB assured the markets that the Credit Suisse had met "strict capital and liquidity requirements" and said, "there are no indications of a direct risk of contagion for Swiss institutions due to the current turmoil in the US banking market."
"If necessary, the SNB will provide CS with liquidity," FINMA and SNB said.
Japan posted record February trade deficit
In February, Japan exports rose 6.5% yoy to JPY 7655B, below expectation of 7.1% yoy. Imports rose 8.3% yoy to JPY 8552B, below expectation of 12.2% yoy. Consequently, the country experienced its largest February trade deficit to date at JPY -897.7B.
The breakdown of trade relations painted an interesting picture, with the US and China displaying contrasting trends. Exports to the US surged by 14.9% yoy, while imports increased by 6.6%, resulting in a favorable surplus of JPY 530.5B. However, trade with China proved more challenging, as exports dipped by -10.9% yoy and imports saw a marginal decrease of 0.6% yoy, culminating in a deficit of JPY -209.8B.
On a more positive note, seasonally adjusted figures highlighted a 4.4%mom rise in exports to JPY 8146B, accompanied by a 3.0% mom drop in imports to JPY 9336B. As a result, trade deficit narrowed to JPY -1191B, outperforming the expected JPY -1460B.
Australia employment grew 64.6k in Feb, unemployment rate dropped to 3.5%
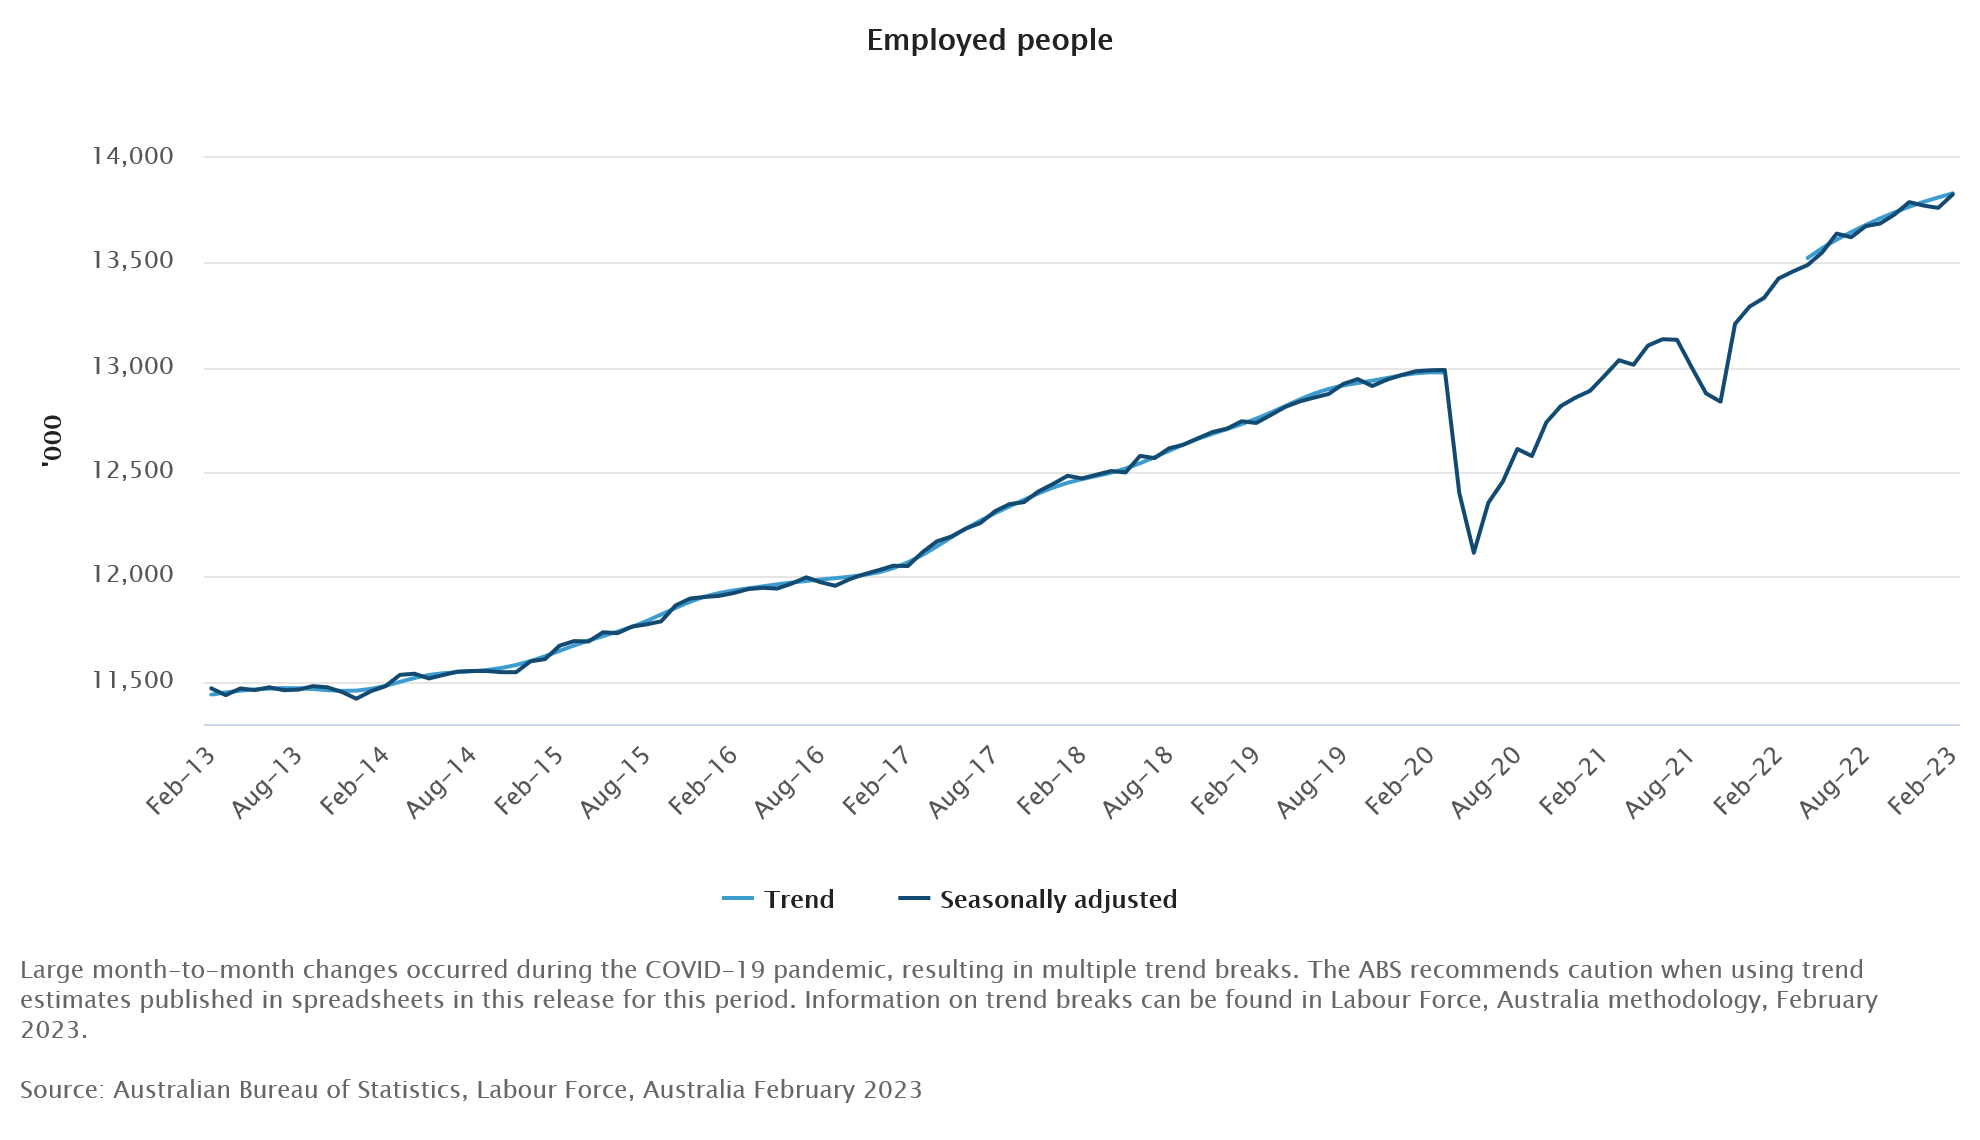
Australia employment grew 64.6k in February, well above expectation of 48.5k. Full-time employment rose 74.9k. Part-time employment decreased -10.3k.
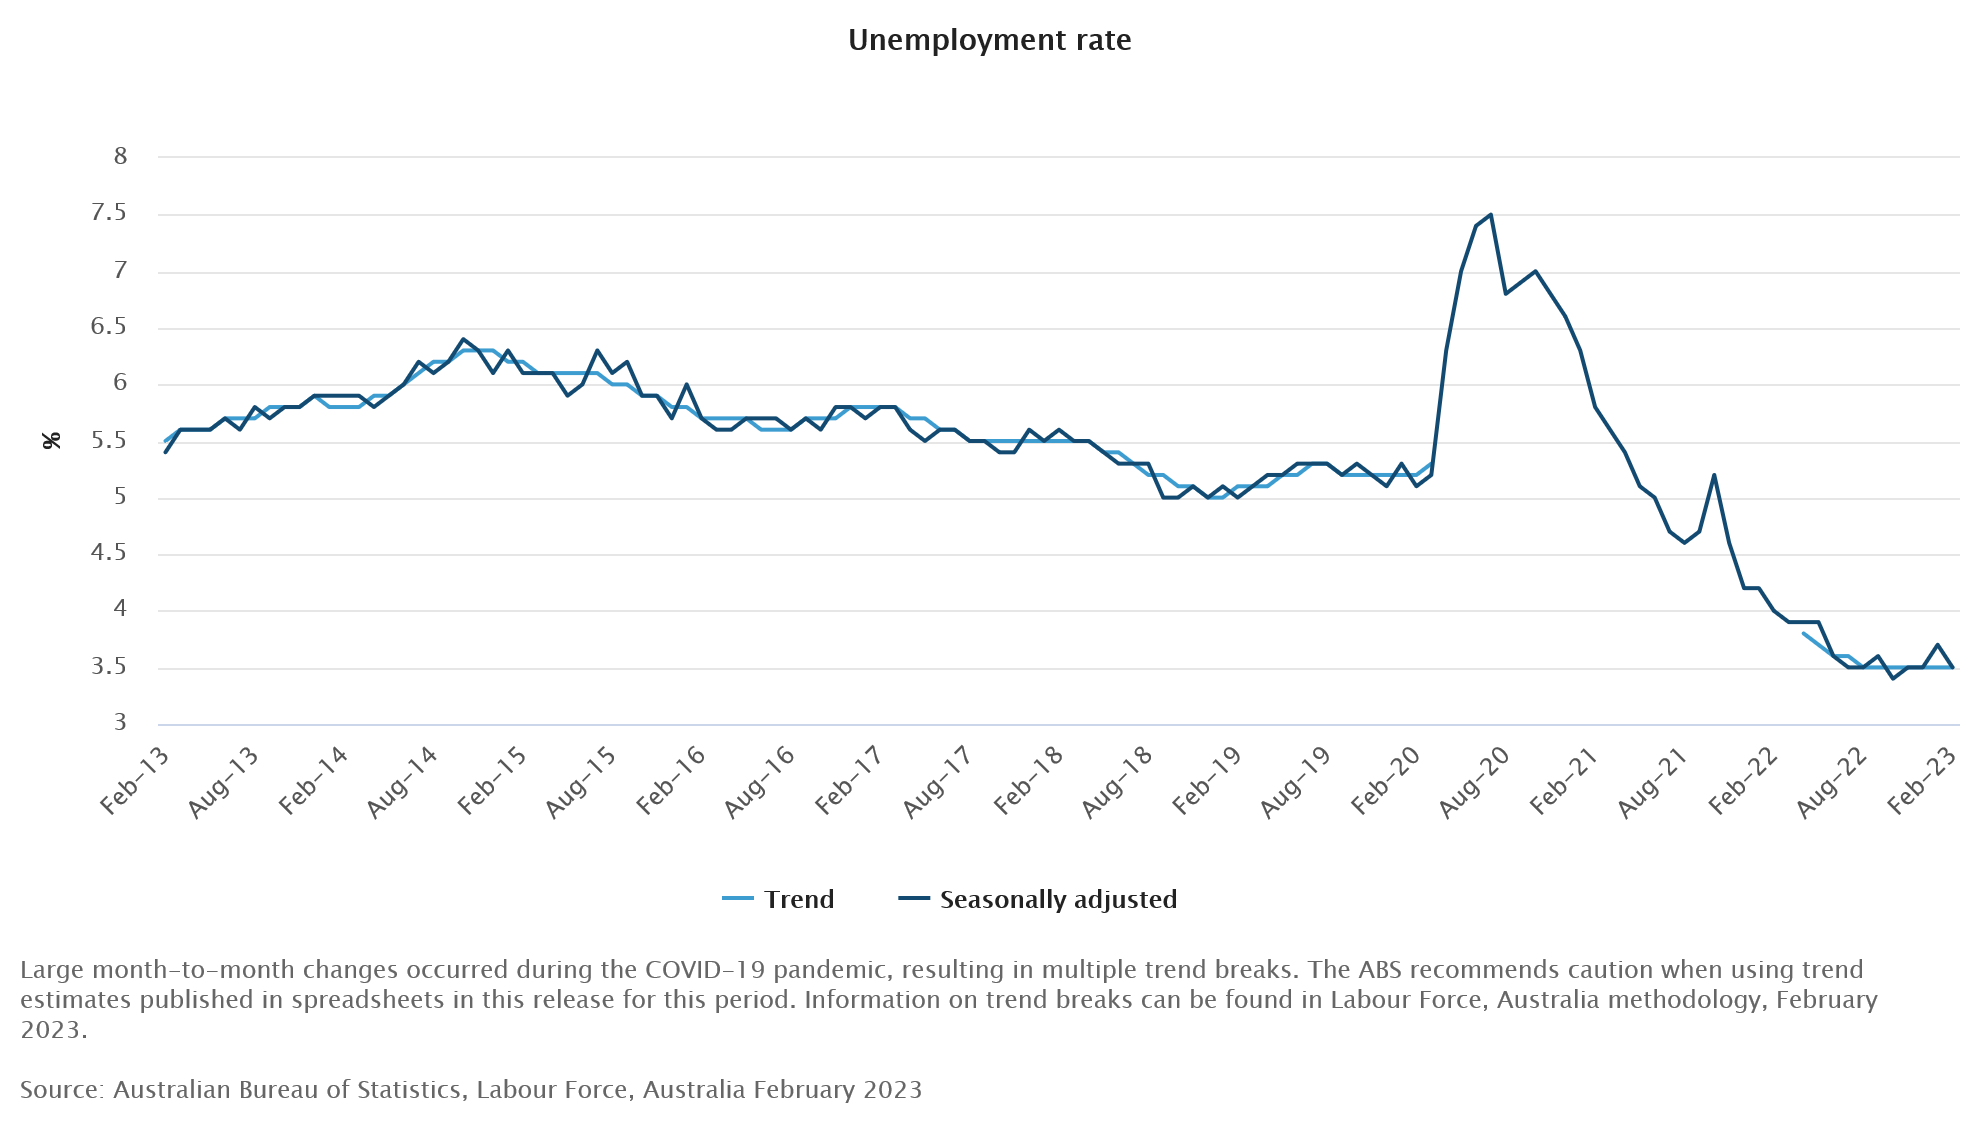
Unemployment rate dropped from 3.7% to 3.5%, below expectation of 3.6%. Participation rate rose 0.1% to 66.6%. Monthly hours worked rose 3.9% mom.
Bjorn Jarvis, ABS head of labour statistics said: "with employment increasing by around 65,000 people, and the number of unemployed decreasing by 17,000 people, the unemployment rate fell to 3.5 per cent. This was back to the level we saw in December.
"The February increase in employment follows consecutive falls in December and January. In January, this reflected a larger than usual number of people waiting to start a new job, the majority of whom returned to or commenced their jobs in February.
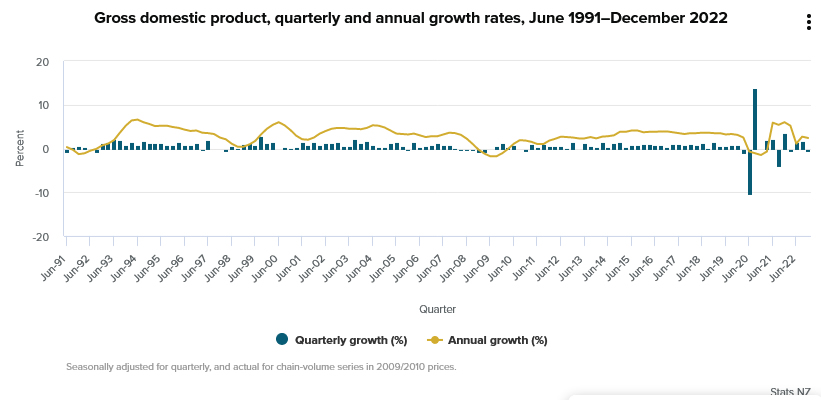
NZ GDP contracted -0.6% qoq in Q4, RBNZ may slow tightening
New Zealand's Q4 GDP contracted by -0.6% qoq, missing the expected contraction of 0.2% qoq. The primary industries fell by 1.3%, service industries were down by 0.1%, and goods-producing industries were down by 0.3%.
Although the Finance Minister Grant Robertson acknowledged that the GDP could fluctuate as the country continues to recover from COVID, he also highlighted that the economy is nearly 6.7% larger than pre-pandemic levels, outpacing other countries.
Despite this, the GDP figure is significantly below RBNZ's forecast of 0.7% growth, suggesting that the central bank may not need to be as aggressive with its tightening in the future. As a result, economists are now predicting that the RBNZ will opt for a more modest 25bps rate hike in April instead of the previously expected 50bps.
Looking ahead
The main event is ECB's rate decision and press conference. Elsewhere, Swiss SECO will release economic forecasts. Canada will publish wholesale sales. US jobless claims, Philly Fed survey, housing starts and building permits, and import prices will be featured.
EUR/JPY Daily Outlook
Daily Pivots: (S1) 138.74; (P) 141.86; (R1) 144.23; More....
Intraday bias in EUR/JPY remains on the downside for the moment. Fall from 145.55 is seen as the third leg of the whole correction from 148.38 high. Deeper decline would be seen to for retesting 137.37 low, and then 135.40 fibonacci level. On the upside, above 142.14 minor resistance will turn intraday bias neutral first, and could bring recovery. But near term risk will remain on the downside as long as 4 hour 55 EMA (now at 143.47) holds.
In the bigger picture, as long as 55 week EMA (now at 139.54) holds, larger up trend from 114.42 (2020 low) is still in progress for 149.76 long term resistance. However, firm break of 55 week EMA will bring deeper fall to 38.2% retracement of 114.42 to 148.38 at 135.40. Sustained break there will raise the chance of trend reversal, and target 61.8% retracement at 127.39.
Economic Indicators Update
| GMT | Ccy | Events | Actual | Forecast | Previous | Revised |
|---|---|---|---|---|---|---|
| 21:45 | NZD | GDP Q/Q Q4 | -0.60% | -0.20% | 2.00% | 1.70% |
| 23:50 | JPY | Trade Balance (JPY) Feb | -1.19T | -1.46T | -1.82T | |
| 23:50 | JPY | Machinery Orders M/M Jan | 9.50% | 1.80% | 1.60% | |
| 00:00 | AUD | Consumer Inflation Expectations Mar | 5.00% | 5.10% | ||
| 00:30 | AUD | Employment Change Feb | 64.6K | 48.5K | -11.5K | -10.9K |
| 00:30 | AUD | Unemployment Rate Feb | 3.50% | 3.60% | 3.70% | |
| 04:30 | JPY | Industrial Production M/M Jan F | -5.30% | -4.60% | -4.60% | |
| 08:00 | CHF | SECO Economic Forecasts | ||||
| 12:30 | CAD | Wholesale Sales M/M Jan | 0.10% | -0.80% | ||
| 12:30 | USD | Initial Jobless Claims (Mar 10) | 205K | 211K | ||
| 12:30 | USD | Housing Starts Feb | 1.32M | 1.31M | ||
| 12:30 | USD | Building Permits Feb | 1.35M | 1.34M | ||
| 12:30 | USD | Import Price Index M/M Feb | -0.20% | -0.20% | ||
| 12:30 | USD | Philadelphia Fed Manufacturing Survey Mar | -16 | -24.3 | ||
| 13:15 | EUR | ECB Main Refinancing Rate | 3.50% | 3.00% | ||
| 13:45 | EUR | ECB Press Conference | ||||
| 14:30 | USD | Natural Gas Storage | -62B | -84B |
Further Downside in DAX Impulsive Elliott Wave Decline
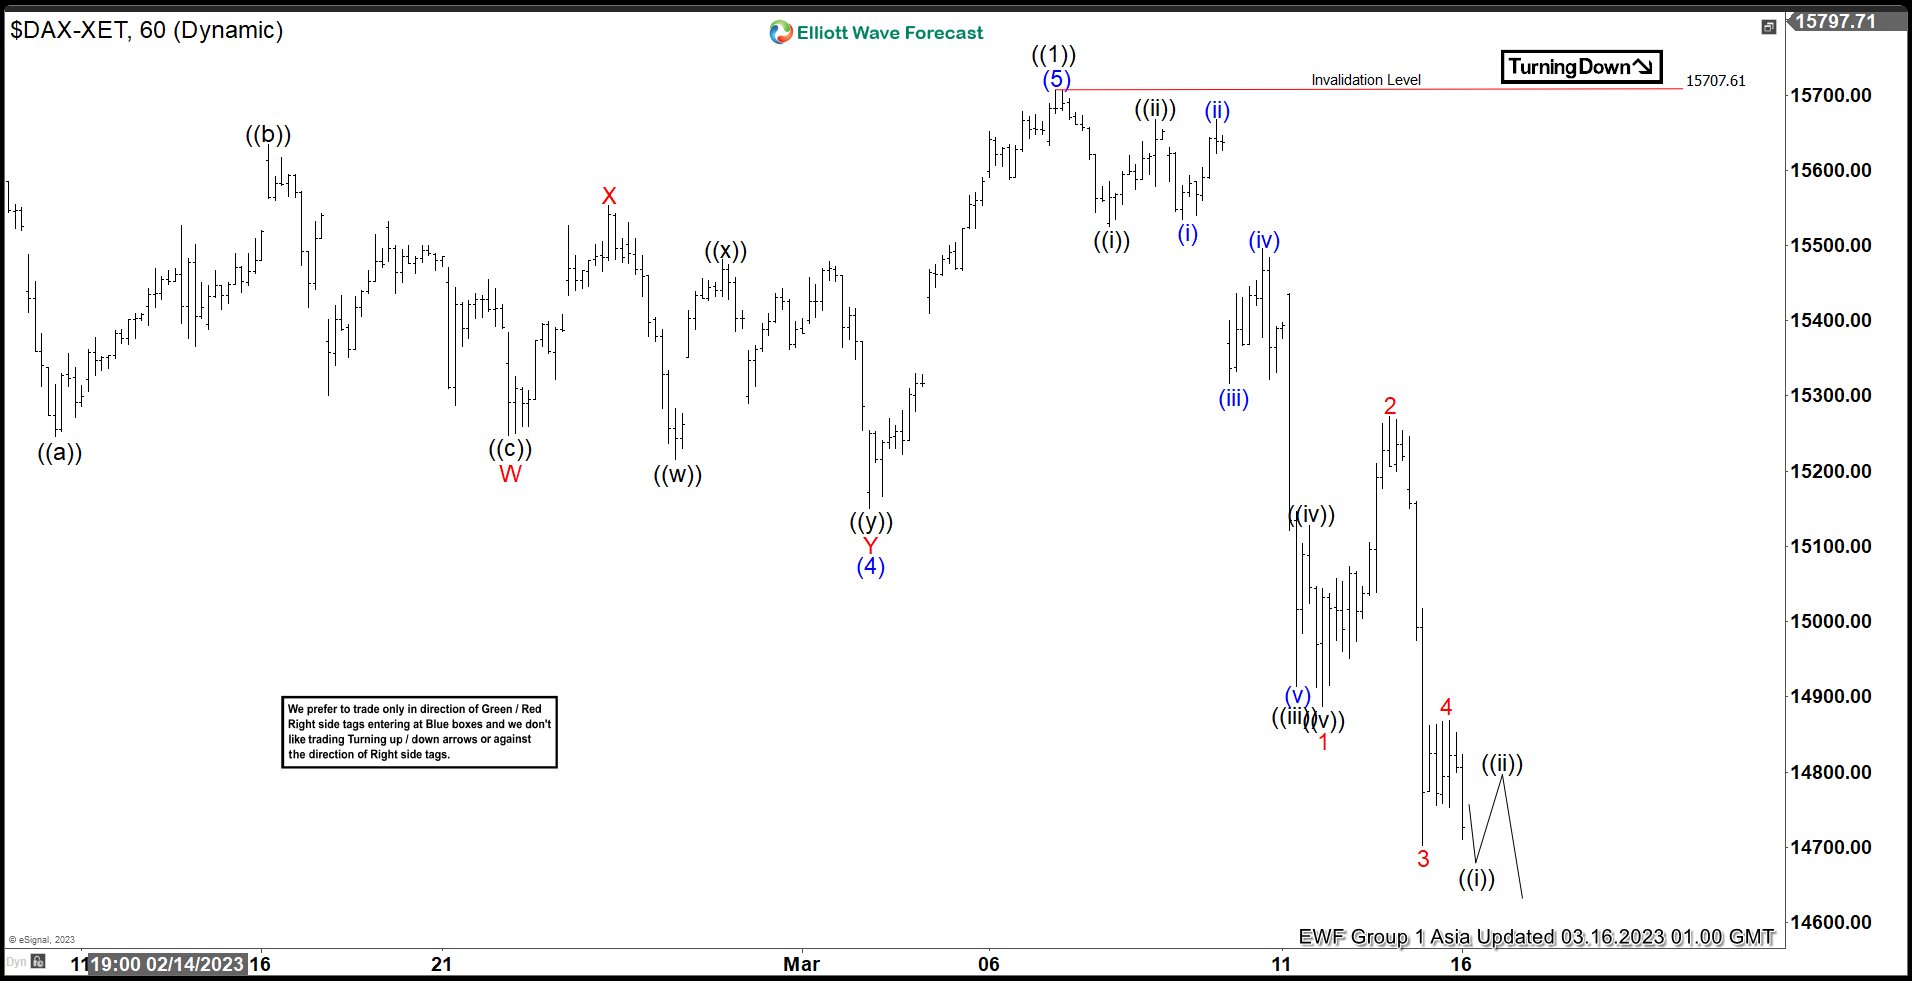
DAX ended cycle from 9.28.2022 low in wave ((1)) at 15707.61 with internal subdivision as 5 waves. Index is now correcting that cycle within wave ((2)) in larger degree 3, 7, or 11 swing. Internal subdivision of wave ((2)) is unfolding as a zigzag Elliott Wave structure. A zigzag is an (A)-(B)-(C) structure where wave (A) and (C) both subdivide in 5 waves. Wave (A) of ((2)) is now in progress as 5 waves. Down from wave ((1)), wave ((i)) ended at 15524.85 and rally in wave ((ii)) ended at 15667.21. Index resumes lower in wave ((iii)) towards 14913.98, and wave ((iv)) ended at 15128.25. Final leg lower wave ((v)) ended at 14887.44 which completed wave 1.
Corrective rally in wave 2 has ended at 15272.11 and the Index resumes lower in wave 3 towards 14702.91. Wave 4 is proposed complete at 1488.06. Expect the Index to see a few more lows before ending wave 5 and this should complete wave (A) in larger degree. Afterwards, the Index should rally in wave (B) to correct cycle from 3.7.2023 high before it resumes lower again in wave (C) of ((2)). Near term, as far as pivot at 15707.6 high stays intact, expect rally to fail in 3, 7, or 11 swing for further downside.
DAX 60 Minutes Elliott Wave Chart
https://www.youtube.com/watch?v=XX6Xl6RbzWY
Japan posted record February trade deficit
In February, Japan exports rose 6.5% yoy to JPY 7655B, below expectation of 7.1% yoy. Imports rose 8.3% yoy to JPY 8552B, below expectation of 12.2% yoy. Consequently, the country experienced its largest February trade deficit to date at JPY -897.7B.
The breakdown of trade relations painted an interesting picture, with the US and China displaying contrasting trends. Exports to the US surged by 14.9% yoy, while imports increased by 6.6%, resulting in a favorable surplus of JPY 530.5B. However, trade with China proved more challenging, as exports dipped by -10.9% yoy and imports saw a marginal decrease of 0.6% yoy, culminating in a deficit of JPY -209.8B.
On a more positive note, seasonally adjusted figures highlighted a 4.4%mom rise in exports to JPY 8146B, accompanied by a 3.0% mom drop in imports to JPY 9336B. As a result, trade deficit narrowed to JPY -1191B, outperforming the expected JPY -1460B.
Australia employment grew 64.6k in Feb, unemployment rate dropped to 3.5%
Australia employment grew 64.6k in February, well above expectation of 48.5k. Full-time employment rose 74.9k. Part-time employment decreased -10.3k.
Unemployment rate dropped from 3.7% to 3.5%, below expectation of 3.6%. Participation rate rose 0.1% to 66.6%. Monthly hours worked rose 3.9% mom.
Bjorn Jarvis, ABS head of labour statistics said: "with employment increasing by around 65,000 people, and the number of unemployed decreasing by 17,000 people, the unemployment rate fell to 3.5 per cent. This was back to the level we saw in December.
"The February increase in employment follows consecutive falls in December and January. In January, this reflected a larger than usual number of people waiting to start a new job, the majority of whom returned to or commenced their jobs in February.
Bitcoin Price Rally Turns Attractive on Dips
Key Highlights
- Bitcoin price is consolidating gains above the $23,000 support zone.
- BTC broke a major key trend line at $22,200 on the 4-hours chart.
- Gold price climbed higher above the $1,920 resistance zone.
- EUR/USD declined heavily after it faced rejection near the 1.0750 resistance.
Bitcoin Price Technical Analysis
Bitcoin price found support near the $19,500 zone and started a fresh increase. BTC/USD broke the $22,000 resistance zone to move into a positive region.
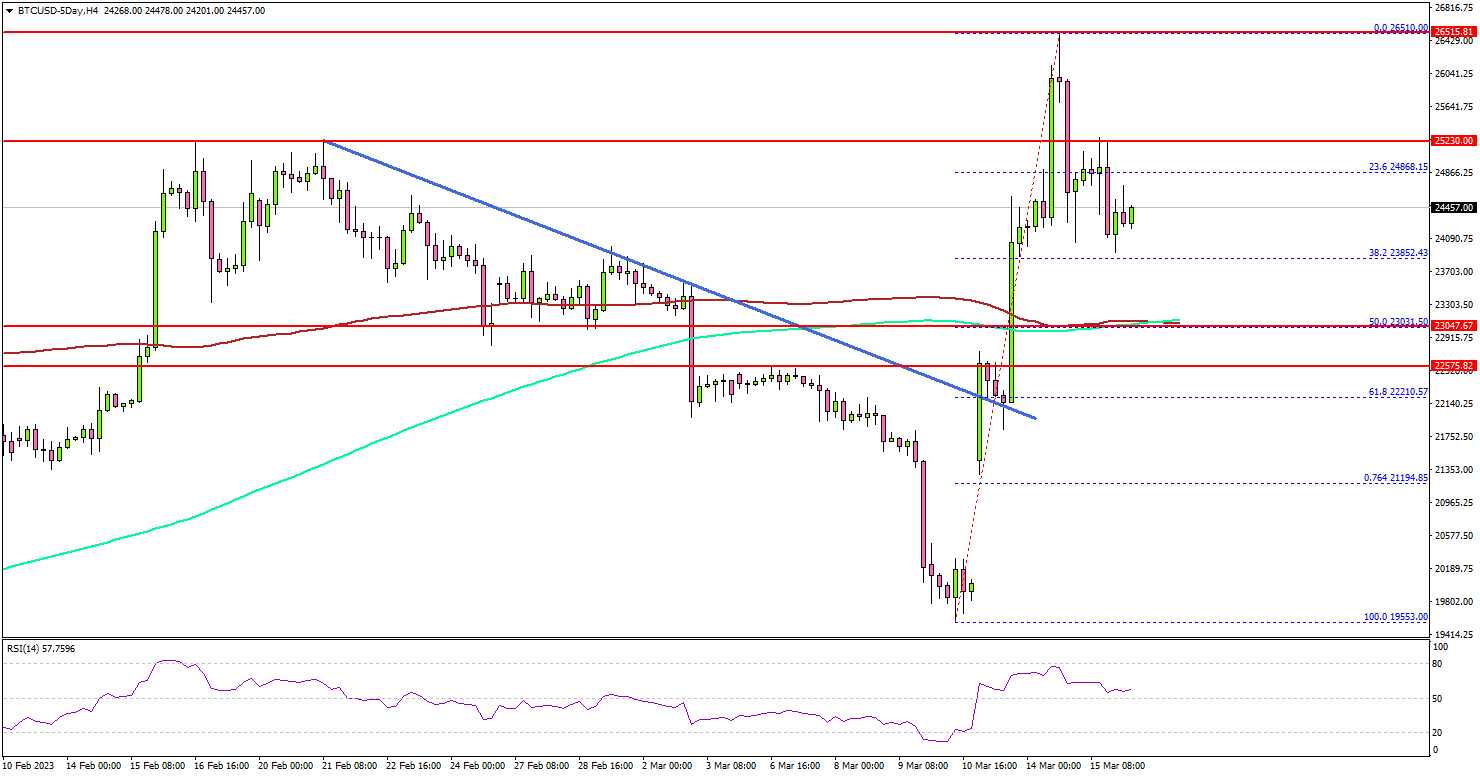
Looking at the 4-hours chart, the price even cleared a major key trend line at $22,200. It opened the doors for a move above the $24,000 resistance zone, the 100 simple moving average (red, 4-hours), and the 200 simple moving average (green, 4-hours).
The price traded to a new monthly high at $26,510 and recently corrected gains. There was a move below the $25,000 support zone.
On the downside, an initial support sits near the $24,000 level. The main breakdown support sits near the $23,000 zone, the 100 simple moving average (red, 4-hours), and the 200 simple moving average (green, 4-hours).
If there is a downside break and close below $23,000, bitcoin might start another decline in the coming days. In the stated case, it could revisit the $22,000 support or even test $21,200.
On the upside, the price is facing resistance near the $25,300 resistance zone. A close above the $25,300 level may perhaps start another steady increase in the coming sessions.
In the stated case, the price could rise towards the $26,250 level. Any more gains could set the pace for a move towards the $27,000 level.
Economic Releases
- US Initial Jobless Claims - Forecast 205K, versus 211K previous.
- ECB Interest Rate on Deposits - Forecast 3%, versus 2.5% previous.
Australia: Employment Bounces on Return of Workers from Summer Holidays
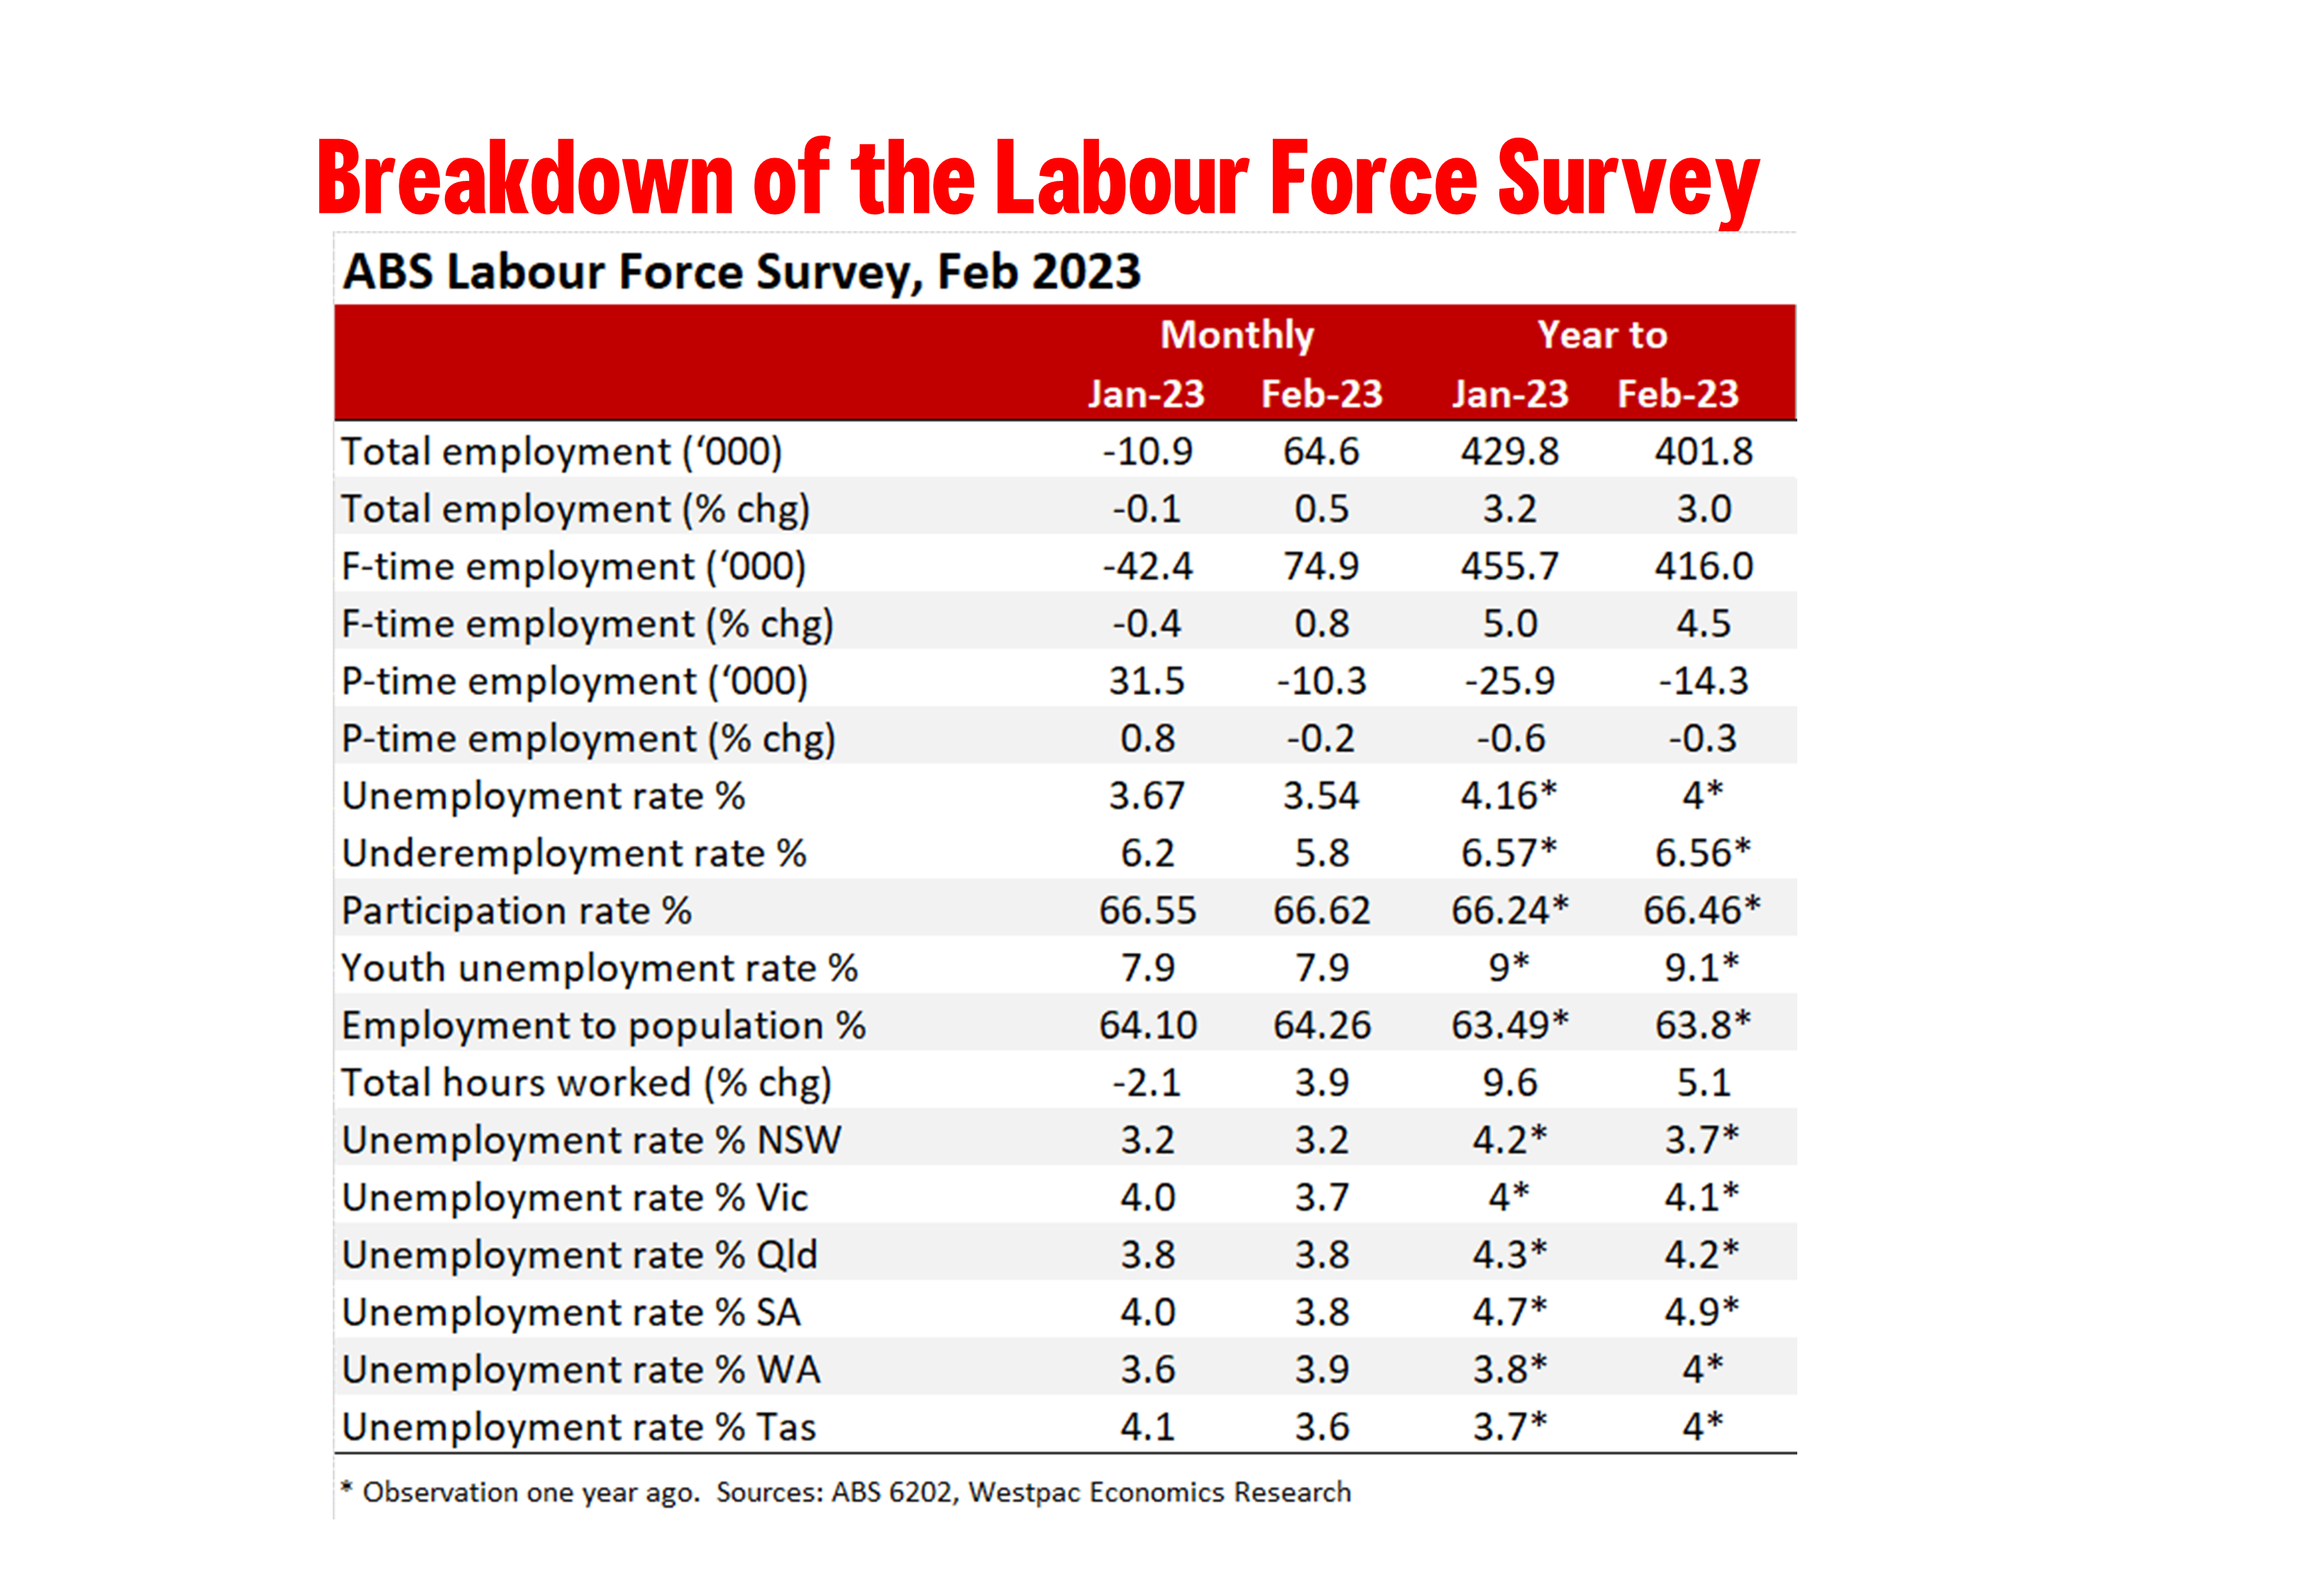
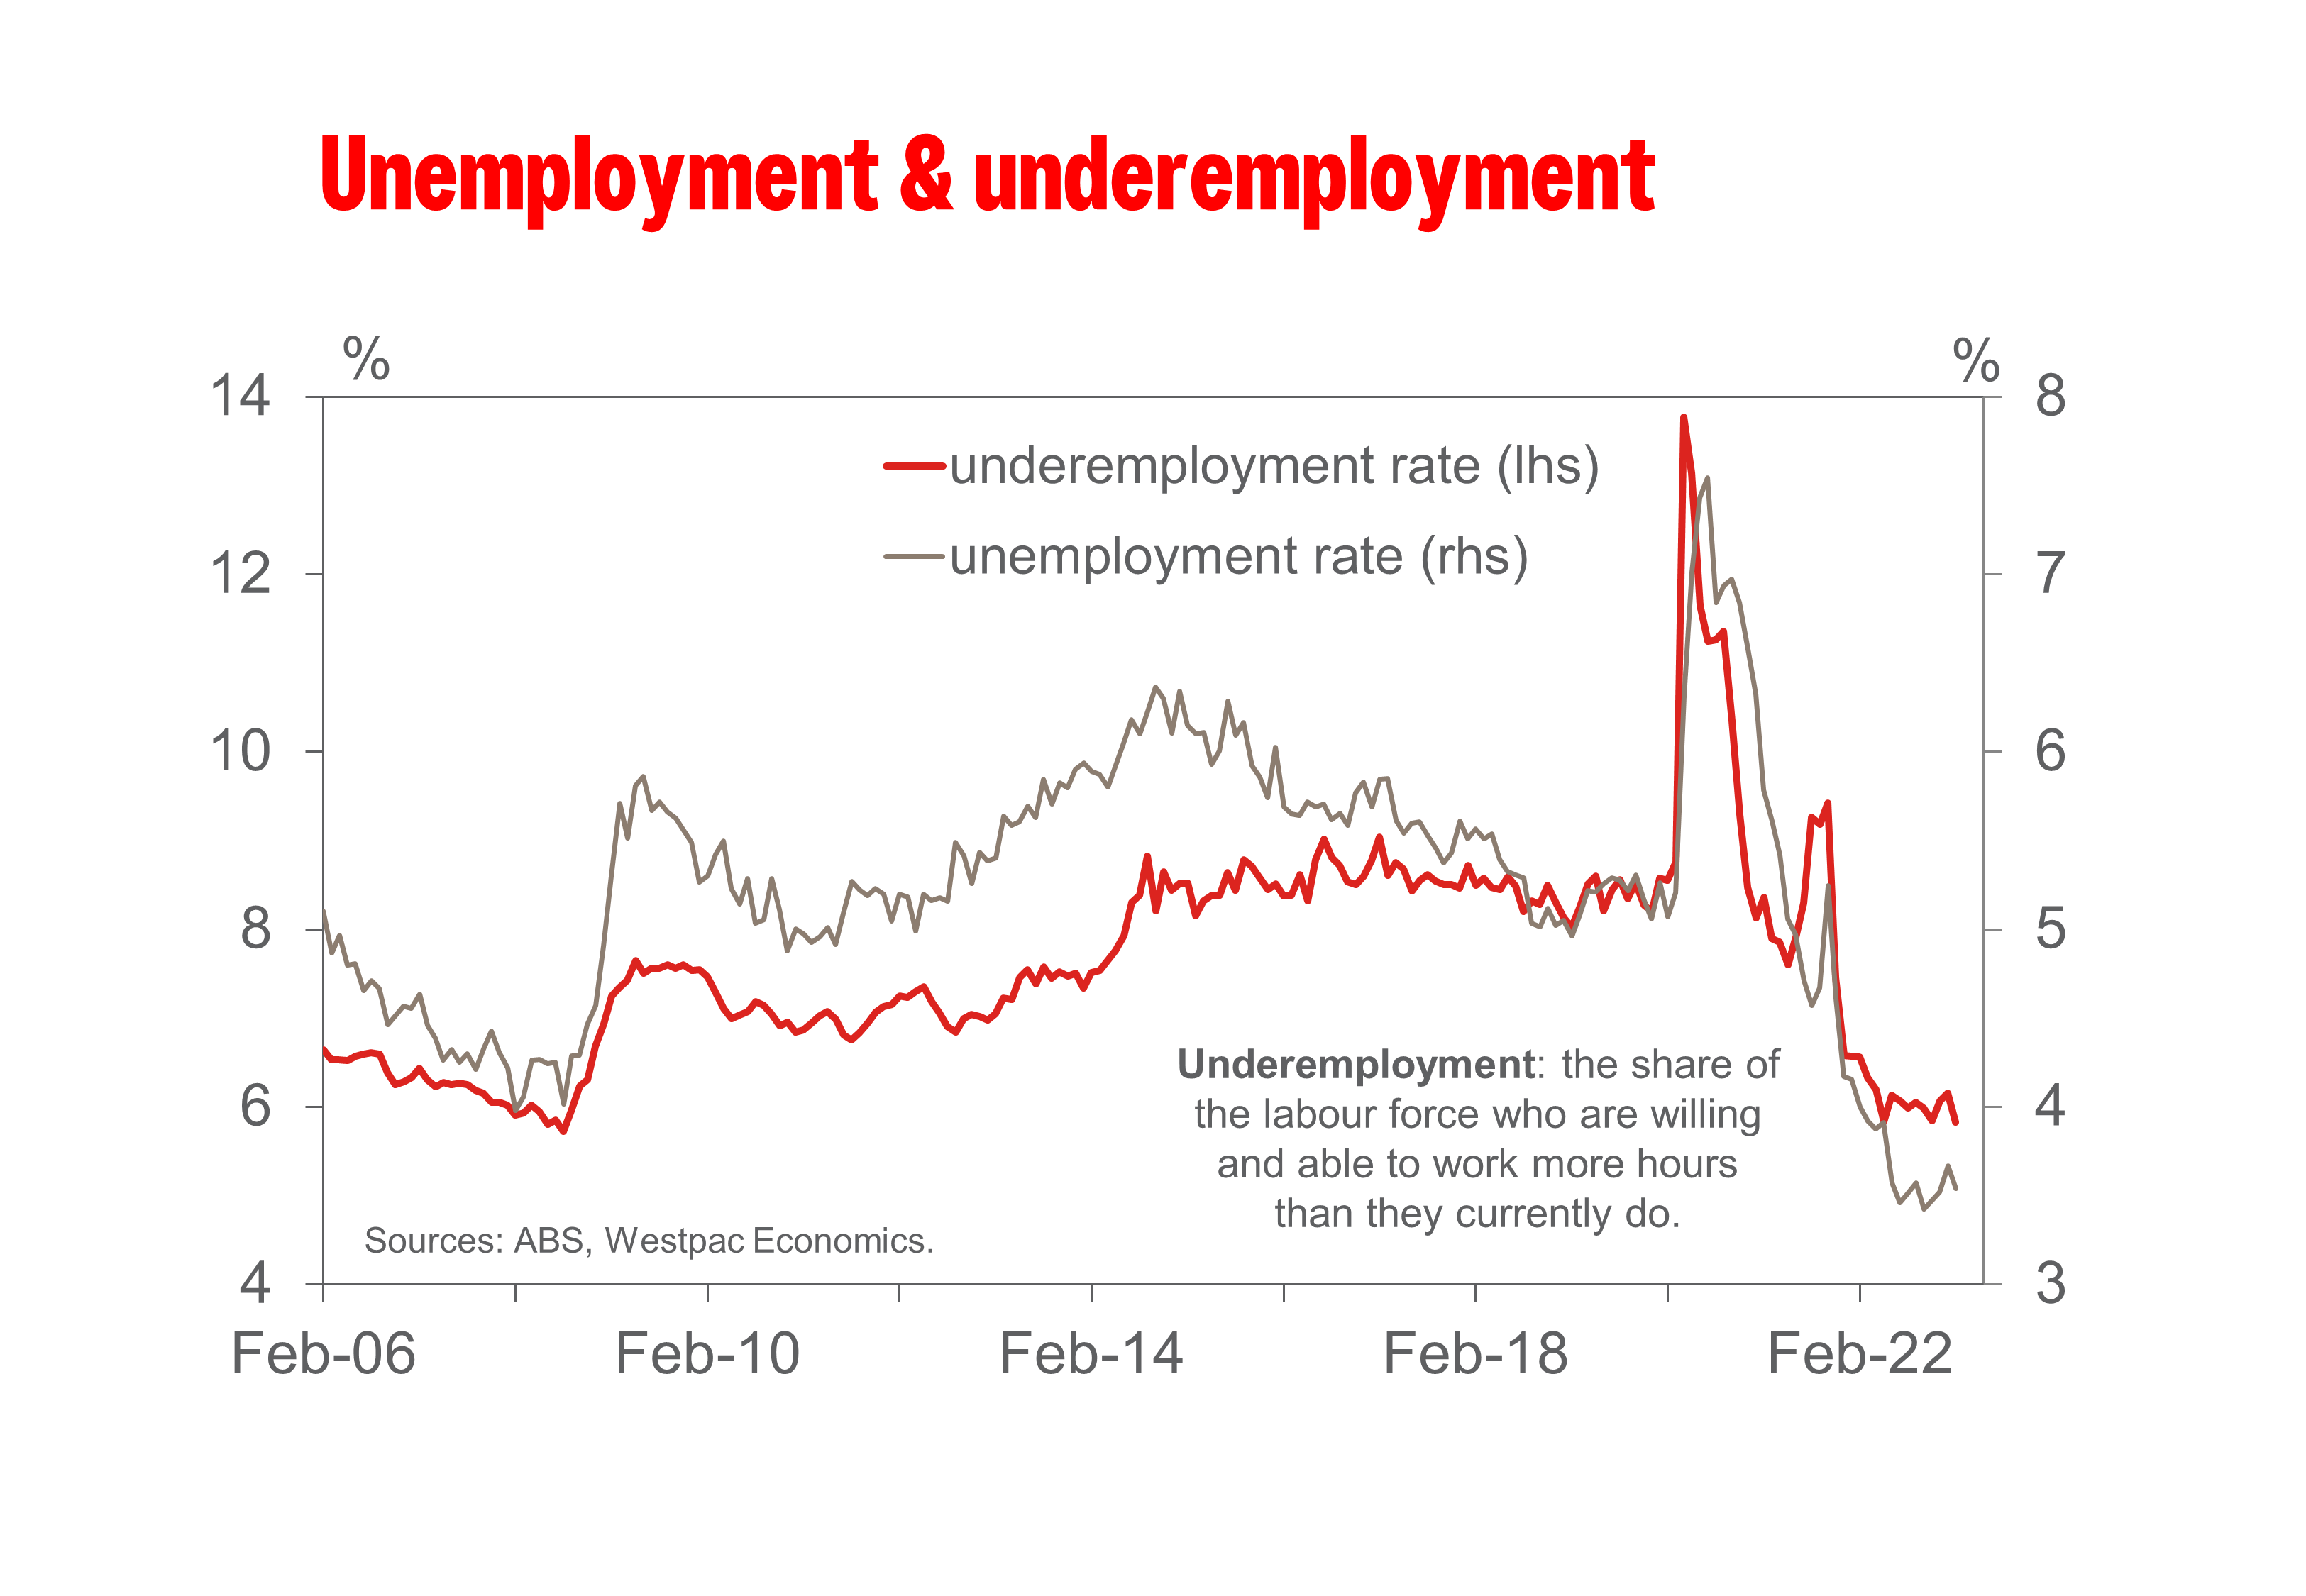
Total employment: +64.6k from –10.9k (revised from –11.5k); unemployment rate: 3.5% from 3.7% (unrevised 3.7%); participation rate: 66.6% from 66.5% (unrevised 66.5%).
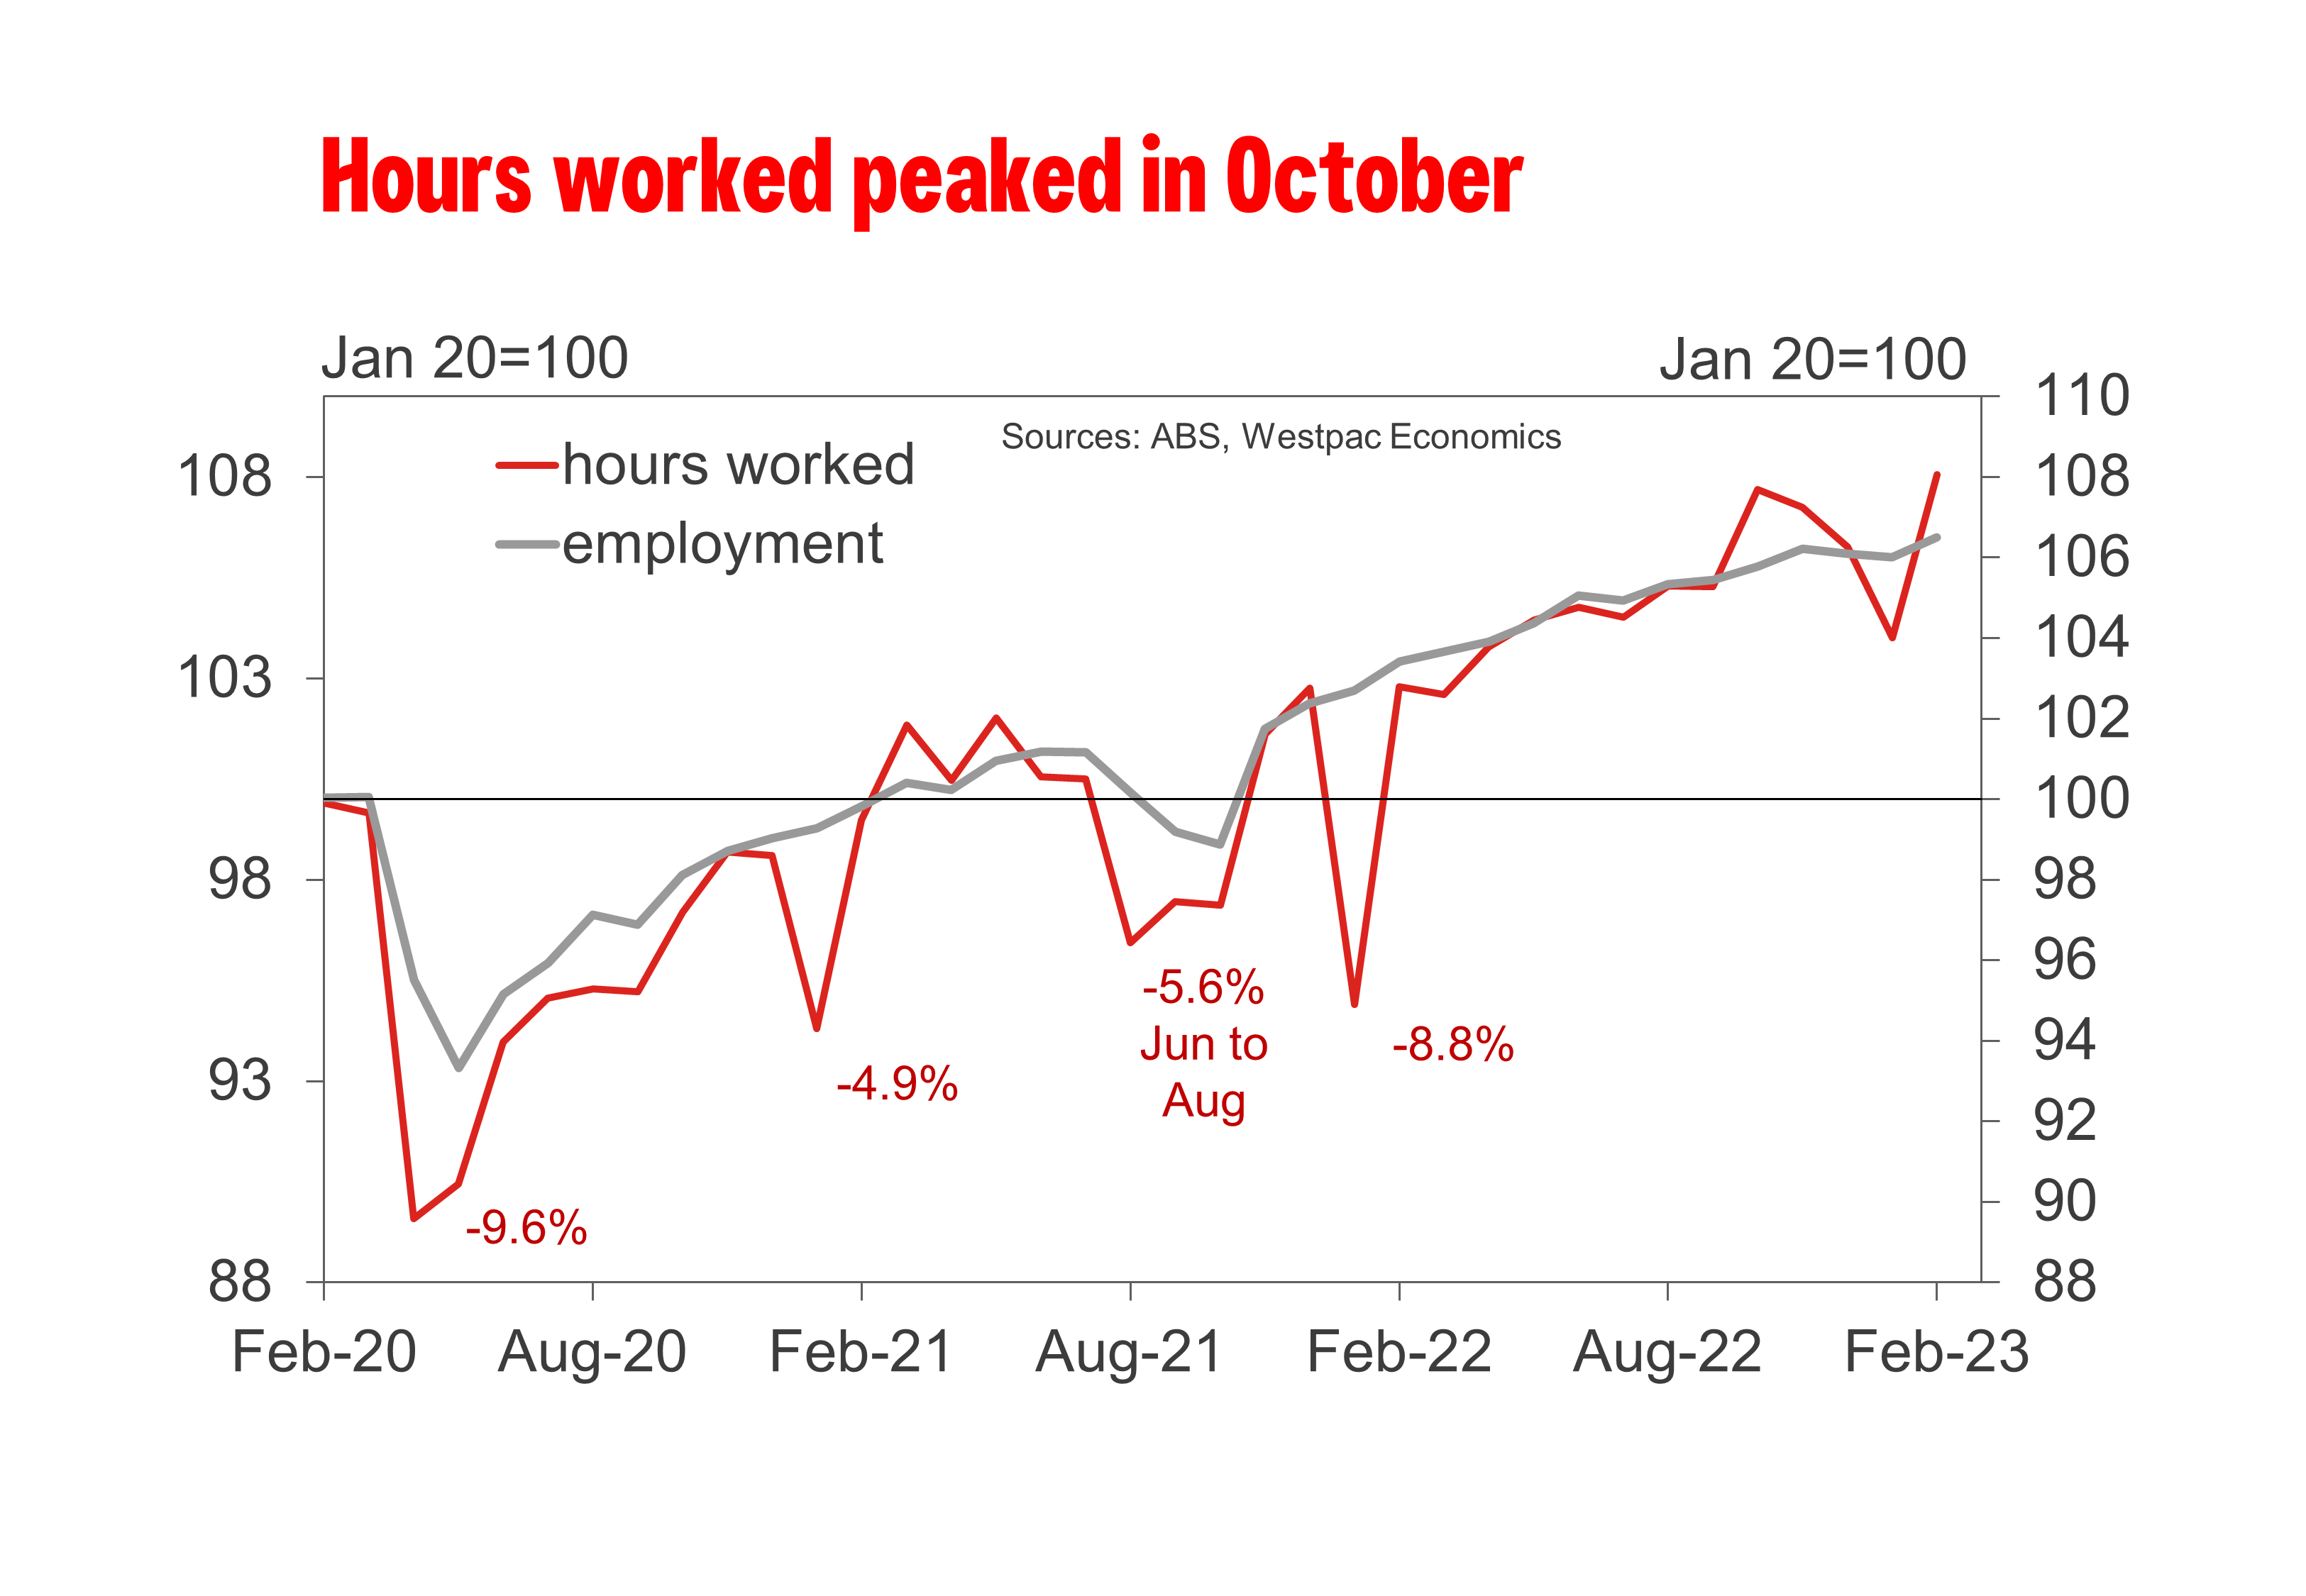
Total employment rose by 64.6k (0.5%) in February 2023, more than reversing the two consecutive monthly declines in January (–10.9k) and December (–16.6k). Accordingly, seasonally adjusted hours worked increased by 3.9% in February, much larger than the increase in employment.
Revisions to the recent history of the series has also seen a slight improvement in the pace of employment growth leading into year-end, and a slightly more muted pace of job declines over the December and January period.
The February print therefore confirms our expectations that the softer pace of jobs growth observed over the December and January period, albeit material, was exacerbated by quirks around holiday seasonality, suggesting that the Australian labour market has begun the year on a firmer footing than what was initially anticipated.
In particular, the January survey reported a larger-than-usual number of people waiting to start a new job, which as a proportion of the labour force, rose from a pre-pandemic average of around 4% to 5.2% in January 2023. The ABS reports that a majority of these people returned to their jobs in February, hence the bounce in employment growth.
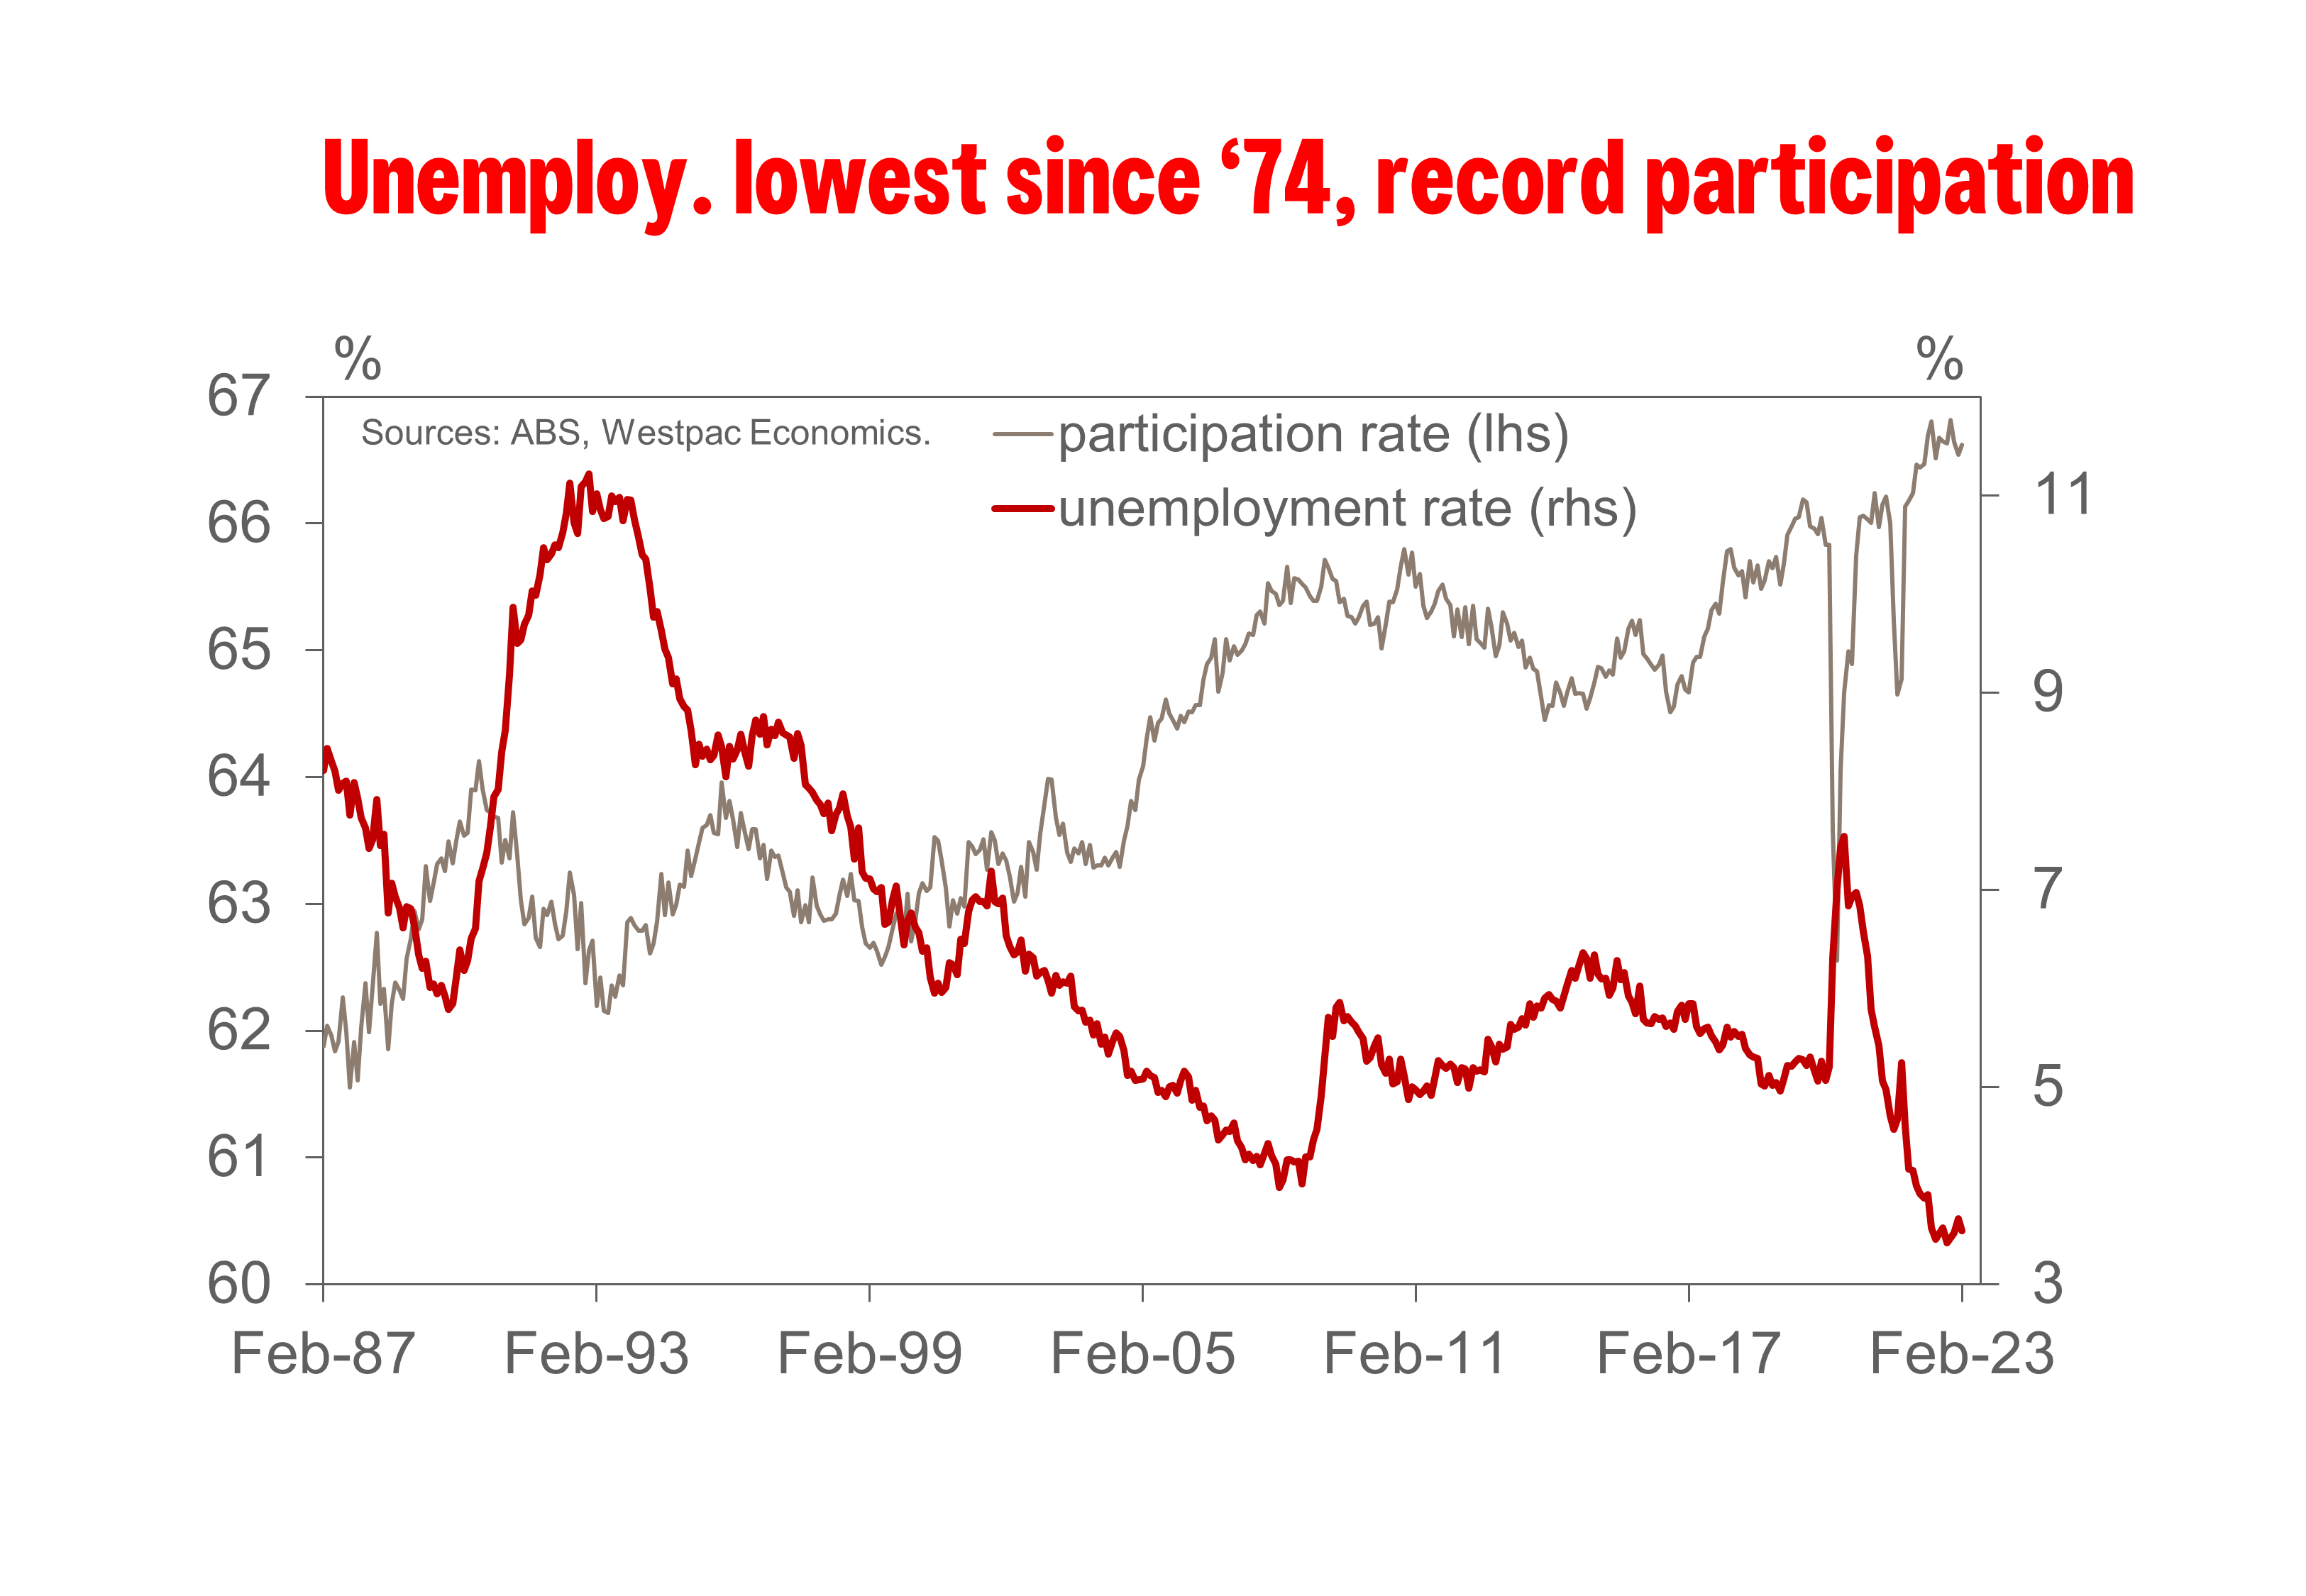
Reflective of the fact that many of these individuals were likely not counted as part of the labour force in January – not actively searching for work given they have a job to go to – the participation rate increased by 0.1ppt to 66.6% in February. The employment-to-population ratio also lifted by 0.2ppt to 64.3%, just shy of the 64.5% record high observed in November.
The lift in participation saw the labour force grow by 48.1k, lower than the gain in employment, resulting in the unemployment rate falling to 3.5%, rounded to two decimal points, the decrease (from 3.67% to 3.54%) amounted closer to just 0.1ppt. The underemployment rate also posted a substantial decline, down from 6.2% to 5.8%, which alongside the improvement in unemployment and hours worked, suggests that all of the employment gained was full-time, with some switching from part-time to full-time also evident.
The gains in employment look to have been broadly based across the nation with all major states posting an increase, led by Vic (+0.3%), following SA and WA (+0.2%) then NSW and Qld (+0.1%). The unemployment rate held flat in NSW (3.1%) and Qld (3.8%), declined in Vic (-0.3ppt to 3.7%) and SA (-0.2ppt to 3.8%) and rose in WA (+0.2ppt to 3.9%).
Overall, the February report does suggest that the Australian labour market has begun the year on a firm trend, though we do expect outcomes to soften moving into the second half of the year. We are processing the numbers and working through how they will impact on our current labour market forecasts.
NZ GDP contracted -0.6% qoq in Q4, RBNZ may slow tightening
New Zealand's Q4 GDP contracted by -0.6% qoq, missing the expected contraction of 0.2% qoq. The primary industries fell by 1.3%, service industries were down by 0.1%, and goods-producing industries were down by 0.3%.
Although the Finance Minister Grant Robertson acknowledged that the GDP could fluctuate as the country continues to recover from COVID, he also highlighted that the economy is nearly 6.7% larger than pre-pandemic levels, outpacing other countries.
Despite this, the GDP figure is significantly below RBNZ's forecast of 0.7% growth, suggesting that the central bank may not need to be as aggressive with its tightening in the future. As a result, economists are now predicting that the RBNZ will opt for a more modest 25bps rate hike in April instead of the previously expected 50bps.