Sample Category Title
Key Moment for the Oil Market
Oil prices fell to a three-month low following the release of US inflation data which was in line with expectations. The annual inflation rate of 6% and monthly rate of 0.4% were unsurprising, but the monthly core Consumer Price Index (CPI) beat expectations at 0.5%. This has led to the market pricing in a 25 basis point hike from the Federal Reserve next week after briefly considering a pause in the aftermath of the recent bank failures of Silvergate Corp., SVB Financial, and Signature Bank.
The market is now viewing the Federal Reserve as hawkish again, which has raised concerns about a potential recession, given that the tightening cycle is yet to play out. We hope to gain more insight into the Fed's inclination at next week's Federal Open Market Committee (FOMC) meeting. Still, the market remains uncertain and anxious about the economy's future. Having said all this, let's now look at the technical side of things.
XBRUSD
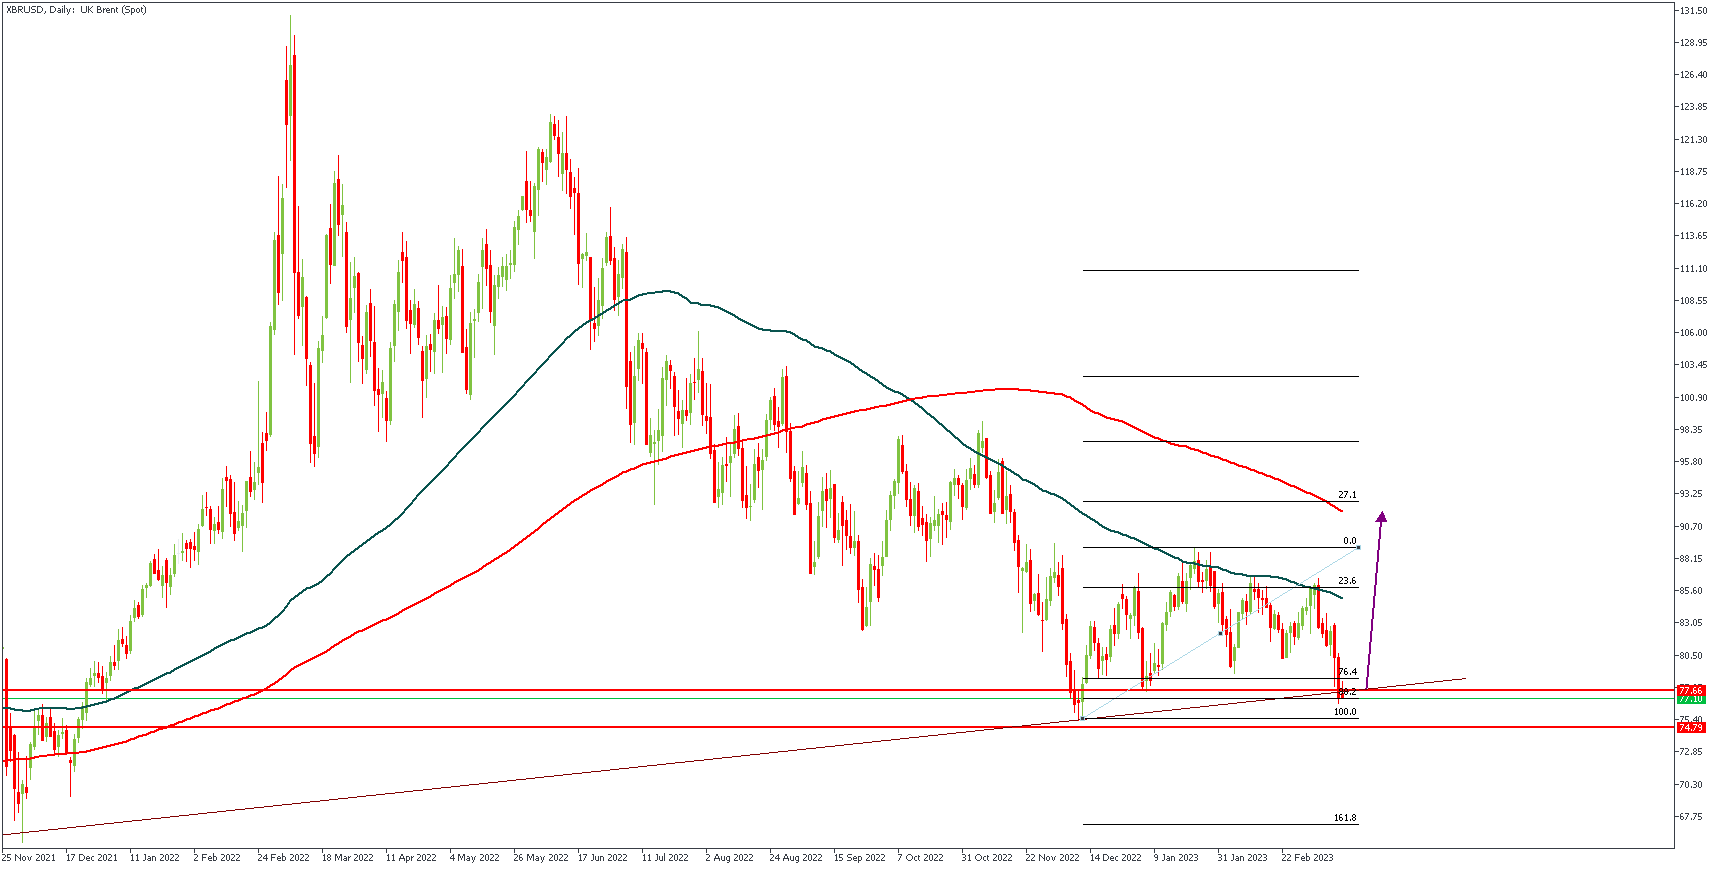
XBRUSD on the Daily timeframe is currently squeezing between the support trendline from 4 years ago and the 100-day MA. Note that the price is currently stalling around 88% of the Fibonacci retracement, which may indicate bullish intent. However, there remains a bit of uncertainty as the MAs are still poised in a bearish array.
Analysts’ Expectations:
- Direction: Bullish
- Target: 85.55
- Invalidation: 74.82
CONCLUSION
The trading of CFDs comes at a risk. Thus, to succeed, you have to manage risks properly. To avoid costly mistakes while you look to trade these opportunities, be sure to do your due diligence and manage your risk appropriately.
Australian Dollar Slips Ahead of Employment Report
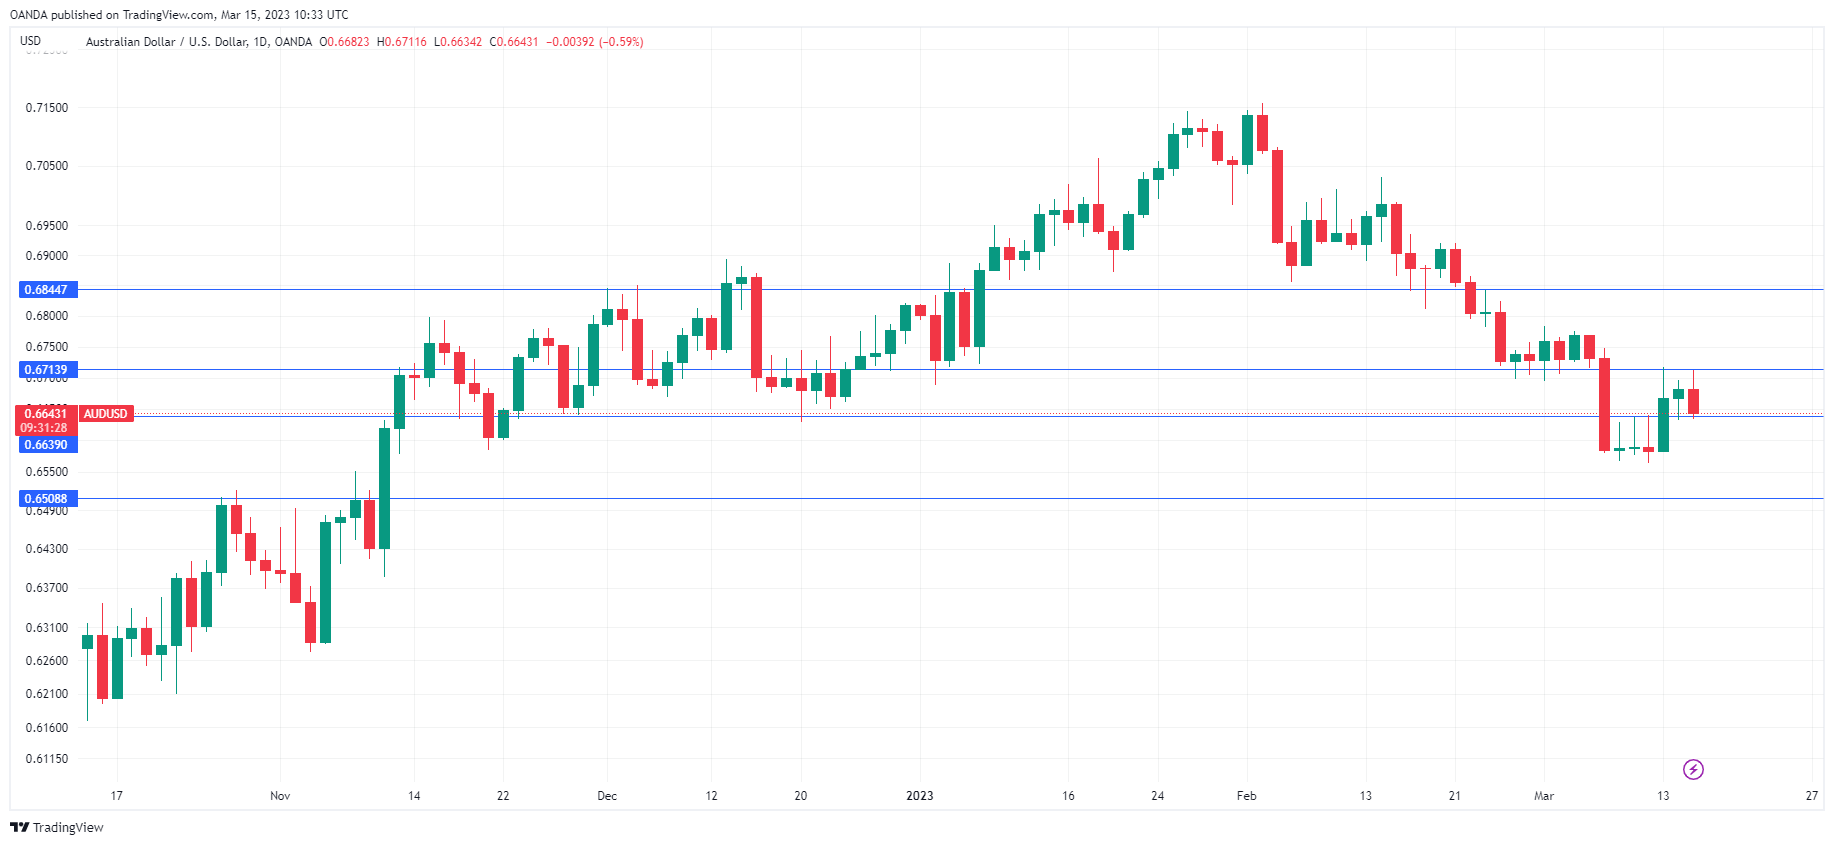
The Australian dollar, which has posted strong gains early in the week, has run into a wall on Wednesday. In the European session, AUD/USD is trading at 0.6638, down 0.66%.
Australian job growth expected to rebound
Australia releases the February employment report on Thursday (Australia time). Job growth is expected to rebound, with a consensus of 48,500 after a soft January read of -11,500. The unemployment rate is expected to tick lower to 3.6%, down from 3.7%. The Reserve Bank of Australia will be watching closely, as a robust labour market has enabled the central bank to continue its tightening – the Bank raised rates last week by 25 basis points, a 10th straight hike which brought the cash rate to 3.60%. The good news is that the end of the tightening cycle could be near, with the markets pricing in a pause at the April meeting. Consumers and businesses are weary of rising interest rates and confidence indicators do not paint an optimistic picture.
Along with the job data, Australia releases consumer inflation expectations for March. The markets are braced for the indicator to rise to 5.4%, after a 5.1% gain in February. Inflation expectations is a key inflation gauge as it can set the direction of actual inflation, and the RBA will not be happy if inflation expectations accelerate.
There is an uneasy calm in the air as the dust begins to settle after the Silicon Valley Bank collapse. The sky is not falling, not even above US bank towers, as regional bank stocks have rebounded. The US inflation release on Tuesday delivered as expected, with both the headline and core CPI readings matching the estimates. Headline CPI fell to 6.0%, down from 6.4%, while the core rate ticked lower to 5.5%, down from 5.6%. Inflation is cooling but we’re not seeing the disinflation process that the markets were celebrating only a few weeks ago.
AUD/USD Technical
- AUD/USD is testing support at 0.6639. Below, there is support at 0.6508
- 0.6713 and 0.6844 are the next resistance lines
Ifo Spring Forecast: German economy to contract slightly in 2023
According to the Spring 2023 economic forecast released by Germany's Ifo, the country's economy is expected to contract by -0.1% in 2023 before growing 1.7% in 2024. Headline inflation is projected to slow slightly to 6.2% in 2023 before dropping to 2.2% in 2024. However, core inflation, which excludes energy prices, is expected to rise further to 6.3% in 2023 and then decline to 2.8% in 2024.
Ifo stated that the "subdued performance of the global economy is dampening German exports," while high inflation rates are "depressing consumer spending and construction activity through declining purchasing power and significantly increased financing costs." The report also noted that inflation has become increasingly broad-based over the past year, remaining at historic highs for several months. While the direct contribution of energy prices has weakened, inflation in all other goods and services has increased steadily, reaching 7.6% in February.
The report added, "In addition to higher production costs passed on by companies to consumers, a noticeable widening of profit margins in some, particularly consumer-related, areas of the economy also contributed to this."
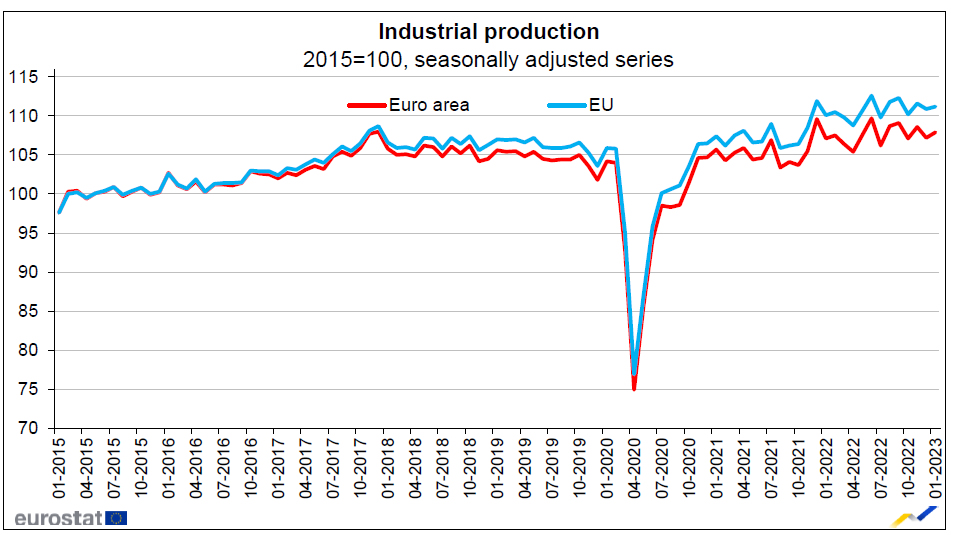
Eurozone industrial production rose 0.7% mom in Jan, EU up 0.3% mom
Eurozone industrial production rose 0.7% mom in January, above expectation of 0.5% mom. Production of intermediate goods grew by 1.5%, while production of capital goods fell by -0.2%, durable consumer goods by -0.7%, energy by -0.8% and non-durable consumer goods by -2.1%.
EU industrial production rose 0.3% mom. Among Member States for which data are available, the highest monthly increases were registered in Ireland (+9.3%), Sweden (+5.0%) and Romania (+2.0%). The largest decreases were observed in Denmark (-7.1%), Hungary (-5.0%) and the Netherlands (-4.3%).
GBP/USD Pair Started a Fresh Increase Above 1.2000
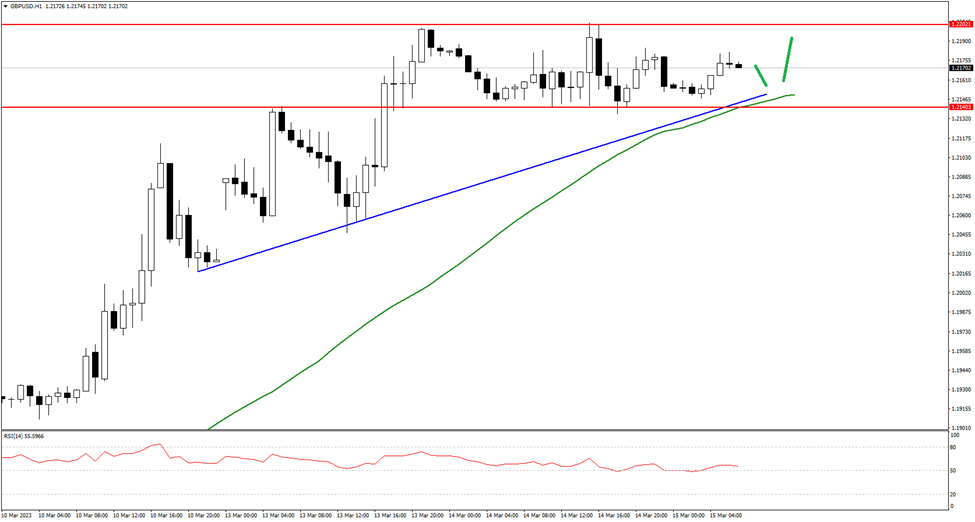
The British Pound started a fresh increase above the 1.2000 resistance against the US Dollar. The GBP/USD pair gained pace for a move above the 1.2050 level.
The pair even settled above the 1.2120 level and the 50 hourly simple moving average. The pair is now consolidating gains above the 1.2150 pivot level. An immediate resistance is near the 1.2200 level.
The first major resistance is near the 1.2220 level. If there is a clear upside break above the 1.2220 resistance, the pair could rise steadily towards the 1.2250 level in the near term. The next major resistance sits near 1.2320 on FXOpen.
On the downside, the first major support is near the 1.2150 level and a trend line on the hourly chart. The main support is forming near the 1.2120 level. A break below the 1.2120 support could push the pair towards the 1.2060 support.
USDJPY Recoups Losses After Sharp Drop
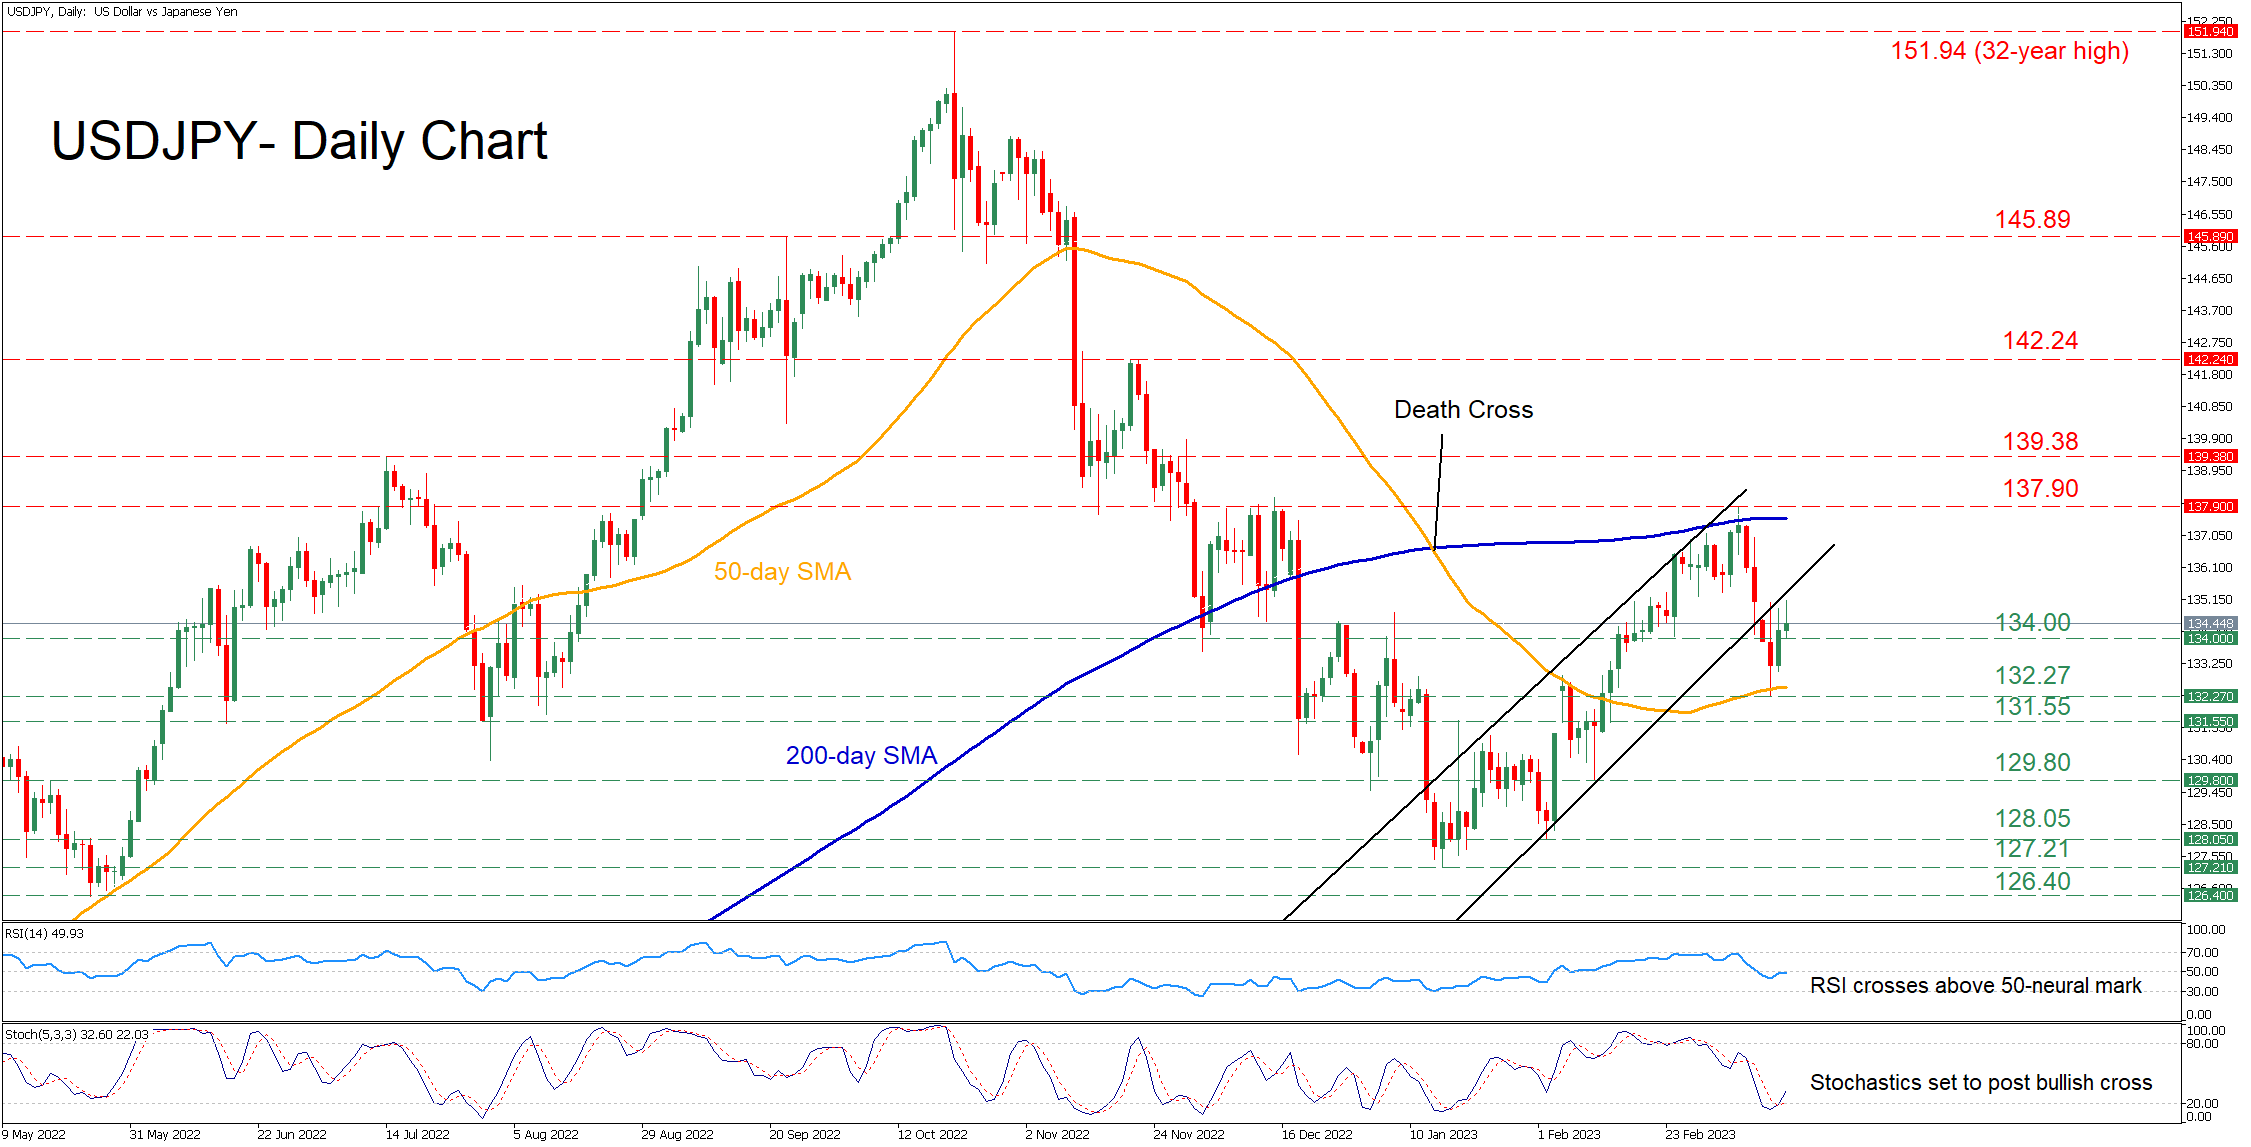
USDJPY has been in a massive downtrend after peaking at the 32-year high of 151.94 in October. Even though the pair exhibited some signs of recovery, trading within an upward sloping channel in the short term, this bullish pattern was recently broken to the downside.
The momentum indicators currently suggest that the recent decline is slowly reversing as near-term risks are tilting to the upside. Specifically, the RSI has jumped above its 50-neutral mark, while the stochastic oscillator posted a bullish cross within the 20-oversold zone.
If the upside tendency persists and the price re-enters into its bullish setup, initial resistance could be encountered at the recent resistance of 137.90, which lies close to the 200-day simple moving average (SMA). Piercing through that zone, the price could ascend towards 139.38 or higher to test the November peak of 142.24. Should the latter barrier fail, further advances could cease at the 145.89 hurdle.
Alternatively, bearish actions might send the price to test the recent support of 134.00. Sliding beneath that floor, the bears could aim for the March low of 132.27 before the spotlight turns to 131.55. A break below the latter could pave the way for the 129.80 obstacle.
Overall, USDJPY seems to be regaining some ground despite its recent weakness. Therefore, the pair could realize more gains in the case that it jumps back into its upward sloping channel.
IfW raises Germany’s growth forecast, but warns of subdued momentum
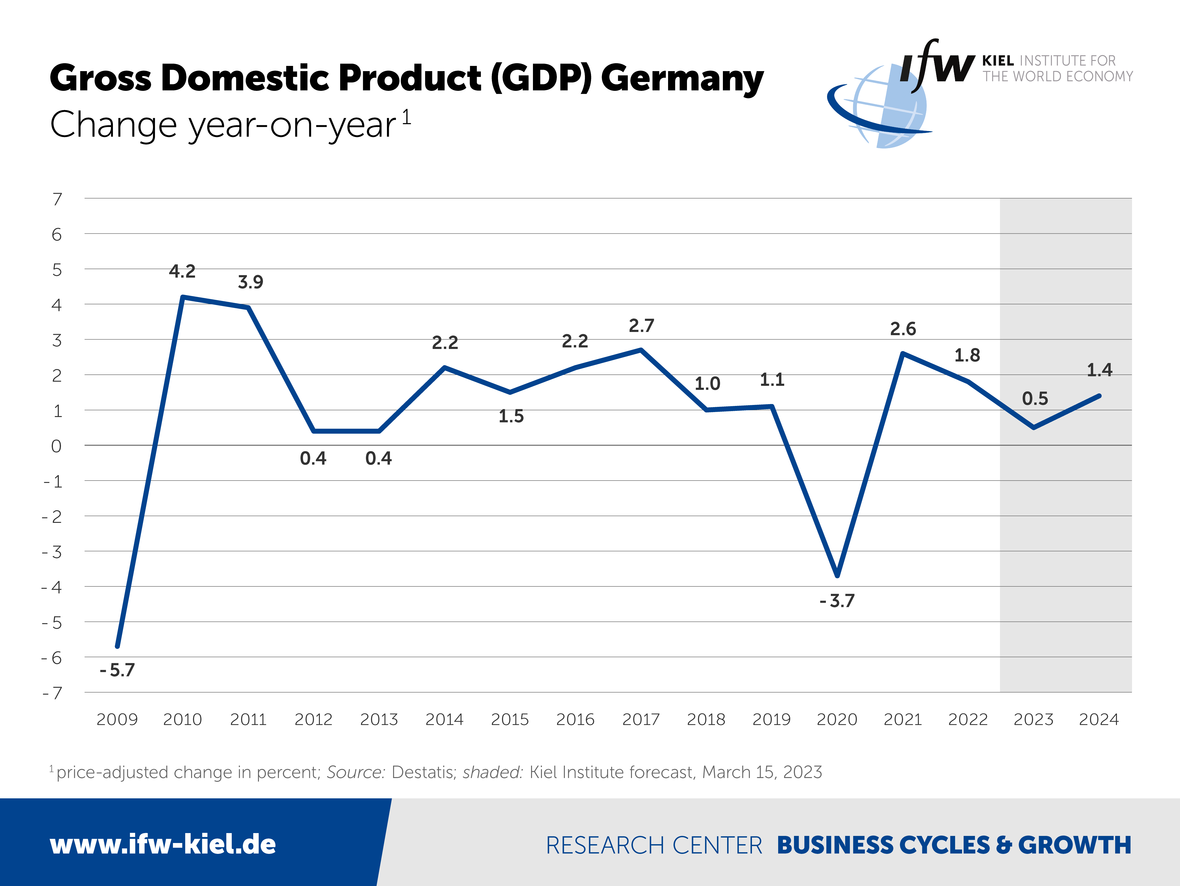
The German economy is expected to grow at a faster pace than previously predicted, according to forecasts by the IfW economic institute. The institute raised Germany's economic growth forecasts for 2023 from 0.3% to 0.5% and for 2024 from 1.3% to 1.4%. Meanwhile, inflation is forecast to slow from its current level of beyond 7% to 5.4% in 2023 and to around 2% in 2024.
For the Eurozone as a whole, GDP is projected to grow 1.1% in 2023 and 1.6% in 2024. Inflation is forecast to slow to 5.5% in 2023 and then to 2.6% in 2024.
Stefan Kooths, Vice President and Head of Economic Research at the Kiel Institute said, "The economic compass is pointing upwards again, but the momentum remains subdued.
"The recent sharp drop in gas prices is initially providing little stimulus to the economy in this country, it is primarily easing the burden on the government budget, which now must step in with fewer subsidies as part of the so-called energy price brakes.
"As a result, lower import prices are replacing the stimulus from state energy subsidies, which has a similar effect on the macro economy."
NZDUSD Exercises Caution Despite Bullish Breakout
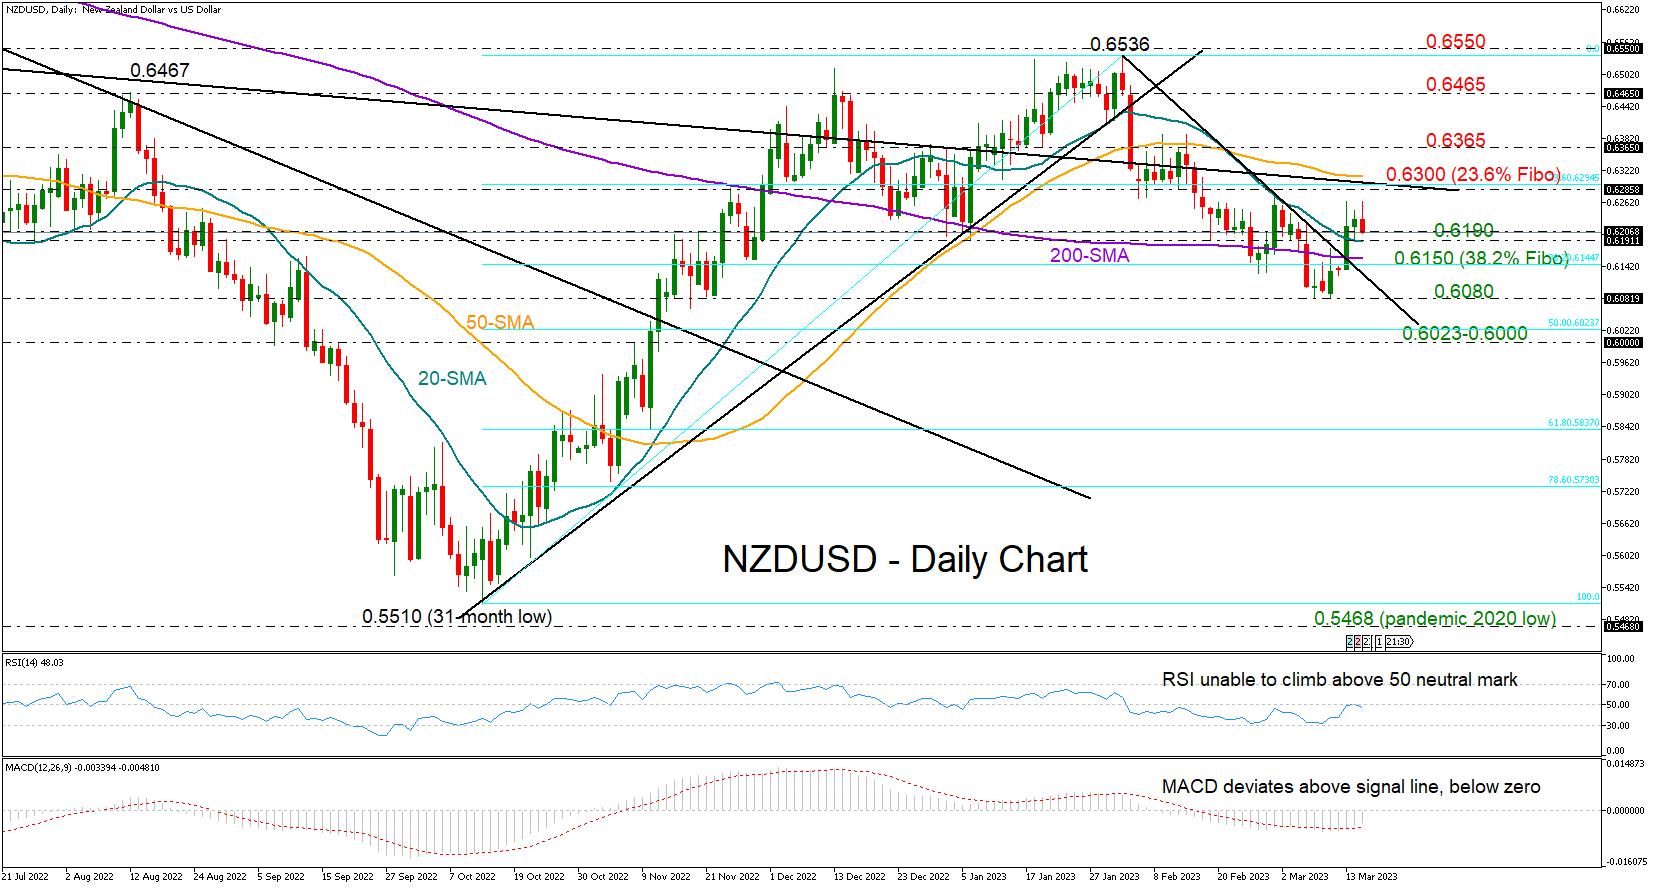
NZDUSD stalled immediately around 0.6230 following the clear break above the descending trendline that kept the bulls in control over the past month.
The pair has crawled above its 20- and 200-day simple moving averages (SMAs) too, raising optimism for a bullish trend reversal. That said, the negative trajectory from February’s eight-month high of 0.6536 is still in place as the price has yet to print a new higher high above the 0.6300 barrier. The 50-day SMA and the falling constraining line drawn from December 2020 reside in the same area, cementing that ceiling.
The technical signals are reflecting some caution as well. The RSI continues to hover below its 50 neutral mark, while the MACD remains within the negative zone despite both pivoting higher.
Hence, traders may wait for an extension above 0.6300, which overlaps with the 23.6% Fibonacci retracement of the 0.5510-0.6536 uptrend, before they target the next resistance area of 0.6365. A successful move higher could add more fuel to the rally, lifting the price towards the 0.6465 barricade and then up to the 0.6536-0.6550 bar.
If downside pressures persevere below 0.6190 and under the 20-day SMA, the door will open for the 200-day SMA and the 38.2% Fibonacci of 0.6150. Another failure here would shift the spotlight to the previous low of 0.6083, a break of which could initiate a quick drop to the 50% Fibonacci of 0.6023 and the 0.6000 round-level.
In brief, NZDUSD has not achieved a bullish bias yet, although it has almost recouped last week’s losses. A decisive close above 0.6300 could be a prerequisite to boosting buying sentiment.
FTSE 100 Bounces Off Critical Floor
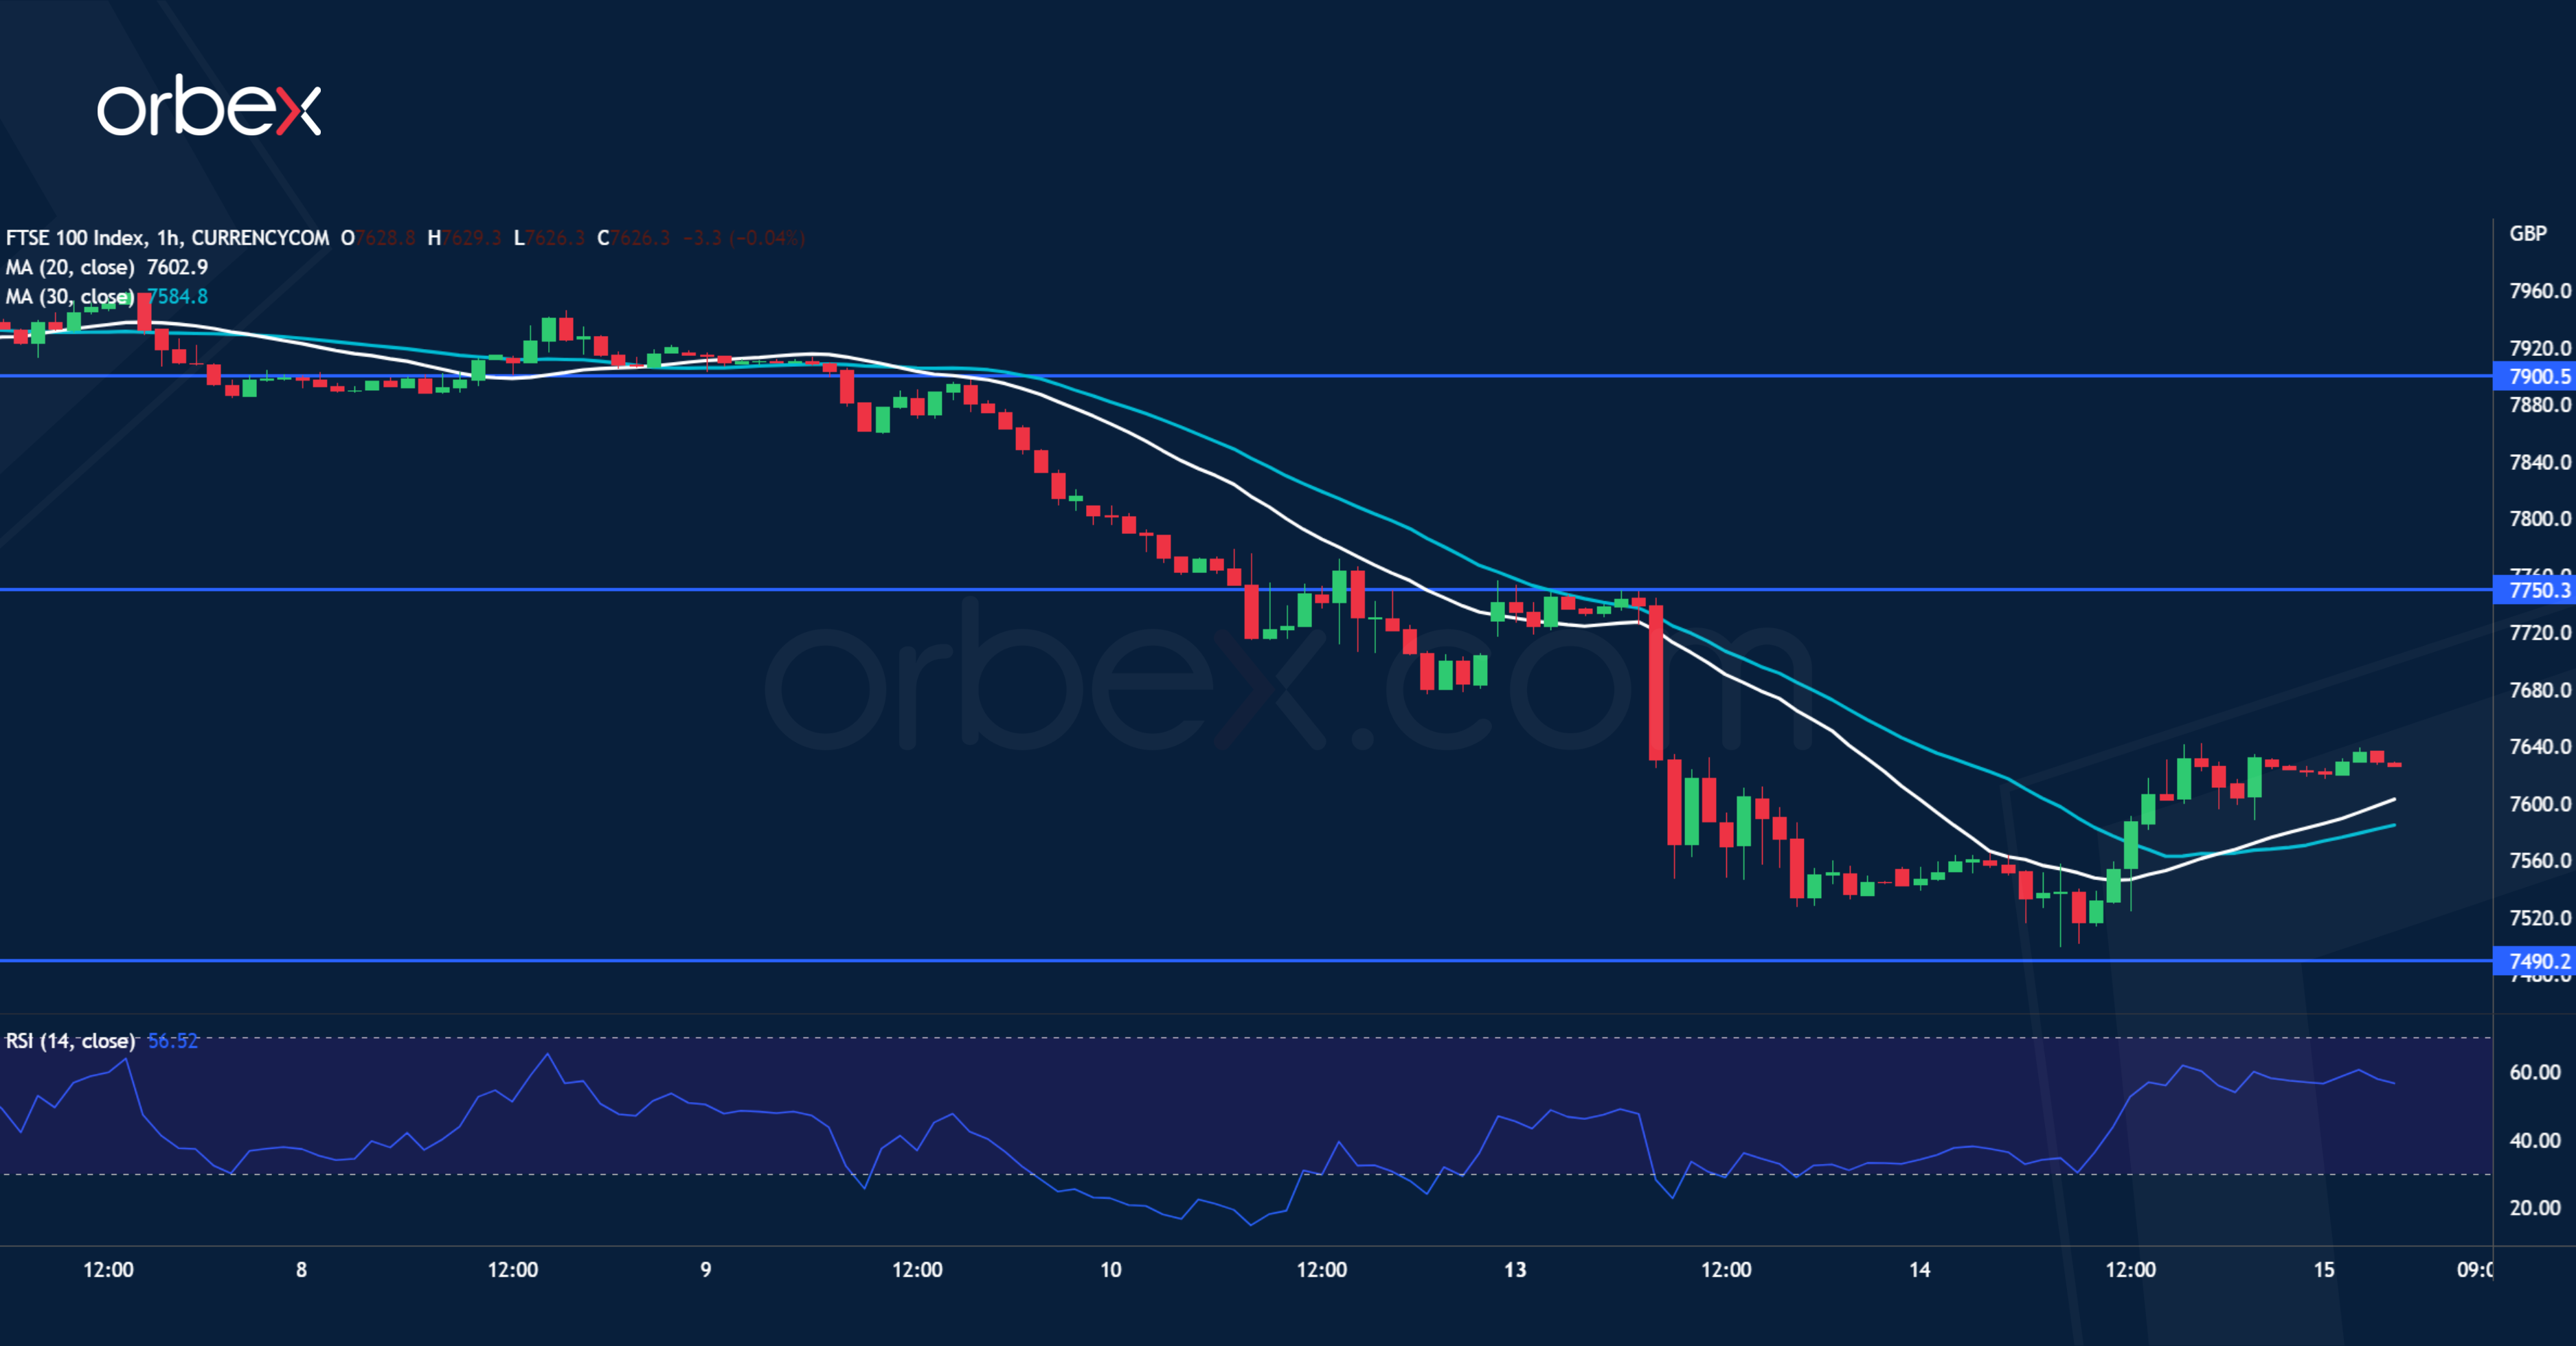
Equities bounce back as traders trim their bets of aggressive tightening by central banks. The FTSE 100 has tumbled to the base of a breakout rally in early January near 7490. This is a critical level to maintain the upward trajectory in the medium-term after the index gave up two months of gains. An oversold RSI on the daily chart may attract some bargain hunters in this demand zone and short-covering would drive the bid up. 7750 is the first obstacle to lift and only a close back above 7900 would turn sentiment around.
XAU/USD Grinds Supply Aarea
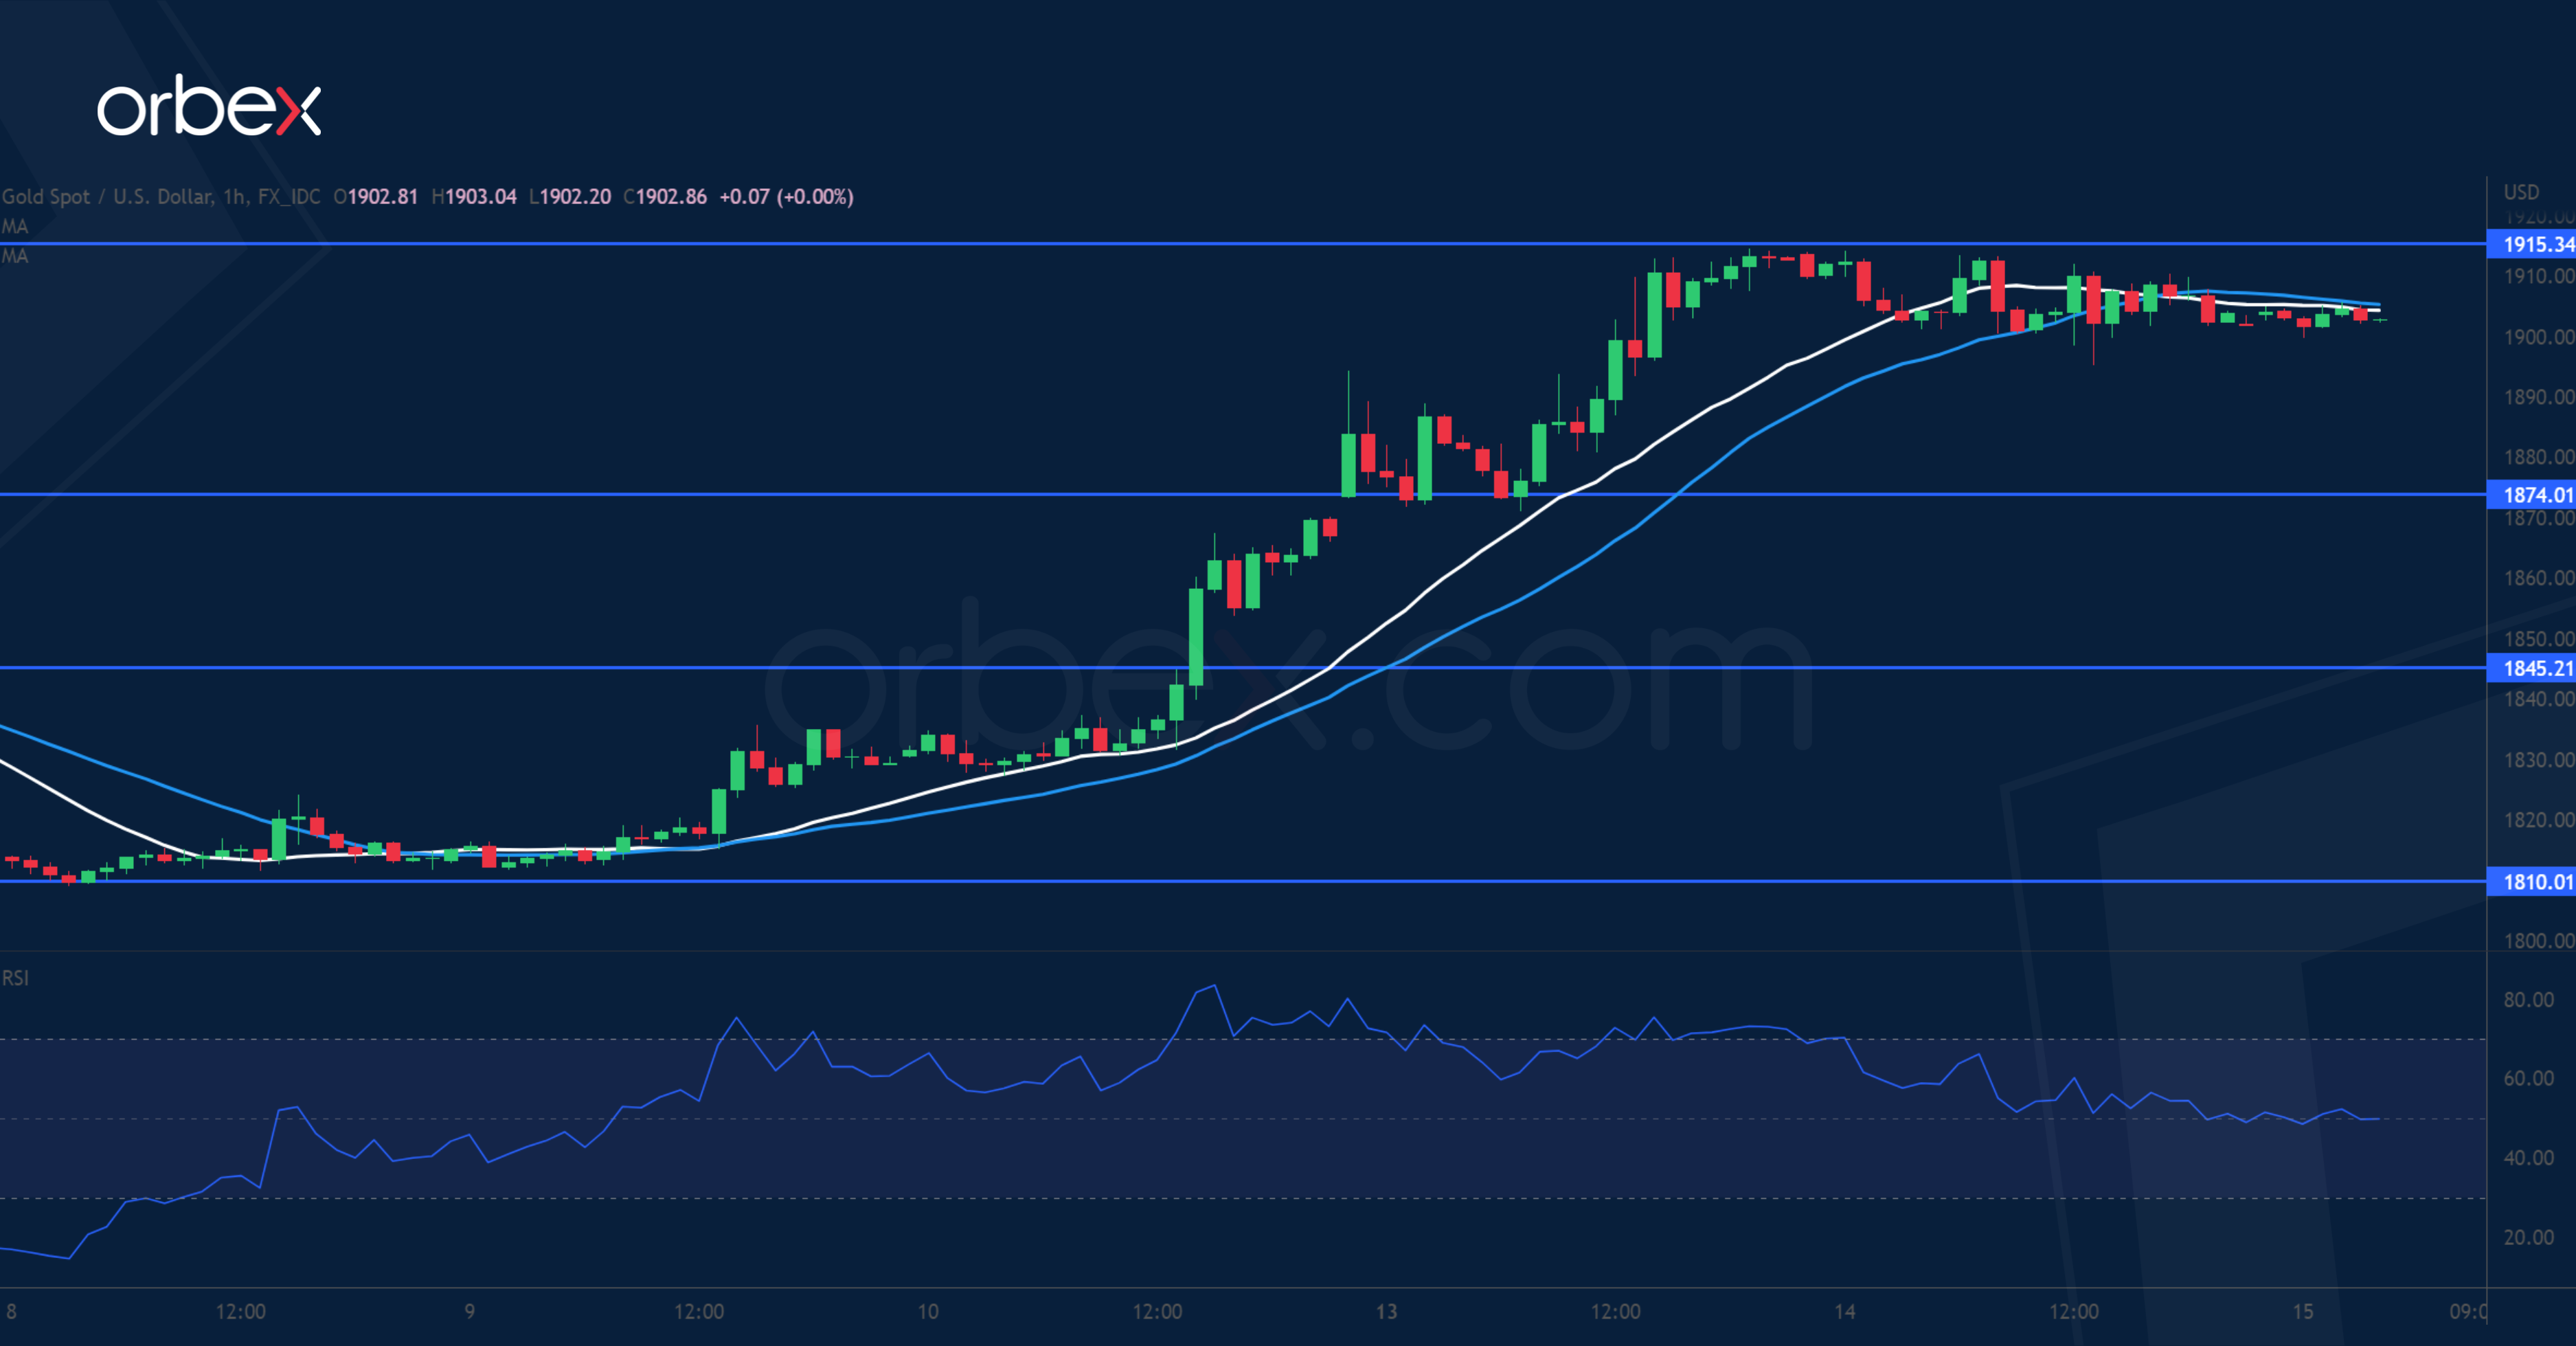
Gold keeps the high ground as the US dollar remains under pressure across the board. On the daily chart, solid bullish candles have sent the price to the supply area around 1915 at the start of the February sell-off. As the RSI comes off the overbought zone the bulls could use some breathing room before they would push even higher. 1874 is the immediate support to gauge the strength of follow-up bids. Further down, 1845 near the moving averages sits at the origin of the bullish breakout, making it an important support.