Sample Category Title
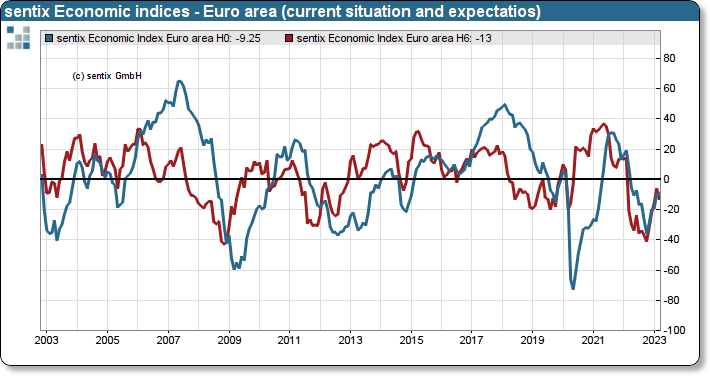
Eurozone Sentix dropped to -11.3, stagnation could turn into renewed recession worries
Eurozone Sentix Investor Confidence index dropped from -8 to -11.1, much worst than expectation of an improvement to -5.6.
Current Situation index rose from -10.0 to -9.3, hitting the highest level since June 2022. But that means the economy is "currently in a stagnation phase at best".
Expectations index dropped notably from -6.0 to -13.0. "Over the next six months, investors expect the Eurozone economy to deteriorate."
Sentix added, "this stagnation phase could soon turn into renewed recession worries if the negative economic expectations materialise."
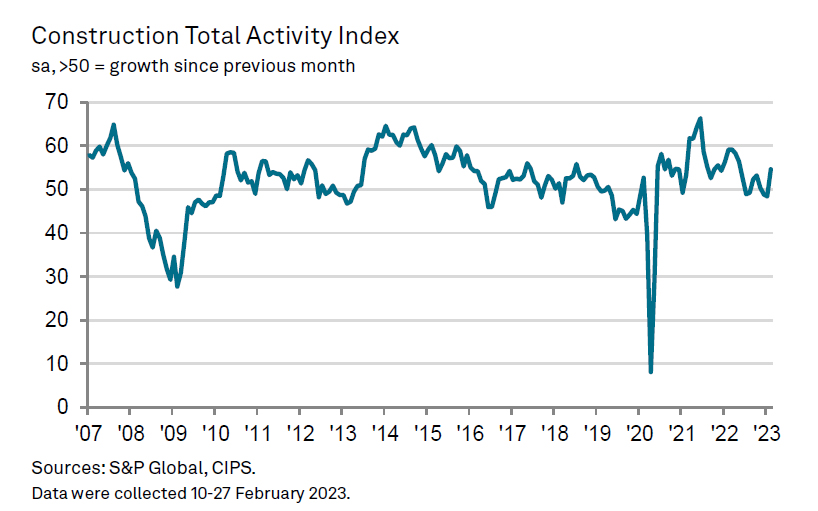
UK PMI construction rose to 54.6, returned to growth with increasing optimism
UK PMI Construction rose sharply from 48.4 to 54.6 in February, well above expectation of 48.5. It's also the first expansion reading in three months, and highest since May 2022. S&P Global also noted greater commercial work helped to offset drop in housing activity. Input cost inflation was the lowest since November 2020.
The construction sector returned to growth as commercial work and civil engineering output increased, offsetting a continued weakness in the housing market. Firms attributed the growth to improving global economic conditions and increased client confidence in the commercial segment. Construction companies are increasingly optimistic about the year ahead and expect business to expand, helped by softer inflationary pressures and fewer supplier delays.
EURUSD Faces Limited Bull Pressure Below 1.0700
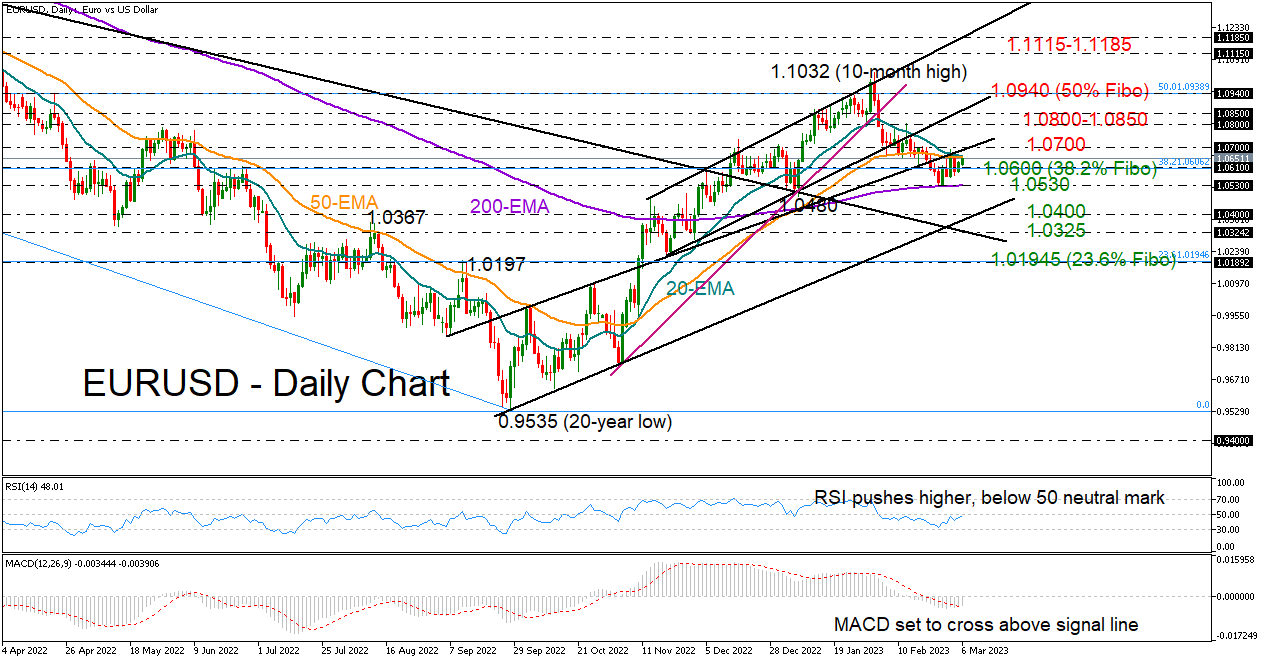
EURUSD started the week with minor gains, trading at the crossroads of the 20- and 50-day exponential moving averages (EMAs) at 1.0660, which have been navigating the price southwards over the past month.
Previously, the pair refused to close below January’s low and the 200-day EMA, reducing the risk of a worsening outlook in the medium-term picture. Technically, there might be more push for improvement in the coming sessions as the RSI is strengthening its uptrend in the bearish area, while the MACD is set to climb above its red signal line, reflecting persisting buying interest.
Yet only a sustainable move above the 1.0700 mark could boost buying confidence, sending the price towards the 1.0800-1.0850 resistance region. If the bulls continue higher from here, the 50% Fibonacci retracement of the 1.2348-0.9535 downleg could add some downside pressure around 1.0940, delaying an extension towards the 1.1115-1.1185 area.
Alternatively, a close below 1.0600 could bring the 200-day EMA back on the radar at 1.0530. In case that floor cracks this time, the price could plummet towards the support trendline from September at 1.0400, while a more aggressive decline could re-challenge the constraining line from May 2021 seen at 1.0325.
In a nutshell, EURUSD is showing some encouraging signs of stability after its downtrend paused at 1.0530. Despite that, traders may stay on the sidelines until the price breaks decisively above the 1.0700 number.
AUD/USD Pair Gained Pace above 0.6740 to Move into a Positive Zone
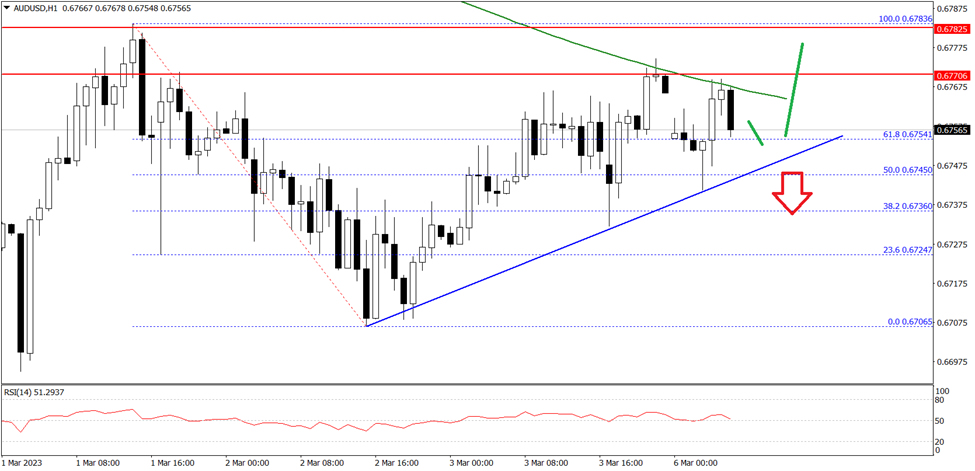
The Aussie Dollar started a fresh increase above the 0.6720 resistance against the US Dollar. The AUD/USD pair gained pace above 0.6740 to move into a positive zone.
The pair even climbed above the 0.6750, but the bears seem to be active near the 0.6765 zone. The pair is now consolidating below the 0.6765 zone and the 50 hourly simple moving average. The next major resistance is near the 0.6780 level.
If there is an upside break above the 0.6780 zone, the pair could rise steadily towards the 0.6840 level in the near term. The next major resistance sits near 0.6880 on FXOpen.
An immediate support is near the 0.6750 level. The next key support is near the 0.6720 level. A downside break below the 0.6720 support could lead the pair towards the 0.6660 support.
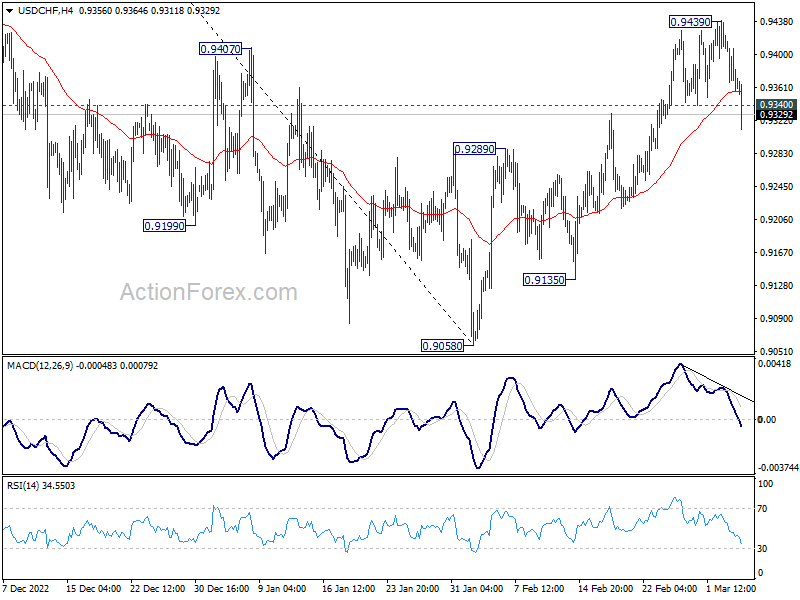
Swiss Franc rises as CPI reinforces 50bps SNB hike, USD/CHF and EUR/CHF dive
Swiss Franc saw a surge after the release of the latest CPI data for February, which showed that inflation had accelerated beyond market expectations. The CPI remained above SNB's target range of 0-2%, coming in at 3.4% yoy. This should reinforce the case for the SNB to maintain its tightening pace and raise interest rates by 50bps to 1.50% on March 23. While some analysts expect a slowdown to 25bps in June, SNB may continue to tighten at the current speed if inflation remains high.
USD/CHF's break of 0.9340 support now suggests that corrective rebound from 0.9058 has completed at 0.9439 already, ahead of 38.2% retracement of 1.0146 to 0.9058 at 0.9474. Deeper decline would be seen to 0.9289 resistance turned support first. Decisive break there will bring retest of 0.9058 low.
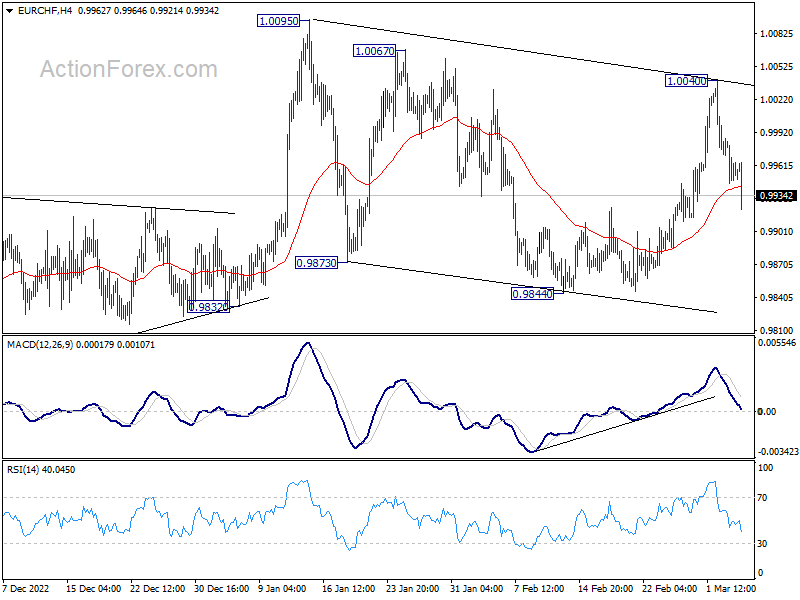
EUR/CHF's strong break of 4 hour 55 EMA now suggests that rebound from 0.9844 has completed. The corrective pattern from 1.0095 is now extending with another falling leg back towards 0.9844 support.
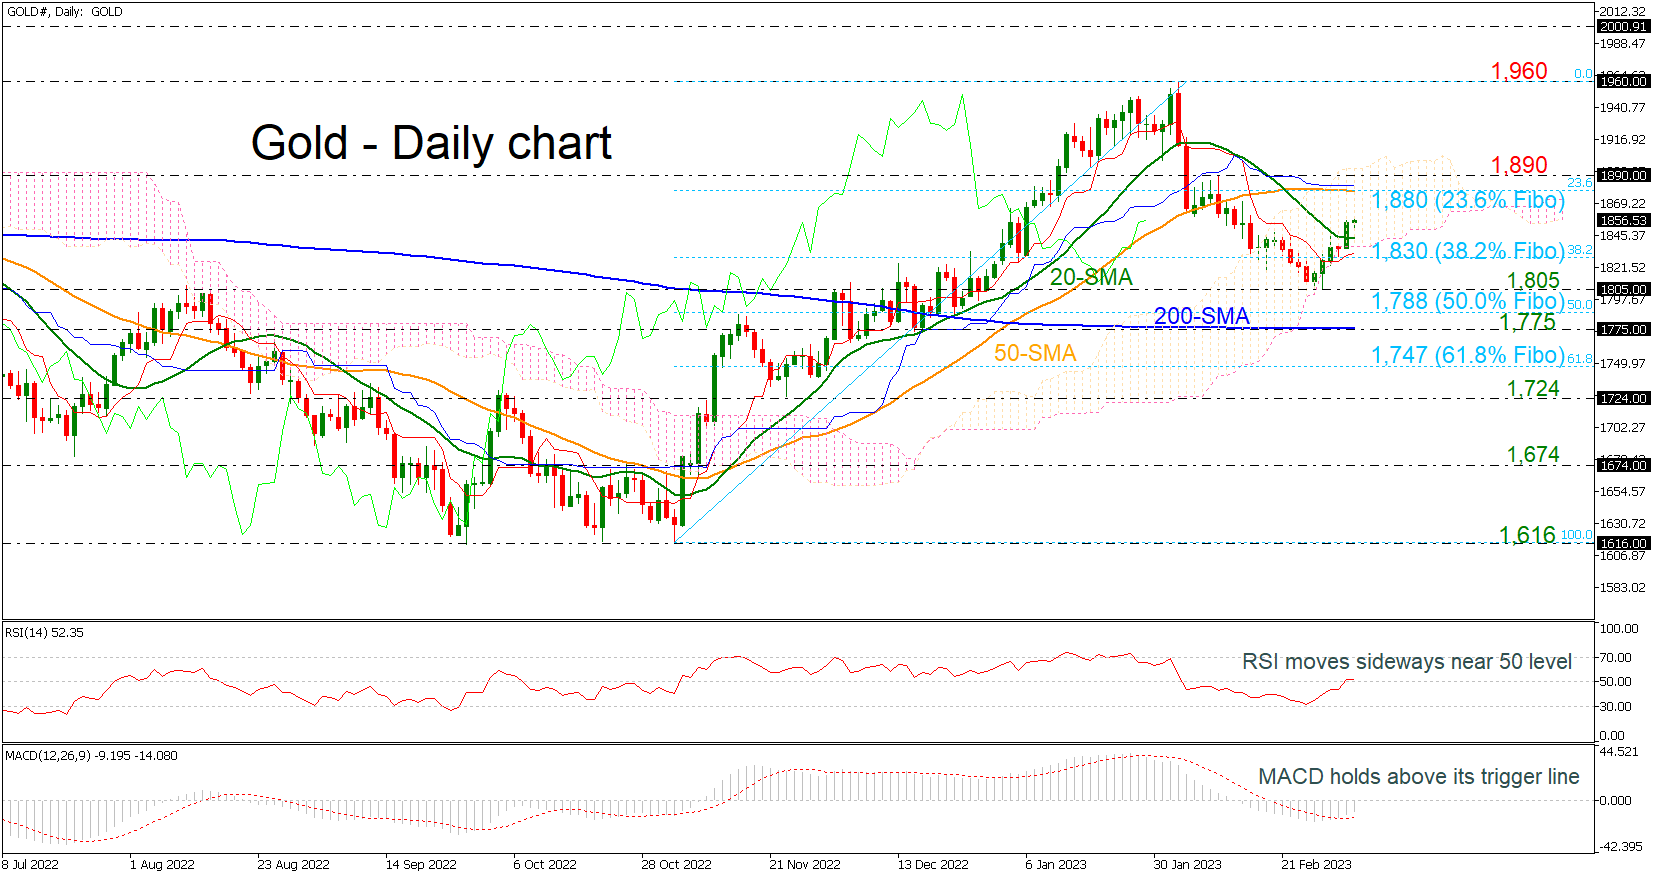
Gold Adds 3% After Bounce Off 1,805
Gold prices added more than 3% after the bounce off the 1,805 support level, moving within the Ichimoku cloud. The RSI is flattening above the neutral threshold of 50, while the MACD is jumping above its trigger line in the negative region. Also, the 200-day simple moving average (SMA) is moving sideways, suggesting a neutral bias in the medium-term.
If the market continues to move north, then the price may flirt with the 23.6% Fibonacci retracement level of the upward wave from 1,616 to 1,960 at 1,880, which overlaps with the 50-day SMA. More gains could lead the price until the 1,890 resistance and the previous peak of 1,960, registered on February 2.
However, if the bears take control, the yellow metal could drive towards the 38.2% Fibonacci at 1,830 before meeting 1,805 again. Below these lines, the 50.0% Fibonacci of 1,788 and the 200-day SMA at 1,775 may pause the decline towards the 61.8% Fibonacci of 1,747.
All in all, gold is trying to recoup some losses, but the price needs to overcome the 50-day SMA to post more positive movements.
XAU/USD: Actionary Waves of the Double Zigzag Can Tend to Equality
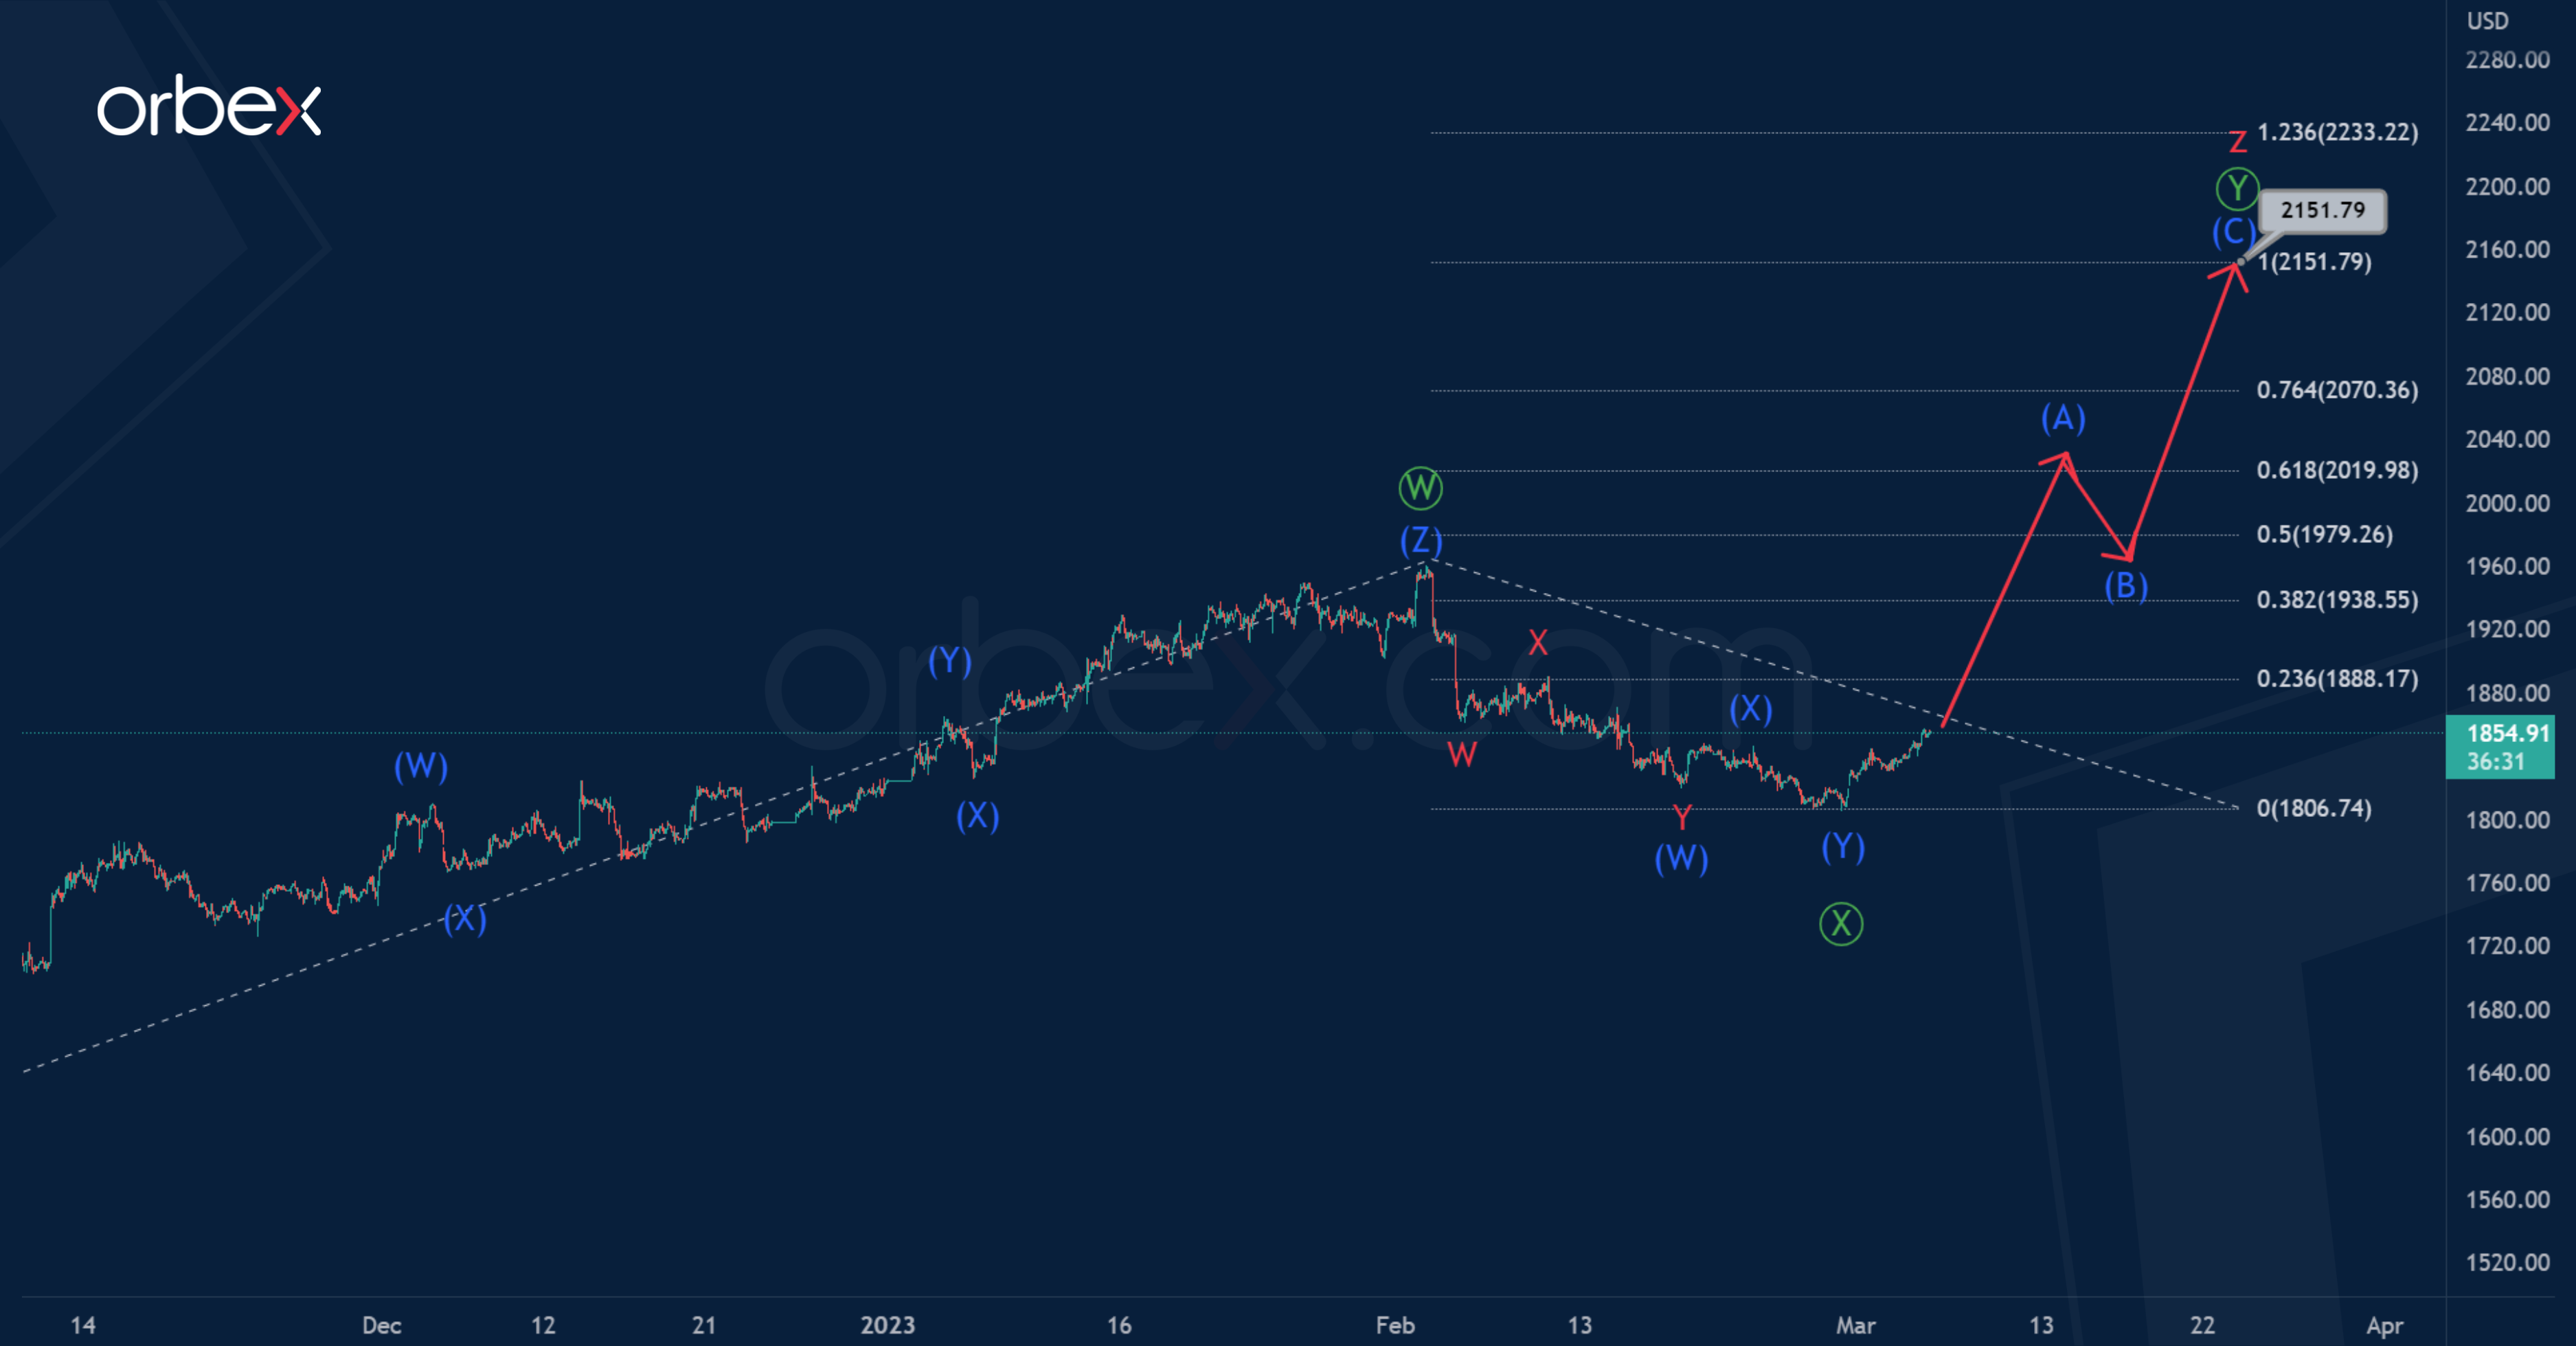
XAUUSD: Actionary Waves Of The Double ZigZag Can Tend To Equality In the long term, XAUUSD can form a double zigzag pattern, which consists of three main sub-waves inside the cycle wave z.
Apparently, the first two sub-waves have already been formed, and the third sub- wave is under development.
Perhaps the wave takes the form of an intermediate zigzag (A)-(B)-(C).
The end of the potential zigzag is expected to reach the 2151.79 area. At that level, primary wave will be equal to actionary wave.
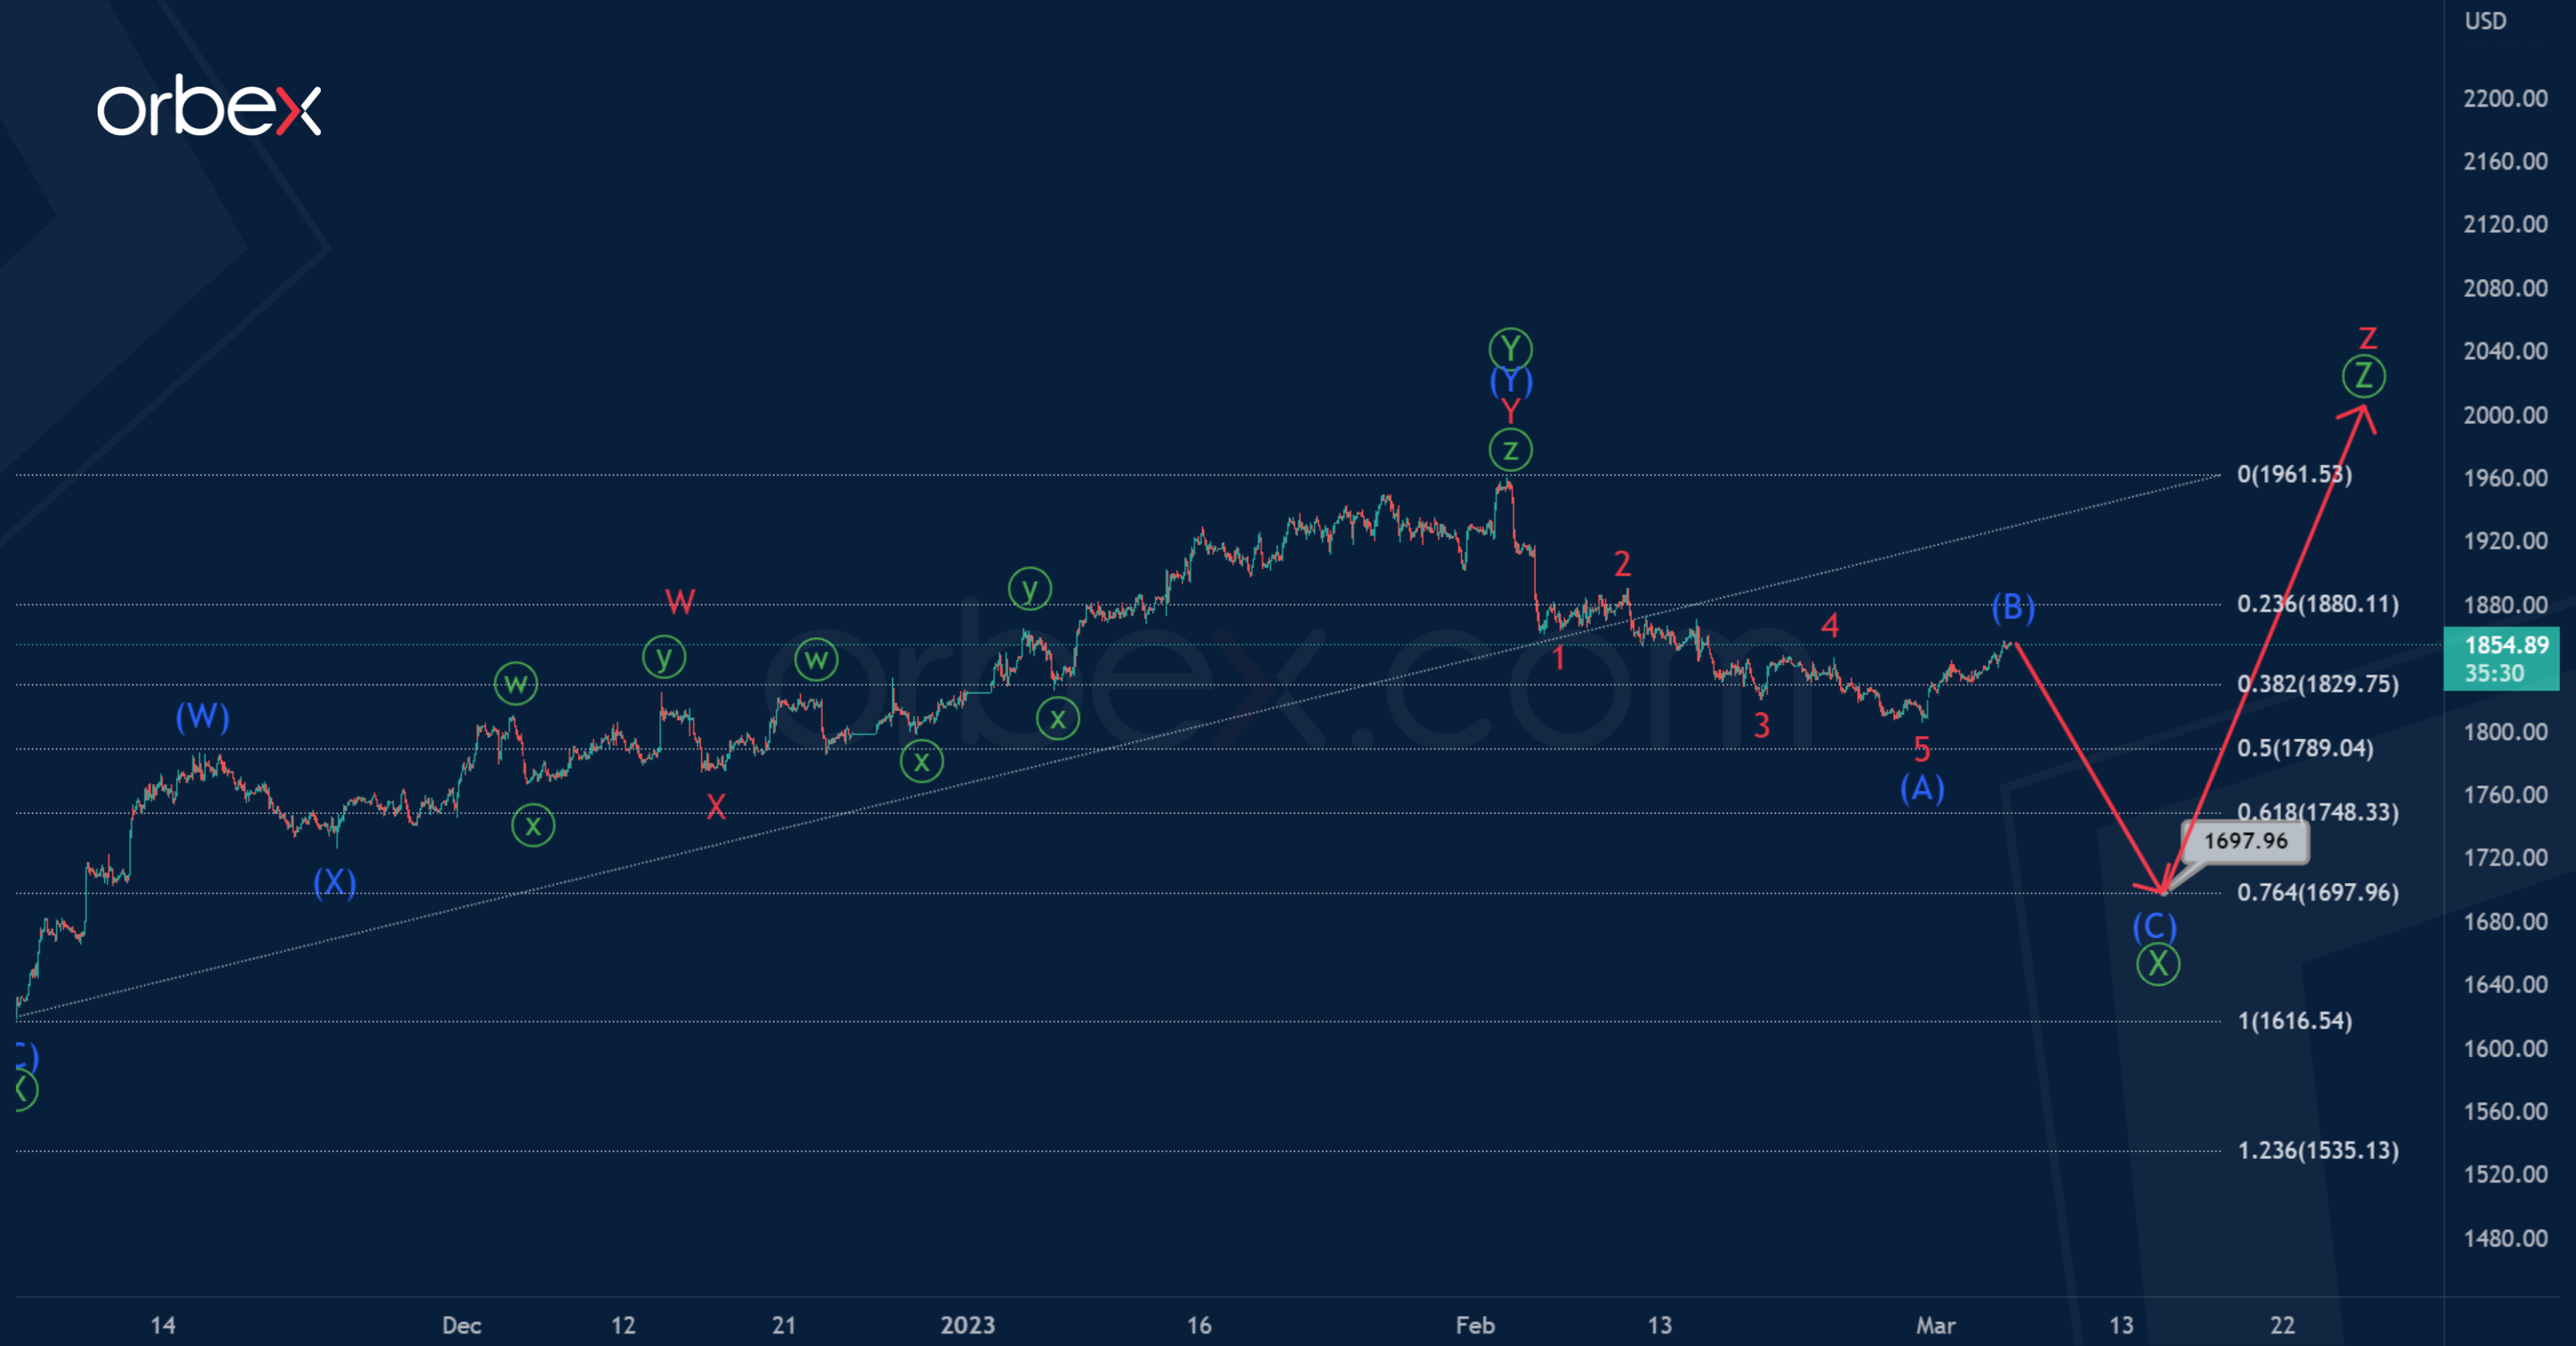
In the second variant, the primary actionary wave could be fully completed, it is a double zigzag (W)-(X)-(Y), but the entire cycle wave z can take a more complex form of a triple zigzag.
Thus, in the near future, the price may move down, forming a primary intervening wave, which is similar to an intermediate zigzag (A)-(B)-(C).
Probably, we will observe the end of the wave near 1697.96. At that level, it will be at 76.4% of wave.
DAX 40 Breaks Resistance
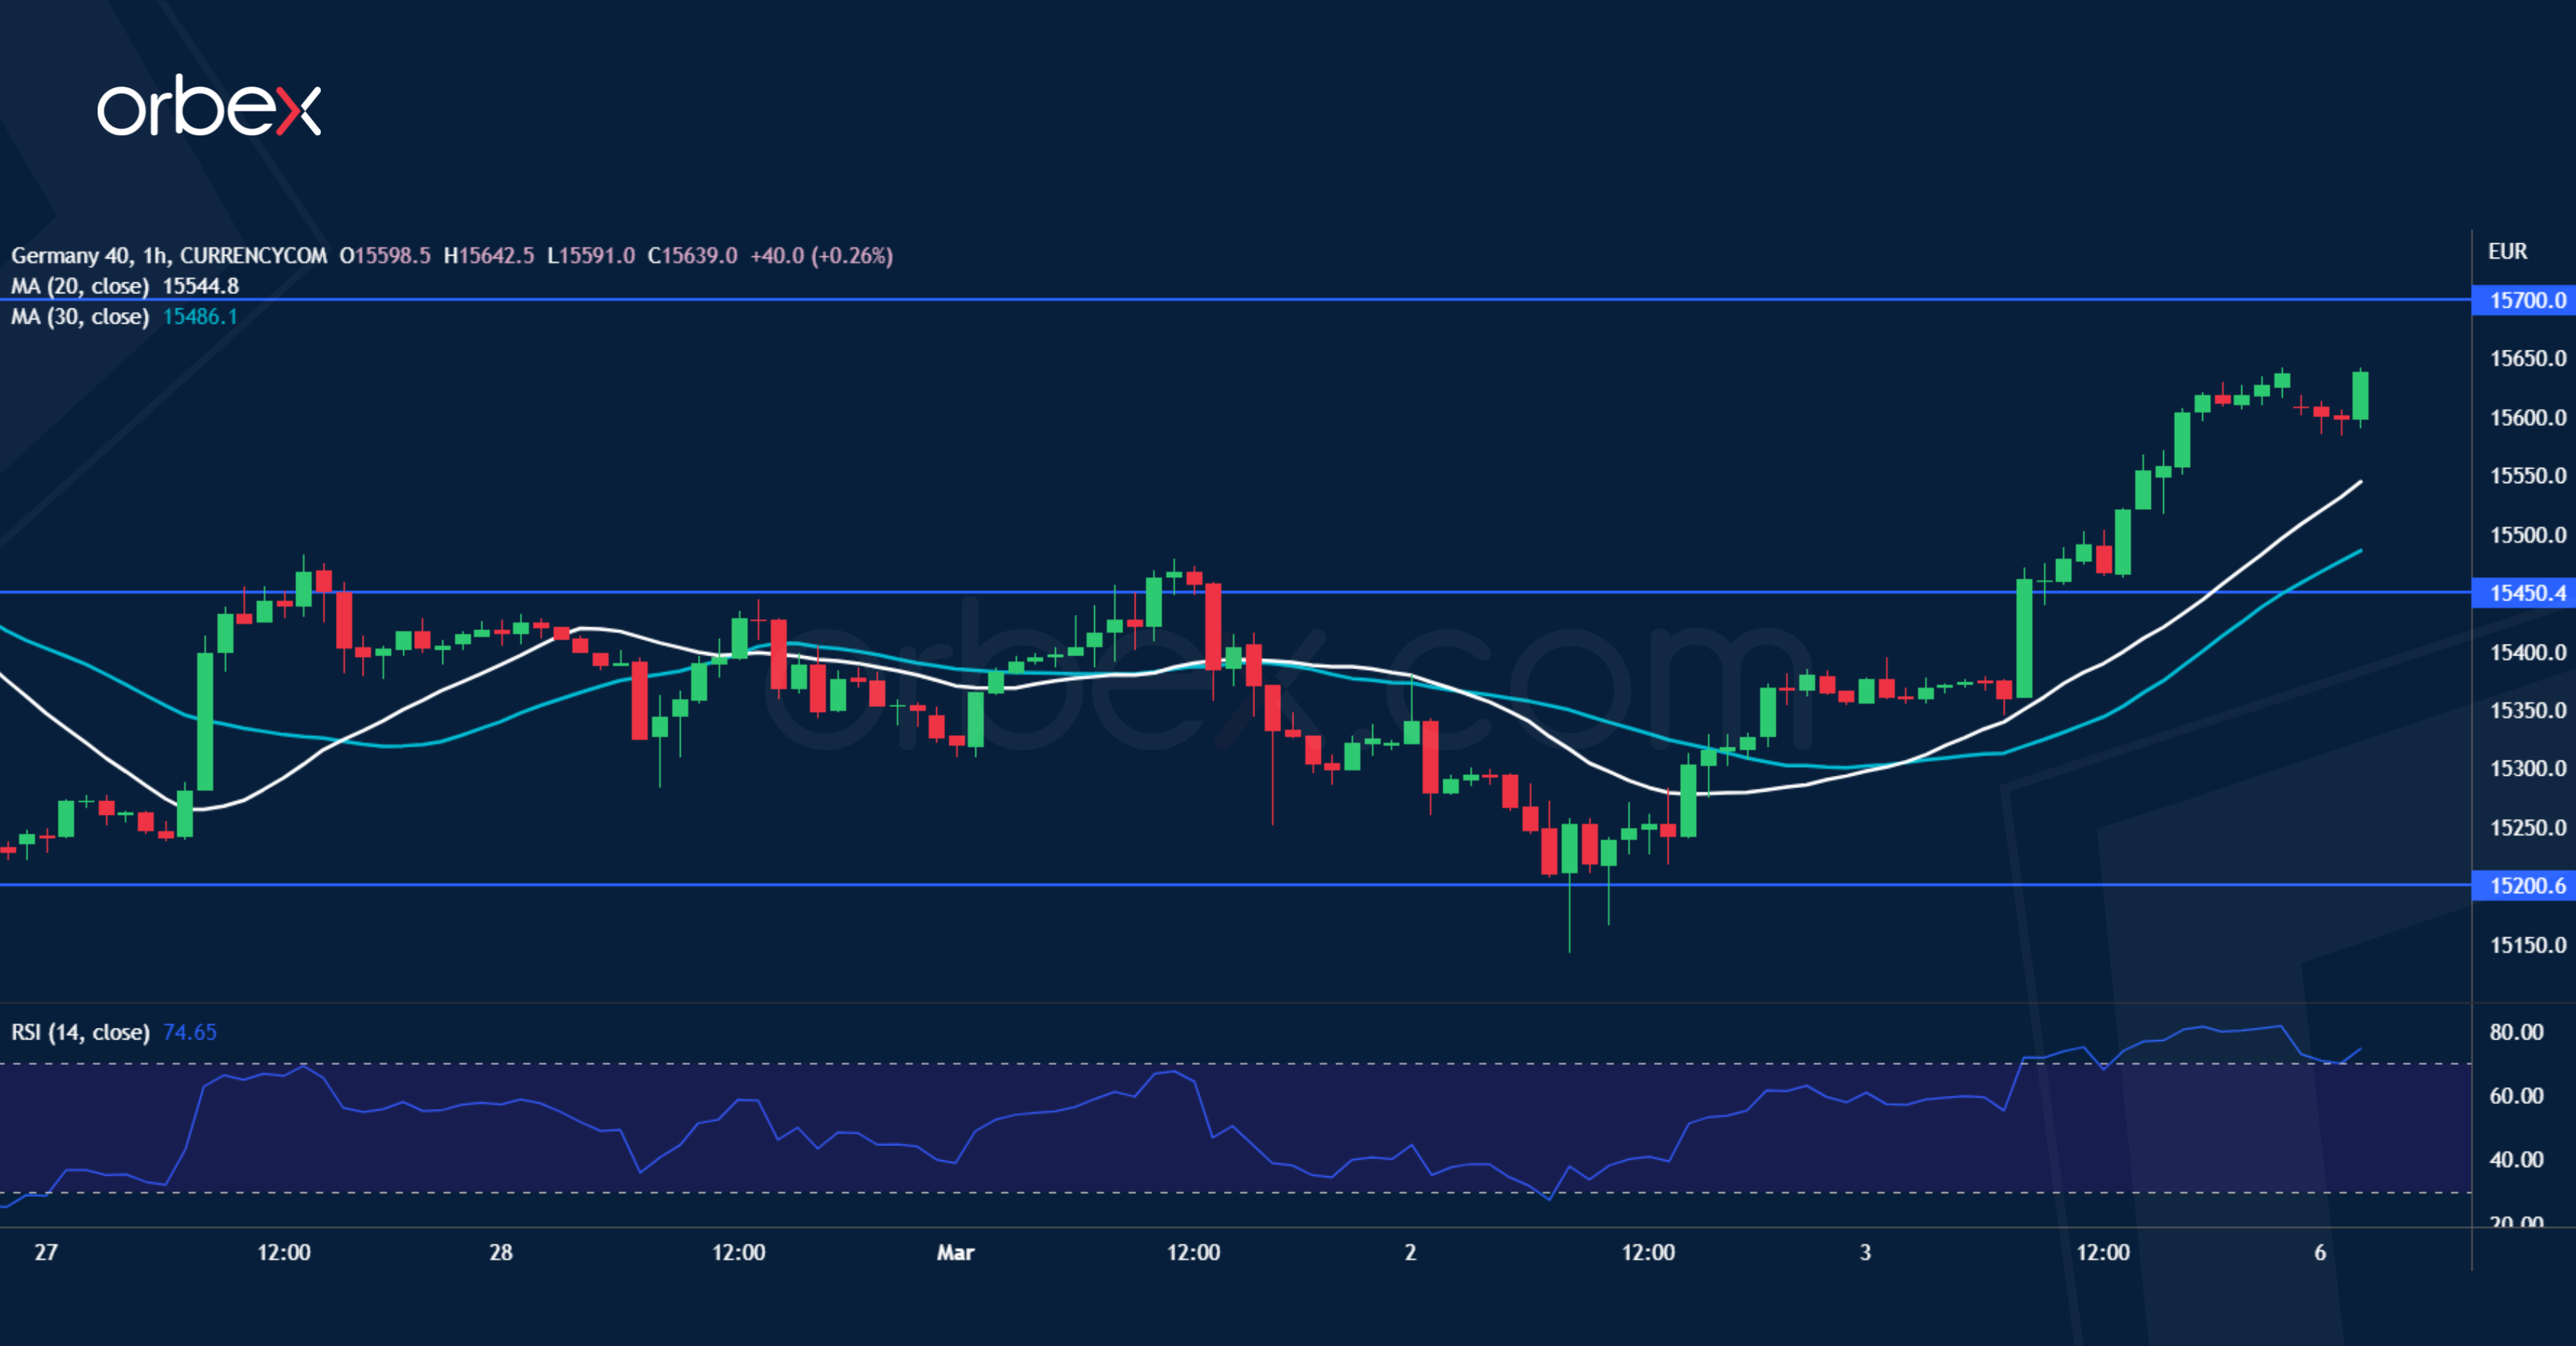
Equities surged as US Treasury yields eased amid improved risk sentiment. Despite its choppy path lately, the Dax 40 remains up from the daily chart’s perspective. The top range (15200) of the late January consolidation has managed to contain multiple pullbacks, which suggests a strong bullish interest. A break above 15600 has thrown out the remaining bears and may open the door for an extended rally above the ceiling at 15650. 15450 is the closest support as the RSI shot into overbought territory.
XAG/USD Attempts to Bounce
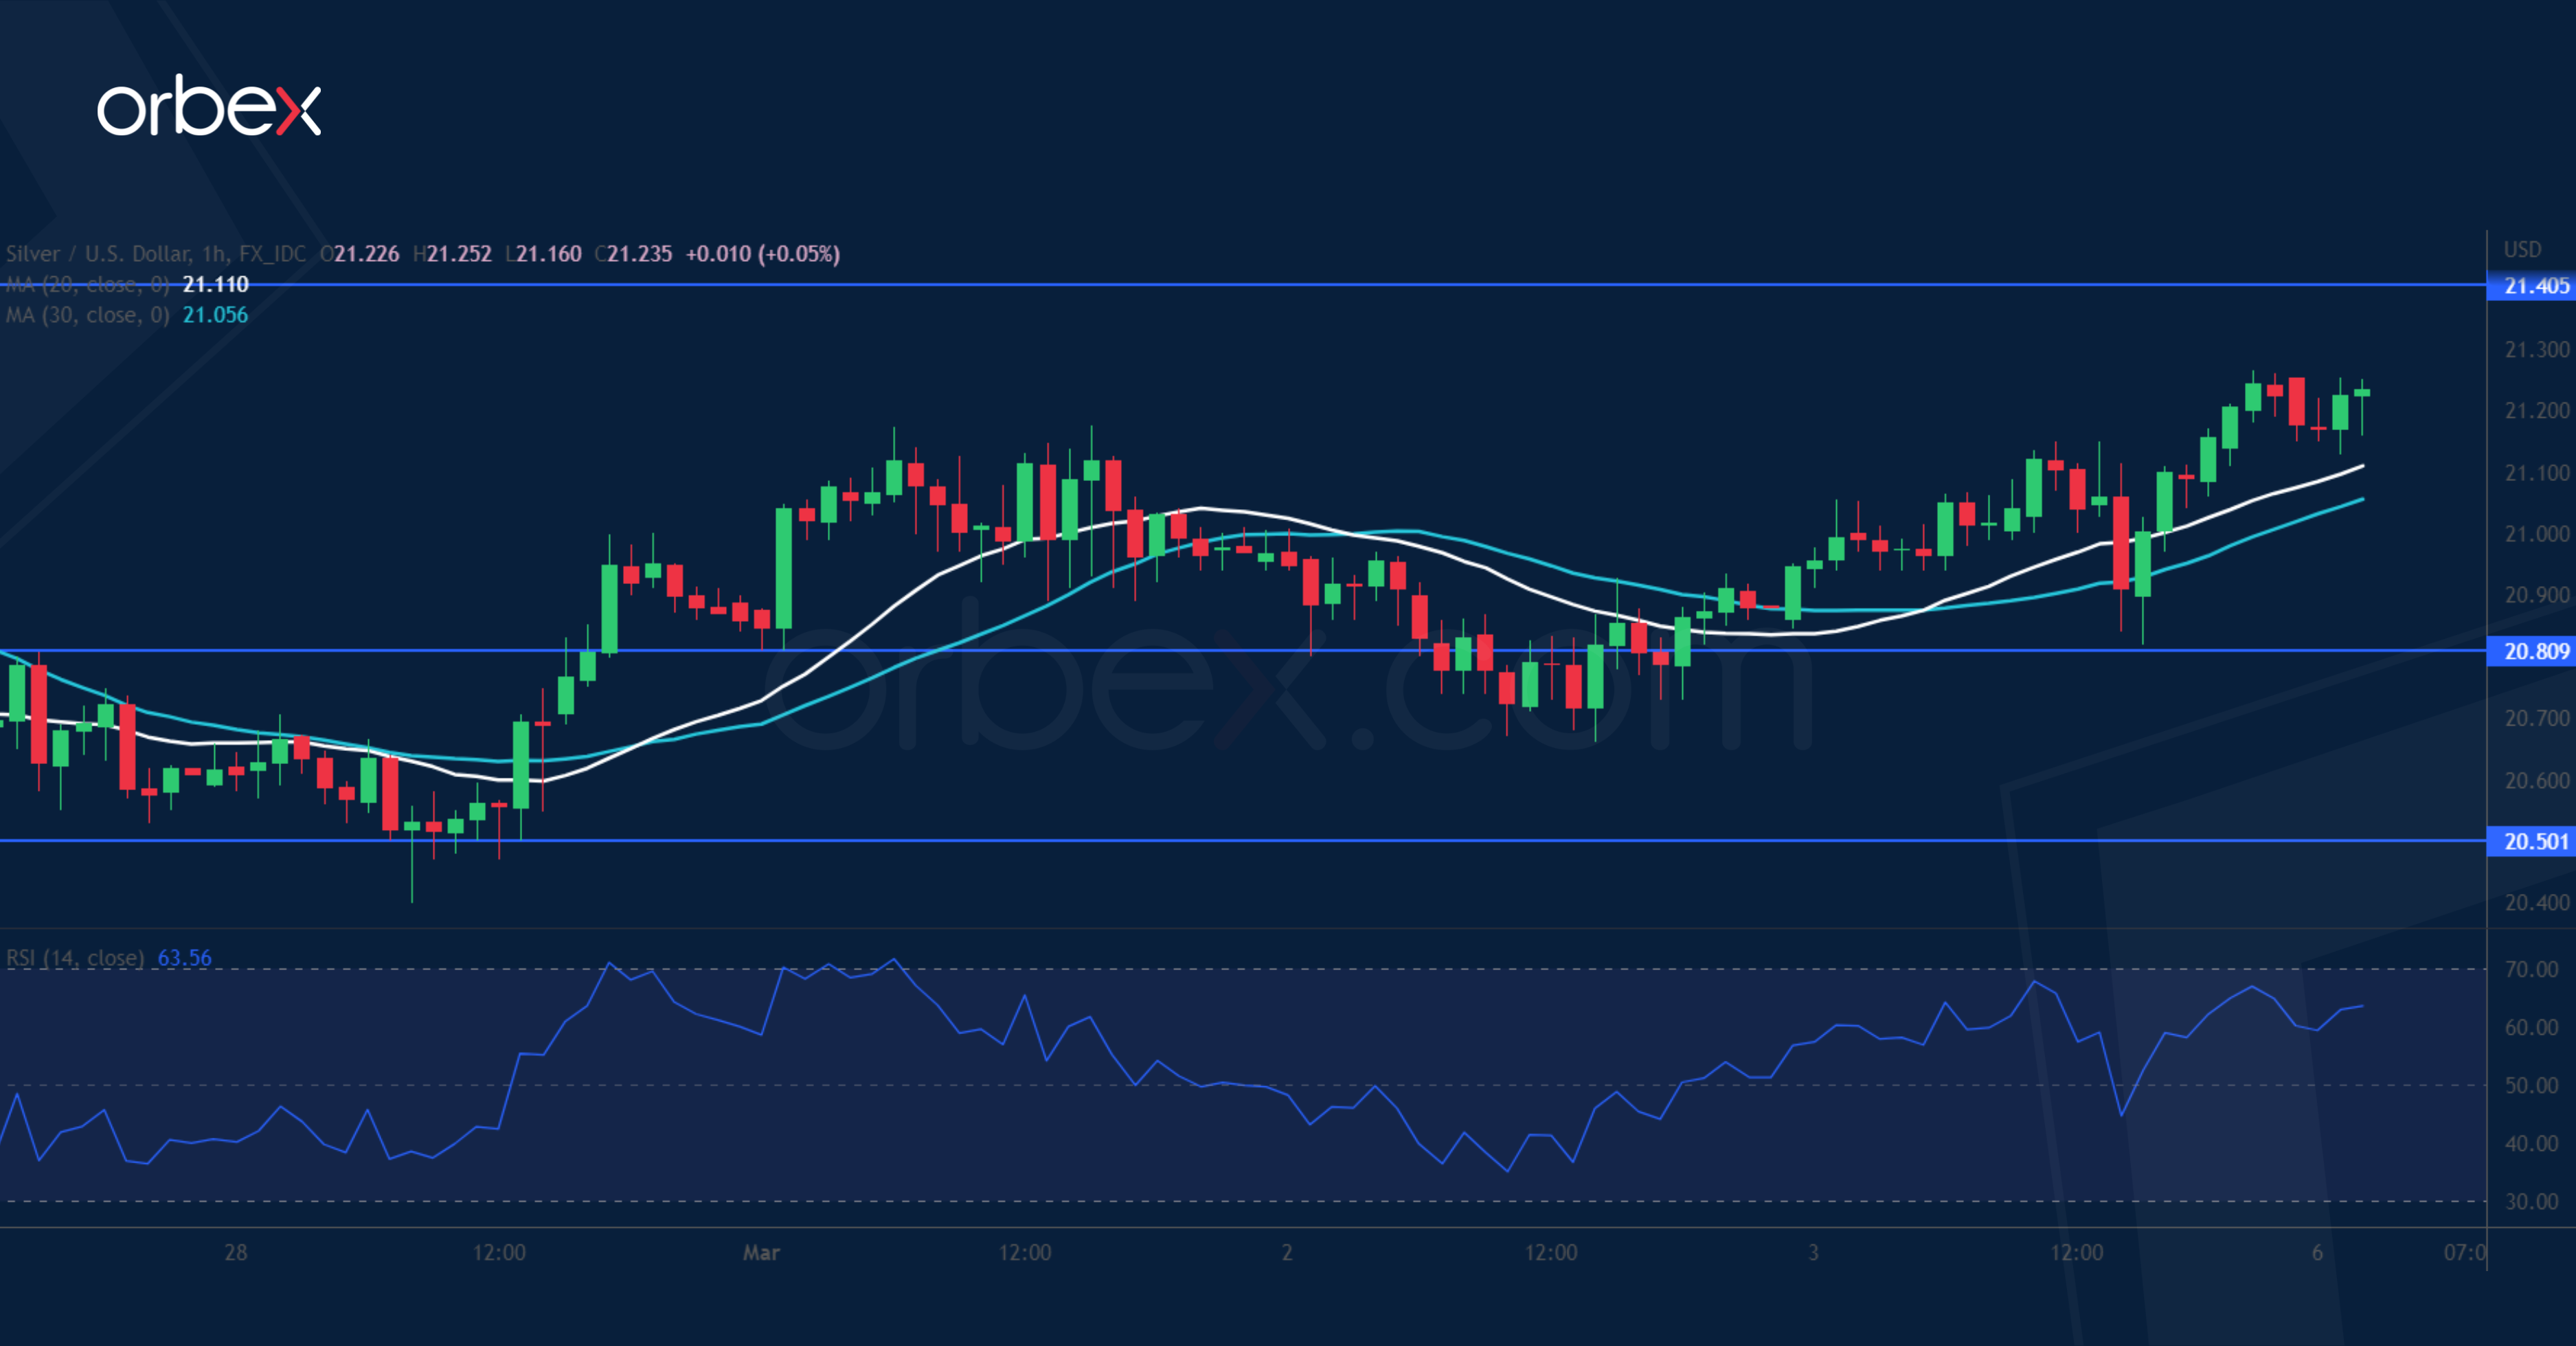
Silver makes its way back as the US dollar retreats across the board. Breaking the daily support of 20.60 from last November could keep the downward pressure on the precious metal. Though the RSI’s oversold condition on the daily chart may warrant a brief bounce as some sellers take their chips off the table. 20.80 is a fresh support and the support-turned-resistance at 21.40 is the first hurdle. Then 21.90 near the 30-day SMA could be a tough level to crack as downbeat sentiment may lead sellers to double down.
GBP/USD Defends Major Floor
The pound bounces higher thanks to upbeat services PMI in February. On the daily chart, the pair is still striving to hold above January’s low of 1.1840 which is a critical floor to keep the price afloat in the medium-term. A bearish breakout could trigger a sell-off towards 1.1600. The triple bottom at 1.1920 shows that the bulls are still eager to defend this major demand area and a pop above 1.2040 is an encouraging sign. A rally above the double top at 1.2140 would pave the way for a broader recovery.