Sample Category Title
EUR/USD Bears Remain Active Below 1.0700
Key Highlights
- EUR/USD extended its decline and tested the 1.0535 zone.
- It cleared a key bearish trend line with resistance near 1.0595 on the 4-hours chart.
- GBP/USD found support near 1.1940 and is currently consolidating losses.
- Gold price started a fresh increase above the $1,830 resistance zone.
EUR/USD Technical Analysis
The Euro found support near the 1.0535 zone against the US Dollar. EUR/USD remained bid and recently started an upside correction above 1.0580.
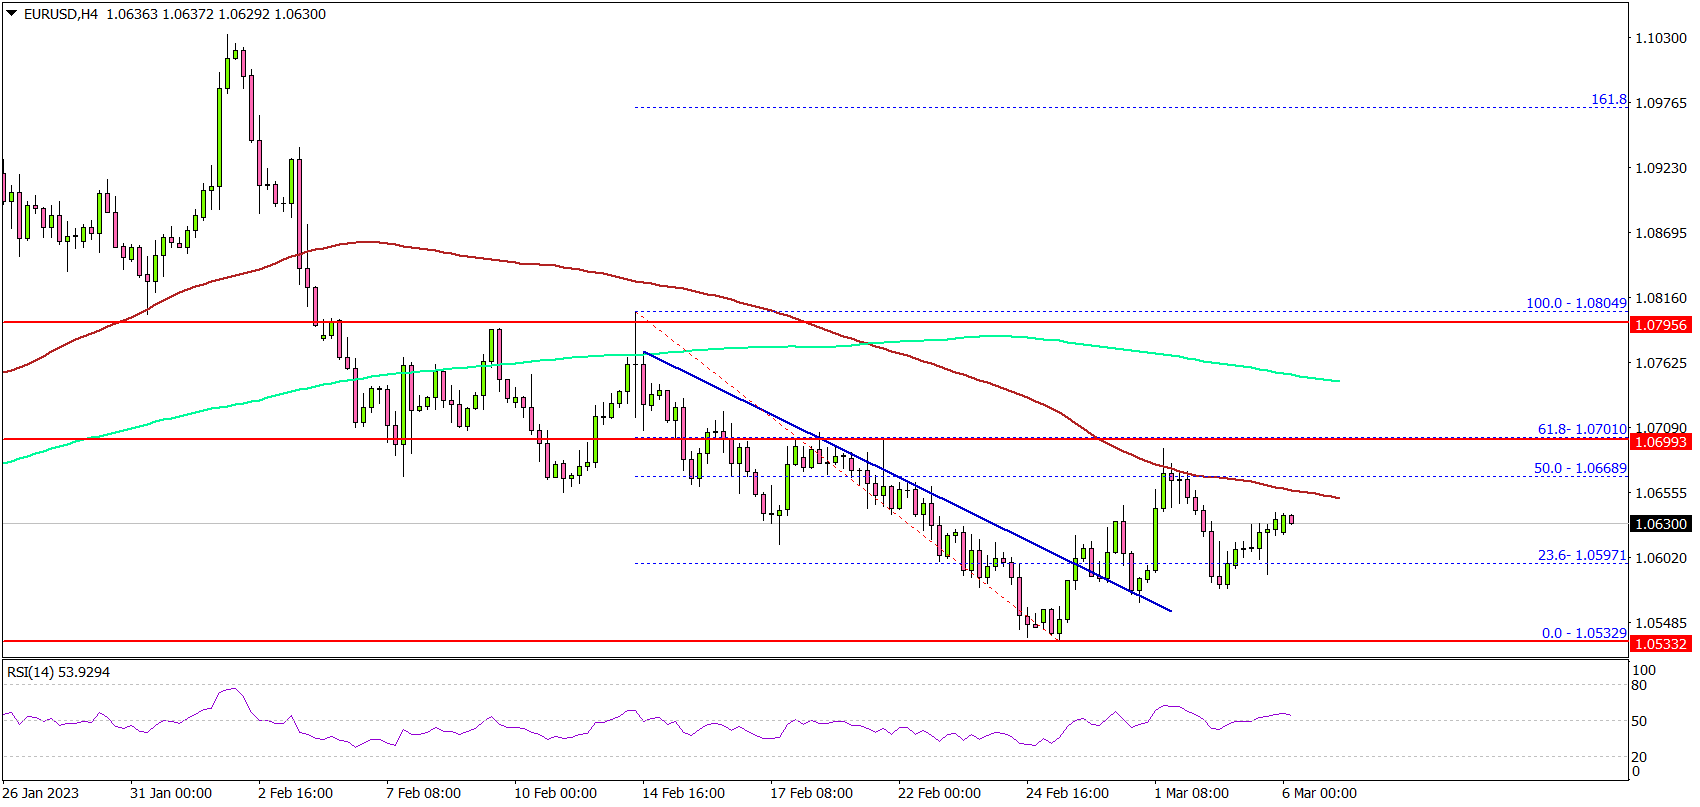
Looking at the 4-hours chart, the pair started an upside correction above the 1.0600. There was a break above a key bearish trend line with resistance near 1.0595 on the same chart.
There was a spike towards the 1.0665 resistance zone and the 100 simple moving average (red, 4-hours). The pair tested the 50% Fib retracement level of the downward move from the 1.0804 swing high to 1.0539 low.
On the upside, the pair is facing resistance near the 1.0655 zone. The next major resistance is near the 1.0750 level and the 200 simple moving average (green, 4-hours).
A clear move above the 1.0750 resistance might start a steady increase towards the 1.0800 zone. On the downside, an immediate support is near the 1.0600 level.
The next major support is near the 1.0550 level, below which there is a risk of a move towards the 1.0480 level. Any more losses could open the doors for a drop towards 1.0420.
Looking at gold price, the price started an upside correction and there was a clear move above the $1,830 resistance zone.
Economic Releases
- Euro Zone Retail Sales for Feb 2023 (YoY) - Forecast +1.9%, versus -2.8% previous.
- Euro Zone Retail Sales for Feb 2023 (MoM) - Forecast +1.0%, versus -2.7% previous.
- US Factory Orders for Jan 2023 (MoM) - Forecast 0%, versus +1.8% previous.
Platinum (PL) Ended Correction and Resumes Higher
In our last blog from December 2022, we wrote that Platinum is ready to rally in 2023 after a 3 waves pullback. Fast forward 3 months later, the pullback has likely completed. The metal can start to resume higher in months to come. Below we will look at the technical outlook using Elliott Wave.
Platinum Monthly Elliott Wave Chart
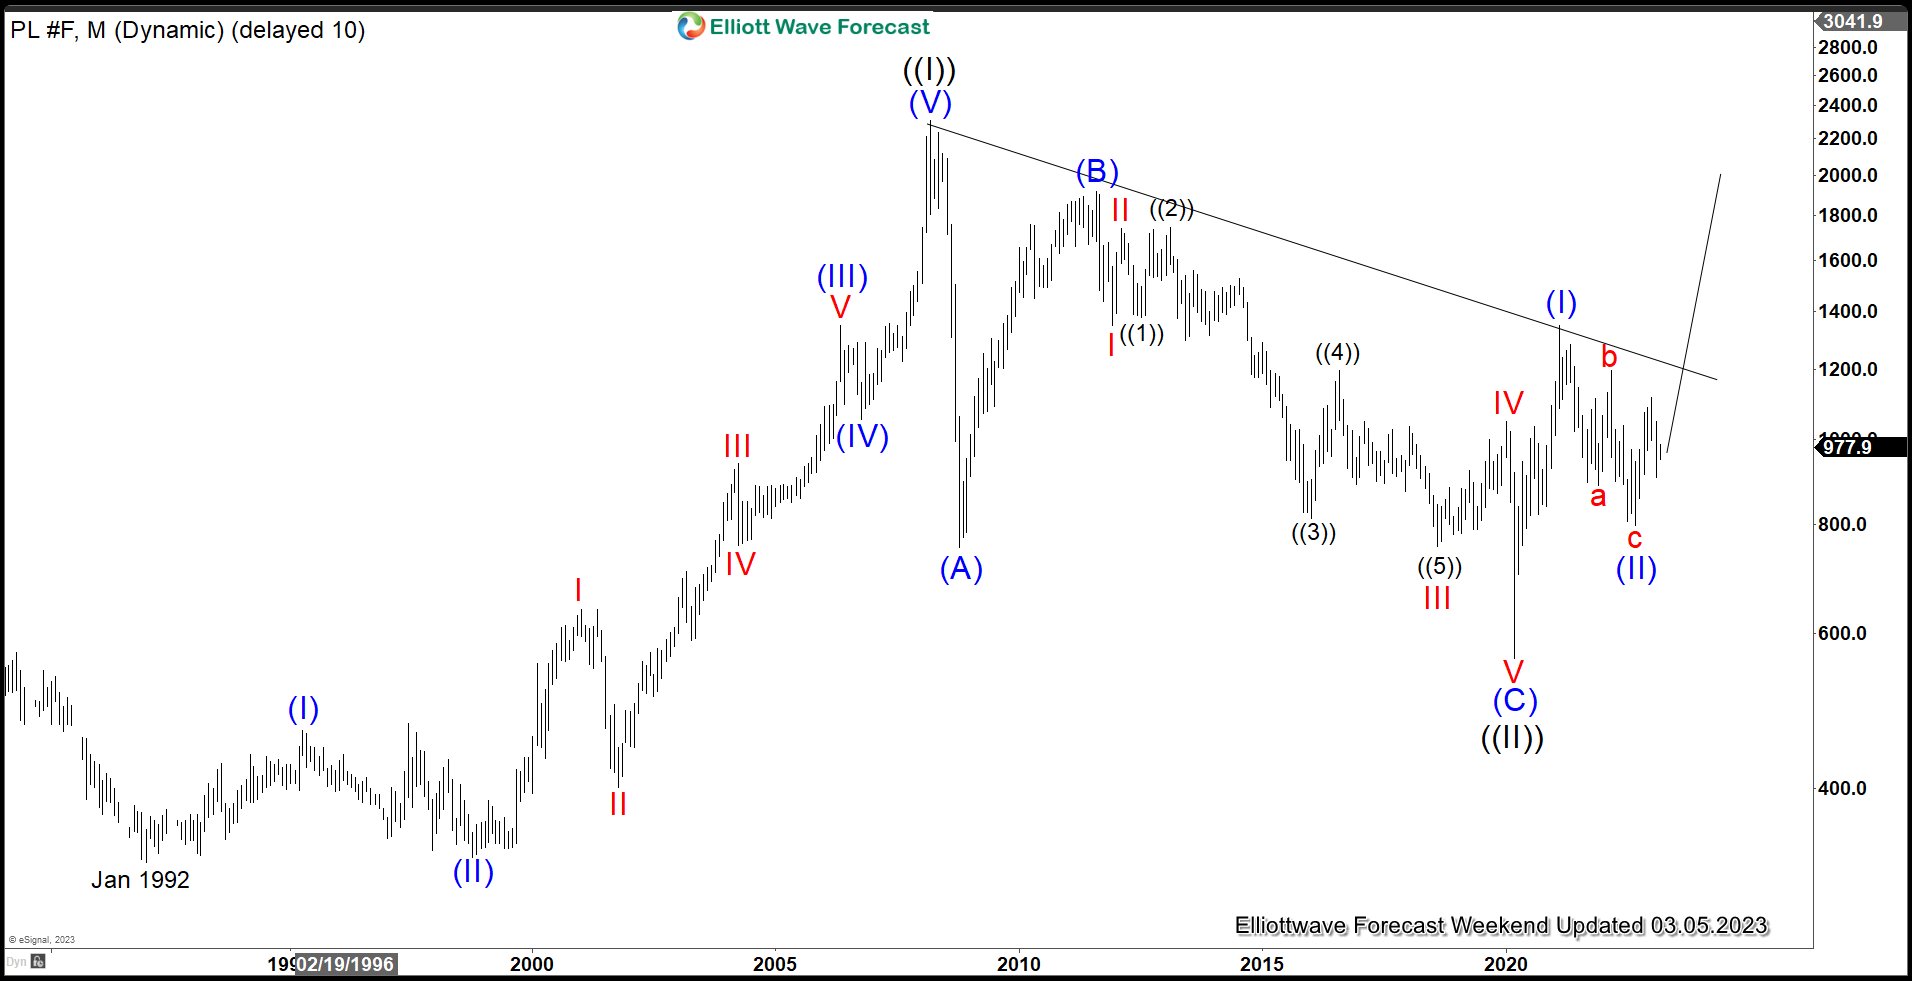
Monthly Elliott Wave Chart of Platinum above suggests that the metal did an all-time correction to cycle from January 1992. The correction nded a major low at 562 in 2020 where we labelled as wave ((II)). Wave ((III)) higher is currently in progress with subdivision as an impulse structure. Up from wave ((II)), wave (I) ended at 1348.2 and pullback in wave (II) ended at 796.8. Expect Platinum to extend higher as long as it stays above wave (II) low at 796.8.
Platinum Daily Elliott Wave Chart
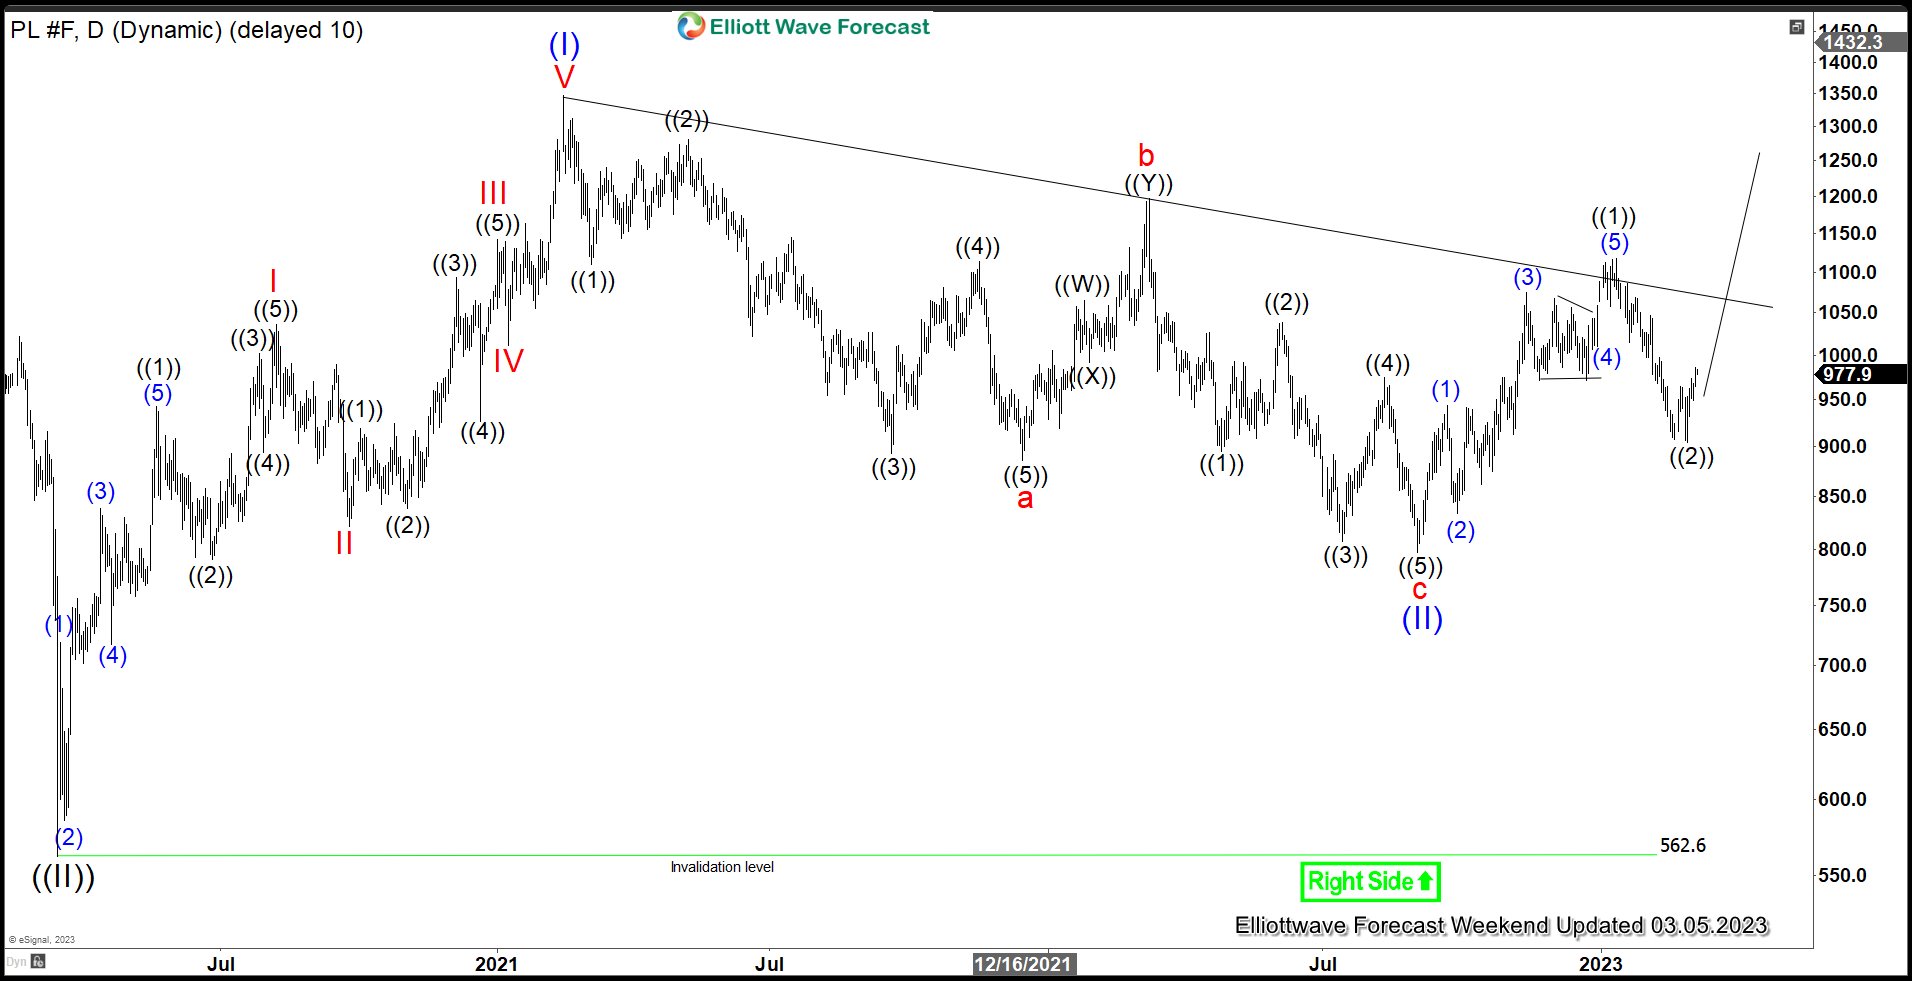
Daily Chart of Platinum above suggests that the metal ended correction to cycle from 3.11.2020 low at 796.8 on September 1. We labelled this low as wave (II). Up from there, wave (1) ended at 943.5 and pullback in wave (2) ended at 833.7. Wave (3) ended at 1074.1 and wave (4) ended at 1006.3. Final leg higher wave (5) ended at 1117 which completed wave ((1)). Pullback in wave ((2)) has likely completed at 903.9 even though the metal still needs to break above the previous wave ((1)) high at 1117 to confirm this view and rules out a double correction. Near term, expect the metal to continue the rally higher as long as dips stay above 1117 in the first degree.
Forex and Cryptocurrency Forecast
EUR/USD: Pause in the 1.0600 Zone
On Thursday, March 02, the DXY dollar index broke again through the bar at 105.00 points but could not stay there. As usual, the dollar was supported by an increase in US government bond yields. The yield on 10-year securities rose to its high since November 10 at 4.09%, the yield on 2-year securities rose to 4.91% and updated its maximum since 2007. The revision of US labor market statistics in Q4 2022 and the ISM Manufacturing Business Activity Index (PMI) in the country's manufacturing sector also supported the US currency. On the other hand, the dollar was pressured by the yuan, which is getting stronger against the backdrop of macro-economic statistics from China. The PMI manufacturing index in China was the highest since 2012. Activity in the service sector has also increased, and the Chinese real estate market has stabilized.
However, the main factor determining the dynamics of the USD is still the expectation of the Fed's further actions in an attempt to curb inflation. Since the Consumer Price Index (CPI) rose more than expected in January, reaching 6.4%, market participants started talking about the fact that the regulator may raise the rate not by 25 basis points (bp) in March, but immediately by 50. (At the moment, CME's FedWatch tool estimates the probability of such a move at 23%).
This forecast was supported by hawkish comments by some FOMC (Federal Open Market Committee) members. The head of the Atlanta Fed, Rafael Bostic, said that the key interest rate should eventually be raised to 5.00-5.25% and kept at this level until 2024. Minneapolis Fed chief Neil Kashkari has yet to decide whether he will vote for a 25bp or 50bp rate hike in March, but hinted that the Fed's own dot plot could be raised. At the same time, both officials stressed the need to fight inflation, emphasizing that a strong labor market and the US economy are able to withstand the pressure caused by the aggressive monetary policy of the Central Bank. However, Rafael Bostic then softened his hawkish mood and said that the regulator may suspend the rate hike cycle in the summer. After that, the dollar slightly retreated from its gains.
Some analysts do not rule out that the peak USD rate will reach 5.5% in September, and maybe even 6.0%. There is no question of reducing it at the end of the year at all. And these expectations play on the side of the US currency, which is confirmed by the futures market. But when talking about EUR/USD, one cannot focus only on the actions of the Fed. They don't sleep on the other side of the Atlantic either. Inflation data for a number of European countries suggest that the ECB will also be forced to maintain a hawkish position for longer than previously expected. The opening of the Chinese economy could put pressure not only on the US, but also on Europe, making it difficult for both regulators to curb inflation. Therefore, market participants expect further tightening of monetary policy on the part of the European Central Bank, which currently keeps the pair in the 1.0600 area.
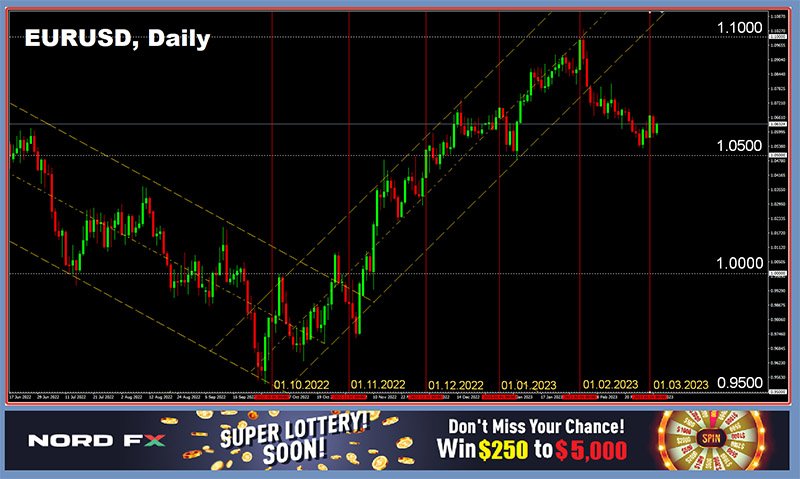
Last week's finish was at 1.0632. At the time of writing this review (the evening of March 03), the analysts' forecast looks as uncertain as the flat quotes of EUR/USD: 50% of them have taken a neutral position, 30% of experts are counting on further strengthening of the dollar, and the remaining 20% side with the euro. Among the oscillators on D1, 50% are colored red, 15% are green and 35% are neutral gray. Among trend indicators, 35% recommend selling, 65% - buying. The nearest support for the pair is located at 1.0575-1.0605, then there are levels and zones 1.5000-1.0530, 1.0440, 1.0375-1.0400, 1.0300 and 1.0220-1.0255. Bulls will meet resistance in the area of 1.0680-1.0710, 1.0740-1.0760, 1.0800, 1.0865, 1.0930, 1.0985-1.1030.
There will be quite a lot of economic statistics and events in the coming week. Data on retail sales in the Eurozone will be released on Monday, March 06. Fed Chairman Jerome Powell will address the US Congress on Tuesday and Wednesday. Also, there will be data on retail sales in Germany, Eurozone GDP and employment in the US on Wednesday, March 08. The number of initial claims for unemployment benefits in the US and the inflation rate (CPI) in China will be known on Thursday. Friday 10 March will show what is happening with consumer prices in Germany. We are traditionally waiting for a portion of important statistics from the US labor market on the same day, including the unemployment rate and the number of new jobs created outside the agricultural sector (NFP).
GBP/USD: Sentiment Color Is Red
GBP/USD has been in a sideways channel for the second week in a row, although it has demonstrated rather high volatility. The range of its fluctuations (1.1942-1.2147) exceeded 200 points, and the last chord of the week was placed in the middle of this channel, at the level of 1.2040. We described above what gives strength to the dollar. The British currency received some support from information received last week that an agreement was reached between the UK and the EU on the Northern Ireland Protocol. Trade disputes have now been resolved, and while this is positive for the UK economy as a whole, many experts believe that the positive effect of this agreement for the pound will be short-term.
Quotes of the pair are still determined by the actions of the Central Banks. And the head of the Bank of England (BoE), Andrew Bailey, speaking on Wednesday, March 01, further fogged the issue., saying that the final decision on the prospects for the monetary policy of the British Central Bank has not yet been made, and that the regulator should be flexible in the coming months so as not to scare the markets.
Experts' median forecast for the near future is as follows: 70% of experts vote for the further weakening of the pound and the fall of GBP/USD, only 10% expect the pair to grow, and 20% prefer to refrain from forecasts. Among the trend indicators on D1, the balance of power is 65% to 35% in favor of the greens. The picture is different among oscillators. The reds have a convincing advantage here, 70%, 10% side with the greens, and 20% have taken a neutral position. Support levels and zones for the pair are 1.1985-1.2025, 1.1960, 1.1900-1.1925, 1.1840, 1.1800, 1.1720 and 1.1600. When the pair moves north, it will face resistance at the levels 1.2055, 1.2075-1.2085, 1.2145, 1.2185-1.2210, 1.2270, 1.2335, 1.2390-1.2400, 1.2430-1.2450, 1.2510, 1.2575-1.2610, 1.2700, 1.2750 and 1.2940.
As for next week's economic calendar, no important macro data from the UK is expected until Friday March 10, when UK GDP and industrial production data for January are released.
USD/JPY: Patience and Only Patience
USD/JPY rose to 137.10 on Thursday, March 02 after the release of US economic data. This is the highest level since December 20, 2022. The yen was opposed by the divergence between Fed and BoJ politicians, as well as the yield spread between 10-year US and Japanese bonds, which rose to its highs in March since November 2022.
Another blow to the Japanese currency was dealt by Kazuo Ueda, who was elected as the new head of the Bank of Japan (BoJ). His position only exacerbated the disappointment of those who hoped for major changes in the regulator's monetary policy. Investors have failed to pick up a clear "hawkish" signal in his speeches, which would have spurred the resumption of speculative demand for the yen, which was already weakening against the background of the growth of DXY and the rise in yields of 10-year treasuries.
USD/JPY met the beginning of February at the level of 130.08, and now it ends at 135.84 on March 03. However, a number of experts do not lose hope that the Japanese currency will strengthen. "Since the dollar peaked at the end of September, the yen became the second best-performing G10 currency by the end of January," economists at MUFG Bank wrote. - Some backtracking in this context is quite understandable. But we believe that inflation will decline and yields around the world are close to peaks, which indicates a recovery in the yen, especially since the policy of the Bank of Japan will also change."
Strategists from HSBC, the largest financial conglomerate, echo their colleagues. "We will remain yen bulls in the medium term," their forecast sounds, "but we suspect that it will take some patience for the currency to gain independent strength thanks to the Bank of Japan. For now, USD/JPY is likely to remain influenced by developments in the US, where we see the balance of risk tilting towards a weaker dollar."
The next meeting of the Bank of Japan will take place on Friday March 10. It will last be chaired by the former head, Haruhiko Kuroda, after which he will hand the reins over to Kazuo Ueda. Analysts at JPMorgan (like most others) do not expect BoJ policy to change or signal correction at this meeting. It is unlikely that Kuroda will slam the door loudly when he leaves; most likely, the interest rate will remain at the same negative level of -0.1%. Therefore, yen supporters can only follow HSBC's advice and be patient.
So, as already mentioned, a number of experts expect a serious strengthening of the Japanese currency in the future. In addition to MUFG Bank and HSBC strategists listed above, BNP Paribas Research has a similar position, while Danske Bank economists predict that USD/JPY rate will fall to the level of 125.00 in three months. In their opinion, in the event of a tightening of monetary policy, positive yields in Japan could stimulate the repatriation of funds by local investors, as a result of which USD/JPY will be around 121.00 by the end of 2023. But these are still rather shaky assumptions, although 60% of analysts agree with them. As for the immediate prospects, only 10% of experts are counting on the movement of the pair to the south at the moment, 45% are looking in the opposite direction, and the remaining 45% stay neutral.
Among the oscillators on D1, 85% point north, the remaining 15% look in the opposite direction. For trend indicators, 65% look north and 35% look south. The nearest support level is located in the zone 134.90-135.20, followed by the levels and zones 134.40, 134.00, 133.60, 132.80-133.20, 131.85-132.00, 131.25 130.50, 129.70-130.00. Levels and resistance zones are 136.00-136.30, 136.70-137.10, 137.50, 139.00-139.35, 140.60, 143.75.
Among the events of the coming week, in addition to the above-mentioned meeting of the Bank of Japan, the calendar includes Thursday, March 9, when the country's GDP data for Q4 2022 will be published.
CRYPTOCURRENCIES: Bitcoin Awaiting a New Catalyst
The first sentence of the previous review was: "Bitcoin is under pressure, but it is holding up". Starting the current review, we can only repeat: bitcoin is under pressure, but it is holding up. Let's talk about global news now. The good news is that the leading regulators will not completely ban cryptocurrencies. The bad news is that regulatory pressure on the industry will continue to grow.
The regulation of the crypto market was one of the topics that finance ministers and central bank representatives discussed at the G20 meeting. As a result, US Treasury Secretary Janet Yellen said that regulation of the crypto industry is important, while Washington is not considering a complete ban. "It is very important to create a reliable regulatory framework. And we are working [on this] with other governments," she said in an interview with Reuters. IMF Managing Director Kristalina Georgieva agrees with her colleague: her organization also advocates for adequate regulation of digital assets and against their complete ban.
It should be noted here that the increase in regulatory control, while forcing a number of players out of their comfort zone, could ultimately have a positive impact on the industry, relieving shocks like the collapse of FTX. In addition, clear rules will attract a significant number of new institutional investors, raising the capitalization of the crypto market to unprecedented heights.
But this is in the future. In the present, the "herd" of whales (more than 1,000 BTC) continues to decline, reaching a three-year low of 1,663 individuals. There were almost 2,500 of them at its peak in February 2021. And this despite the fact that the crypto market showed a much better result at the beginning of 2023 than most of its participants and experts expected. These are the findings of Bank of America researchers.
At the moment, bitcoin quotes are supported mainly by small and medium-sized investors. According to analytics company Glassnode, the number of wallets with a volume of 1 BTC is constantly updating highs, approaching 1 million. The 30-day capital inflow to the market exceeded the outflow for the first time in 9 months and returned to the "green" zone. The cumulative net realized market value position also turned positive for the first time since April 2022 (the metric has been negative for the past nine months). Long-term holders have also updated their four-month high in savings.
By the way, according to Glassnode analysts, the drop in the number of whale wallets can be considered a positive factor. This means that the asset has become more distributed and less concentrated among a handful of large holders. This option is preferable for the entire ecosystem, as it eliminates the possibility of market manipulation by several players.
Another positive factor, according to some experts, is the weakening of the correlation of cryptocurrencies with US stocks and macroeconomic indicators. The flagship cryptocurrency was moving in a narrow range of $23,000-24,000 for almost the entire past week, and it sank a little only on Friday, March 03. Perhaps this was facilitated by the news that another representative of the crypto industry, Silvergate Bank from California (USA), was on the verge of bankruptcy.
According to analysts at the investment company Bernstein, the correlation of the first cryptocurrency with the Nasdaq Composite index has fallen from 0.94 to 0.58 since early February. According to them, the market is balancing between bulls and bears, "waiting for further catalysts", and its susceptibility to events in the world of traditional finance "is not the same as before."
We could also observe a weakening and then strengthening of the correlation with the stock market last August-September. And it is quite possible that the current "decoupling" of BTC from stock indices is a temporary phenomenon. It is clear that the main concerns for all risky assets are related to the continued increase in the key rate by the US Federal Reserve, which could become a catalyst for the resumption of the bearish trend of BTC/USD.
The Eight CEO Michael van de Poppe, a well-known trader, believes that bitcoin is currently the most undervalued asset. He has released a video review in which he predicts the growth of the coin to $40,000 this year. At the same time, both worsening macroeconomic data and the forecast for the Fed's rate failed to dampen Van de Poppe's optimism. From his point of view, a pronounced bullish divergence on the weekly chart indicates that we have already reached the bottom. What is happening now is just a bounce off the 200-week moving average and consolidating. According to the trader, a sideways movement is most likely at this stage. In the worst-case scenario, BTC/USD will fall to the low of the $18,000 range, and this fall will be a great investment opportunity.
According to Van de Poppe, there is no recession at the moment, but it may begin due to the collapse of the debt market and the real estate market. But before that happens, bitcoin could rise to $40,000, as the crisis usually unfolds 6-12 months after the Fed's significant rate hike. The signal for the start of a new bull rally could be either the lifting of the mining ban in China, or the adoption of cryptocurrency in Hong Kong.
Global financial disaster is also predicted by Robert Kiyosaki, author of a number of books on investing, including the bestseller Rich Dad Poor Dad. He has long been a critic of the Fed's monetary policy and has expressed concern about the devaluation of the dollar. And now the economics writer has made a bold statement that, in his opinion, the fake dollar is leading to the decline of the American empire. This stance of Kiyosaki has drawn approval from the crypto community as it shows the benefits of bitcoin. Experts note that digital assets such as BTC, unlike fiat currencies, are not subject to inflationary pressure, since their supply is limited and predetermined by appropriate algorithms.
Recall that Kiyosaki has recently predicted that the bitcoin rate will rise to $500,000 by 2025. "A giant crash is coming. Depression is possible. The Fed has been forced to print billions in counterfeit money. Gold at $5,000, silver at $500, and bitcoin at $500,000 by 2025," he wrote. And he added that gold and silver are the money of the gods, and bitcoin is like a dollar for ordinary people.
Matt Hougan, chief investment officer at Bitwise, said in a recent interview that he is "epically optimistic for the next three years." In his opinion, there will be a massive adoption of cryptocurrency in 2023-2025 and its prices will grow. "This bull market cycle is going to be the biggest cycle in terms of user adoption, in terms of the cumulative increase in market capitalization, in terms of just about every other thing we care about," the financier says. "But it won't happen perfectly up and to the right." Also, "I'm actually optimistic about regulation," Matt Hougan added.
Apple co-founder Steve Wozniak was also bullish last week. In his opinion, the main cryptocurrency has a huge potential and will increase in value in the coming years, reaching $100,000.
In the meantime, at the time of writing this review (Friday evening, March 03), BTC/USD is trading in the $22,250 zone. The total capitalization of the crypto market is $1.024 trillion ($1.059 trillion a week ago). The Crypto Fear & Greed Index fell from 53 to 50 points in a week and is in the very center of the Neutral zone.
And finally, news that can be attributed to our crypto life hacks section. It concerns those who do not like the regulatory press, which we talked about at the beginning of the review. So, it became known that the government of Ras Al Khaimah (RAK), one of the UAE's emirates, plans to create a free zone for companies in the digital asset industry. According to the announcement, RAK Digital Assets Oasis will become a hub for unregulated industry activity, with applications open as early as Q2 2023.
EUR/USD Weekly Outlook
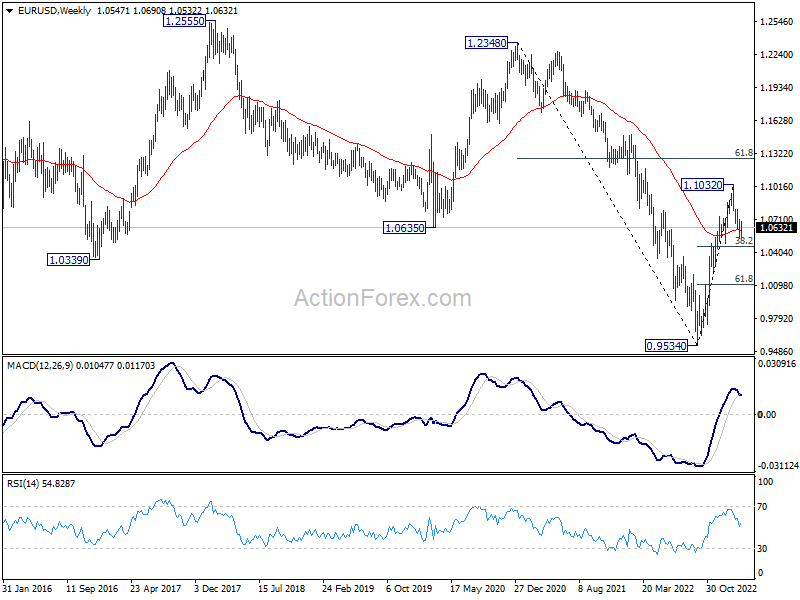
EUR/USD recovered after edging lower to 1.0532 last week, but failed to extend gain above 1.0690. Initial bias remains neutral first. While corrective fall from 1.1032 might still extend, downside should be contained by 38.2% retracement of 0.9534 to 1.1032 at 1.0463 to bring reversal. On the upside, break of 1.0690 will turn bias back to the upside for 1.0803 resistance and above.
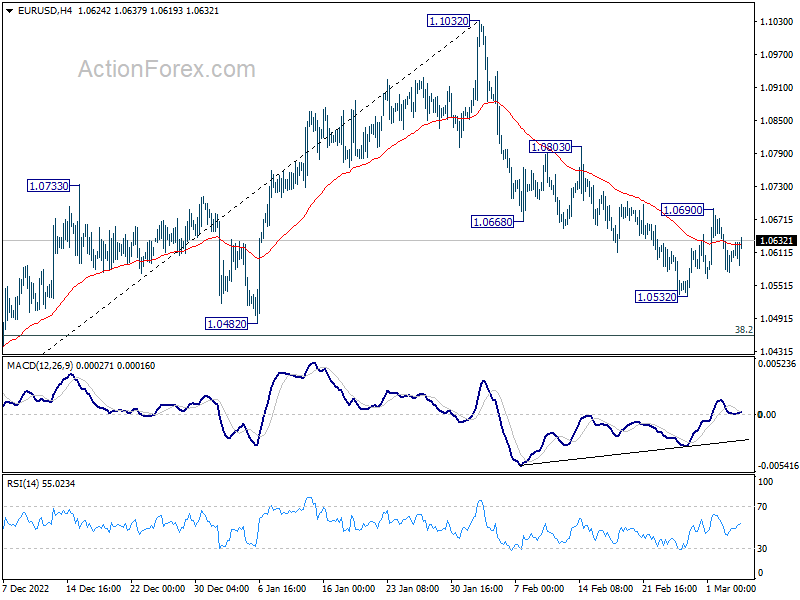
In the bigger picture, as long as 1.0482 support holds, rise from 0.9534 (2022 low) should continue to 61.8% retracement of 1.2348 (2021 high) to 0.9534 at 1.1273. However, sustained break of 1.0482 will bring deeper fall to 61.8% retracement of 0.9534 to 1.1032 at 1.0106, even as a corrective pull back.
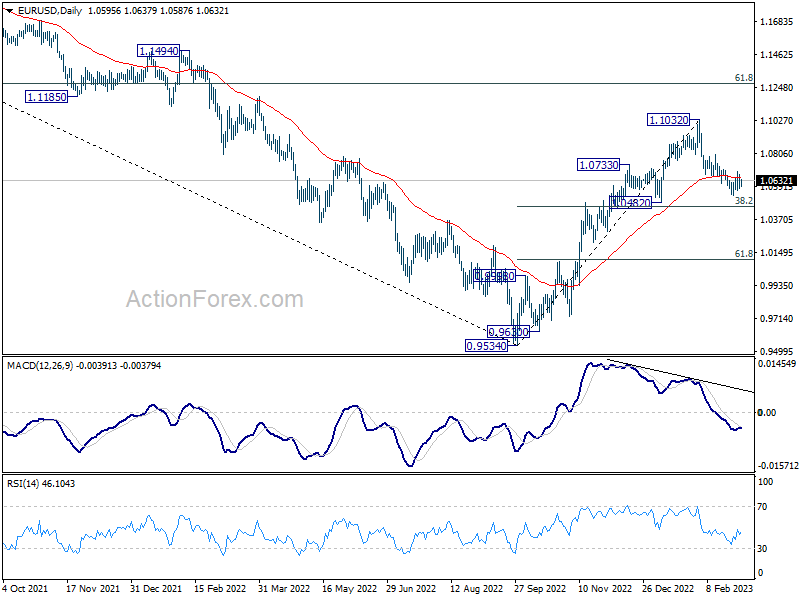
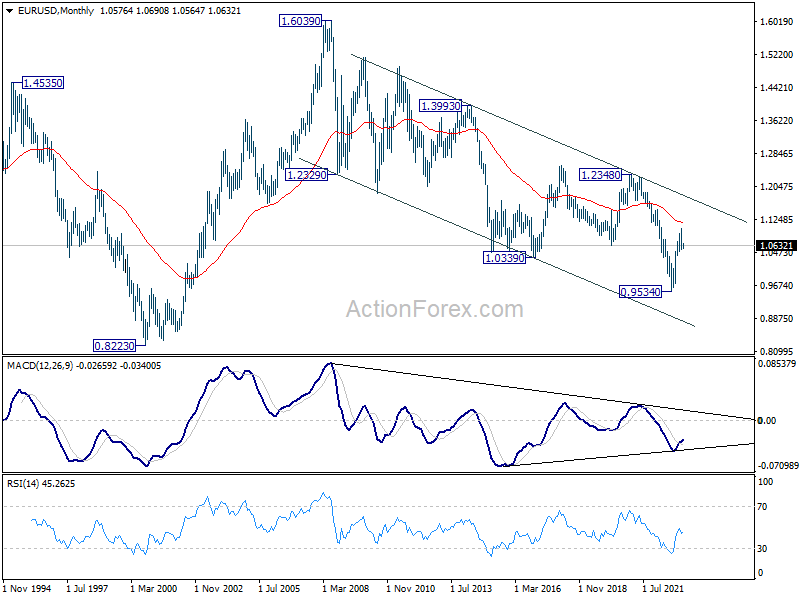
In the long term picture, while it's too early to call for long term trend reversal at this point, the strong break of 1.0635 support turned resistance (2020 low) should at least turn outlook neutral. Focus will turn to 55 month EMA (now at 1.1165). Rejection by this EMA will revive long term bearishness.
USD/JPY Weekly Outlook
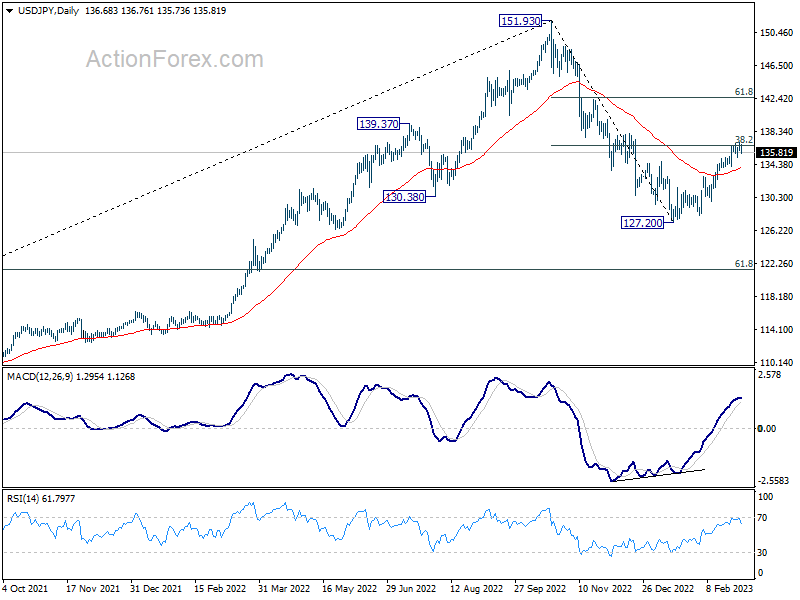
USD/JPY edged higher to 137.09 last week but struggled to sustain above 38.2% retracement of 151.93 to 127.20 at 136.64. Initial bias remains neutral this week first. On the downside, break of 135.24 support will indicate rejection by 136.64, and turn bias back to the downside for 55 day EMA (now at 133.92) first. Sustained break of 55 day EMA will indicate that whole rebound from 127.20 has completed. On the upside, however, sustained break of 136.64 will indicate that fall from 151.93 has completed, and bring further rally to 61.8% retracement at 142.48.
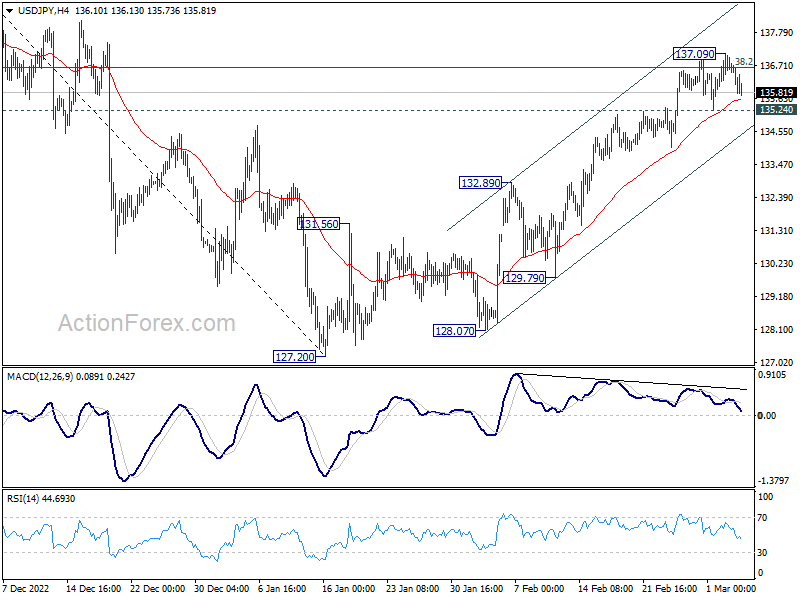
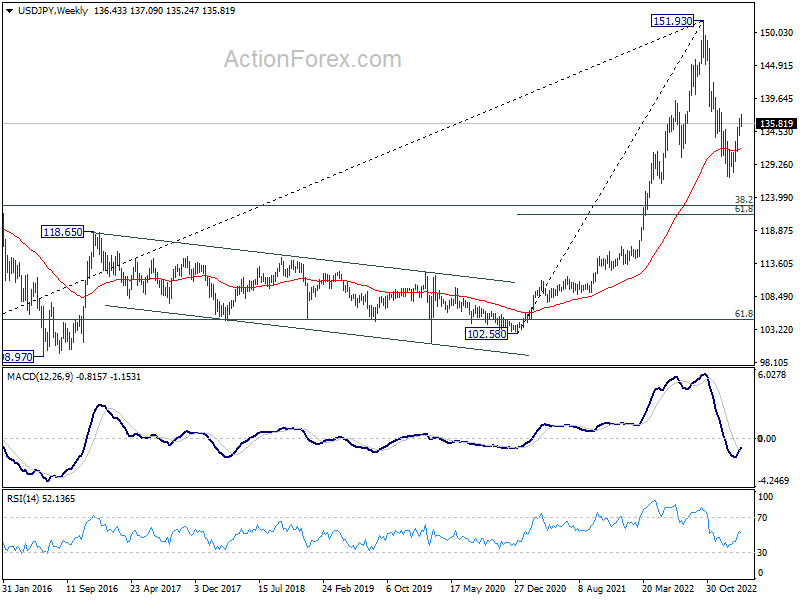
In the bigger picture, focus remains on 38.2% retracement of 151.93 to 127.20 at 136.64. Sustained break there will indicate that price actions from 151.93 medium term are merely a corrective pattern. Such development will maintain long term bullishness. Rejection by 136.64 will, on the other hand, extend the fall from 151.93 to 61.8% retracement of 102.58 to 151.93 at 121.43 at a later stage.
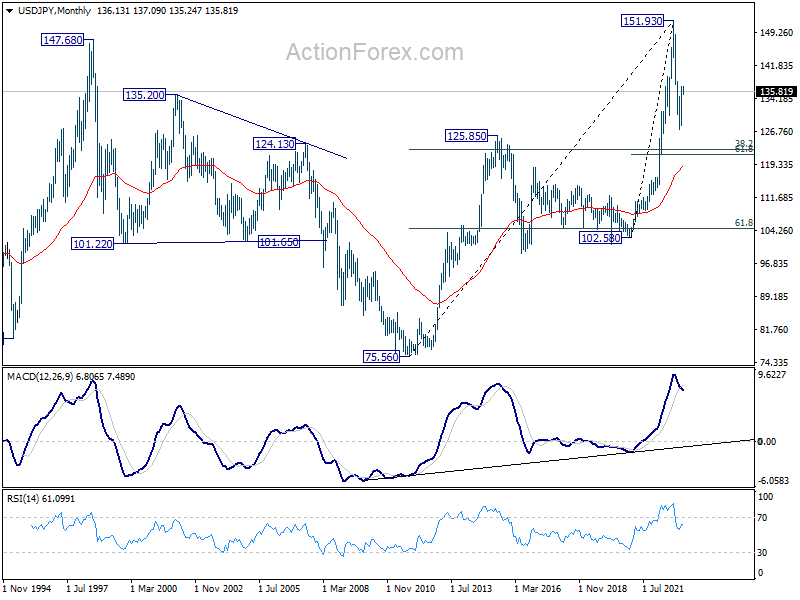
In the long term picture, 151.93 looks increasingly likely a major top. But it's too early to call for long term bearish reversal at this point. Rebound from around 38.2% retracement of 75.56 to 151.93 at 122.75 will keep the case open for price action from 151.93 to be just a corrective pattern.
GBP/USD Weekly Outlook
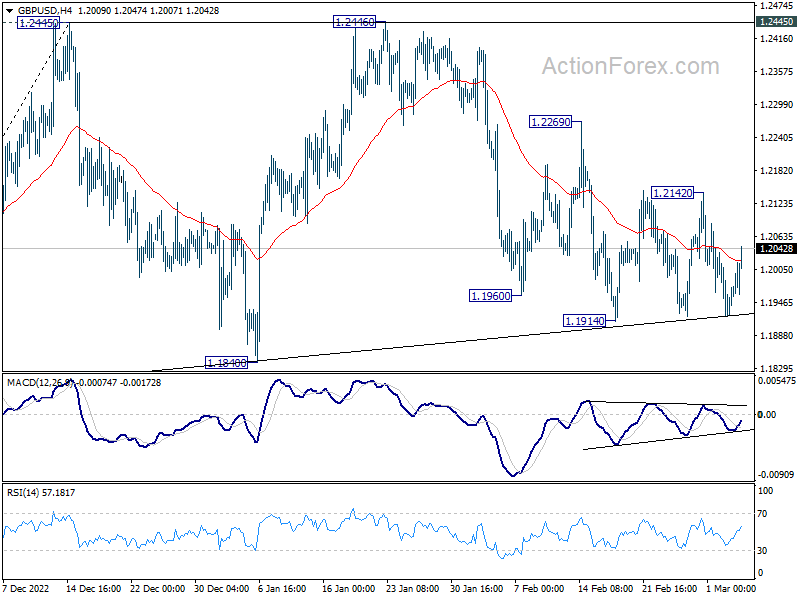
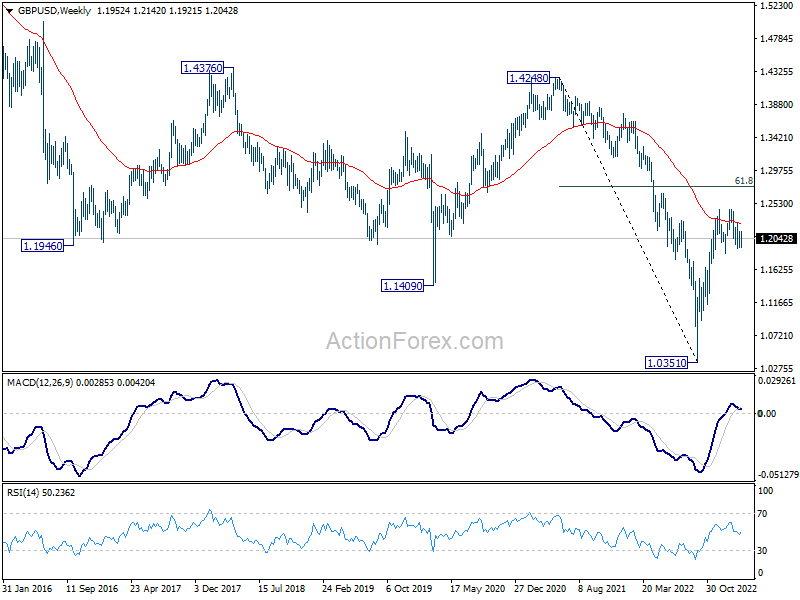
GBP/USD stayed in sideway pattern above 1.1914 last week. Initial bias remains neutral this week first. On the downside, break of 1.1914 will resume the decline from 1.2446, as the third leg of the corrective pattern from 1.2445, for 1.1840 support and possibly below. On the upside, break of 1.2142 resistance will turn bias back to the upside for further rebound to 1.2269 and above.
In the bigger picture, as long as 1.1840 support holds, rise from 1.0351 medium term bottom (2022 low) should still continue to 61.8% retracement of 1.4248 (2021 high) to 1.0351 at 1.2759. However, decisive break of 1.1840 will complete a double top pattern (1.2445, 1.2446) after rejection by 55 week EMA (now at 1.2243). Deeper decline should be seen back to 38.2% retracement of 1.0351 to 1.2445 at 1.1645.
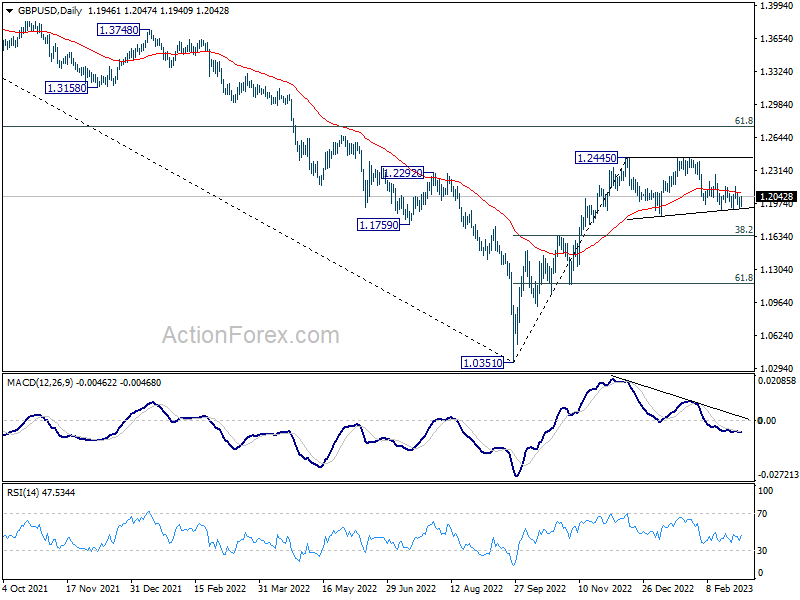
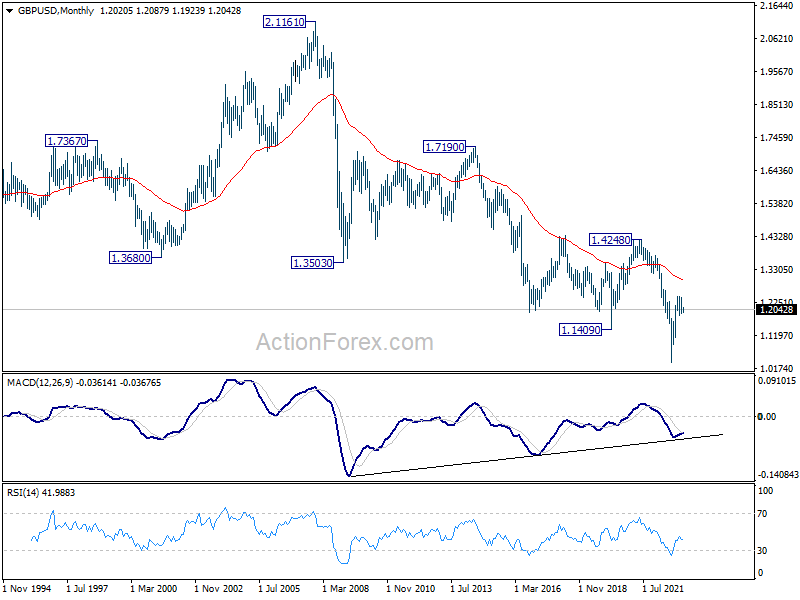
In the longer term picture, as long as 1.4248 resistance holds (2021 high), long term outlook will remain neutral at best. Down trend from 2.1161 (2007) could still resume for another low through 1.0351 at a later stage.
USD/CHF Weekly Outlook
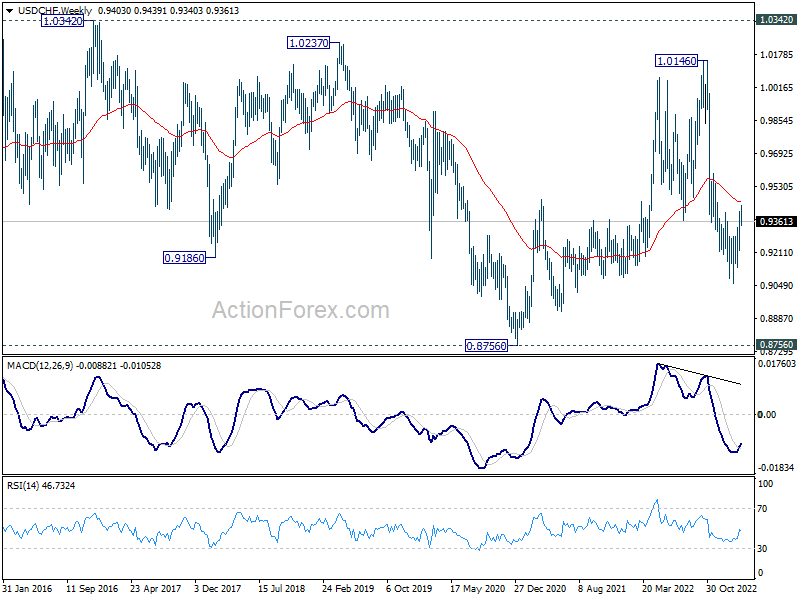
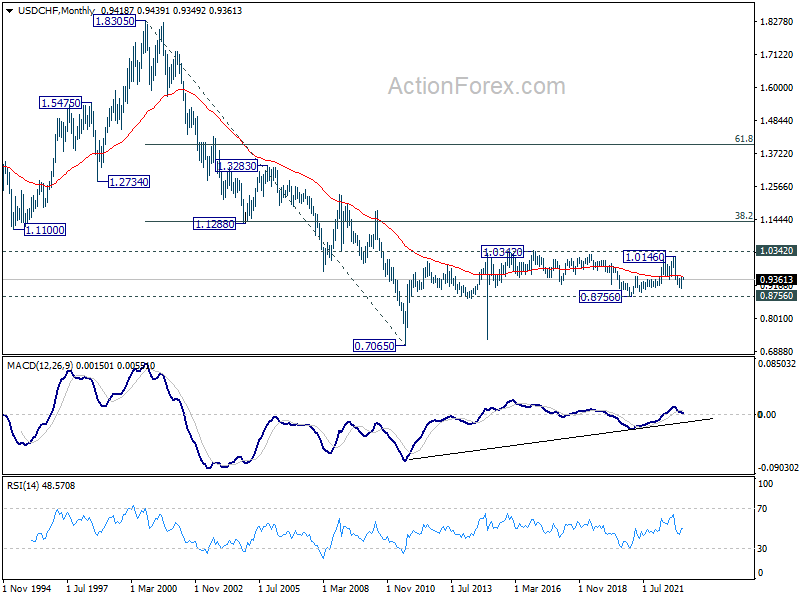
USD/CHF edged higher to 0.9439 last week but retreated again. Initial bias stays neutral first. While further rise cannot be ruled out, strong resistance could be seen from 38.2% retracement of 1.0146 to 0.9058 at 0.9474 to complete the rebound from 0.9058. Break of 0.9340 minor support will turn bias back to the downside. However, decisive break of 0.9474 will carry larger bullish implications and target 61.8% retracement at 0.9730.
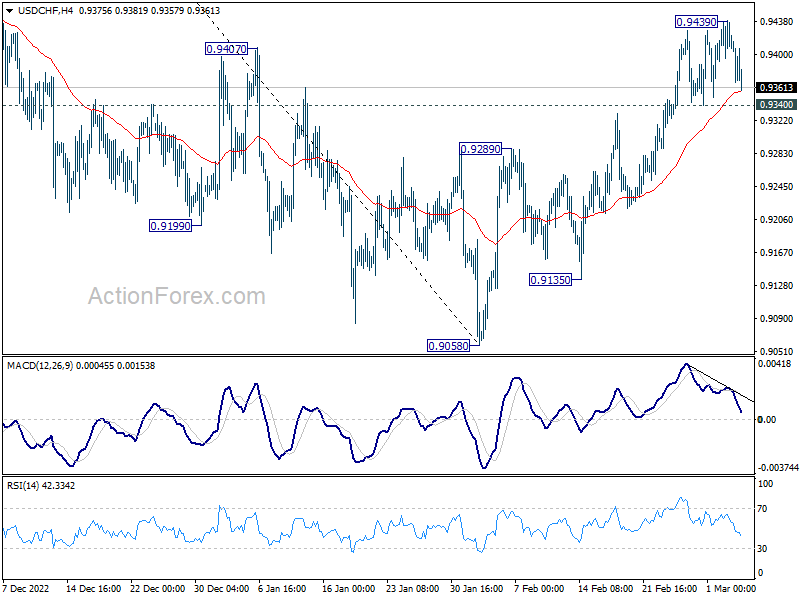
In the bigger picture, decline from 1.0146 is seen as part of a long term sideway pattern. As long as 38.2% retracement of 1.0146 to 0.9058 at 0.9474 holds, another fall is in favor through 0.9058. However, sustained trading above 0.9474 will indicate that the medium term trend has reversed, and open up further rally to 61.8% retracement at 0.9730 and above.
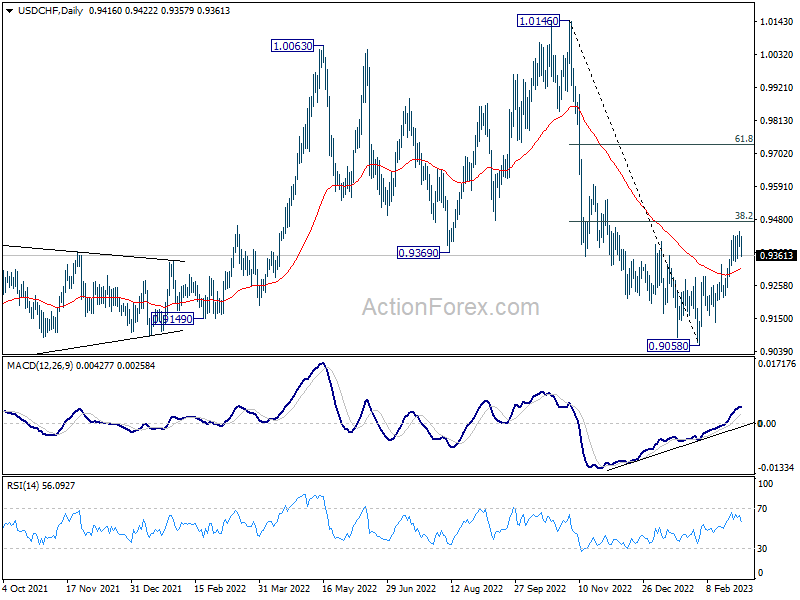
In the long term picture, long term sideway pattern from 1.0342 (2016 high) is extending. Overall, range trading should continue until further development.
AUD/USD Weekly Report
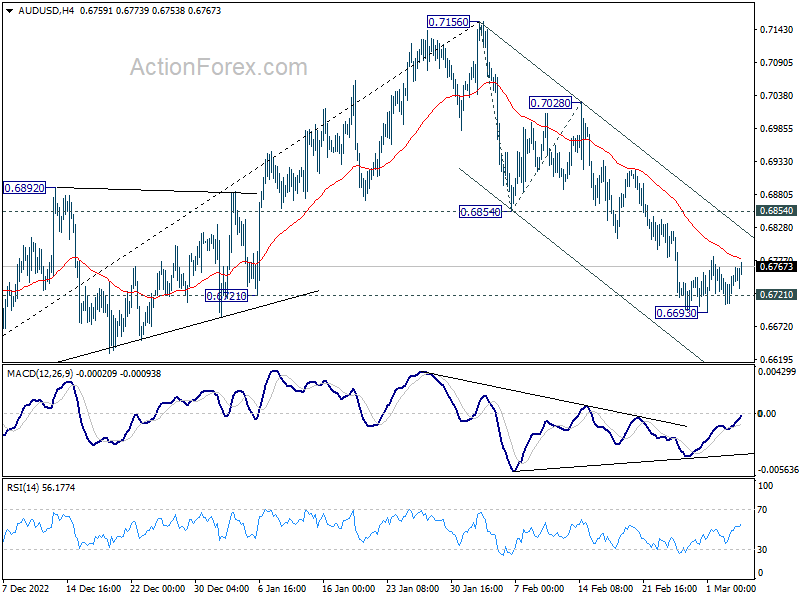
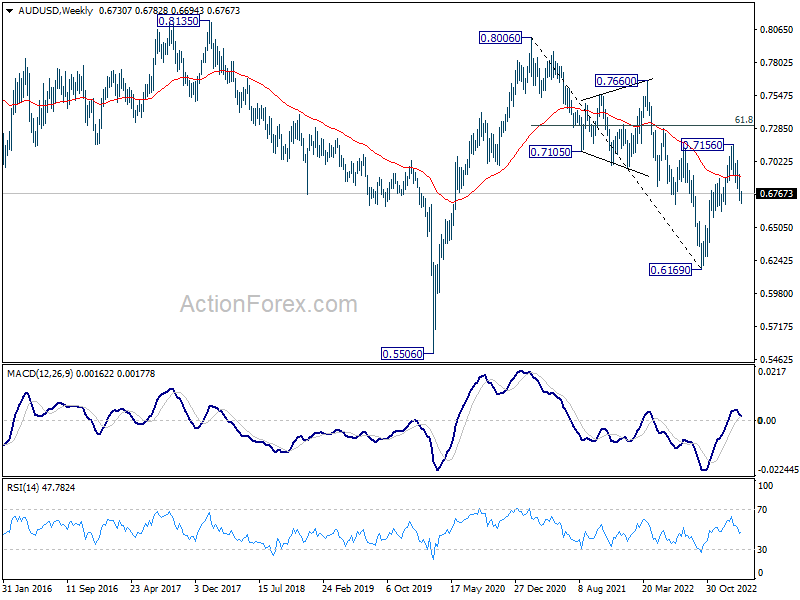
AUD/USD edged lower to 0.6693 last week but couldn't sustain below 0.6721 support and recovered. Initial bias stays neutral this week first. Deeper decline is expected as long as 0.6854 support turned resistance holds. Break of 0.6693 will resume the fall from 0.7156 to 161.8% projection of of 0.6854 to 0.7028 from 0.6854 at 0.6539. Nevertheless, firm break of 0.6854 will argue that such decline is finished, and revive near term bullishness.
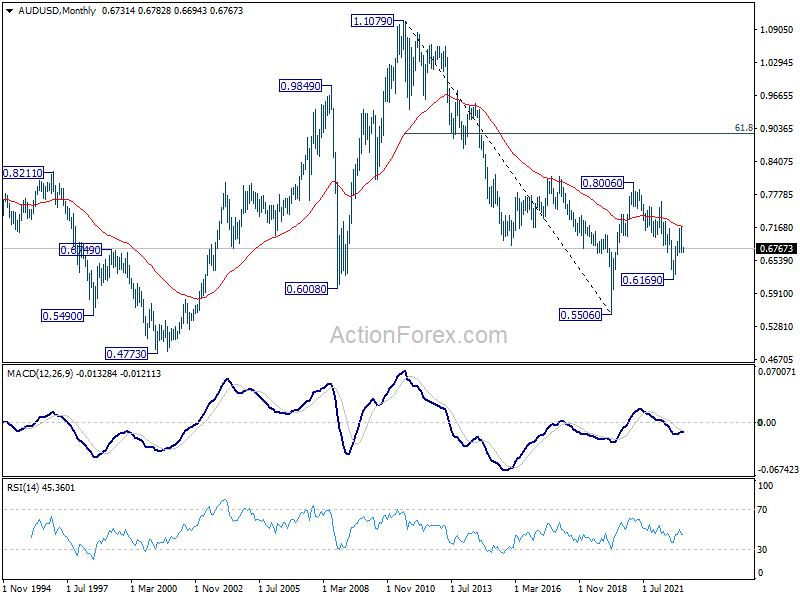
In the bigger picture, focus is staying on 0.6721 structural support. Sustained break there will argue that whole rise from 0.6169 (2022 low) has completed at 0.7156, after rejection by 55 month EMA (now at 0.7164). Deeper decline would then be see back to 61.8% retracement of 0.6169 to 0.7156 at 0.6546, even as a corrective fall. Nevertheless, strong rebound from current level will retain medium term bullishness for another rise through 0.7156 later.
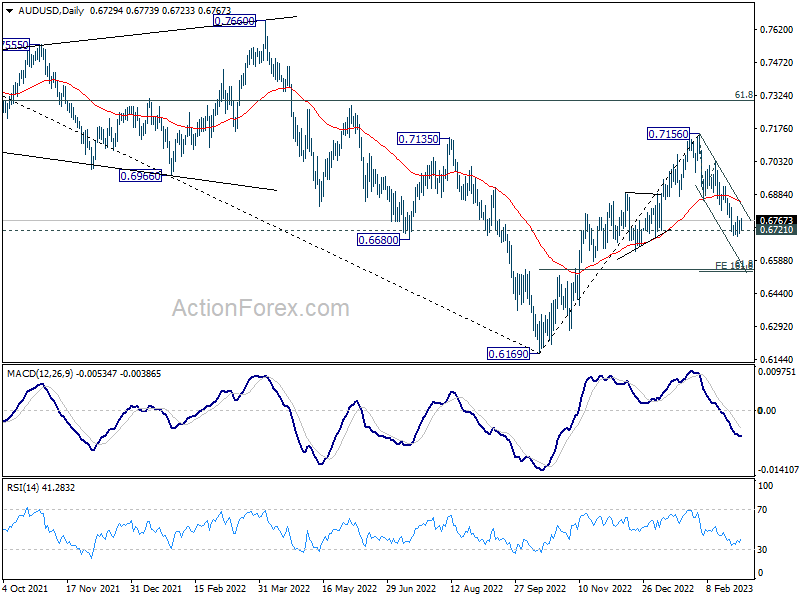
In the long term picture, initial rejection by 55 month EMA (now at 0.7164) retains long term bearishness. That is, down trend from 1.1079 (2011 high) could still resume through 0.5506 (2020 low) on resumption.
USD/CAD Weekly Outlook
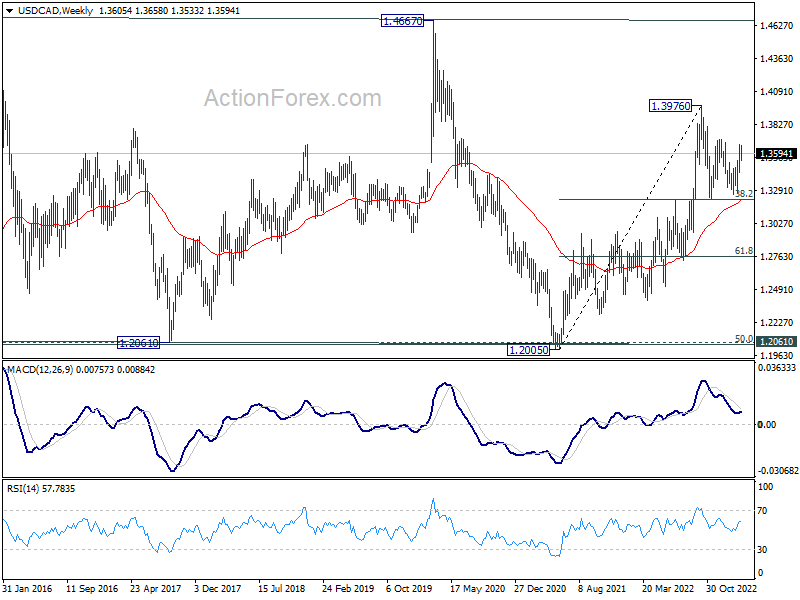
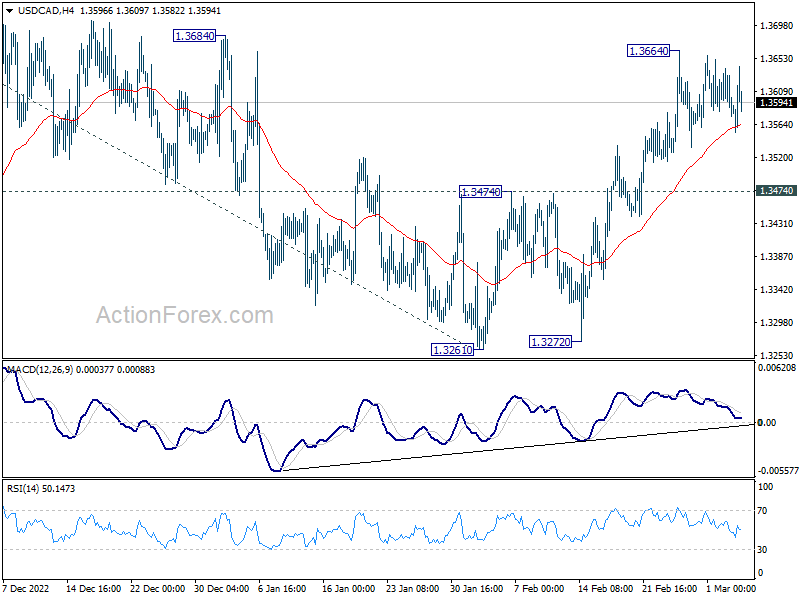
USD/CAD stayed in consolidation below 1.3664 last week and outlook is unchanged. Initial bias remains neutral first. Corrective pattern from 1.3976 should have completed at 1.3261. Break of 1.3664 will resume the rise from 1.3261. Sustained trading above 1.3684 will confirm this bullish case and bring retest of 1.3976.
In the bigger picture, outlook stays bullish with 1.3222 cluster support (38.2% retracement of 1.2005 to 1.3976 at 1.3223) intact. Break of 1.3976 resistance will resume larger up trend from 1.2005 (2021 low) to 61.8% projection of 1.2401 to 1.3976 from 1.3261 at 1.4234.
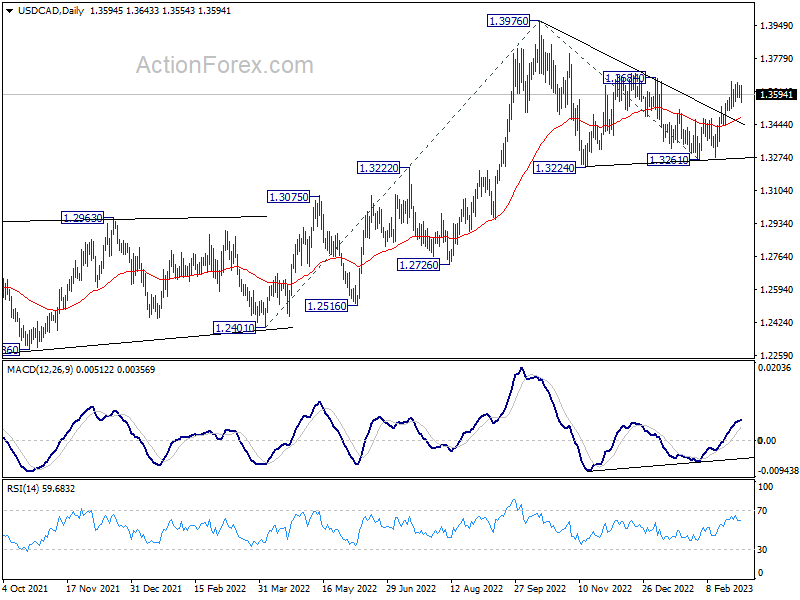
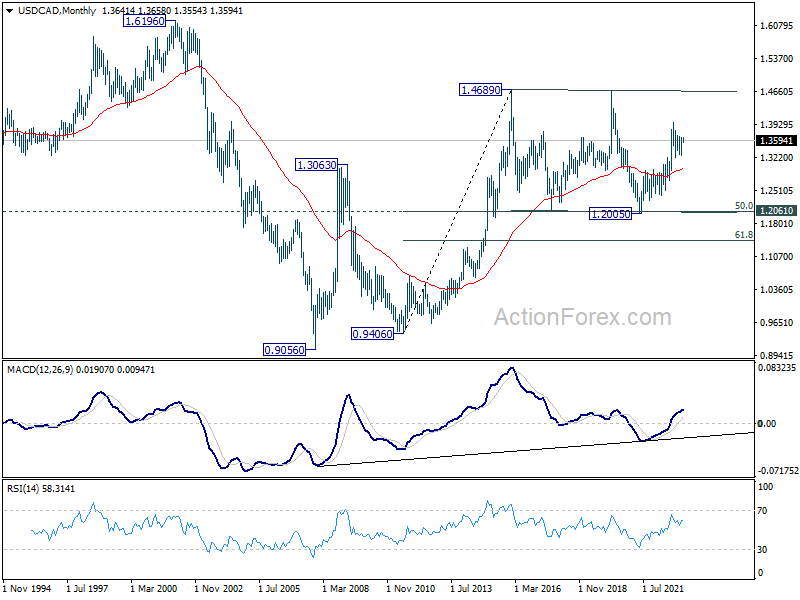
In the longer term picture, price actions from 1.4689 (2016 high) are seen as a consolidation pattern only, which might have completed at 1.2005. That is, up trend from 0.9506 (2007 low) is expected to resume at a later stage. This will remain the favored case as 55 month EMA (now at 1.2995) holds.