Sample Category Title
Fed Bostic: There is the case we need to go higher
Atlanta Fed President Raphael Bostic said yesterday, "there is the case that could be made that we need to go higher" on interest rate.
"Consumer spending is strong and labor markets remain quite tight and that those suggest that the economy's strength could be a bit more than people think, which means we might need to do more."
"I'm going to stay open to any possibility that if data come in stronger than expected then I will adjust my policy trajectory," Bostic said.
Fed Collins: We will need to do some additional rate increases
Boston Fed President Susan Collins said yesterday, "we will need to do some additional rate increases and exactly what the right amount is really needs to be dependent on a holistic review of the information that we receive."
"It will be important to hold there for some time because it takes a while for the effects of tighter financial conditions to work through the economy," she added.
"We've seen some early signs that wage and price pressures might be slowing," she said. "But we've also seen some evidence that high inflation" remains, particularly in some areas of services.
USD/JPY Extends Rally, Services PMI’s Next
Key Highlights
- USD/JPY extended its increase above the 136.50 resistance.
- A major bullish trend line is forming with support near 136.20 on the 4-hours chart.
- Gold price might revisit the $1,845 and $1,850 resistance levels.
- The US ISM Services PMI could decline from 55.2 to 54.5 in Feb 2023.
USD/JPY Technical Analysis
The US Dollar started a steady increase above the 135.00 resistance against the Japanese Yen. USD/JPY even climbed above 136.20 to move further into a positive zone.
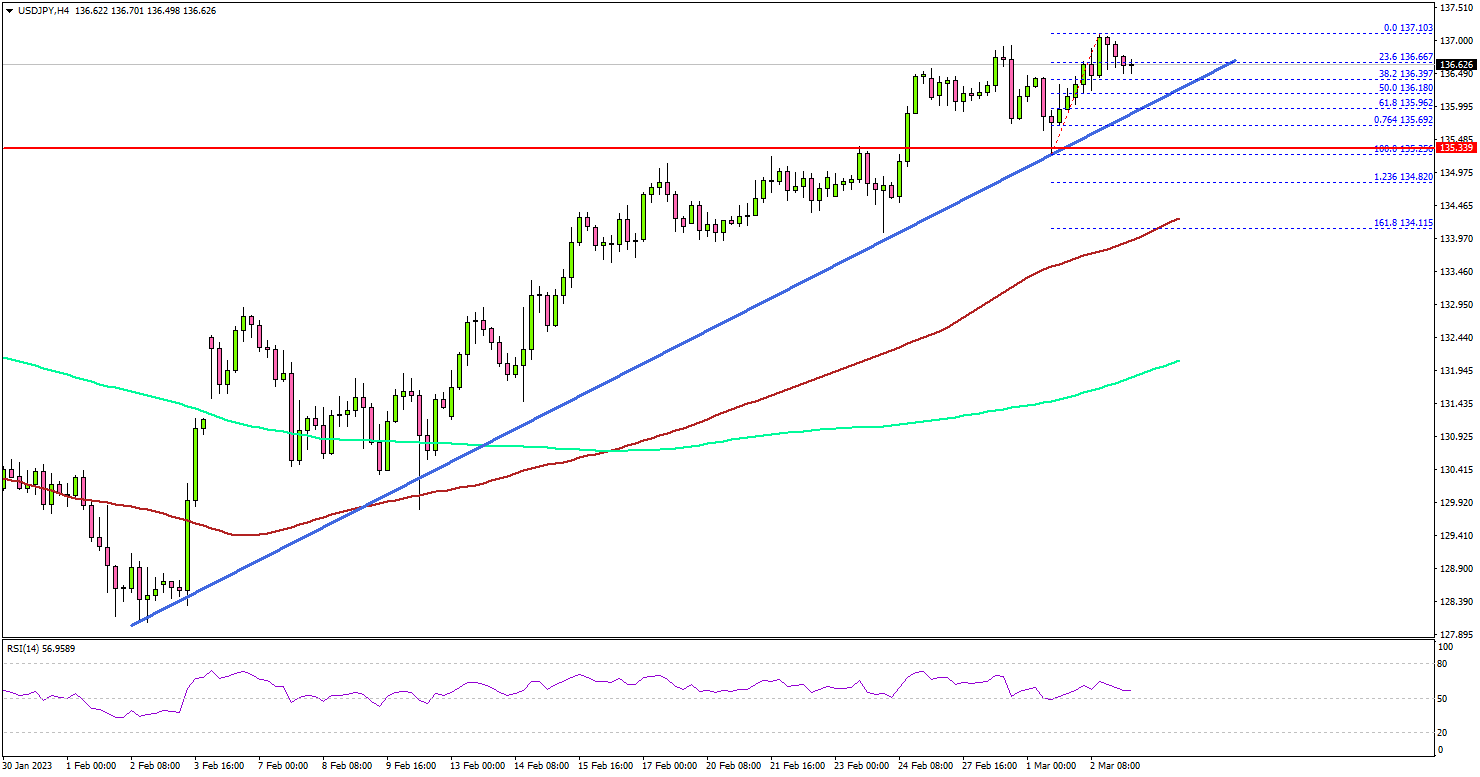
Looking at the 4-hours chart, the pair settled above the 136.00 support level, the 100 simple moving average (red, 4-hours), and the 200 simple moving average (green, 4-hours).
Finally, there was a spike above the 137.00 level. The pair is clearly trading in a strong uptrend. There is also a major bullish trend line forming with support near 136.20 on the same chart. On the upside, an immediate resistance is near the 137.20 level.
The next major resistance is near the 138.00 level. A clear move above the 138.00 resistance might start a steady increase towards the 140.00 zone.
On the downside, an immediate support is near the 136.20 level. The next major support is near the 135.50 level, below which there is a risk of a move towards the 134.20 level or the 100 simple moving average (red, 4-hours). Any more losses could open the doors for a drop towards 132.50.
Looking at gold price, there are some positive signs and the bulls might attempt a move towards the $1,845 resistance zone.
Economic Releases
- Germany’s Services PMI for Feb 2023 - Forecast 51.3, versus 51.3 previous.
- Euro Zone Services PMI for Feb 2023 – Forecast 53.0, versus 53.0 previous.
- UK Services PMI for Feb 2023 – Forecast 53.3, versus 53.3 previous.
- US Services PMI for Feb 2023 – Forecast 50.5, versus 50.5 previous.
- US ISM Services PMI for Feb 2023 – Forecast 54.5, versus 55.2 previous.
Cliff Notes: Consumer is Critical to the Outlook
Key insights from the week that was.
This week, Australia’s Q4 GDP report and monthly consumer/housing releases provided a broad update on the health of Australia’s economy and its outlook. Offshore, the diverging prospects of the US and China were on display.
Q4 GDP for Australia came in well below the market’s expectation at 0.5%, 2.7%yr. In the event, the main surprise was an abrupt slowdown in household spending growth, which fell from 1.0% in Q3 to just 0.3% in Q4. Despite support for consumption from a 2.1% lift in nominal wages and a decline in the savings rate from 7.1% to 4.5% – freeing up roughly $9bn in spending capacity – intense cost of living pressures and rapidly rising interest rates saw a 2.2% decline in real disposable incomes, leading households to restrict their spending particularly on services.
With the tailwinds from earlier policy stimulus and reopening dynamics having now faded, the report suggests consumption growth will remain under pressure this year as the full effect of higher interest costs and inflation’s hit to real incomes continues to materialise (see below). Conditions for investment were lacklustre, the fall in construction work and decline in equipment spending leading a -0.8% decline in new business investment. Though, with capacity tight and tax incentives supportive, businesses remain constructive on the outlook for investment over the coming year.
More positively, Australia’s current account surplus widened from $0.8bn in Q3 (revised up from a deficit of $2.3bn) to $14.1bn in Q4, thereby marking 15 consecutive quarters of surplus, the longest run in the history of the series which dates back to 1959. As evinced by the 1.1ppt contribution from net exports to GDP growth, Australia’s trade position proved to be a key support for the economy into year-end. Indeed, the trade surplus widened to $41bn in the quarter as services exports bounced 9.8% thanks to the recovery in tourism and foreign student arrivals, while total import volumes posted a broad-based decline of 4.3%.
Another batch of volatile housing data meanwhile broadly reaffirmed our view on the outlook. Of note, dwelling approvals posted a much larger-than-expected decline of -27.6% in January, partly representing an unwinding of the high-rise unit spike of December, though the sharp 13.8% decline in private sector house approvals suggests the broader weakening remains well entrenched. However, the CoreLogic home value index fell by only 0.1% in February – a seemingly stable result corroborated by a slowing in price declines across all major capital cities. It should be noted that early-year housing data is prone to low-season measurement issues, distorting the finer interpretation of these results and warranting confirmation over the next few months of data.
As noted above, the Australian consumer will be at the epicentre of the slowdown in growth over 2023. This is supported not only by the clear softening in consumer spending in the national accounts, but also the accumulating evidence of underlying weakness within the retail sector, growth in sales having effectively stalled on a three month basis. Although the retail sector only accounts for around a third of total consumer spending, it is clear that broader inflation pressures remain at an uncomfortable level (despite month-to-month volatility) and are eroding household’s real spending capacity, the full effect of which will likely be a stalling in household consumption during second half of this year.
Moving offshore, the most significant US release this week was the ISM manufacturing survey for February. Overall, it pointed to continued contraction in the manufacturing sector and a belief that this trend will persist – the new orders series printing at 47.0 versus production’s 47.3. Relative to the headline and activity outcomes, employment remains resilient, the index indicating only a marginal reduction in labour use. The prices paid (for inputs) series received the most attention from the market, as it rebounded from 44.5 to 51.3 in the month. Some context is needed here, however. In the two years to June 2022, the height of the pandemic inflationary wave, this index averaged 78. Indeed, in the five years before the pandemic (to end-2019), the average was still 56. While inflation risks have to be monitored wherever they appear, we also have to be realistic on the significance of the signal. With respect to businesses, it is also worth mentioning that, taken together, the durable goods data and regional business surveys point to continued weakness in business investment.
This week’s housing data was also consistent with a sector that is stagnant to down. Residential construction fell a further 0.6% in January after a run of large negatives through late-2022. While the S&P CoreLogic CS 20-city house price measure fell another 0.5% in December. That said, when interest rates and supply allow, there is still demand for housing, pending home sales snapping 8.1% higher in January while mortgage rates were at their recent lows. Note though that pending homes sales are still 22% lower than a year ago and also that the 30-year mortgage rate is back near its cycle highs.
Turning to China, the official PMIs from the NBS confirmed this week that the economy has responded well to the end of COVID-zero, the manufacturing PMI rising to 52.6 and the services index to 56.3. For both sectors, output, new orders and employment all rose strongly. Service producers also reported an expansion of their profitability, with input costs inflation slowing as selling prices rose. Notable too was that the Caixin manufacturing PMI gained a similar amount as the NBS PMI. This points to smaller manufacturers also experiencing the benefit of the rebound.
Taking a longer-term perspective, this week we also investigated the outlook for Chinese industry associated with the global green transition. While the US has sought to curb China’s capacity and influence through the Inflation Reduction Act and their semiconductor regulation, the evidence suggests China’s dominance in many green industries is unlikely to be challenged. Simply, the Chinese product that the US decides to forgo can instead be marketed to Asia and other developed/developing nations across the world. The sale price may be lower in such a situation, but China’s efficiency and scale of production will make up for it. China’s own demand for green energy and transport will also remain strong for decades to come.
The negative consequences of the US’ actions are therefore likely to fall on their own economy, with limited supply and higher prices for related goods likely, particularly in the continued absence of rapid, large-scale investment in new capacity. The fringe risk for the global economy and environment is if the US encourages other developed markets to take a similar position against China. But, as for the US, the outcome of such a decision would likely be a slower path of emissions reduction at a higher cost; meanwhile China will continue to lead and profit from developing markets’ long path towards net zero. Ironically, China may even find its political and economic position strengthens as a result of the US’ hard line.
What to Trade in March
So far, the year 2023 has been eventful across several financial markets. As we step into March, it's time to prepare for the benefits the markets have in store. In this article, I will look into a few interesting, promising setups.
GBPAUD
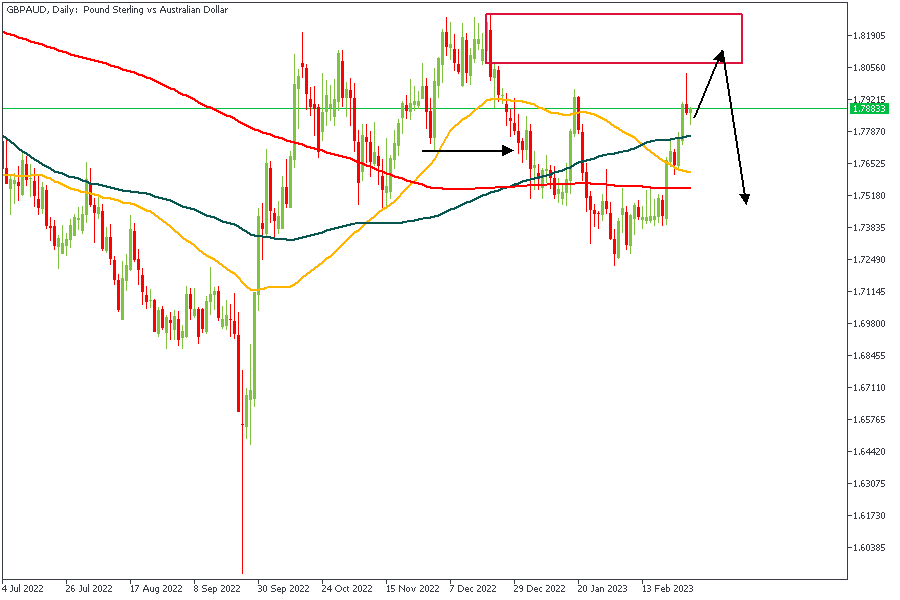
The Daily timeframe of GBPAUD presents an entry from the rally-base-drop supply zone at the highlighted area. This entry naturally coincides with the 88% of the Fibonacci retracement tool and therefore grants an added confluence to our bearish sentiment.
Analysts’ Expectations:
- Direction: Bearish
- Target: 1.76525
- Invalidation: 1.90100
EURAUD
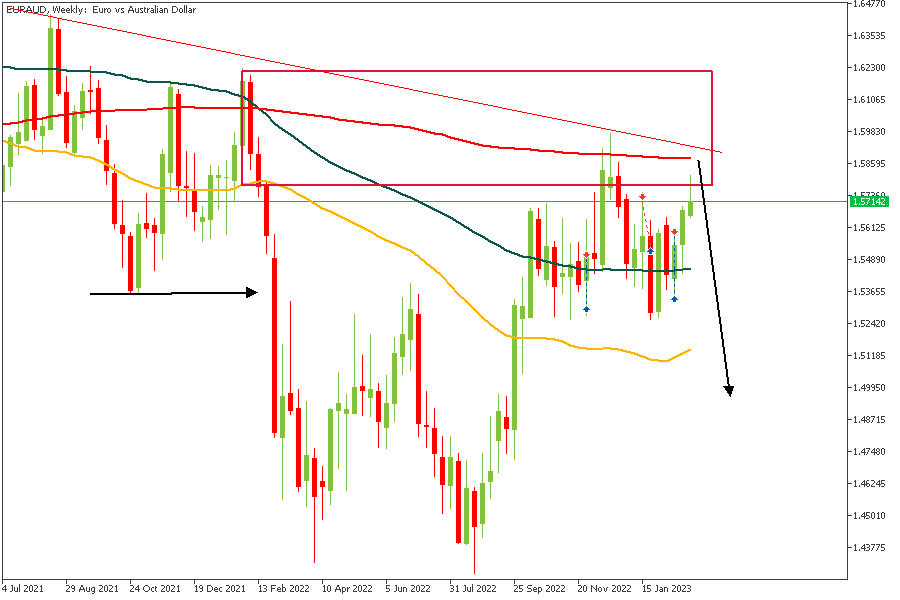
EURAUD is another lovely setup on the weekly timeframe. Here we see price trading within a supply zone, a resistance trendline, and the 200-period moving average serve as the additional confluences that help solidify the bearish sentiment. Not to forget, the supply zone also matches 88% of the Fibonacci retracement tool.
Analysts’ Expectations:
- Direction: Bearish
- Target: 1.51700
- Invalidation: 1.62000
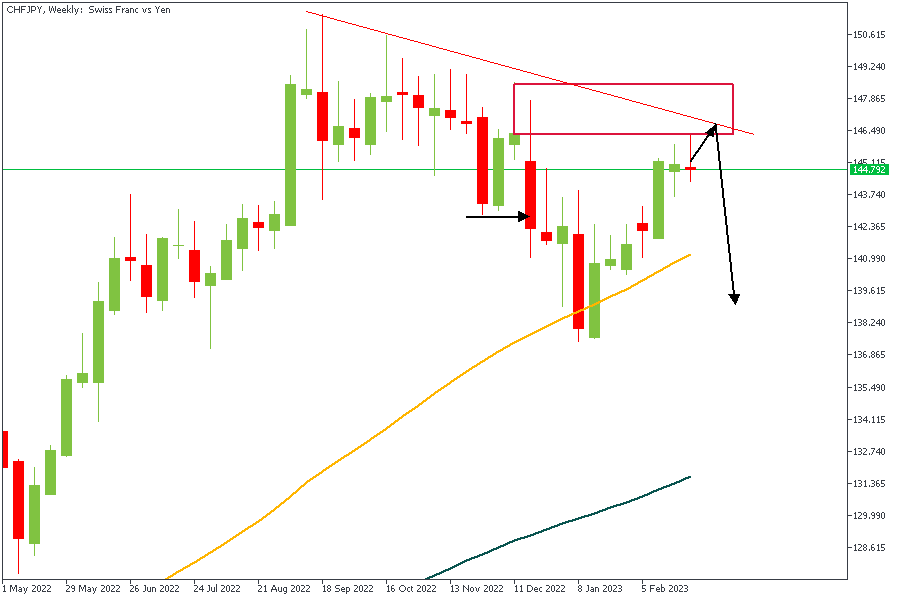
CHFJPY
From a weekly point-of-view, the bearish sentiment is solid and clear. The price chart shows the price action reacting to the supply zone created by the previous market structure break. As a result of the trendline resistance and the 88% Fibonacci retracement level, it is safe to consider this another beautiful trading opportunity.
Analysts’ Expectations:
- Direction: Bearish
- Target: 142.6
- Invalidation: 148
USDCAD
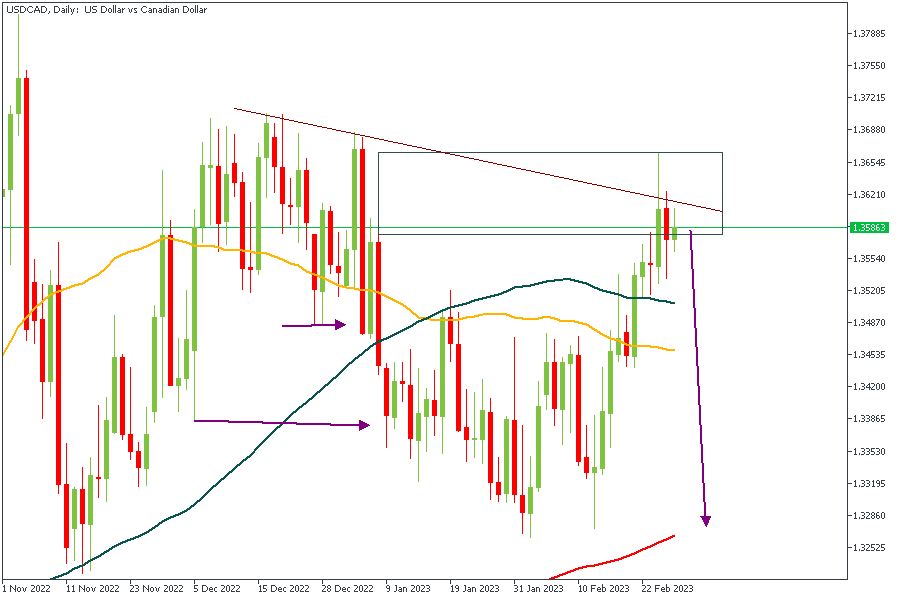
USDCAD is the final setup to consider in this piece. The 50-Day moving average has recently crossed below the 100-Day moving average, suggesting the possibility of lower prices. There is also a confluence of the trendline resistance and the supply zone, solidifying the bearish sentiment alongside the 88% Fibonacci retracement level.
Analysts’ Expectations:
- Direction: Bearish
- Target: 1.33855
- Invalidation: 1.36600
CONCLUSION
The trading of CFDs comes at a risk. Thus, to succeed, you have to manage risks properly. To avoid costly mistakes while you look to trade these opportunities, be sure to do your due diligence and manage your risk appropriately.
GBPJPY Wave Analysis
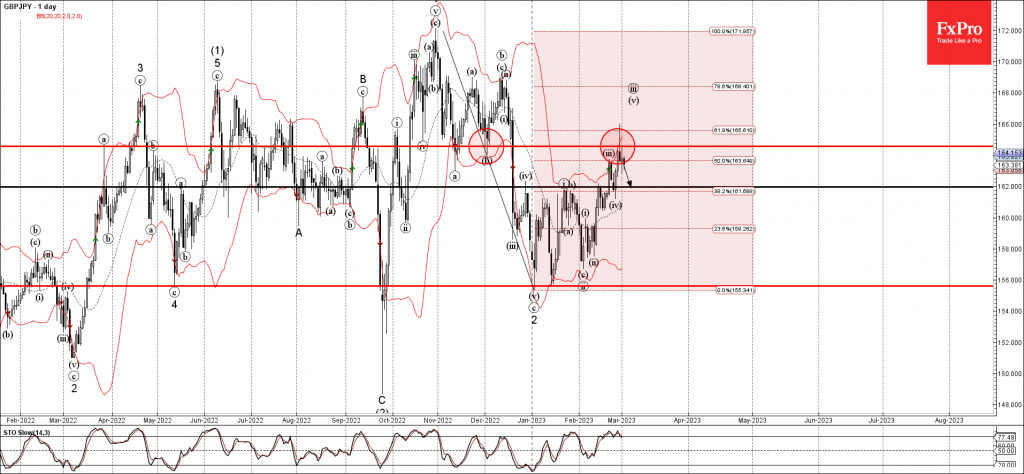
- GBPJPY reversed from resistance level 164.55
- Likely to fall to support level 162.00
GBPJPY currency pair recently reversed down from the key resistance level 164.55 (former support from December) standing close to the 61.8% Fibonacci correction of the downward correction from October.
The downward reversal from the resistance level 164.55 created the daily Japanese candlesticks reversal pattern Shooting Star.
GBPJPY currency pair can be expected to fall further toward the next support level 162.00 (which stopped the previous correction (iv)).
BoE Pill: Current momentum in economic activity may be slightly stronger than anticipated
In a speech, BoE Chief Economist Huw Pill said that "current momentum in economic activity may be slightly stronger than anticipated."
"CPI inflation is projected to fall to below the 2% target by the end of the forecast horizon", he said. But "there are considerable uncertainties around this outlook."
"Upside risks arise in large part from the possibility that domestic inflationary pressures prove more persistent than anticipated, owing to so-called 'second round effects' in price, cost and wage setting behaviour," he explained.
"The latest data for private sector regular pay growth – which was published after the MPC's forecast was finalised – surprised slightly to the upside."
Nevertheless, "some high-frequency indicators of wages have fallen quite sharply recently".
"The MPC will continue to monitor indications of persistence in domestic inflationary pressures closely, with a focus on developments in the labour market, in wage dynamics, in services price inflation and in measures of underlying inflation and inflation expectations."
ECB Preview – Higher for Longer – Now Seen at 4%
Underlying inflation pressures have yet to improve for the ECB to signal an end to its policy rate hikes. Since the February meeting, the economic outlook and labour market still show resilience, pushing the eventual end of ECB hiking further out.
Accordingly we adjust our expectations for the policy path from ECB and now expect a policy peak rate of 4% (deposit rate), with hikes of 50bp in March, 50bp in May, 25bp in June and 25bp in July. We naturally remain data dependent and may adjust the call at a later stage, but for now we see the risks around our baseline rate hike expectations as broadly balanced. Our revision comes on the back of more resilient economic activity and more 'sticky' underlying inflation developments.
We see the 50bp rate hike ECB intends to deliver at the March meeting as a 'done deal', but the key discussions at the meeting will be on the guidance for the May meeting on the back of the new staff projections.
Will Sunak’s Deal Put Brexit Row to Bed?
Rishi Sunak is making his first Brexit debut in efforts to resolve the long-running dispute with the EU over trade rules in Northern Ireland. While hopes for a new breakthrough pushed the British pound in the green territory this week, the reaction was relatively modest, suggesting that investors are being prudent by waiting for more clarity to drive the currency higher. Yet, the uncertain global economic and geopolitical risks could make the opposition compromise, suggesting that Sunak has likely chosen the right moment to resolve the Brexit rift.
What's the new deal?
It’s time for the new UK prime minister Rishi Sunak to test his Brexit tactics following an almost seven-year-old war of words with the EU, which has successfully led to the withdrawal from the union but practically left the UK economy with unworkable customs controls at the Britain-Irish border. Like his predecessors, Sunak will have to sail through the waves too. Perhaps a new backlash from Tories cannot be ruled out if his 100-page proposed revisions to the problematic Northern Ireland protocol, known as the Windsor framework, gets rejected at home despite the approval from the European Commission.
The plan aims to simplify border checks by splitting the goods transferred from Britain to Northern Ireland into two different lanes and authorizing trusted traders; green for those staying in Northern Ireland with drastically simpler requirements and no physical routine checks, and red for those heading to the Republic of Ireland facing custom checks and other processes.
The agreement also provides flexibility to the UK to apply VAT rates below the EU VAT minimum rate for immovable goods and use the UK SME VAT exemption scheme subject to the EU threshold for the size of small-medium enterprises (SMEs).
More importantly, under the most exceptional circumstances, the UK will be allowed to trigger the emergency mechanism called the “Stormont brake” at the request of 30 members of the legislative assembly in Northern Ireland to stop the plan if it observes a lasting negative impact on the community.
Last but not least, the deal has revived hopes for the UK to rejoin the EU’s 95.5bln euro Horizon research program as uncertainty over the EU-UK trade relations has hammered business investment.
Sticking points
While the above arrangements received an immediate positive comment from Brexiteers, with former Cabinet minister David Davis saying that rebellion could calm among Tories, that is a story investors have heard before. The Brexit history has a rich track of unsuccessful rounds of debates and amendments and investors will probably need to see actual progress before they become confident that Sunak’s proposal is the right one.
In the meantime, the ball is in Northern Ireland’s Democratic Unionist Party’s court, which keeps boycotting the government over the persisting EU regulations on the Irish border. Although the party’s leader Jeffrey Donaldson offered some warm words for the plan, he also argued that it may not be enough to persuade his party to back down from its red lines, while he refused to say when the behind-the-scenes talks will conclude.
The truth is that the DUP's demand for no EU laws at the borders may remain unacceptable. The EU will maintain robust authorization and monitoring of Trusted Trader and Authorized Carrier schemes while applying some rules in specific areas according to the agreement.
Is it the right time for a Brexit fight?
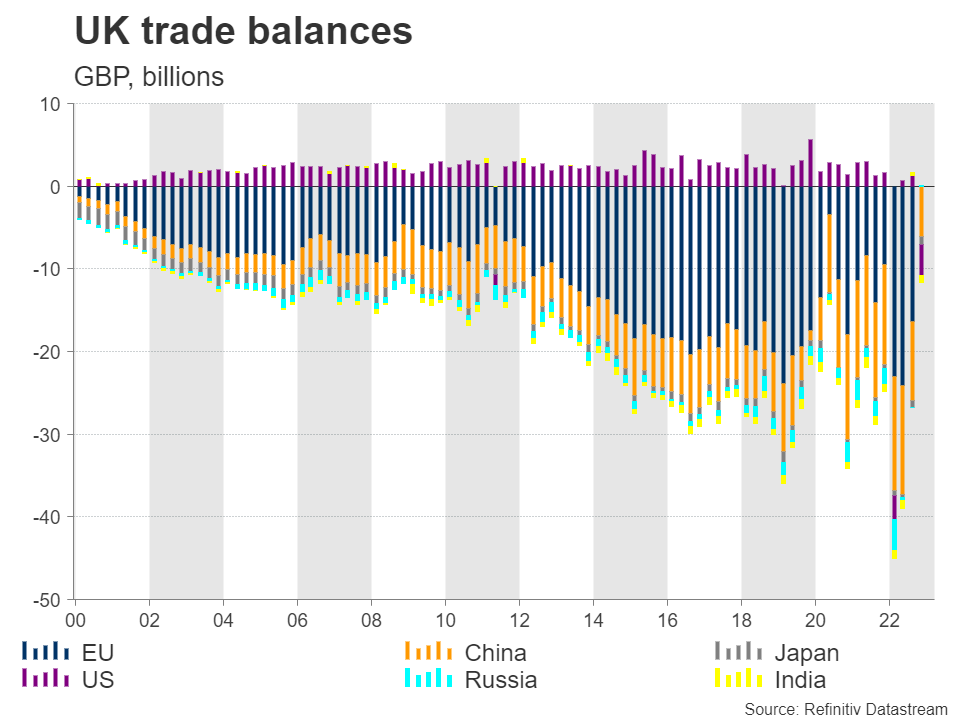
Hence, finding a middle solution might be a tough task for the new government but not impossible as a trade deal with the EU would be valuable during a challenging period for the UK economy. With high inflation eating into consumers’ pockets, soaring government debt allowing limited room for fiscal stimulus, and a trade deficit at multi-year highs, there is little to show for the benefits of Brexit.
The British pound could regain some lost confidence from buyers if the DUP does not create drama over the new UK-EU deal. The opposition Labor party, which is currently leading the polls by 48% compared to Conservatives’ 26%, has shown no interest to snipe either but support the plan if it’s implemented in benefit of the Good Friday Agreement.
Hence, given the relatively calmer political opposition at home and the worsening geopolitical risks in Ukraine, Sunak may have better luck in making everyone accept a not so perfect EU-UK trade deal. Until further notice, the focus will remain on the Bank of England, with a barrage of data and speeches from central bankers likely questioning the pace of rate hikes in the coming weeks. Analysts are certain that the BoE will downshift to a 25bps rate hike on March 23 and chief Andrew Bailey has somewhat embraced the case lately, citing households’ financial difficulties ahead of the UK budget announcement on March 15.
GBPUSD
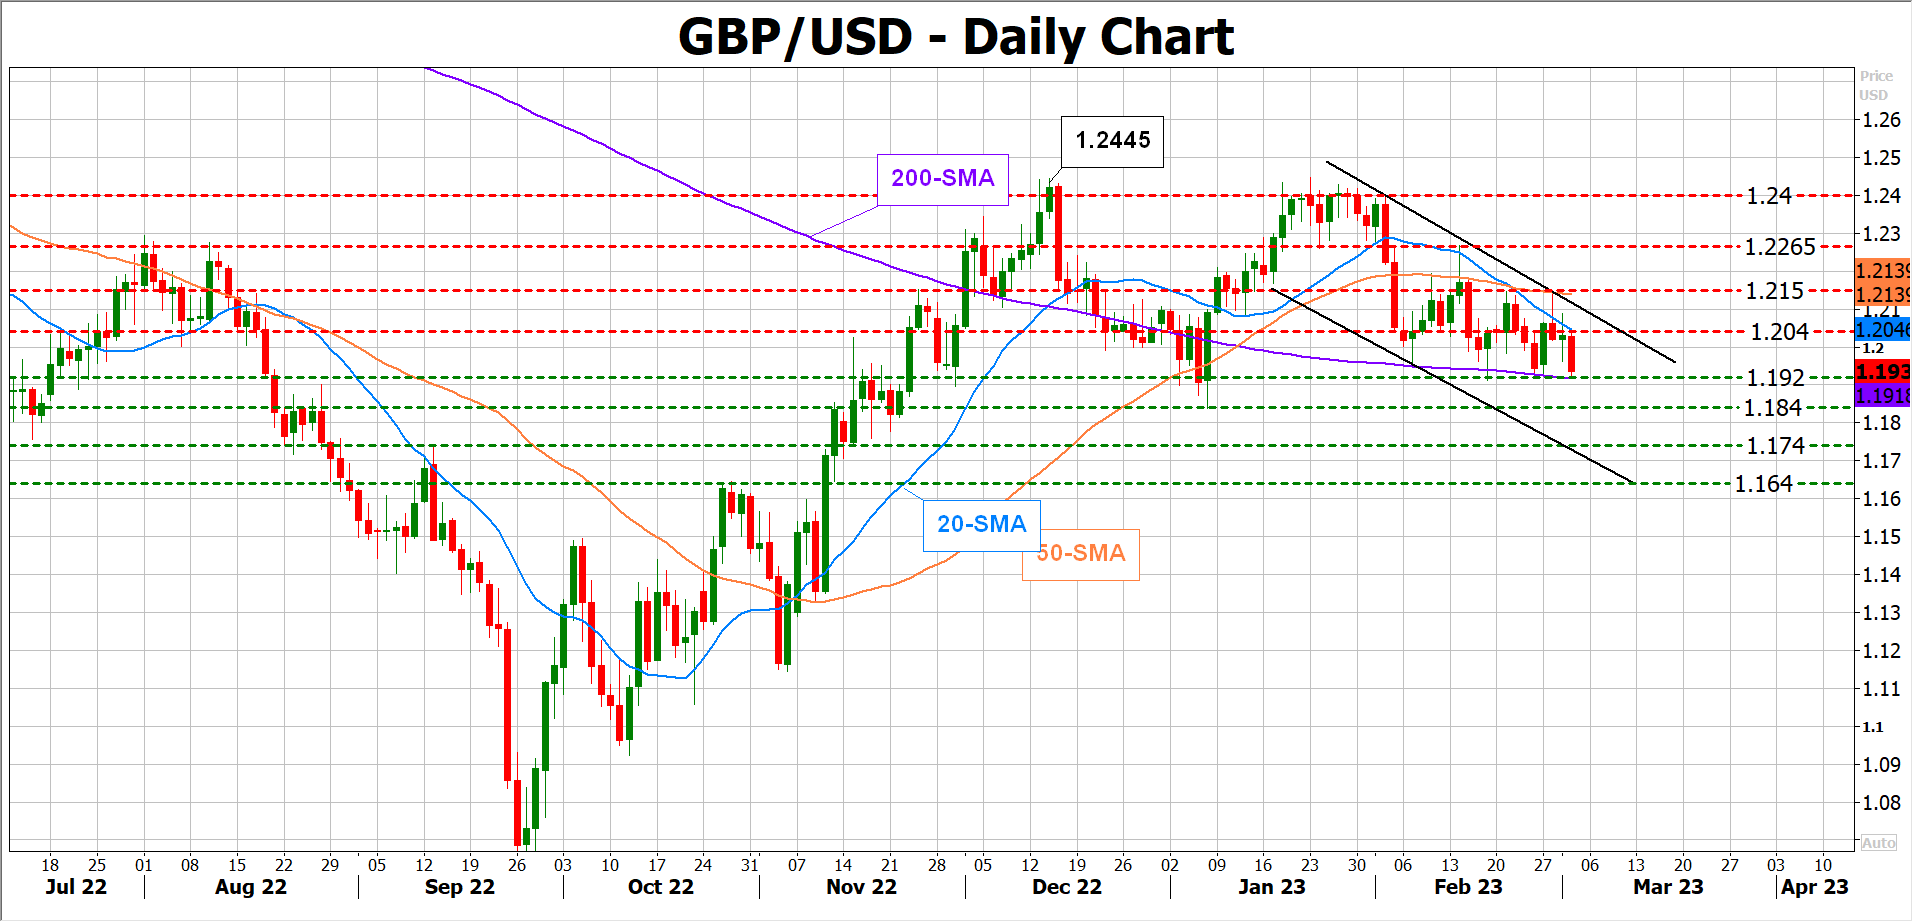
Should the data disappoint, suggesting that a rate peak could come sooner rather than later, GBPUSD may slide below the 200-day simple moving average (SMA) at 1.1920 to test January’s low of 1.1840. A step lower would signal a bearish trend reversal, bringing the 1.1740 support region next into view ahead of the 1.1640 barrier.
Alternatively, upbeat readings could back expectations for a higher rate peak, sending the pair above the constraining 20-day SMA at 1.2040. The 50-day SMA and the 1.2150 resistance could be the next challenge. If the bulls knock down that wall, the recovery could extend up to 1.2265 and then towards the 1.2400 zone.
A surprise DUP approval of the Windsor agreement could add more fuel to the rally.