Sample Category Title
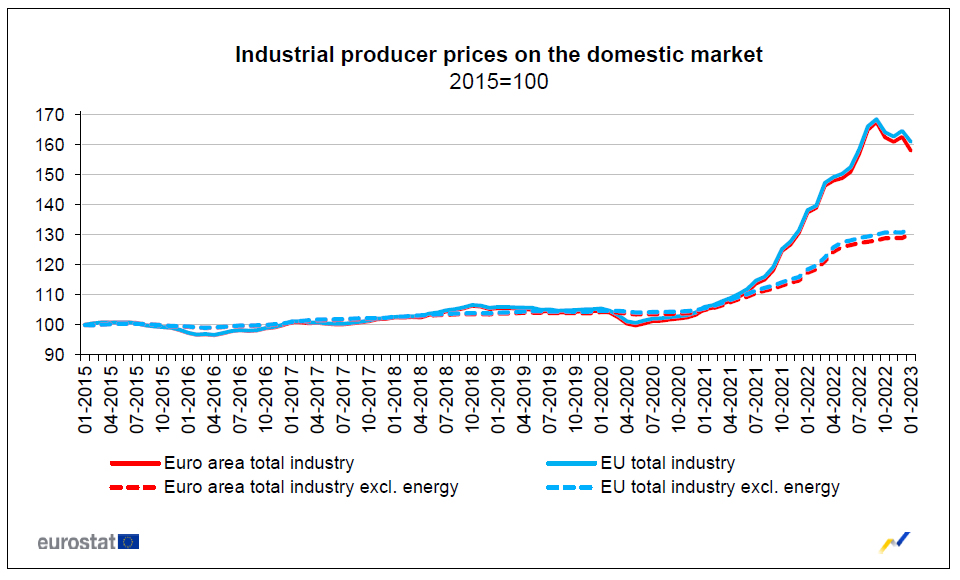
Eurozone PPI at -2.8% mom, 15.0% yoy in Jan
Eurozone PPI fell -2.8% mom in January, below expectation of -0.3% mom. Compared with January 2022, industrial producer prices increased by 15.0% yoy, below expectation of 17.7% yoy.
For the month, industrial producer prices in Eurozone decreased by -9.4% mom in the energy sector, while prices increased by -0.8% mom for intermediate goods, by -1.2% mom for capital goods, by -1.5% mom for non-durable consumer goods and by -1.6% mom for durable consumer goods. Prices in total industry excluding energy increased by 1.1% mom.
EU PPI was at -2.2% mom, 16.4% yoy. The largest monthly decreases in industrial producer prices were recorded in Ireland (-25.2%), Sweden (-8.0%) and Latvia (-5.8%), while the highest increases were observed in Slovakia (9.0%), Czechia and Hungary (both 5.8%) and Austria (4.9%).
USD/JPY Outlook: Bulls Continue to Face Headwinds at Key Fibo Resistance
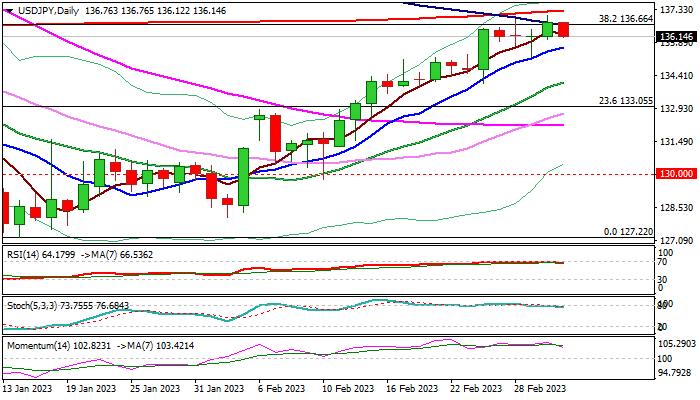
Bulls continues to face strong headwinds at key Fibo barrier at 136.66 (38.2% retracement of 151.94/127.22 downtrend), reinforced by falling 100DMA.
Friday’s price action showed repeated failure to sustain break above this barrier, suggesting that the pair is likely to remain in extended sideways mode, awaiting fresh direction signal.
Prevailing bullish tone on daily chart supports the action, though fading positive momentum and bearish divergence of 14-d momentum indicator, would keep larger bulls on hold in coming sessions.
Consolidation should remain above rising 10DMA (135.66) to keep immediate bullish bias intact, but deeper dips towards 134.10 zone (rising 20DMA / Feb 24 trough) would be still seen as a healthy correction, not very harmful for larger bulls.
On the other hand, fundamentals are weakening as initial strong positive sentiment on expectations that the Fed will continue to raise interest rates and possibly increase the pace of tightening, was tempered by calmer rhetoric from US policymaker, who signaled that the central bank would stick to gradual rate hikes.
Also, China’s economic activity accelerated above expectations, as post-Covid recovery gained momentum, signaling that the economy would grow faster and above initial forecasts, which would additionally weigh on the US currency.
Markets await release of US ISM non-manufacturing PMI (Feb 54.5 f/c vs Jan 55.2), due later today.
Res: 136.66; 137.09; 137.30; 137.80.
Sup: 135.66; 135.25; 134.96; 134.12.
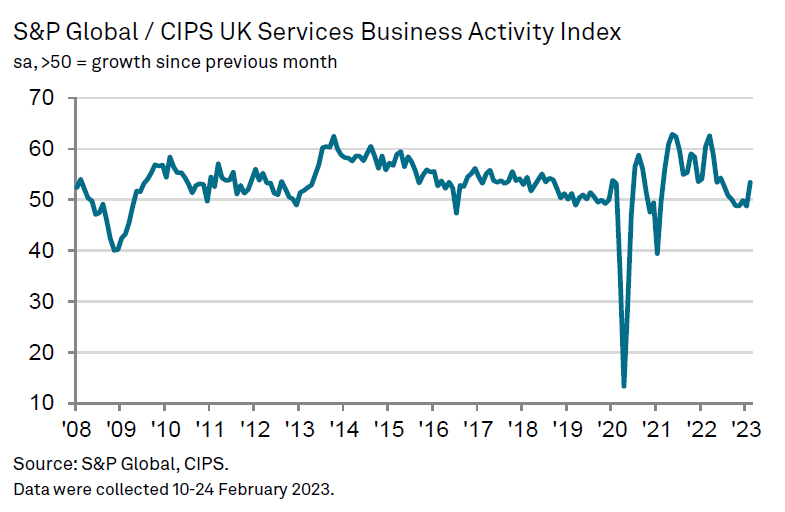
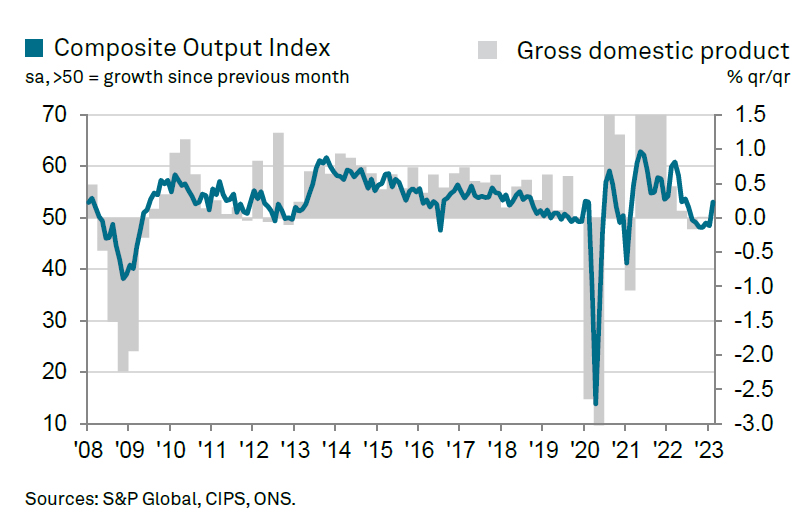
UK PMI services finalized at 53.5, fading recession fears and improving business confidence
UK PMI Services was finalized at 53.5 in February, up from January's 48.6. PMI Composite was finalized at 53.1, up from prior month's 48.5. Both were their strongest readings since June 2022.
Tim Moore, Economics Director at S&P Global Market Intelligence, said: "UK service providers moved back into expansion mode in February as fading recession fears and improving business confidence resulted in the strongest rise in new orders since May 2022. However, elevated borrowing costs and stretched household finances remained constraints on growth.
"There was clear evidence that input price inflation has peaked, with the latest increase in average cost burdens the weakest since June 2021... Tight labour market conditions and the need to alleviate squeezed margins continued to limit the degree to which falling cost pressures were passed on to end consumers."
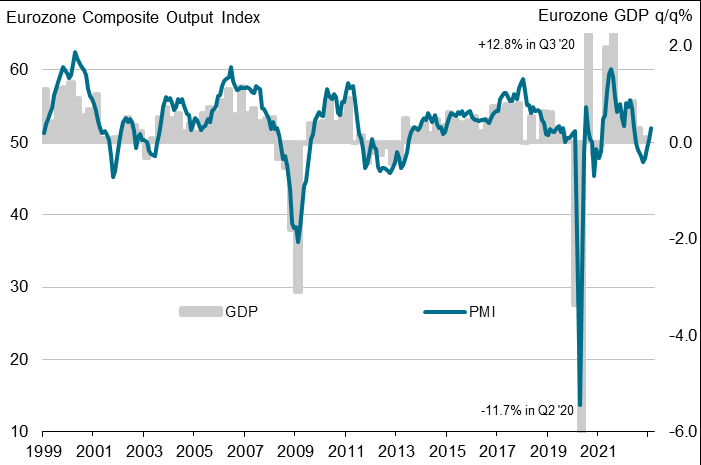
Eurozone PMI composite finalized at 52 in Feb, a resounding expansion of business activity
Eurozone PMI Services was finalized at 52.7 in February, up from January's 50.8. PMI Composite was finalized at 52.0, up from prior month's 50.3. Both were at their 8-month highs.
Looking at some member state, PMI composite improved in Spain (55.7, 9-month high), Ireland (54.5, 9-month high), Italy (52.2, 9-month high), France (51.7, 7-month high) and Germany (50.7, 8-month high).
Chris Williamson, Chief Business Economist at S&P Global Market Intelligence said: "A resounding expansion of business activity in February helps allay worries of a eurozone recession, for now. Doubts linger about the underlying strength of demand... Nevertheless, there are clear signs that business confidence has picked up from the lows seen late last year...
"There is a concern, however, that signs of persistent elevated selling price inflation, combined with the surprising resiliency of the economy, will embolden the ECB into more aggressive monetary policy tightening, which poses a downside risk to demand growth in the months ahead."
USDCAD Loses Steam Within a Trading Range
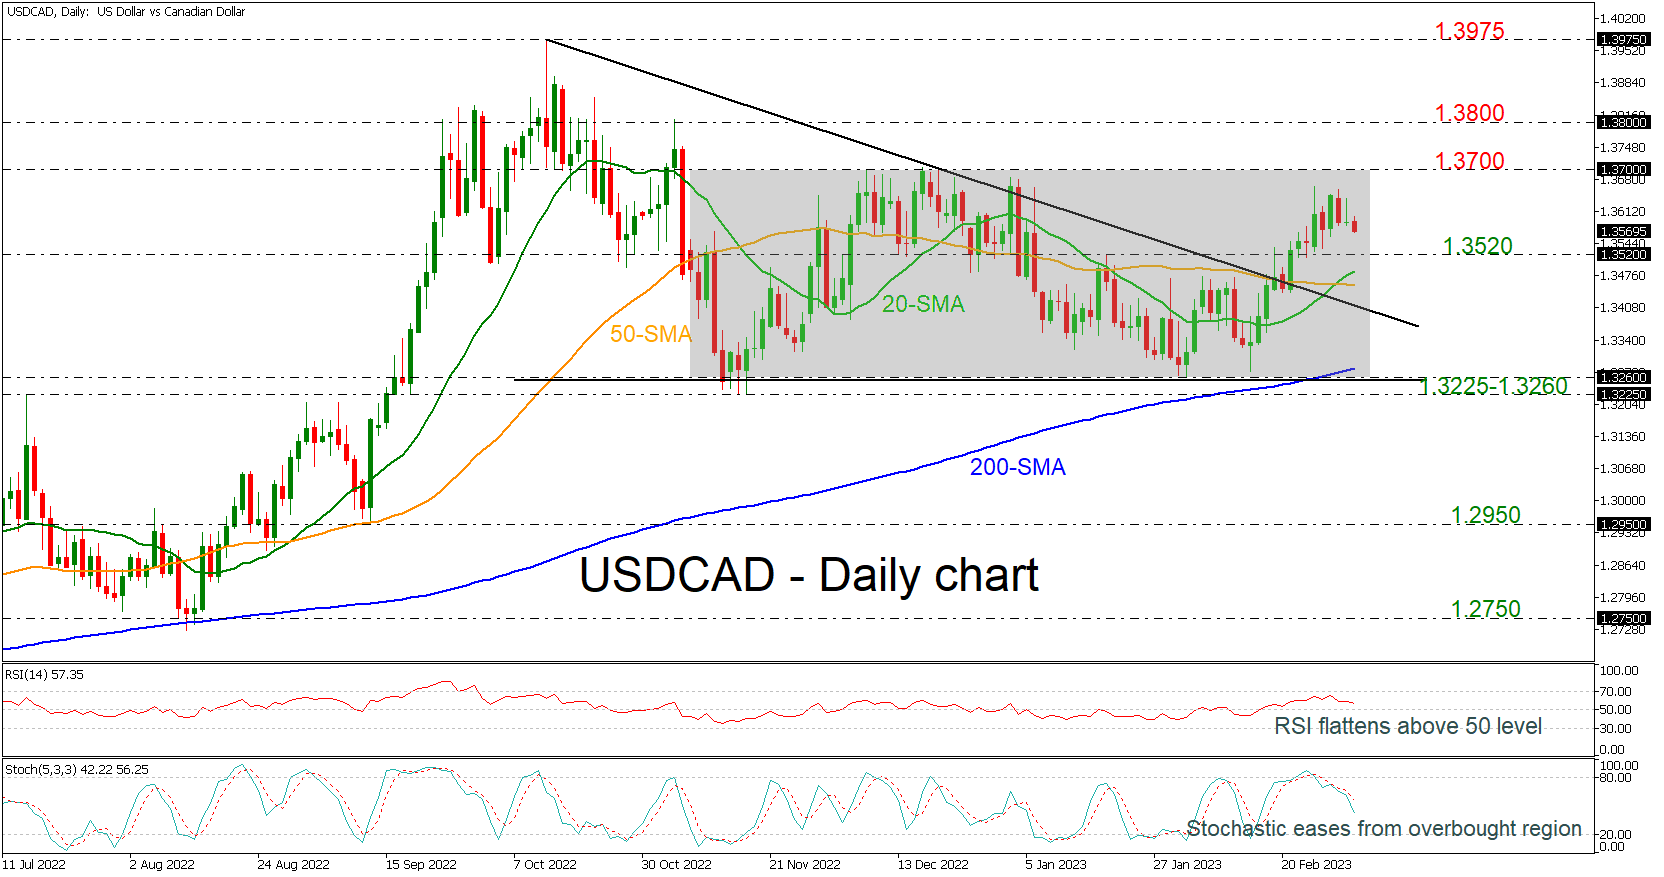
USDCAD has been on the sidelines over the last four months as 1.3700 seems to be a real struggle for the bulls. In the near-term, the market is losing steam but the bounce off 1.3225 remains on cards.
Technically, the RSI is changing direction to the downside and towards its 50 neutral mark, while the stochastics are dropping from the overbought region after the %K and the %D lines posted a bearish cross. Also, the 20- and the 50-day simple moving averages (SMAs) recorded a bullish crossover in the short-term.
A potential rebound off the 1.3520 support may keep the upside move with the next obstacle coming from the 1.3700 and 1.3800 psychological marks. Higher, the peak of 1.3975 may also prove a challenge.
Alternatively, a decline under 1.3520, could meet a strong barrier between the 20- and the 50-day SMA at 1.3460. Even lower, the 200-day SMA at 1.3280 and the lower boundary of the trading range at 1.3260 could halt declines. Any movements beneath 1.3225 could shift the outlook to bearish.
In the medium-term picture, USDCAD is holding within a consolidation area with upper boundary the 1.3700 mark and lower boundary the 1.3260 support. A move above or below the aforementioned levels could dictate the directional tendency.
GBPJPY Hovers Around 200-day SMA after Advance Falters
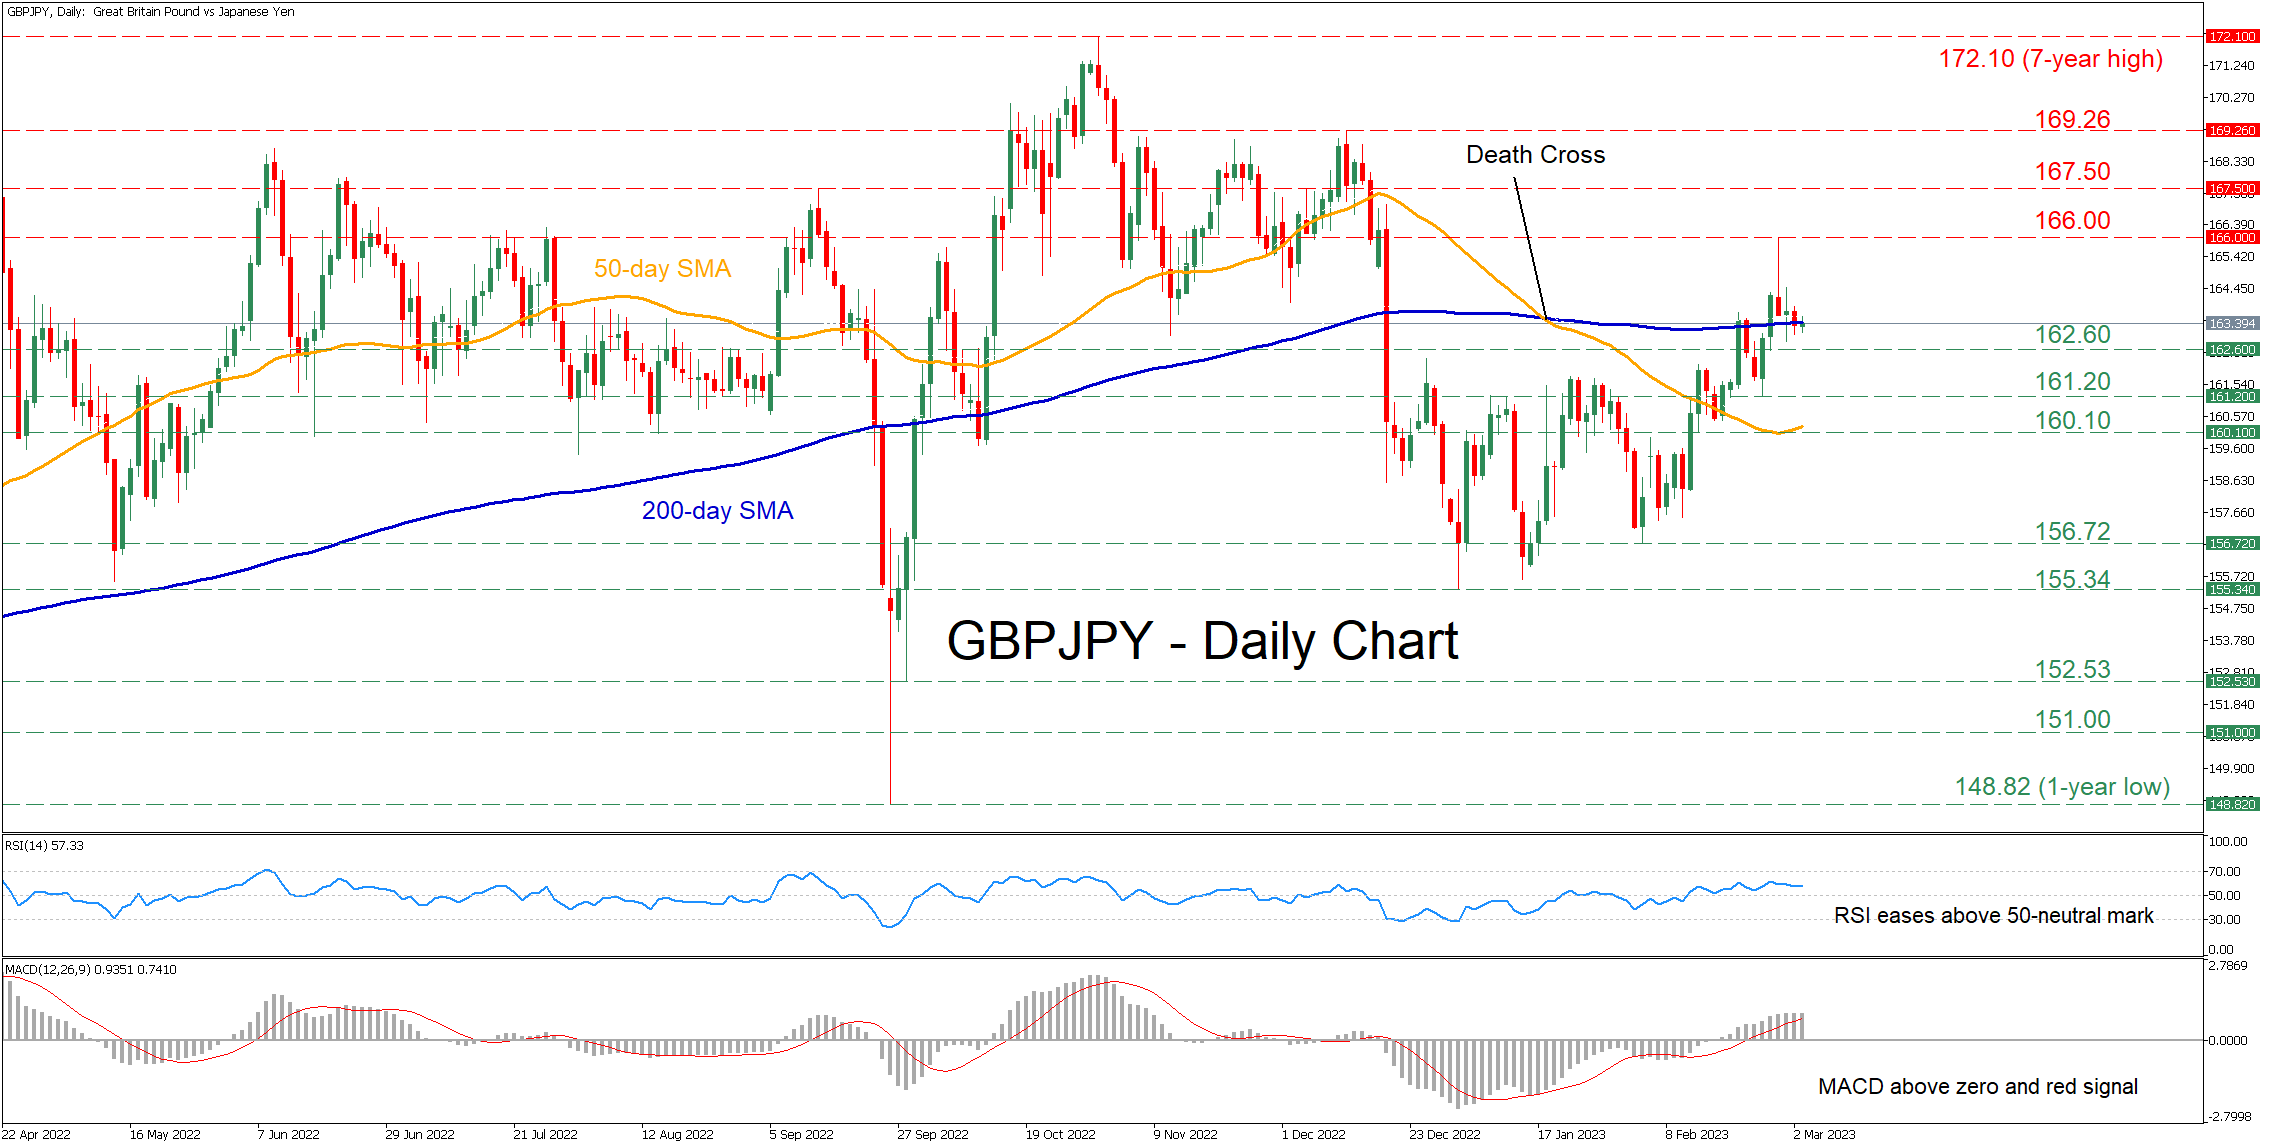
GBPJPY has been steadily gaining ground after finding its feet at the 2023 low of 155.34. In the short-term, the latest rebound seems to have stalled and the price has experienced a moderate pullback despite its temporary break above the 200-day simple moving average (SMA).
The momentum indicators currently suggest that bullish forces remain in control. Specifically, the RSI is flatlining above its 50-neutral mark, while the MACD histogram is strengthening above both zero and its red signal line.
If the positive momentum strengthens, the pair could test its recent rejection region of 166.00. Piercing through that zone, the bulls might aim for the September peak of 167.50 before the spotlight turns to the 169.26 hurdle. A break above the latter may pave the way for the seven-year high of 172.10.
On the flipside, should the price drop beneath the 200-day SMA, initial support could be found at the 162.60 barrier. Violating this territory, the pair might descend towards the February support of 161.20 or lower to challenge 160.10. Failing to halt there, further declines could cease at the February low of 156.72.
In brief, GBPJPY retraced lower after its advance got rejected, but near-term risks remain tilted to the upside. Therefore, a clear close above the 200-day SMA could revive the bulls' hopes for the continuation of the recent upside move.
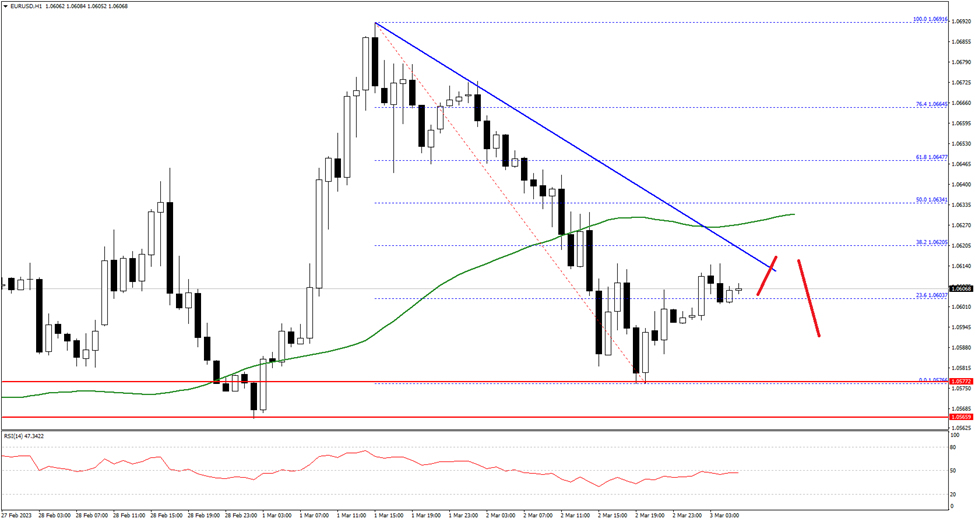
EUR/USD Pair Consolidating With Resistance Near 1.0615
The Euro started a fresh decline from the 1.0685 zone against the US Dollar. The EUR/USD pair traded below the 1.0655 level to move into a bearish zone.
The pair even traded below the 1.0625 level and the 50 hourly simple moving average. The bears pushed the pair below 1.0600 and low is formed near 1.0576. It is now consolidating, with an immediate resistance near the 1.0615 level.
The first major resistance is near the 1.0630 level and the 50 hourly SMA. A break above the 1.0630 resistance level could start another increase. In the stated case, it could rise towards the 1.0655 resistance.
Conversely, the pair might continue to move down below 1.0575 on FXOpen. The next key support is near 1.0550, below the pair could drop towards the 1.0515 level. Any more losses might send the pair towards the 1.0485 level in the near term.
XAG/USD: Bearish Wave X Completion Signals the Beginning of a Bullish Wave Z
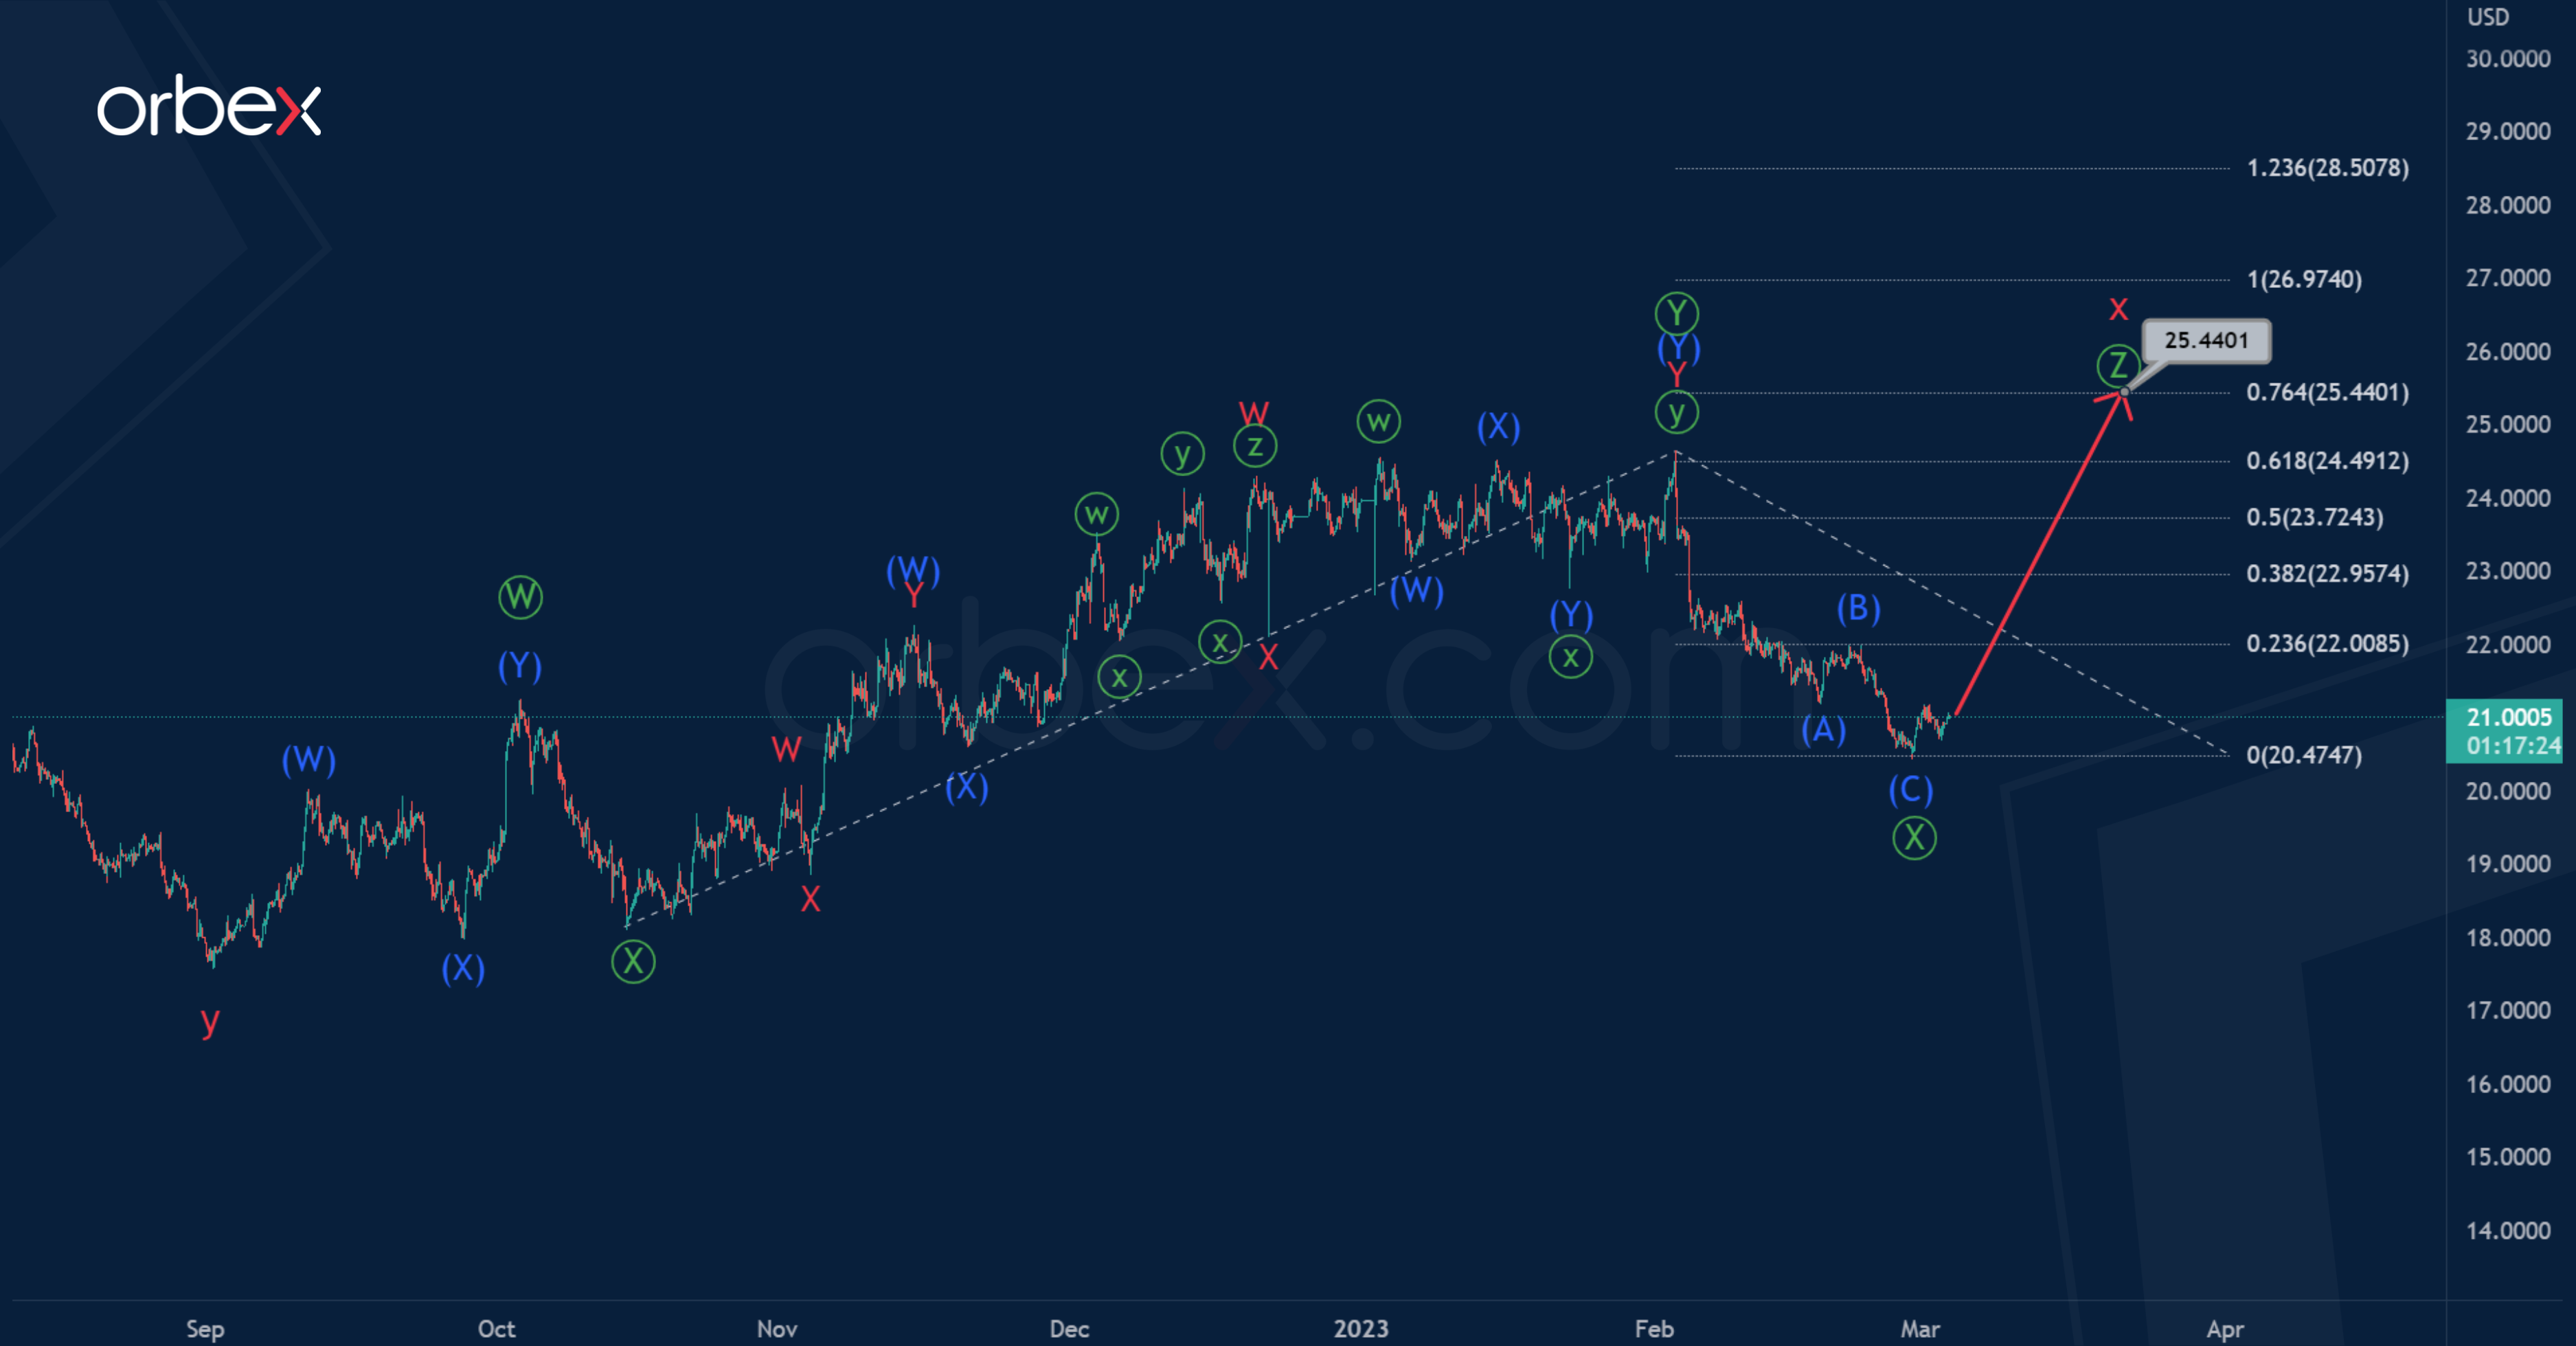
XAGUSD suggests the formation of a global triple zigzag consisting of cycle waves w-x-y-x-z.
On the current chart, we can see the internal structure of the second intervening wave x, which may soon be completed, taking the form of a triple zigzag of the primary degree Ⓦ-Ⓧ-Ⓨ-Ⓧ-Ⓩ.
The primary wave Ⓨ consists of intermediate waves (W)-(X)-(Y) and looks finished. Perhaps the primary intervening wave Ⓧ could also come to an end, at the moment it has the form of a zigzag (A)-(B)-(C).
Now market participants can expect growth in the primary wave Ⓩ to 25.440. At that level, it will be at 76.4% of wave Ⓨ.
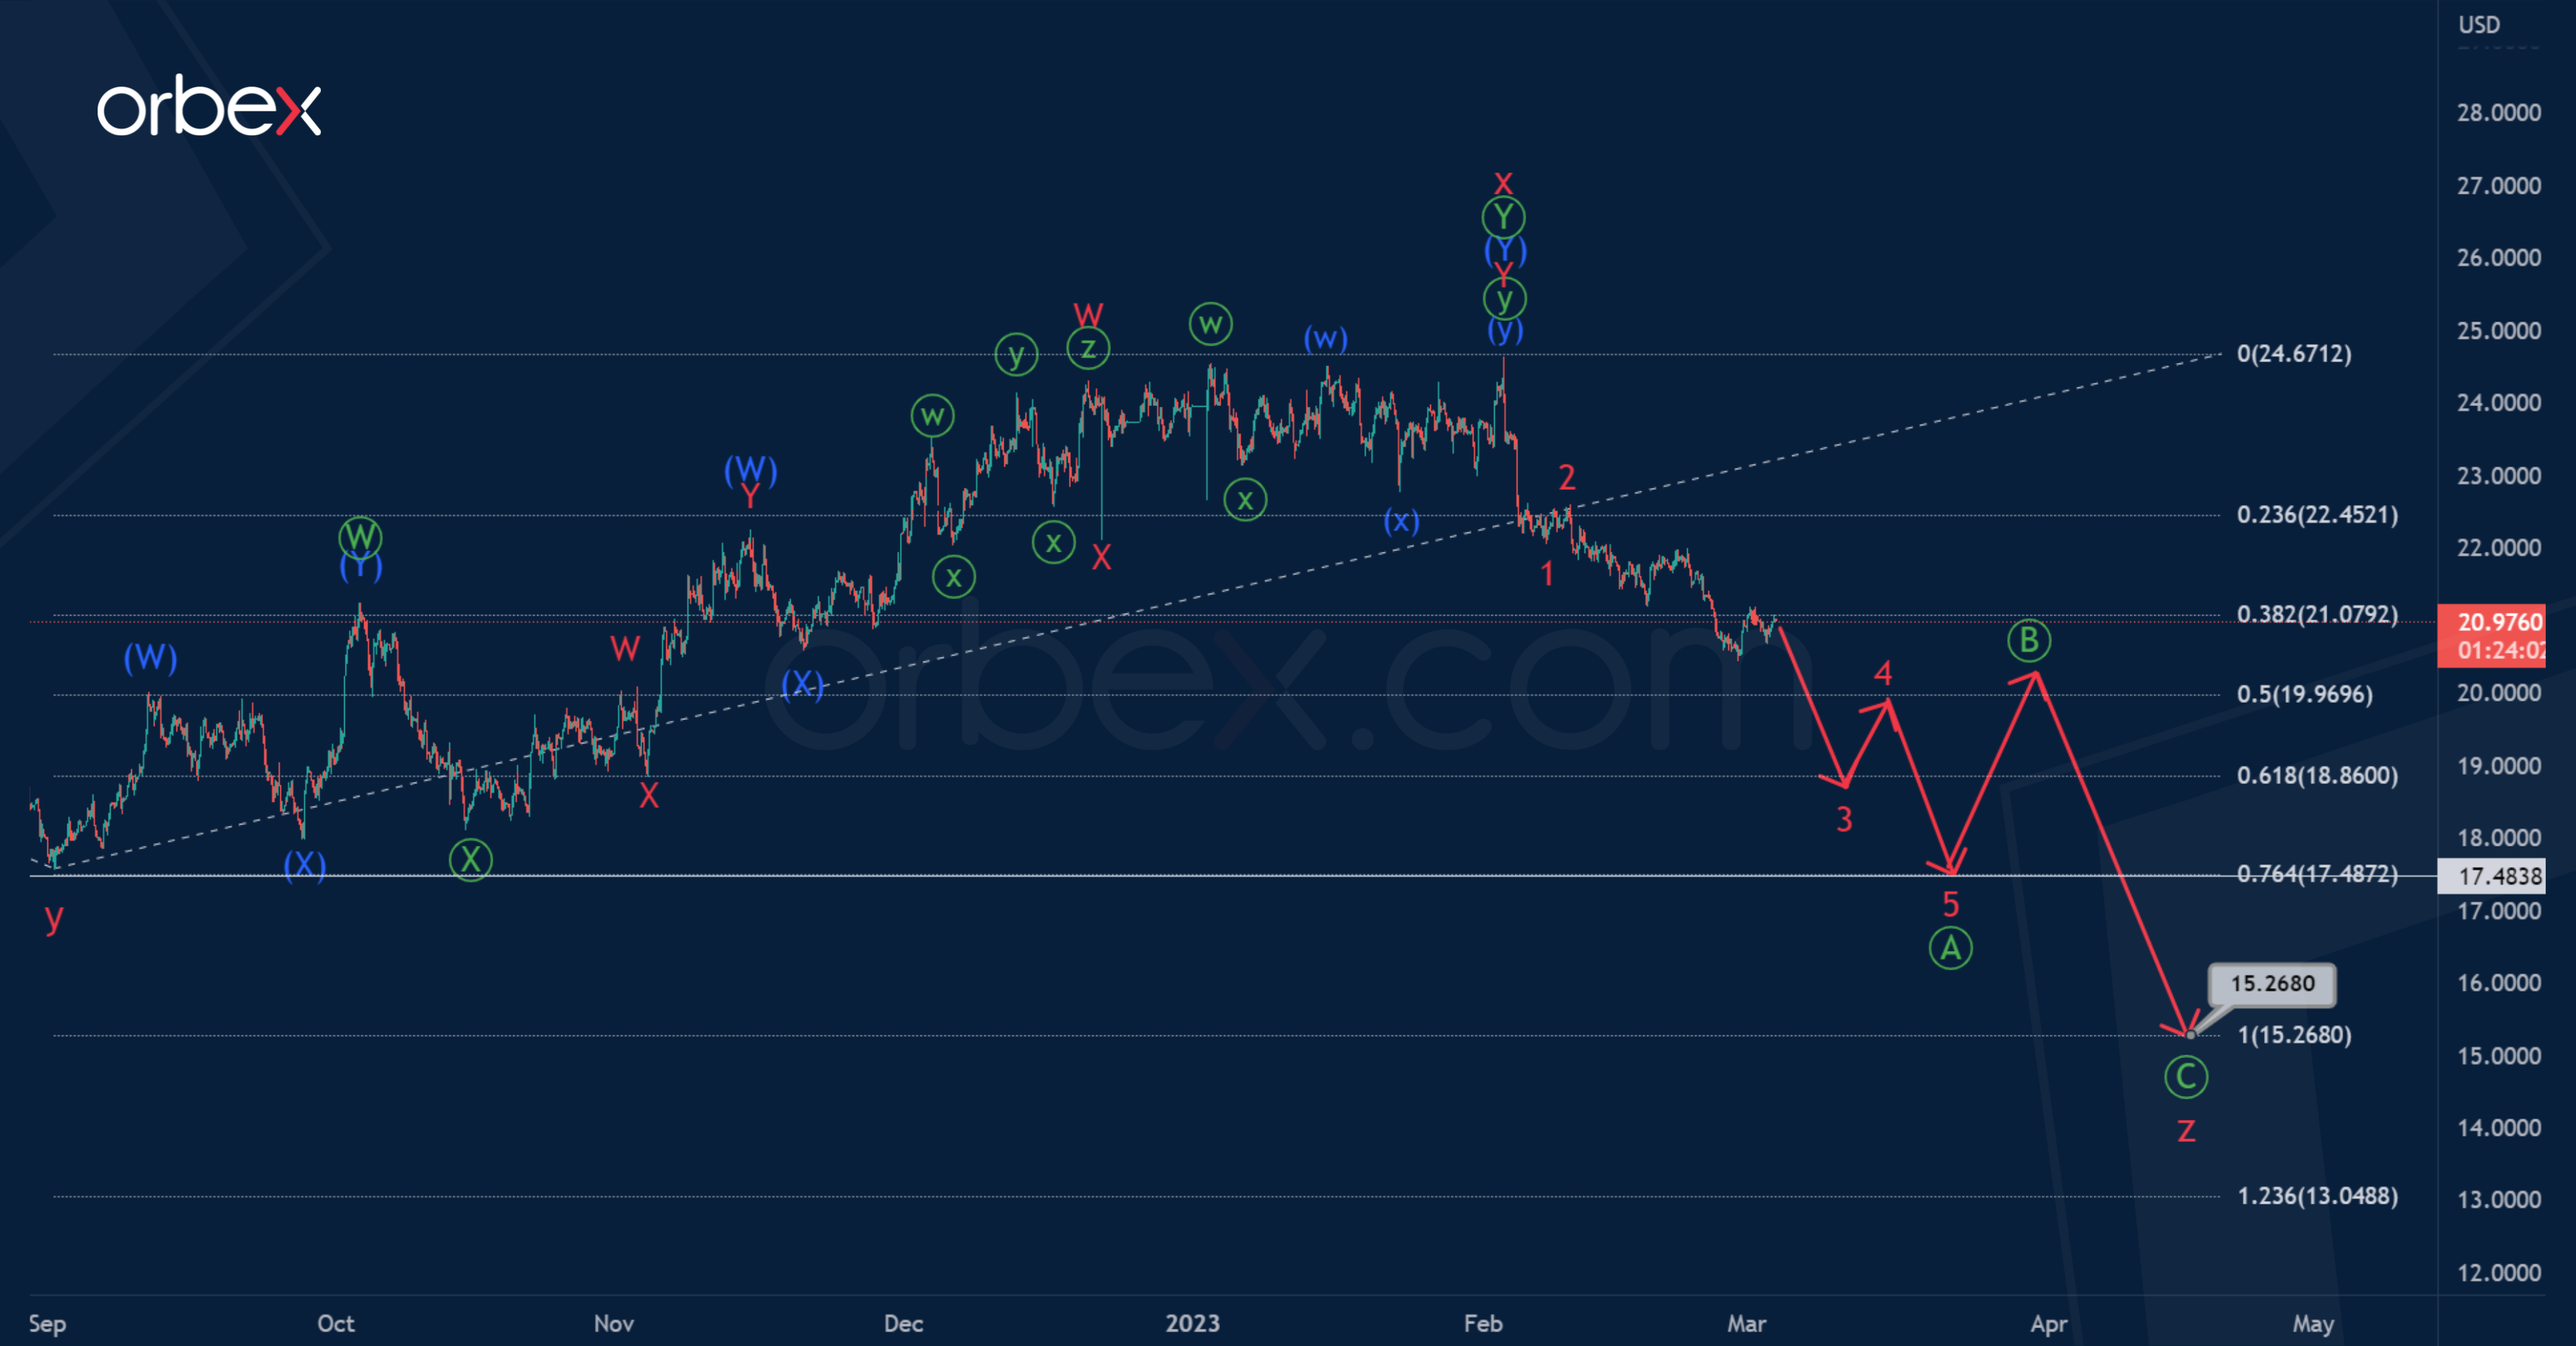
Let's now look at an alternative markup option, where the development of the cycle intervening wave x has already been completed, and in the last section we see the initial part of a new bearish wave z.
Perhaps wave z will be a standard zigzag, as shown on the chart, and will complete its pattern near 15.268. At that level, it will be at 76.4% of actionary wave y.
The nearest target where the price can reach is the level of 17.483, which is marked by a cycle wave y. Here the impulse sub-wave Ⓐ can be completed, and an upward correction Ⓑ can begin.
Nasdaq 100 Sees Limited Bounce
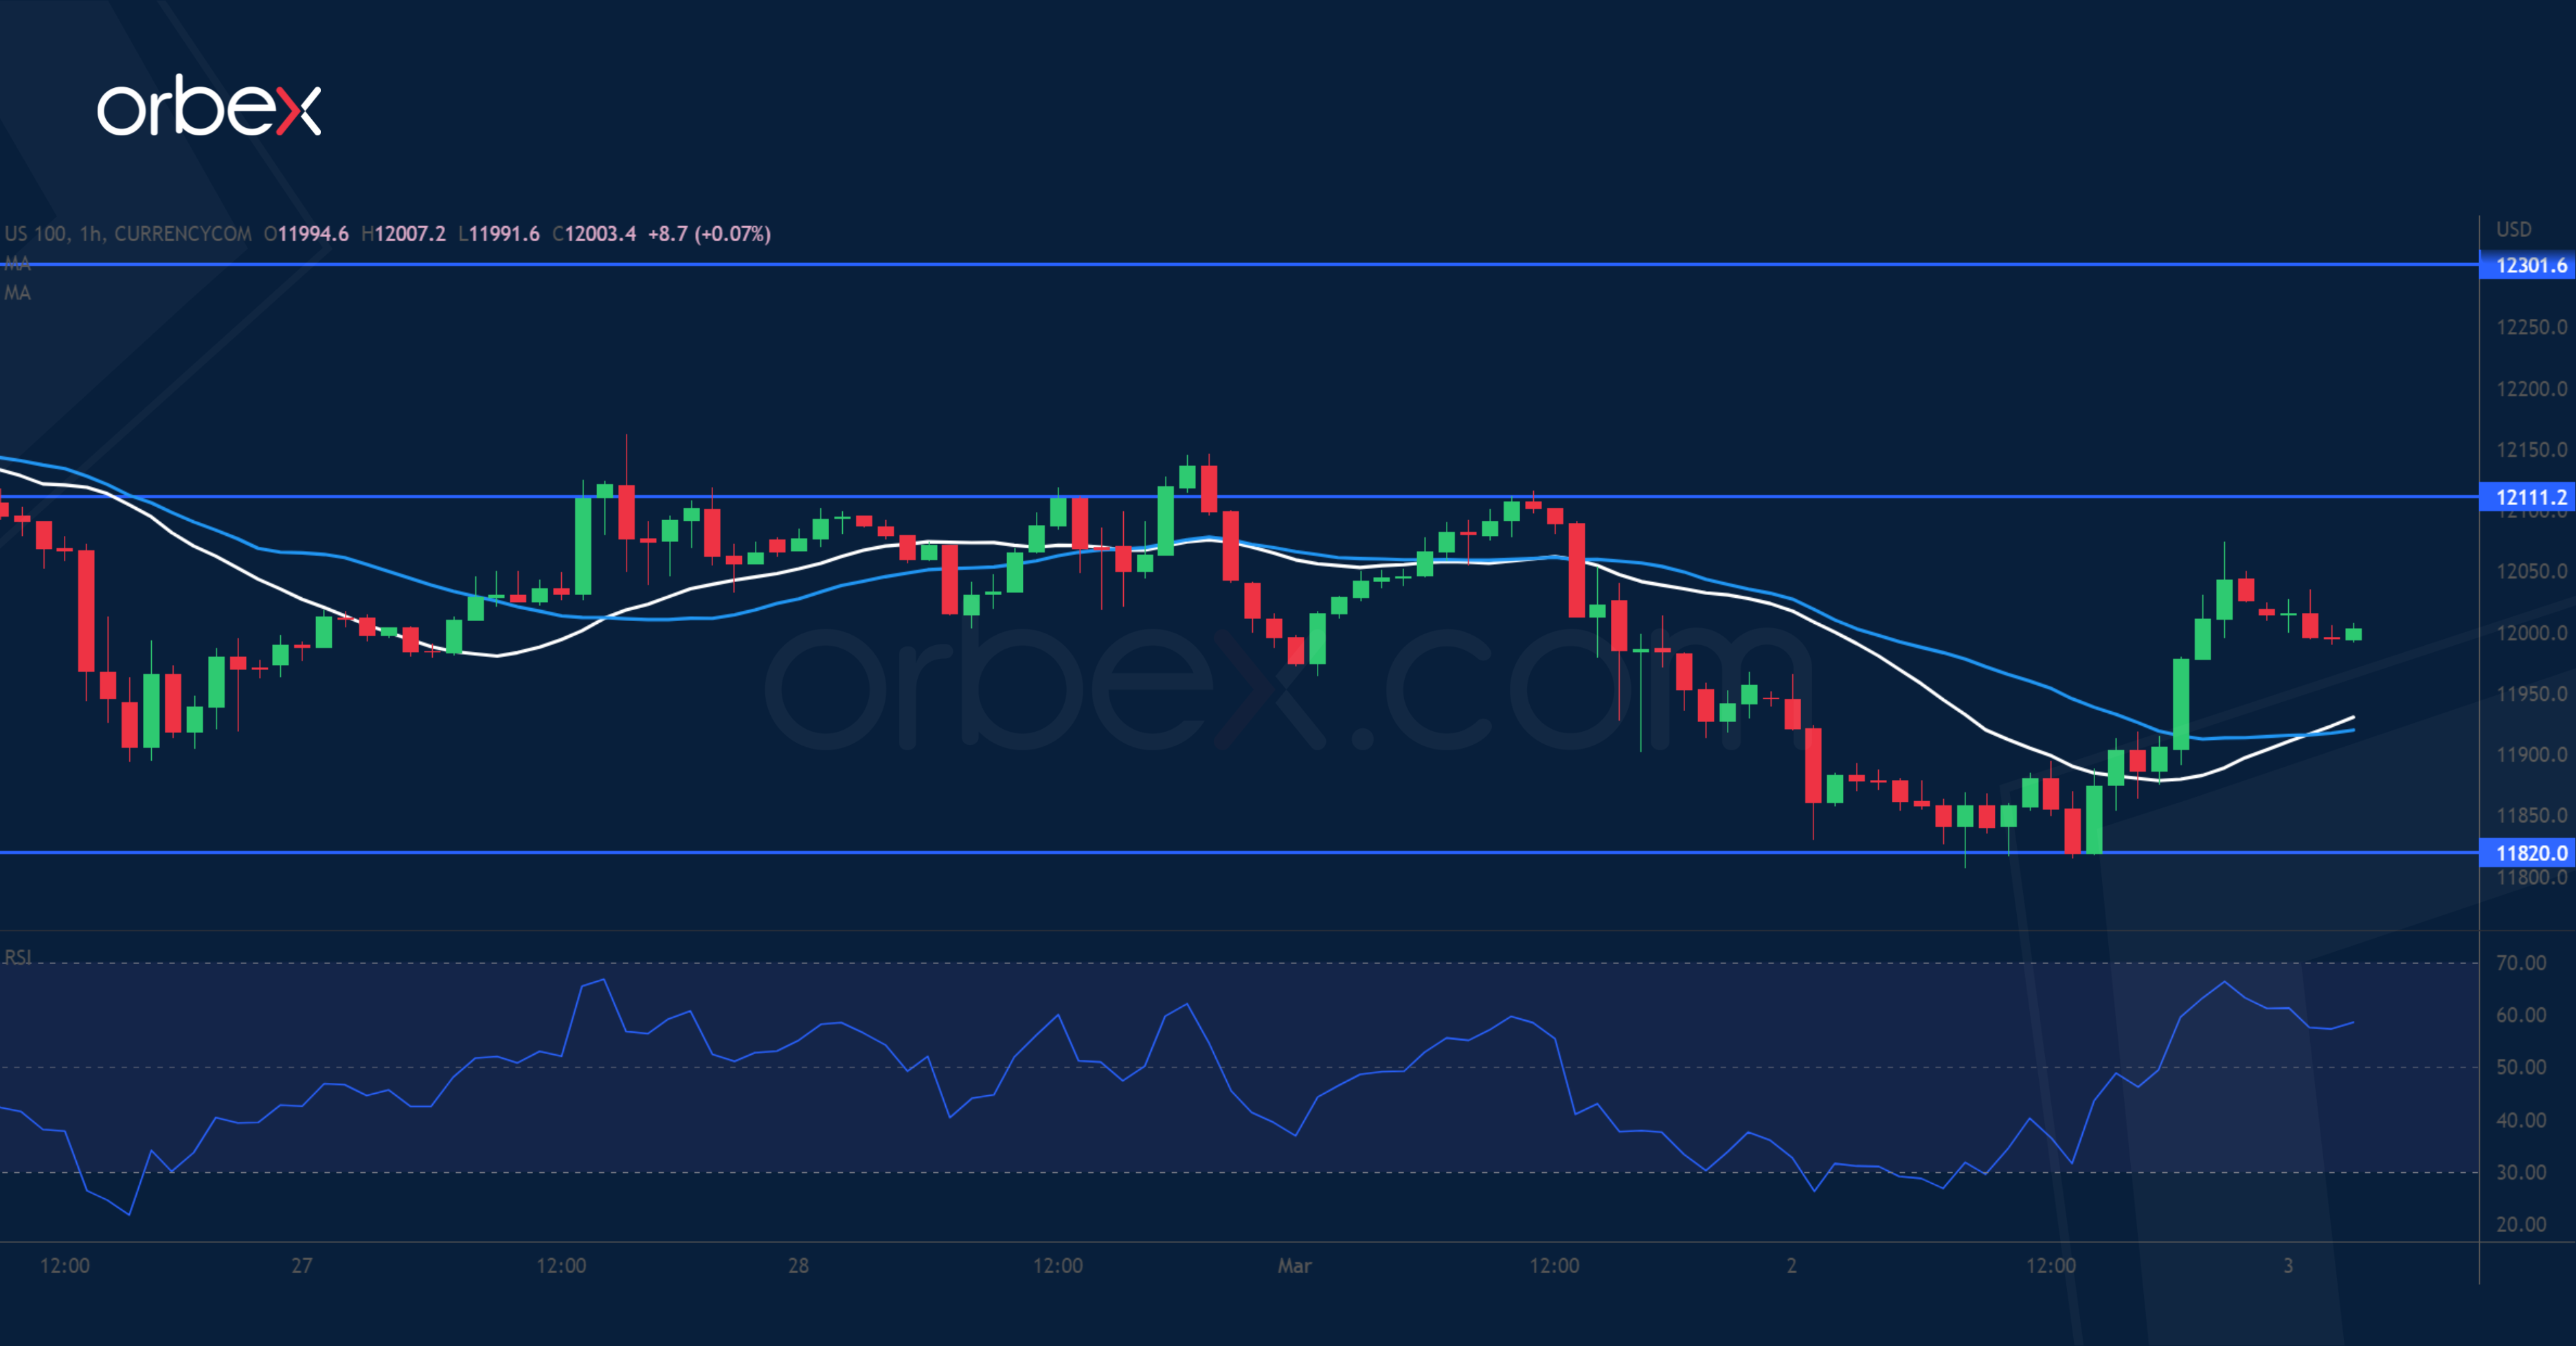
The Nasdaq 100 struggles over rising labour costs in the fourth quarter. On the daily chart, a fall below the SMAs has put the index on a corrective course after a month-long rally. A former swing low at 11820 has attracted some buying interests with the RSI in the oversold zone, but that may not be enough to contain the bearish inertia. 12110 is the first level to expect sellers to step in and sentiment may only turn around if the support-turned-resistance of 12300 is cleared. Otherwise, 11550 would be next.
EUR/GBP Breaks Resistance
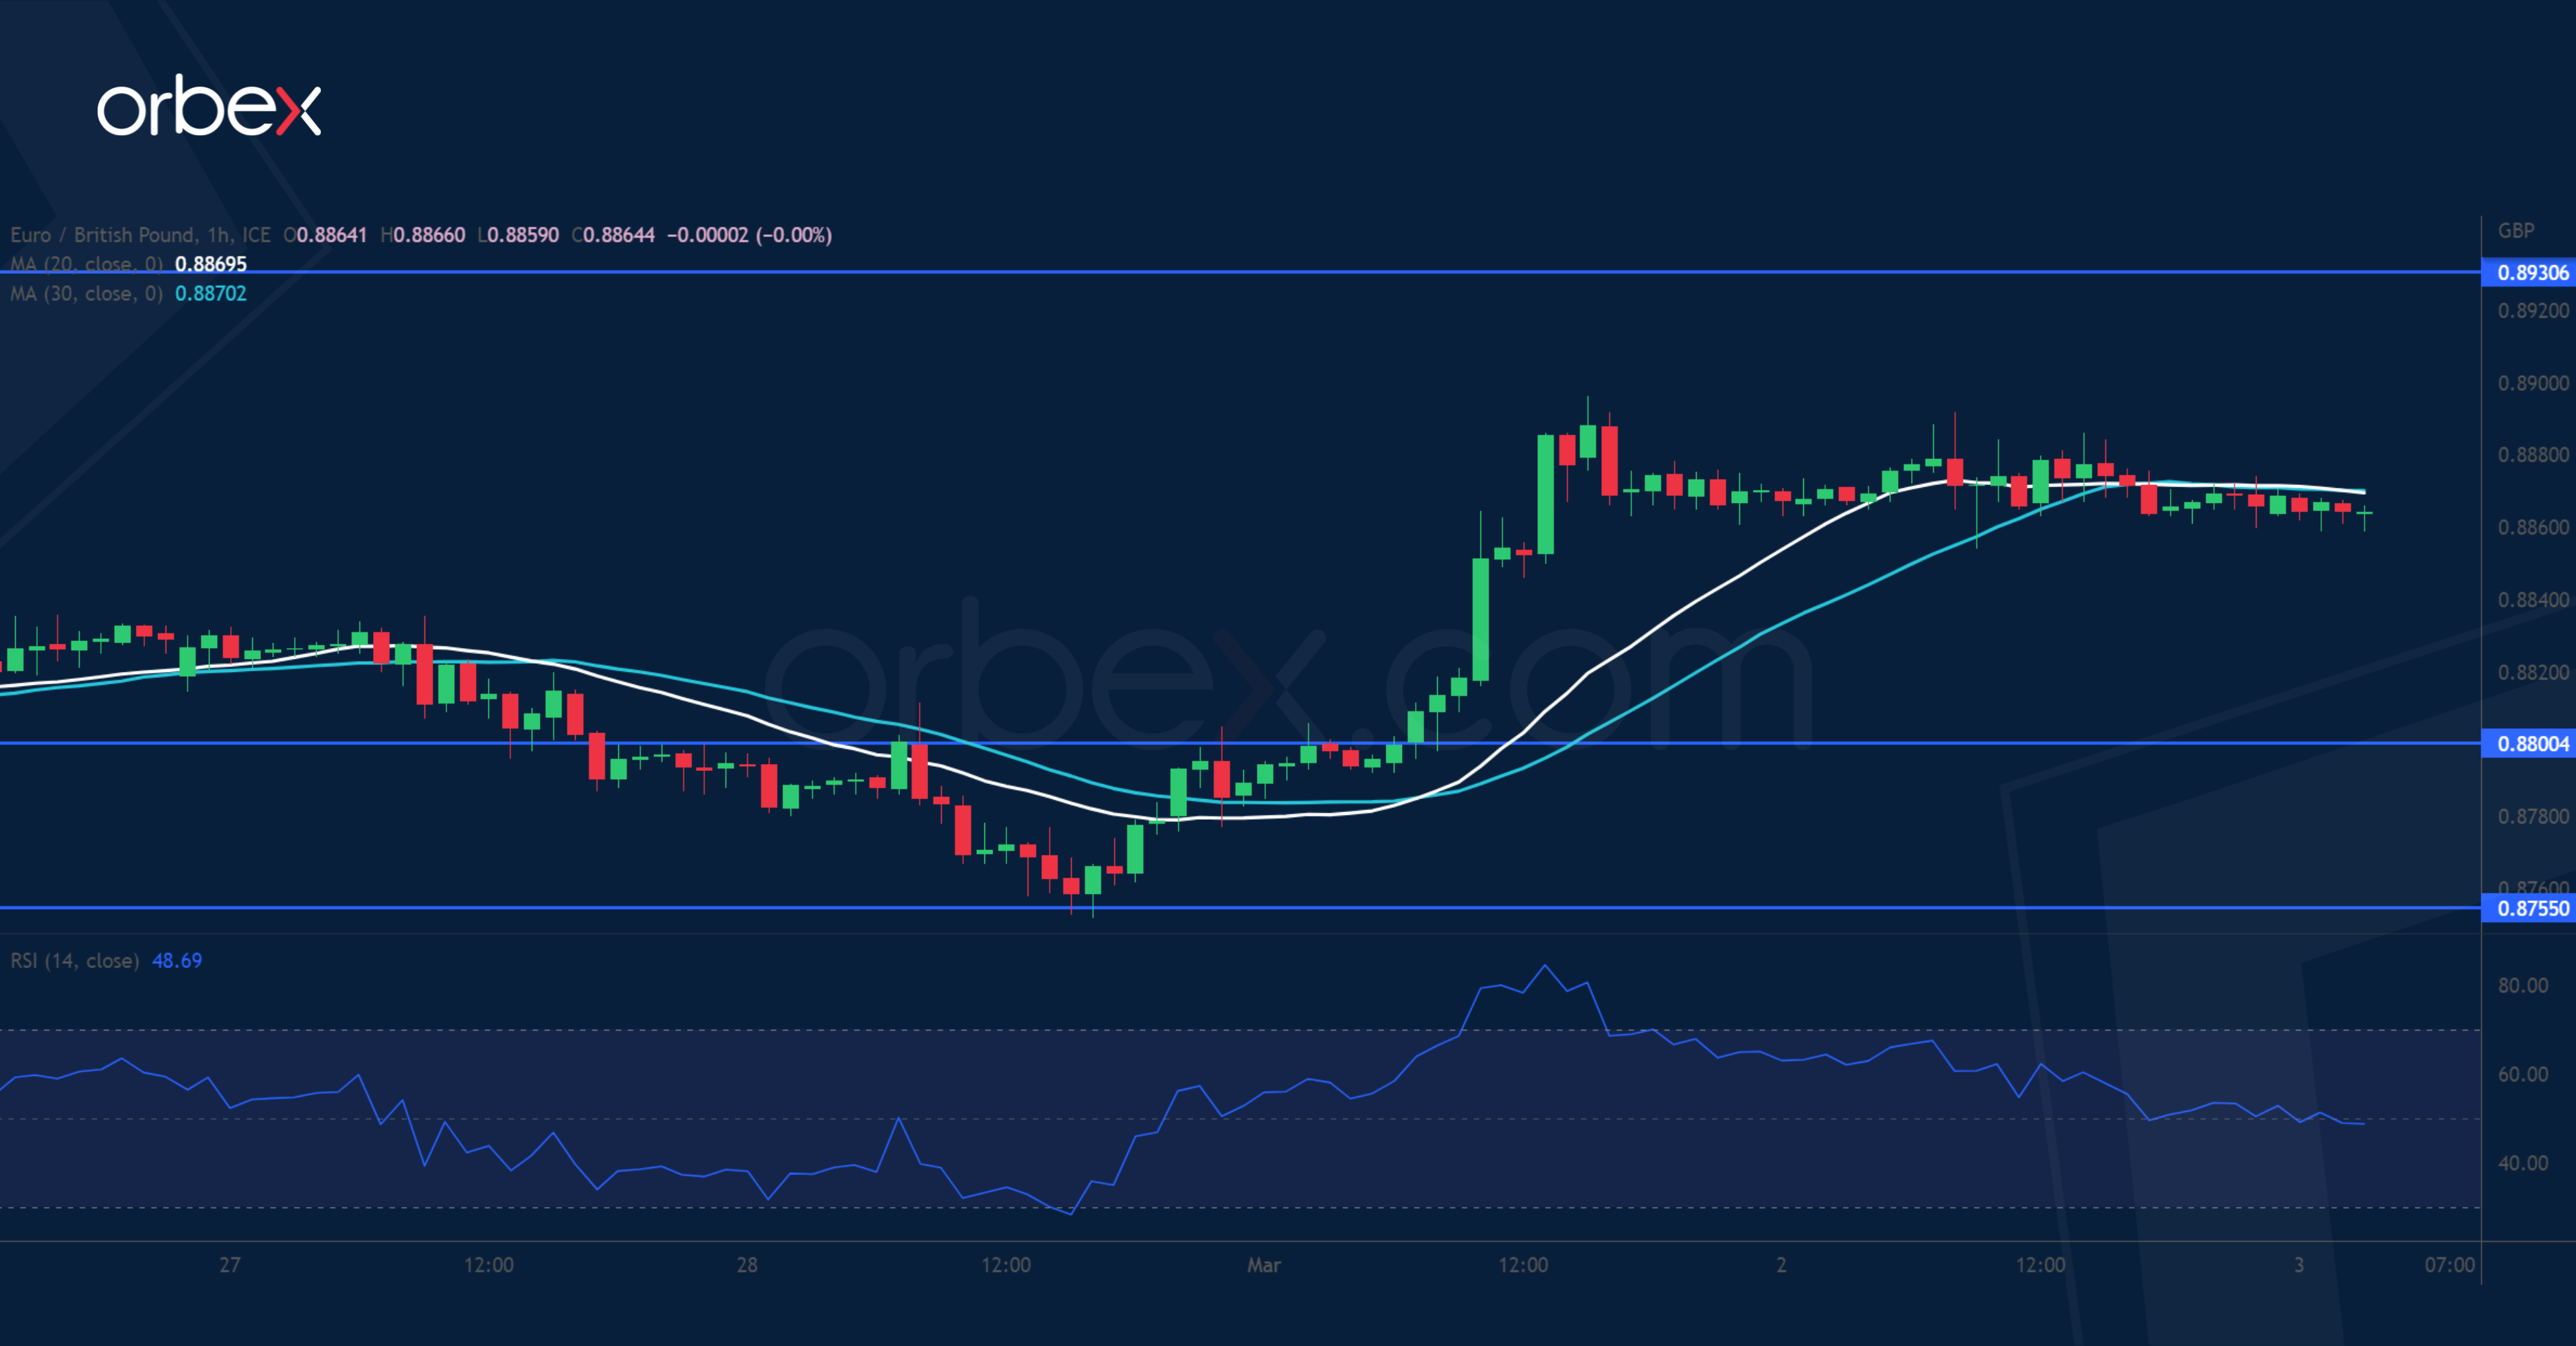
The pound licks wounds after the BoE hinted at pausing its tightening. On the daily chart, a hammer in the 0.8770 demand zone indicates a rejection of further downside and that the market is attempting to bottom out. A strong bullish candle that follows shows that the bulls are back in business. On the hourly chart, this took the shape of a surge above 0.8880, prompting sellers to cover. As the RSI returns to the neutral area, follow-through could be expected above 0.8800 in anticipation of renewed momentum towards 0.8930.