

Sample Category Title
EUR/USD Daily Outlook
Daily Pivots: (S1) 1.0558; (P) 1.0616; (R1) 1.0654; More...
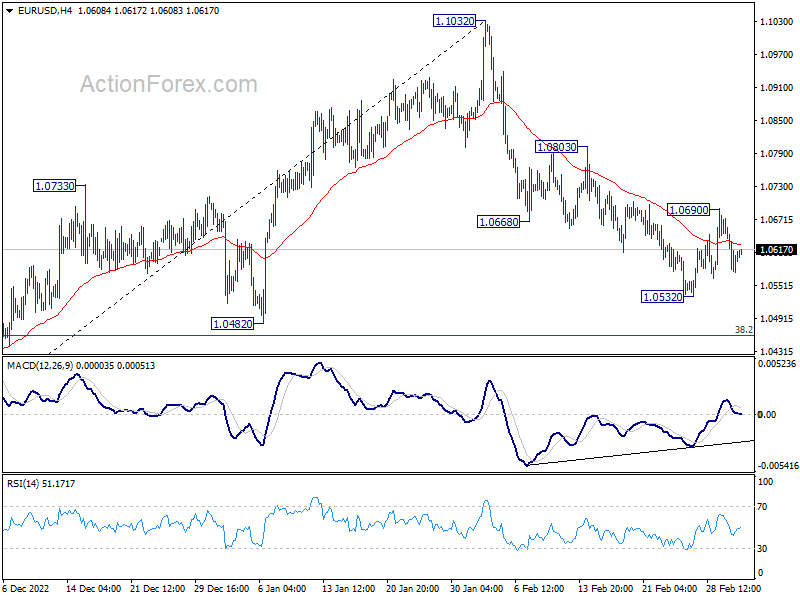
Intraday bias in EUR/USD remains neutral for the moment. Fall from 1.1032 could still extend lower. But strong support is expected from 38.2% retracement of 0.9534 to 1.1032 at 1.0463 to bring rebound. Break of 1.0690 will turn bias back to the upside for 1.0803 resistance first. However, sustained break of 1.0463 will carry larger bearish implication and bring deeper decline.
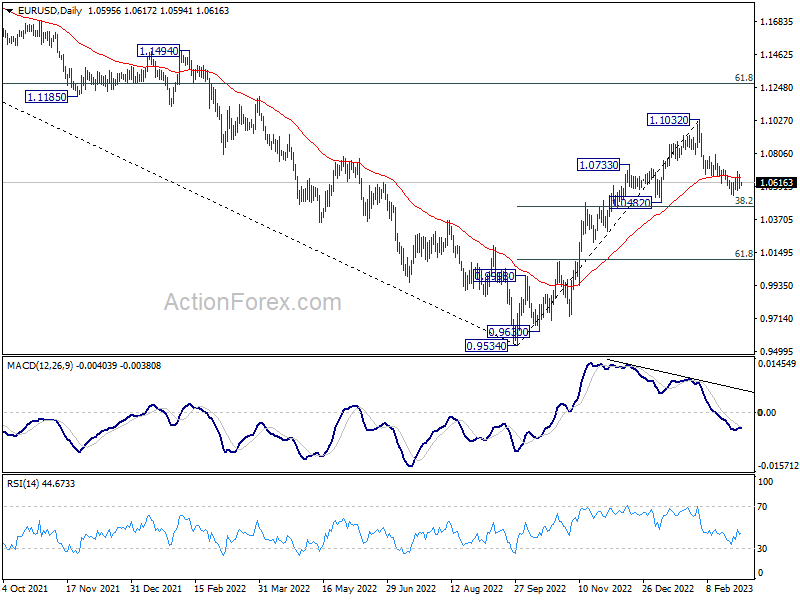
In the bigger picture, as long as 1.0482 support holds, rise from 0.9534 (2022 low) should continue to 61.8% retracement of 1.2348 (2021 high) to 0.9534 at 1.1273. However, sustained break of 1.0482 will bring deeper fall to 61.8% retracement of 0.9534 to 1.1032 at 1.0106, even as a corrective pull back.
GBP/USD Daily Outlook
Daily Pivots: (S1) 1.1904; (P) 1.1970; (R1) 1.2016; More...
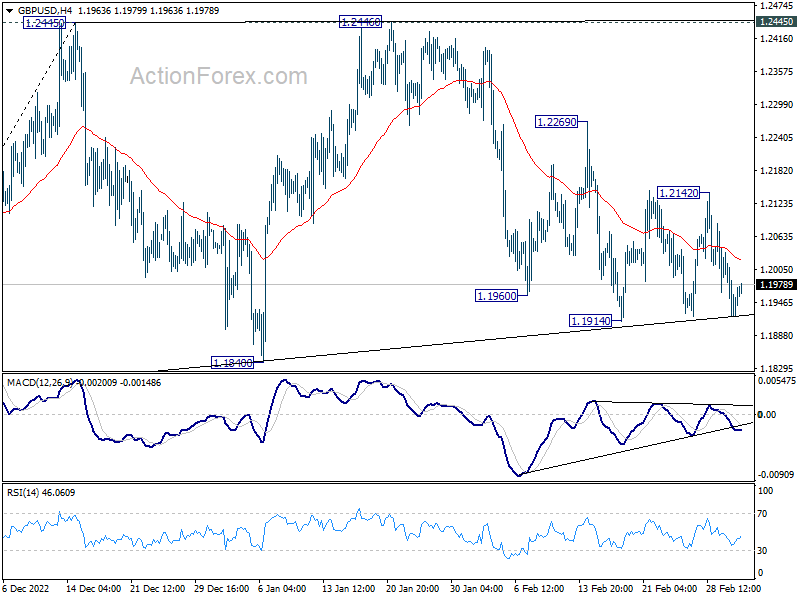
Range trading continues in GBP/USD and intraday bias stays neutral. On the downside, break of 1.1914 will resume the decline from 1.2446, as the third leg of the corrective pattern from 1.2445, for 1.1840 support and possibly below. On the upside, break of 1.2146 resistance will turn bias back to the upside for further rebound to 1.2269 and above.
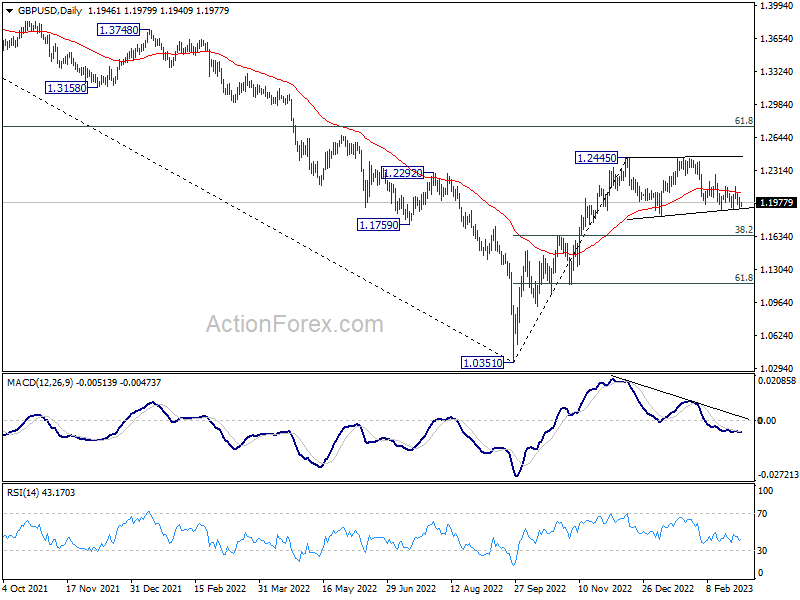
In the bigger picture,as long as 1.1840 support holds, rise from 1.0351 medium term bottom (2022 low) should still continue to 61.8% retracement of 1.4248 (2021 high) to 1.0351 at 1.2759. However, decisive break of 1.1840 will complete a double top pattern (1.2445, 1.2446) after rejection by 55 week EMA (now at 1.2251). Deeper decline should be seen back to 38.2% retracement of 1.0351 to 1.2445 at 1.1645.
USD/CHF Daily Outlook
Daily Pivots: (S1) 0.9397; (P) 0.9418; (R1) 0.9446; More...
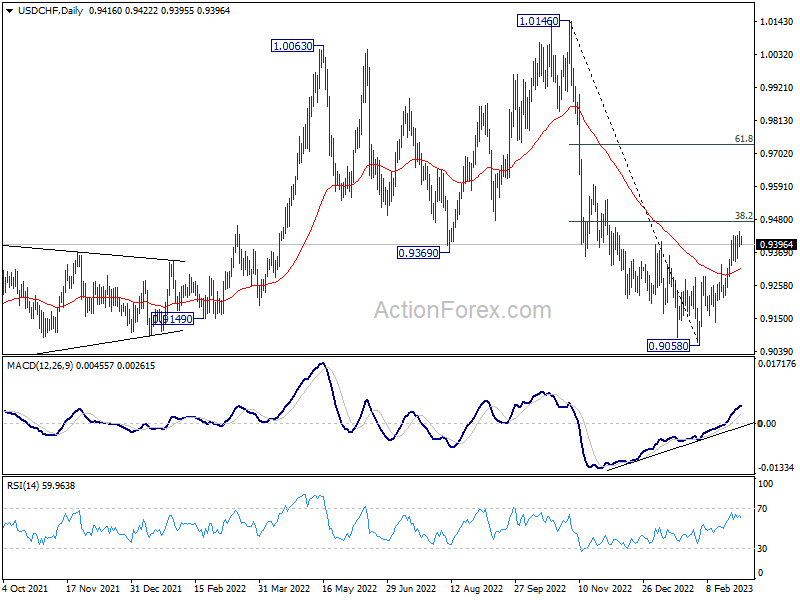
Further rally cannot be ruled out in USD/CHF. But strong resistance could be seen from 38.2% retracement of 1.0146 to 0.9058 at 0.9474 to complete the rebound from 0.9058. Break of 0.9340 minor support will now turn bias back to the downside. However, decisive break of 0.9474 will carry larger bullish implications and target 61.8% retracement at 0.9730.
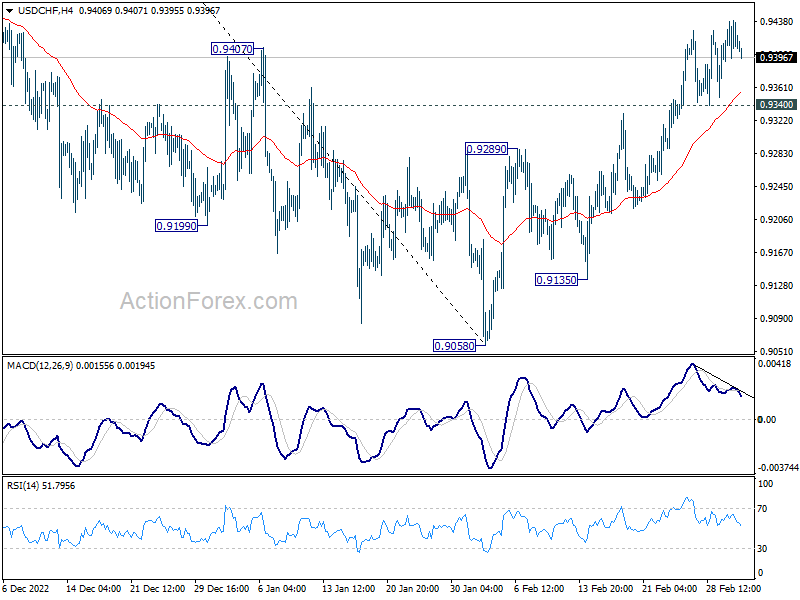
In the bigger picture, decline from 1.0146 is seen as part of a long term sideway pattern. As long as 38.2% retracement of 1.0146 to 0.9058 at 0.9474 holds, another fall is in favor through 0.9058. However, sustained trading above 0.9474 will indicate that the medium term trend has reversed, and open up further rally to 61.8% retracement at 0.9730 and above.
USD/JPY Daily Outlook
Daily Pivots: (S1) 136.16; (P) 136.63; (R1) 137.23; More...
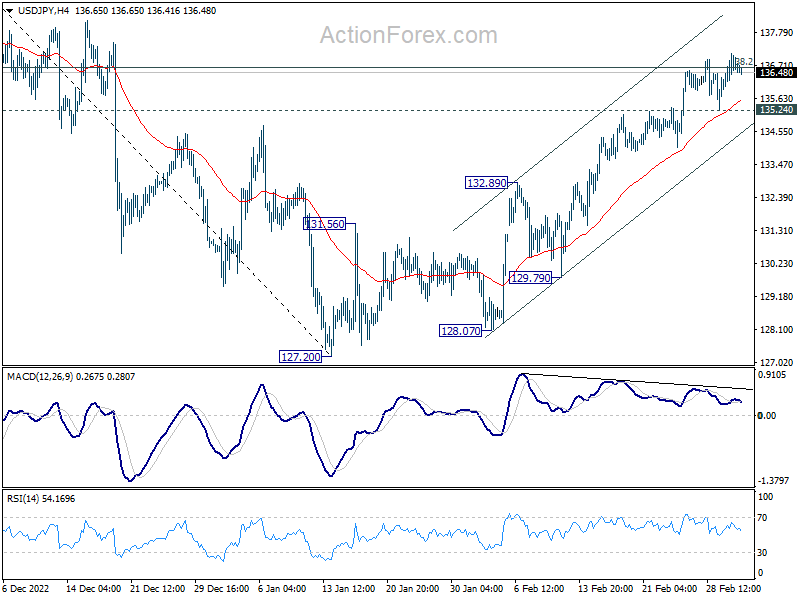
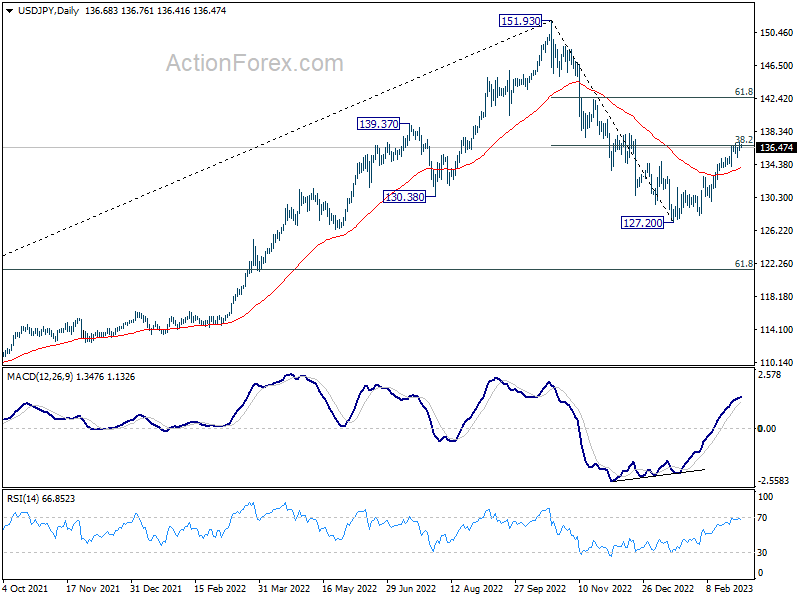
Focus stays on 38.2% retracement of 151.93 to 127.20 at 136.64 in USD/JPY. Sustained break there will indicate that fall from 151.93 has completed, and bring further rally to 61.8% retracement at 142.48. Nevertheless, rejection by this fibonacci level, followed by break of 135.24 support, will argue that rebound from 127.20 has completed, and turn bias back to the downside.
In the bigger picture, focus is now on 38.2% retracement of 151.93 to 127.20 at 136.64. Sustained break there will indicate that price actions from 151.93 medium term are merely a corrective pattern. Such development will maintain long term bullishness. Rejection by 136.64 will, on the other hand, extend the fall from 151.93 to 61.8% retracement of 102.58 to 151.93 at 121.43 at a later stage.
USD/CAD Daily Outlook
Daily Pivots: (S1) 1.3572; (P) 1.3607; (R1) 1.3630; More....
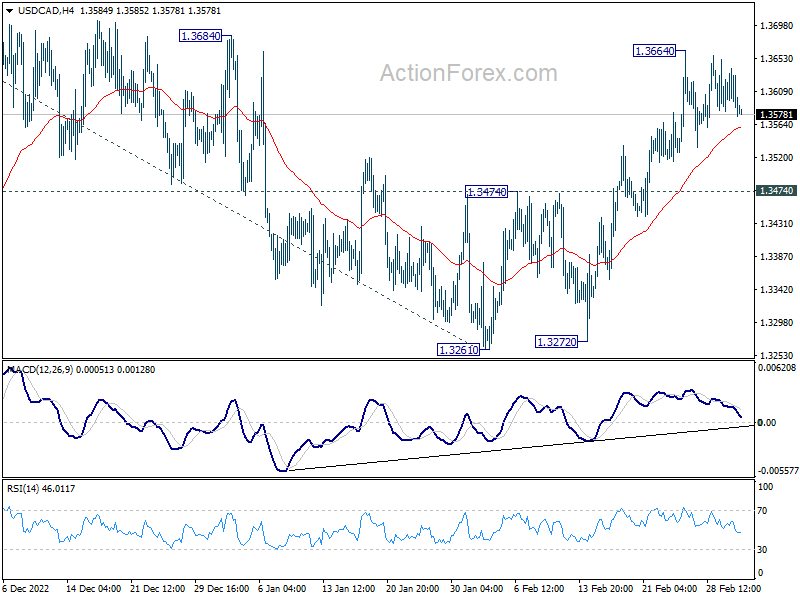
Intraday bias in USD/CAD remains neutral as consolidation from 1.3664 is extending. Further rally is in favor as long as 1.3474 resistance turned support holds. Break of 1.3664 will resume the rise from 1.3261. Sustained trading above 1.3684 will confirm that corrective pattern from 1.3976 has completed, and bring retest of this high.
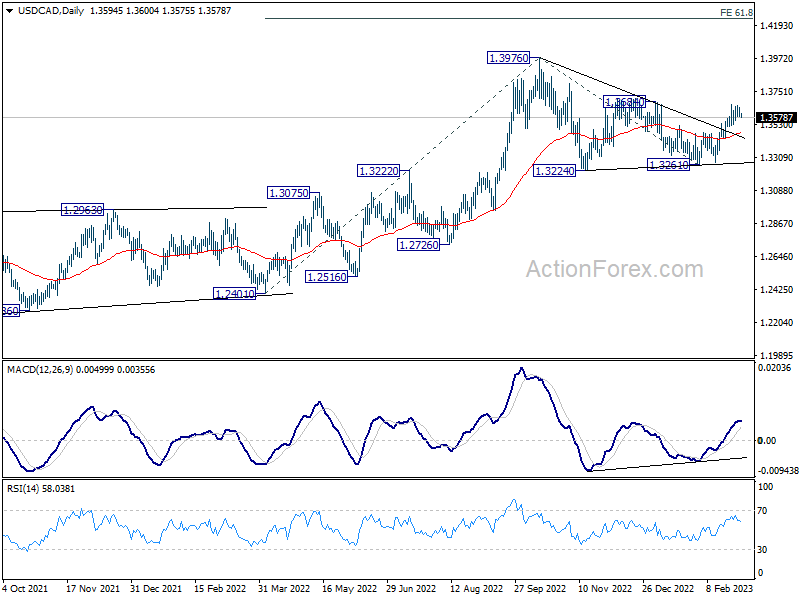
In the bigger picture, outlook stays bullish with 1.3222 cluster support (38.2% retracement of 1.2005 to 1.3976 at 1.3223) intact. Break of 1.3976 resistance will resume larger up trend from 1.2005 (2021 low) to 61.8% projection of 1.2401 to 1.3976 from 1.3261 at 1.4234.
AUD/USD Daily Report
Daily Pivots: (S1) 0.6703; (P) 0.6734; (R1) 0.6762; More...
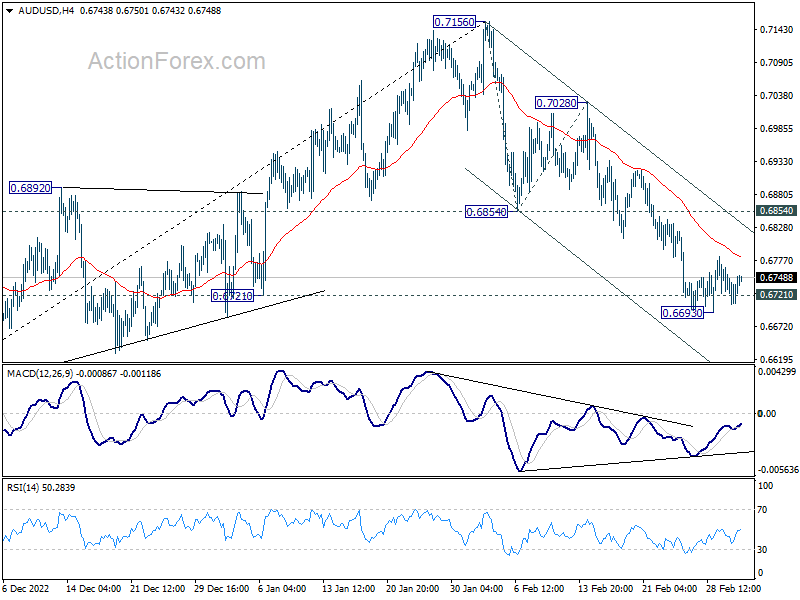
AUD/USD is staying in tight range above 0.6693 low and intraday bias remains neutral. Deeper decline is expected as long as 0.6854 support turned resistance holds. Break of 0.6693 will resume the fall from 0.7156 to 161.8% projection of of 0.6854 to 0.7028 from 0.6854 at 0.6539. Nevertheless, firm break of 0.6854 will argue that such decline is finished, and revive near term bullishness.
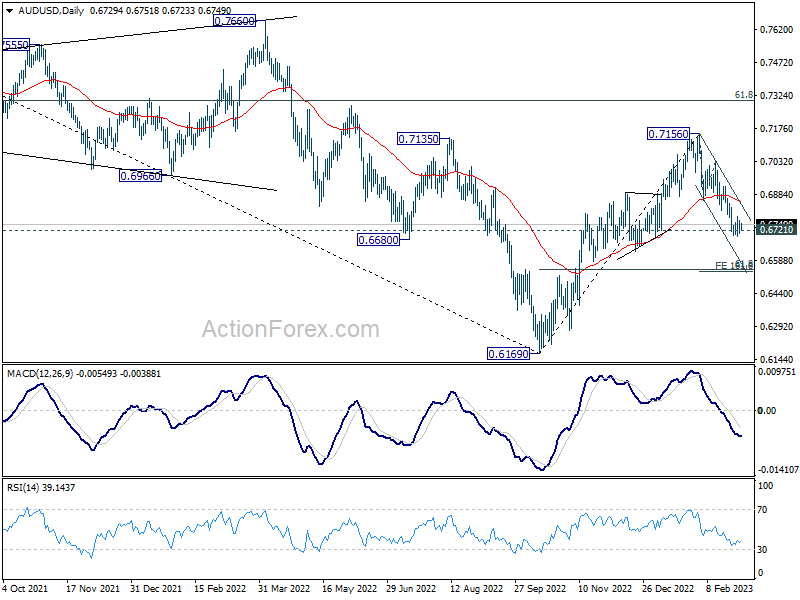
In the bigger picture, focus is now on 0.6721 structural support. Sustained break there will argue that whole rise from 0.6169 (2022 low) has completed at 0.7156, after rejection by 55 month EMA (now at 0.7179). Deeper decline would then be see back to 61.8% retracement of 0.6169 to 0.7156 at 0.6546, even as a corrective fall. Nevertheless, strong rebound from current level will retain medium term bullishness for another rise through 0.7156 later.
Forex Markets Quiet in Asian Session, Risk-On Sentiment Appears to Prevail
The forex markets saw limited movement in Asian session today, with most major pairs and crosses remaining within yesterday's range. While Aussie is trading slightly higher, there is no decisive momentum. For the week, Kiwi is currently the strongest, followed by Euro and then Aussie. Meanwhile, Yen is performing worst, followed by Dollar and Swiss Franc. It's overall a risk-on setting, thanks to rebound in US stocks overnight. However, it remains to be seen if this trend will continue in coming days.
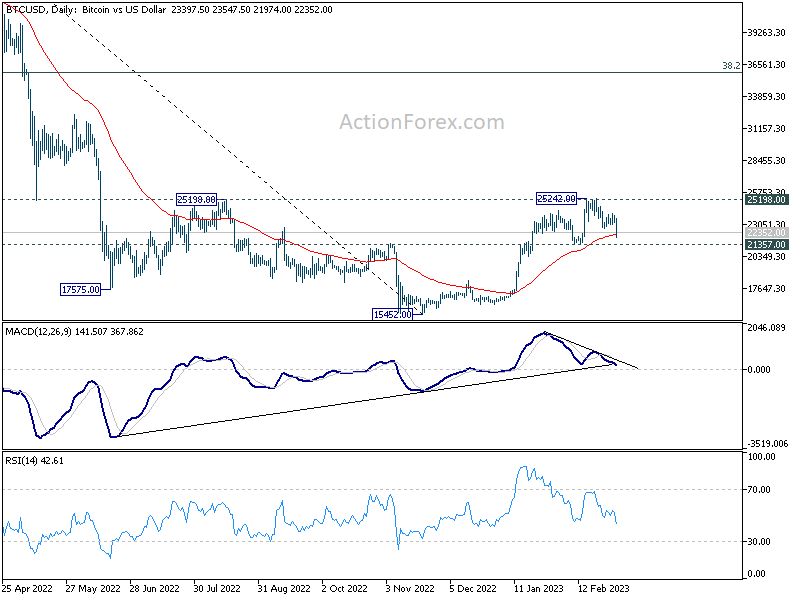
On technical front, Bitcoin's sharp decline today has raised doubts about underlying risk appetite. The main question is whether there is enough buying power to push it through structural resistance at 25198 and confirm a bullish trend reversal. On the other hand, a break of support at 21357 would indicate rejection by 25198 and completion of the rebound from 15452. If that were to happen, a deeper fall could be expected, potentially back towards this low. Such a development could also be accompanied by a deeper selloff in NASDAQ, which leads risk markets lower, and supports Dollar.
In Asia, Nikkei closed up 1.55%. Hong Kong HSI is up 1.01%. China Shanghai SSE is up 0.41%. Singapore Strait Times is up 0.16%. Japan 10-year JGB yield is up 0.0121 at 0.509. Overnight, DOW rose 1.05%. S&P 500 rose 0.76%. NASDAQ rose 0.73%. 10-year yield rose 0.079 to 4.073.
Fed Waller: May need rate above 5.1-5.4% if data continue to be too hot
Fed Governor Christopher Waller said that "a barrage of data" in February has challenged high view that FOMC was "making progress in moderating economic activity and reducing inflation."
"It could be that progress has stalled, or it is possible that the numbers released last month were a blip," he said.
"If job creation drops back down to a level consistent with the downward trajectory seen late last year and CPI inflation pulls back significantly from the January numbers and resumes its downward path, then I would endorse raising the target range for the federal funds rate a couple more times, to a projected terminal rate between 5.1 and 5.4 percent," he said.
"On the other hand, if those data reports continue to come in too hot, the policy target range will have to be raised this year even more to ensure that we do not lose the momentum that was in place before the data for January were released," he added.
Fed Collins: We will need to do some additional rate increases
Boston Fed President Susan Collins said yesterday, "we will need to do some additional rate increases and exactly what the right amount is really needs to be dependent on a holistic review of the information that we receive."
"It will be important to hold there for some time because it takes a while for the effects of tighter financial conditions to work through the economy," she added.
"We've seen some early signs that wage and price pressures might be slowing," she said. "But we've also seen some evidence that high inflation" remains, particularly in some areas of services.
Fed Bostic: There is the case we need to go higher
Atlanta Fed President Raphael Bostic said yesterday, "there is the case that could be made that we need to go higher" on interest rate.
"Consumer spending is strong and labor markets remain quite tight and that those suggest that the economy's strength could be a bit more than people think, which means we might need to do more."
"I'm going to stay open to any possibility that if data come in stronger than expected then I will adjust my policy trajectory," Bostic said.
BoE Pill: Current momentum in economic activity may be slightly stronger than anticipated
In a speech yesterday, BoE Chief Economist Huw Pill said that "current momentum in economic activity may be slightly stronger than anticipated."
"CPI inflation is projected to fall to below the 2% target by the end of the forecast horizon", he said. But "there are considerable uncertainties around this outlook."
"Upside risks arise in large part from the possibility that domestic inflationary pressures prove more persistent than anticipated, owing to so-called 'second round effects' in price, cost and wage setting behaviour," he explained.
"The latest data for private sector regular pay growth – which was published after the MPC's forecast was finalised – surprised slightly to the upside."
Nevertheless, "some high-frequency indicators of wages have fallen quite sharply recently".
"The MPC will continue to monitor indications of persistence in domestic inflationary pressures closely, with a focus on developments in the labour market, in wage dynamics, in services price inflation and in measures of underlying inflation and inflation expectations."
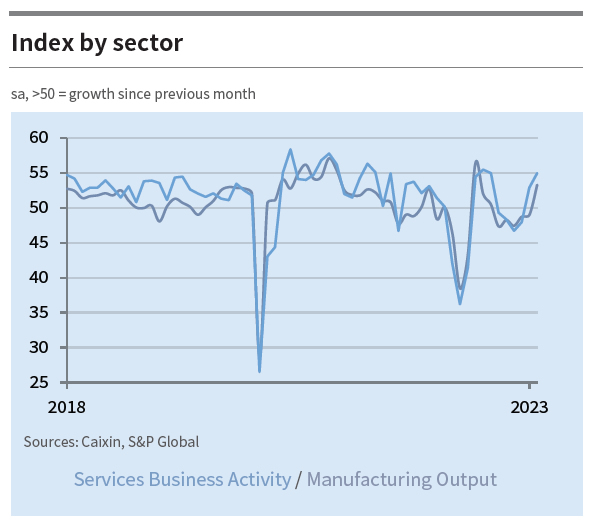
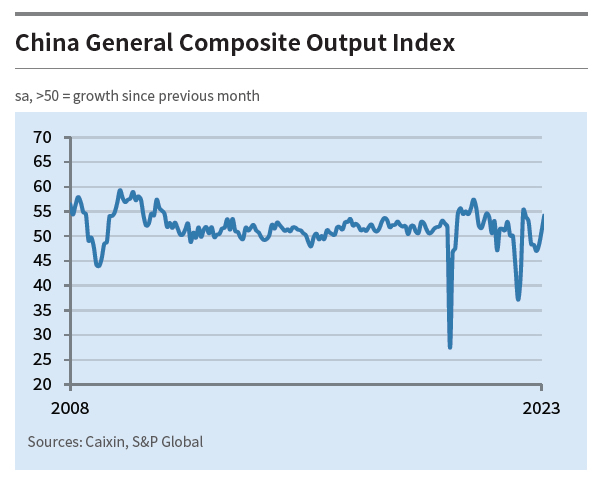
China PMI services rose to 55.0, composite rose to 54.2
China Caixin PMI Services rose from 52.9 to 55.0 in February, above expectation of 54.7. That's also the highest reading since April 2021. PMI Composite rose from 51.1 to 54.2, highest since May 2021.
Wang Zhe, Senior Economist at Caixin Insight Group said: "Both manufacturing and services activity recovered gradually. Production, demand, including external demand, and employment all grew, with services activity showing a stronger recovery than manufacturing output. Input costs and prices charged remained stable, and business owners were highly optimistic."
Looking ahead
Germany trade balance, France industrial output, Eurozone PMI services final and PPI, UK PMI services final will be released in European session. Later in the day, US ISM services is the main focus. Canada will release building permits and labor productivity.
AUD/USD Daily Report
Daily Pivots: (S1) 0.6703; (P) 0.6734; (R1) 0.6762; More...
AUD/USD is staying in tight range above 0.6693 low and intraday bias remains neutral. Deeper decline is expected as long as 0.6854 support turned resistance holds. Break of 0.6693 will resume the fall from 0.7156 to 161.8% projection of of 0.6854 to 0.7028 from 0.6854 at 0.6539. Nevertheless, firm break of 0.6854 will argue that such decline is finished, and revive near term bullishness.
In the bigger picture, focus is now on 0.6721 structural support. Sustained break there will argue that whole rise from 0.6169 (2022 low) has completed at 0.7156, after rejection by 55 month EMA (now at 0.7179). Deeper decline would then be see back to 61.8% retracement of 0.6169 to 0.7156 at 0.6546, even as a corrective fall. Nevertheless, strong rebound from current level will retain medium term bullishness for another rise through 0.7156 later.
Economic Indicators Update
| GMT | Ccy | Events | Actual | Forecast | Previous | Revised |
|---|---|---|---|---|---|---|
| 23:30 | JPY | Tokyo CPI Core Y/Y Feb | 3.30% | 3.30% | 4.30% | |
| 23:30 | JPY | Unemployment Rate Jan | 2.40% | 2.50% | 2.50% | |
| 01:45 | CNY | Caixin Services PMI Feb | 55 | 54.7 | 52.9 | |
| 07:00 | EUR | Germany Trade Balance (EUR) Jan | 11.2B | 10.0B | ||
| 07:45 | EUR | France Industrial Output M/M Jan | -0.2 | 1.10% | ||
| 08:45 | EUR | Italy Services PMI Feb | 52.4 | 51.2 | ||
| 08:50 | EUR | France Services PMI Feb F | 52.8 | 52.8 | ||
| 08:55 | EUR | Germany Services PMI Feb F | 51.3 | 51.3 | ||
| 09:00 | EUR | Eurozone Services PMI Feb F | 53 | 53 | ||
| 09:30 | GBP | Services PMI Feb F | 53.3 | 53.3 | ||
| 10:00 | EUR | Eurozone PPI M/M Jan | -0.30% | 1.10% | ||
| 10:00 | EUR | Eurozone PPI Y/Y Jan | 28.60% | 24.60% | ||
| 13:30 | CAD | Building Permits M/M Jan | 1.70% | -7.30% | ||
| 13:30 | CAD | Labor Productivity Q/Q Q4 | 0.20% | 0.60% | ||
| 14:45 | USD | Services PMI Feb F | 50.5 | 50.5 | ||
| 15:00 | USD | ISM Services PMI Feb | 54.4 | 55.2 |
Technical Outlook and Review
DXY:
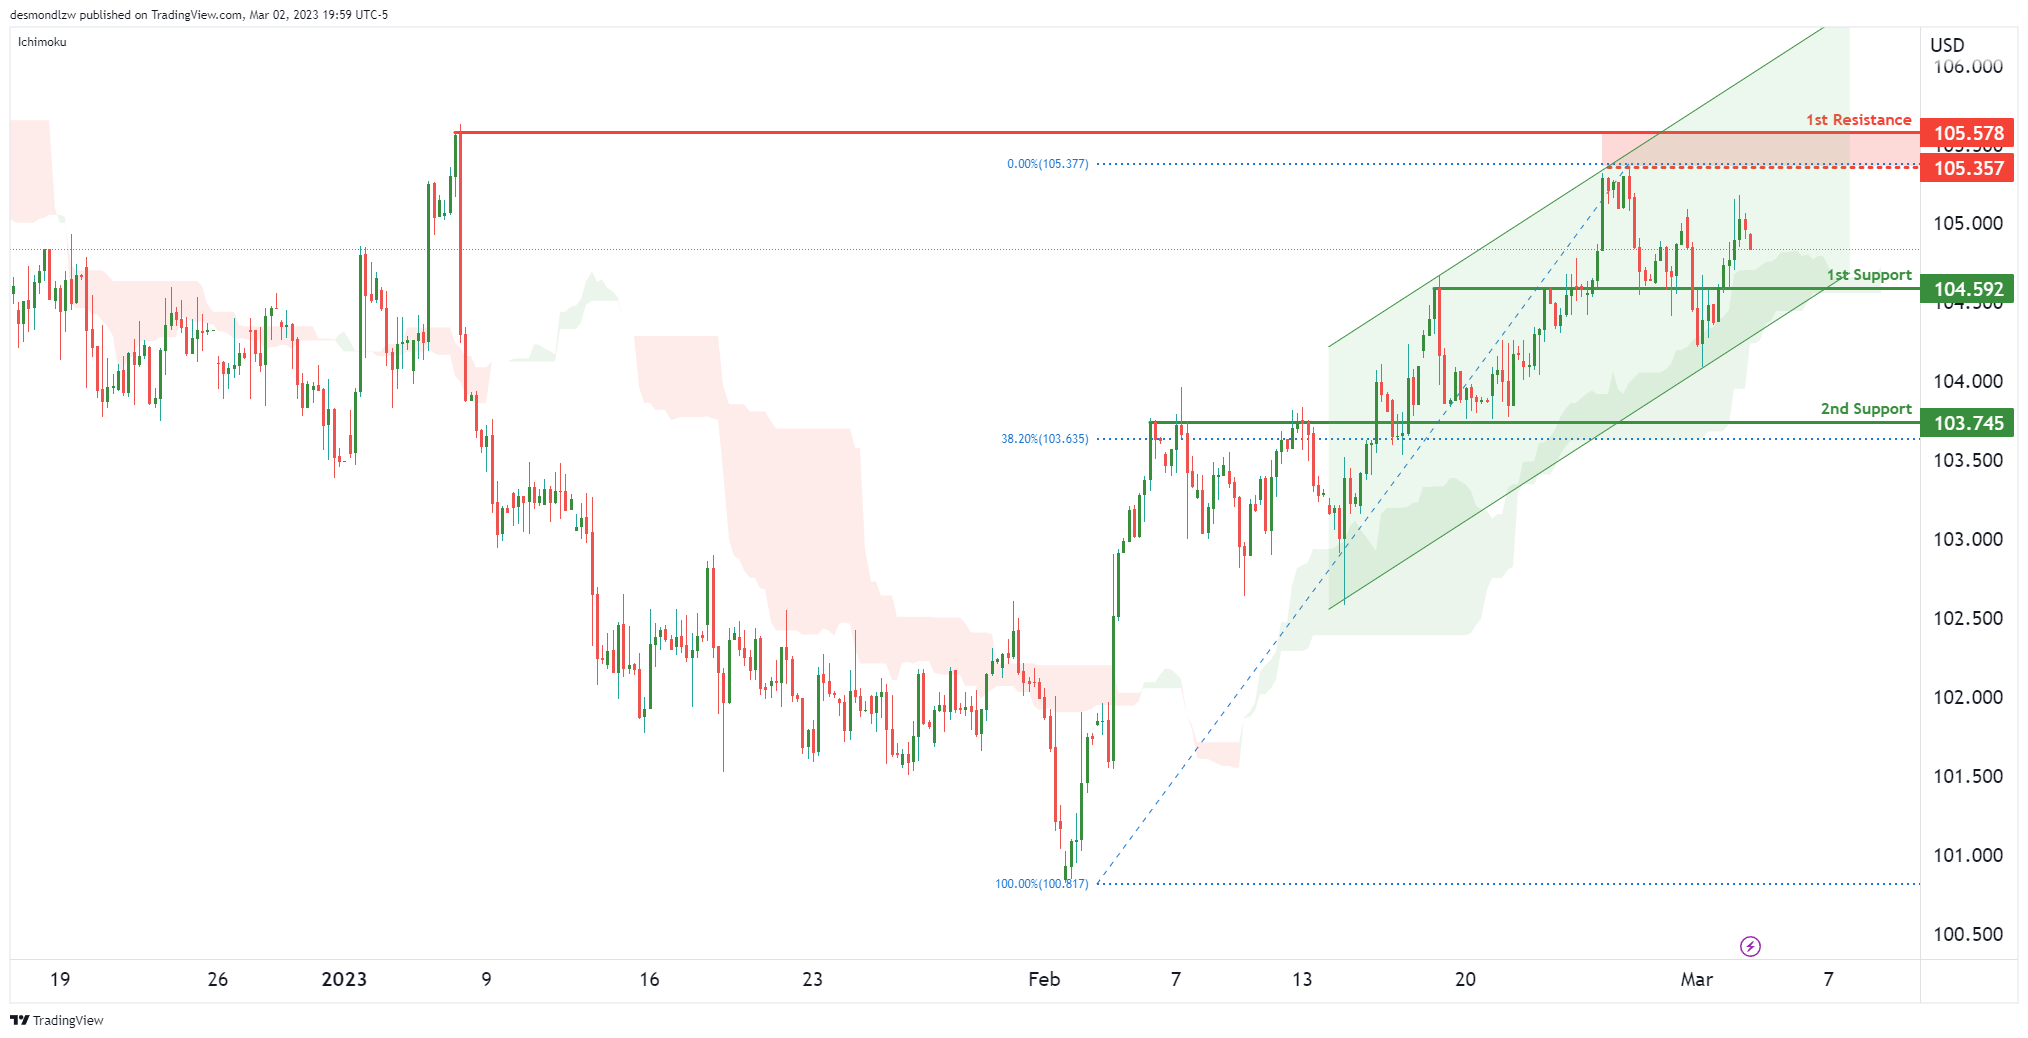
Price is in an ascending channel along and at the same time, there is an Ichimoku cloud support that is pushing it up. Our 1st resistance is at 105.35 area which is a swing high resistance.
Our 1st support is at 104.59 which is an overlap support and if price breaks this level, along with the Channel and Ichimoku cloud, we could see prices drop all the way down to 2nd support at 103.74 which is an overlap support and a 38.2% Fibonacci retracement.
EUR/USD:
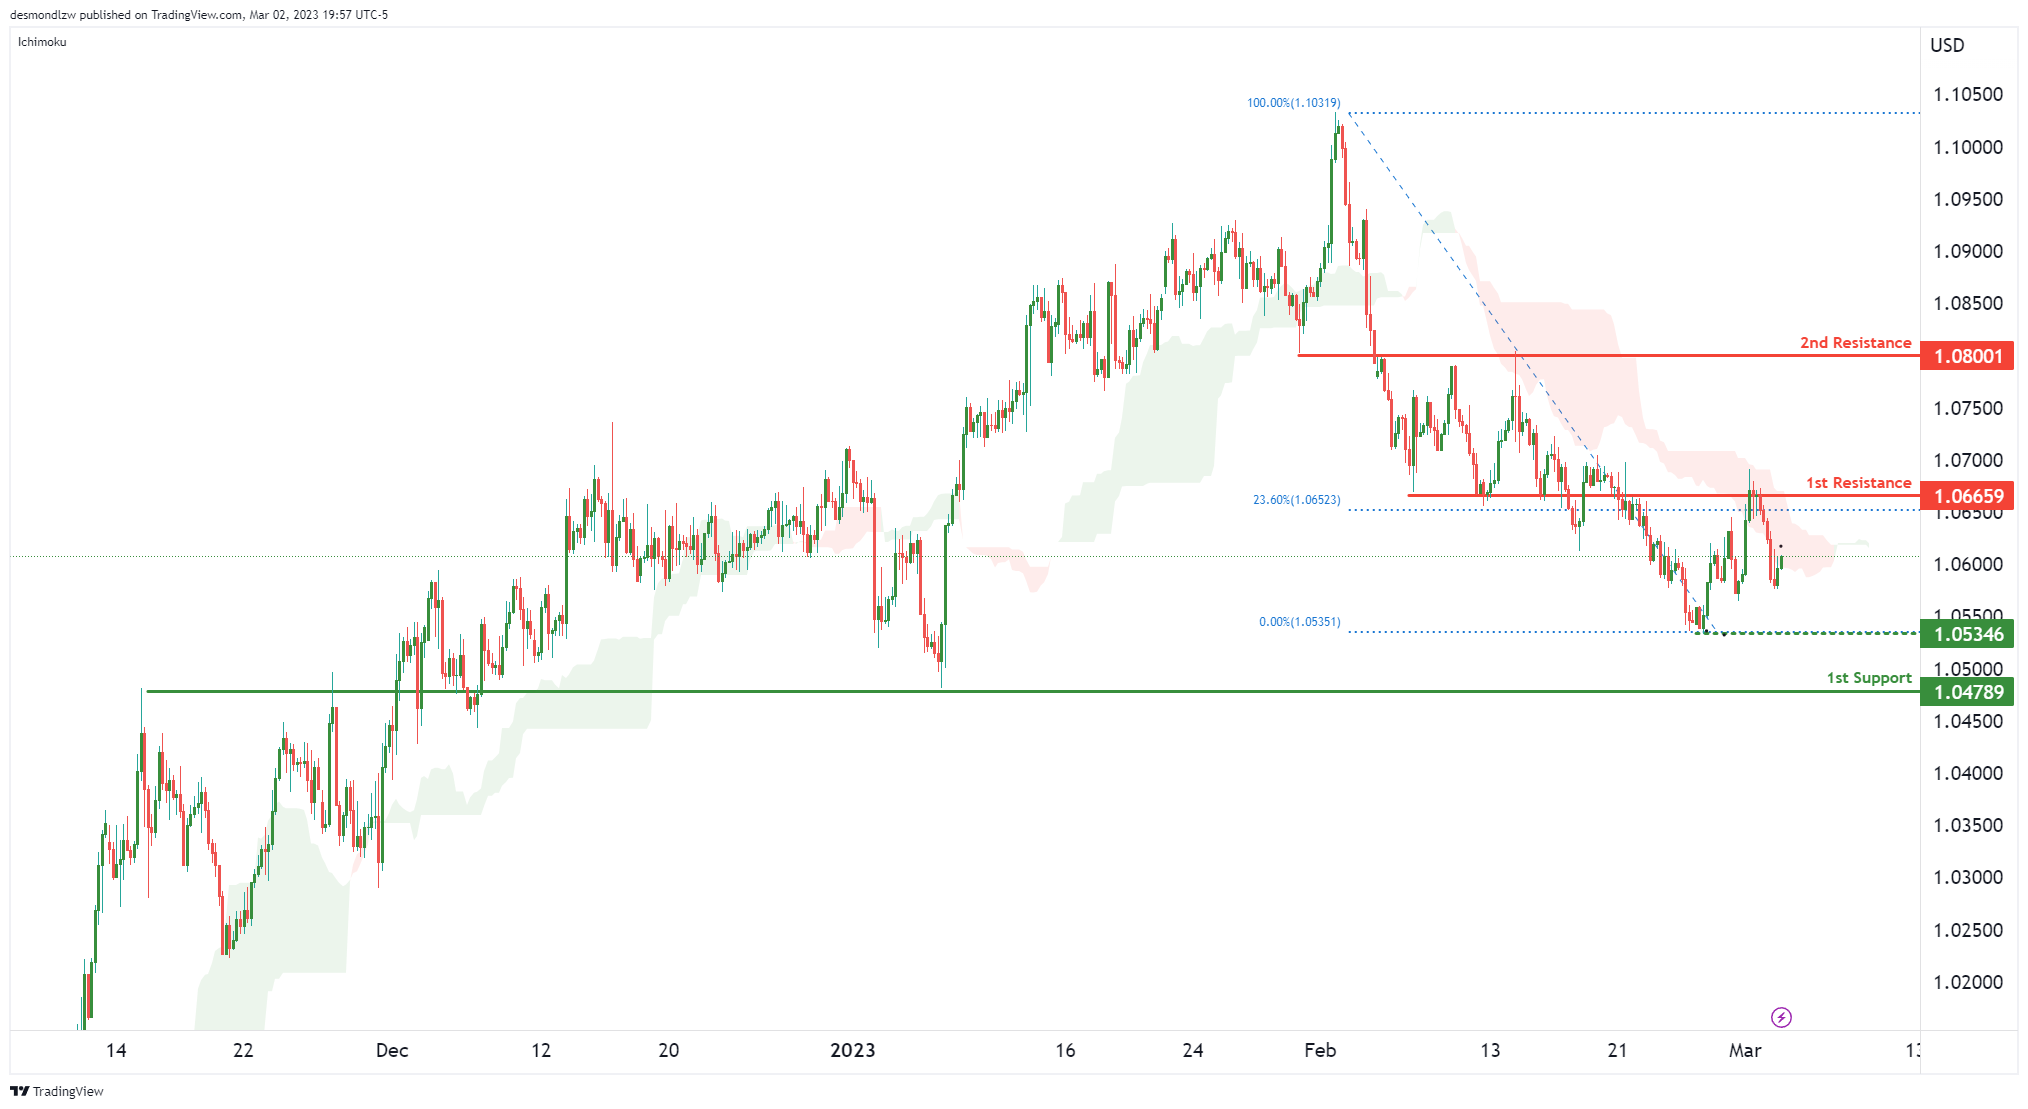
Price has reacted from our 1st resistance at 1.06659 which lines up with the 23.6% Fibonacci retracement – causing it to drop.There is strong bearish momentum because current price is below the Ichimoku cloud.
If prices were to break the intermediate support at 1.0534, it could potentially come further to our 1st support at 1.04789 where the overlap support is.
GBP/USD:
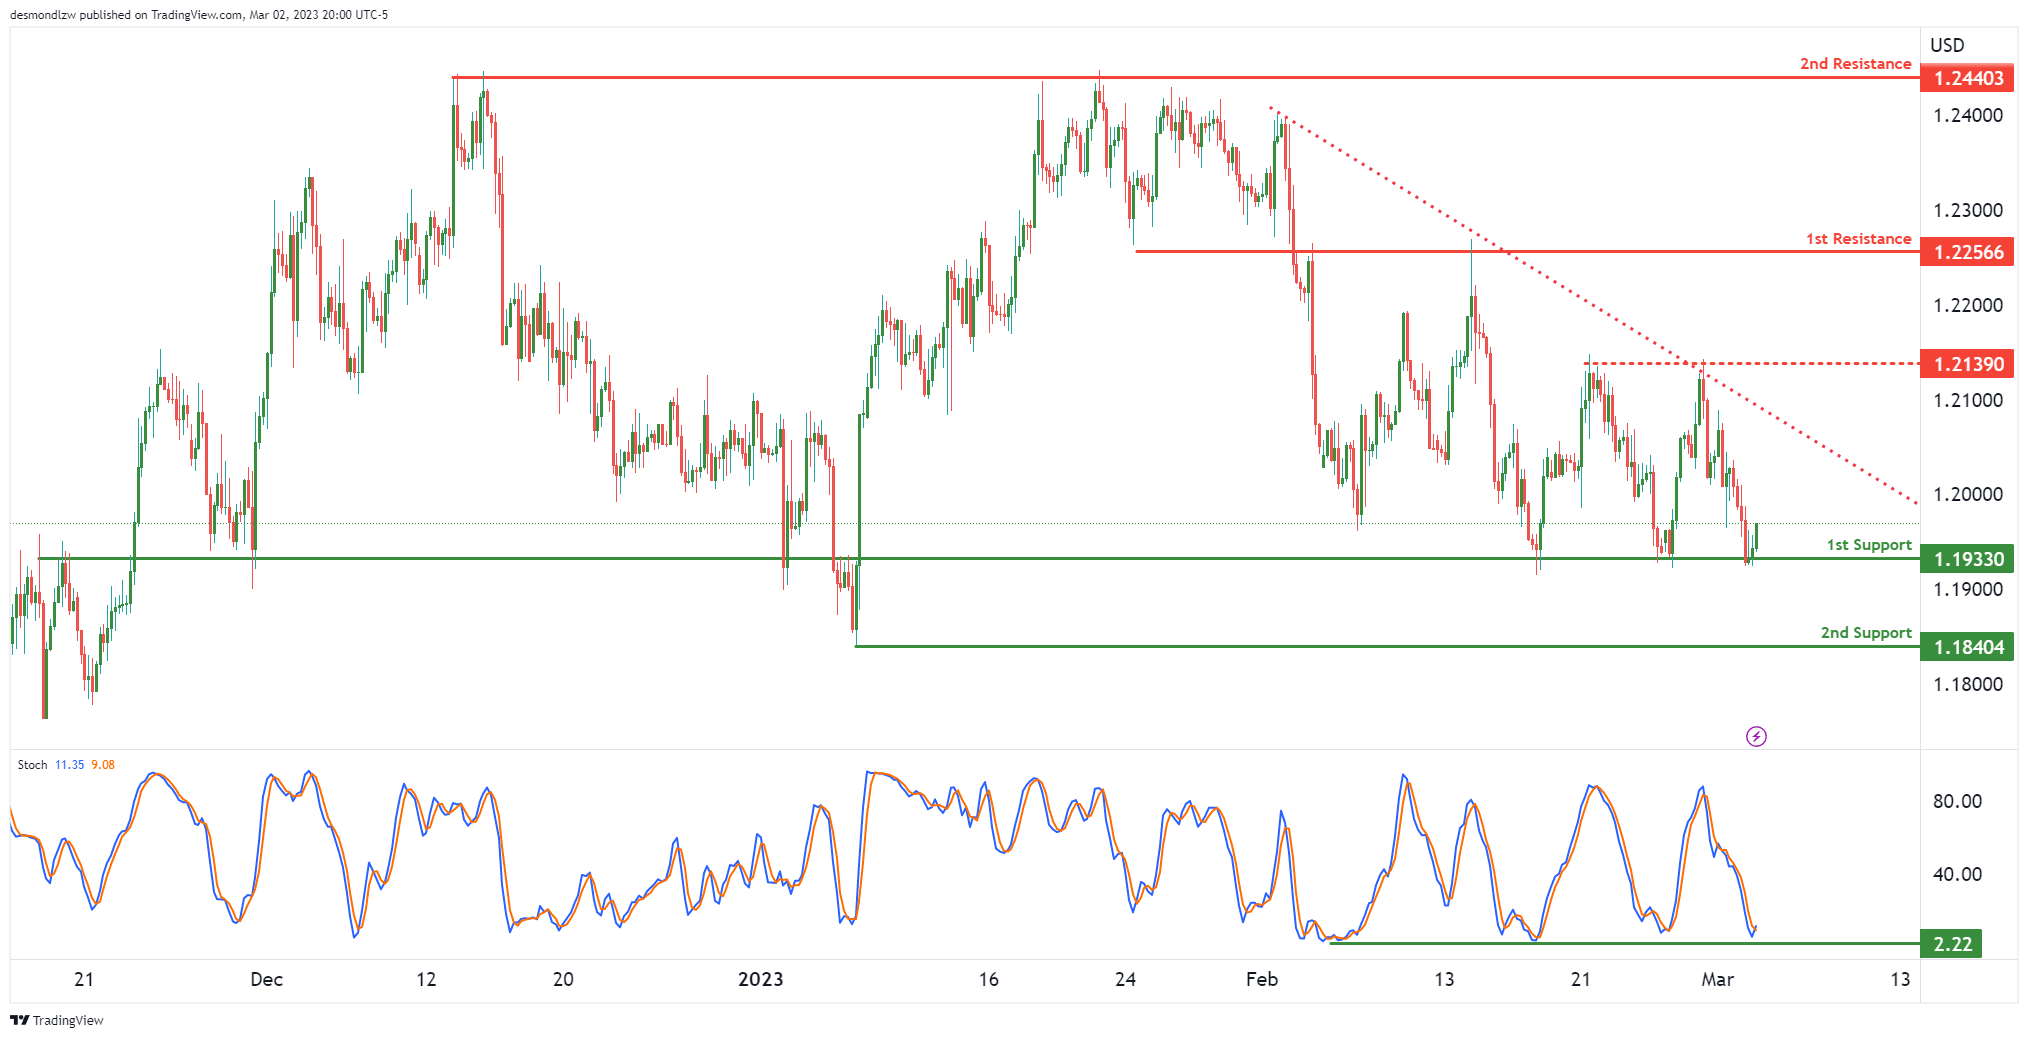
Price has reversed from our 1st resistance at 1.21390 and has came down to test our 1st support at 1.1930. Our 1st support is a very strong overlap support because price had reacted and bounced off it multiple times in the past, If prices were to break this 1st support, the next key support to watch out for is the recent swing low at 1.1840.
In terms of resistance, our intermediate resistance is at 1.2139 which is a double swing high resistance. Breaking this, along with the descending resistance trend line, could trigger a move up to 1.2256 which is our 1st resistance.
USD/CHF:
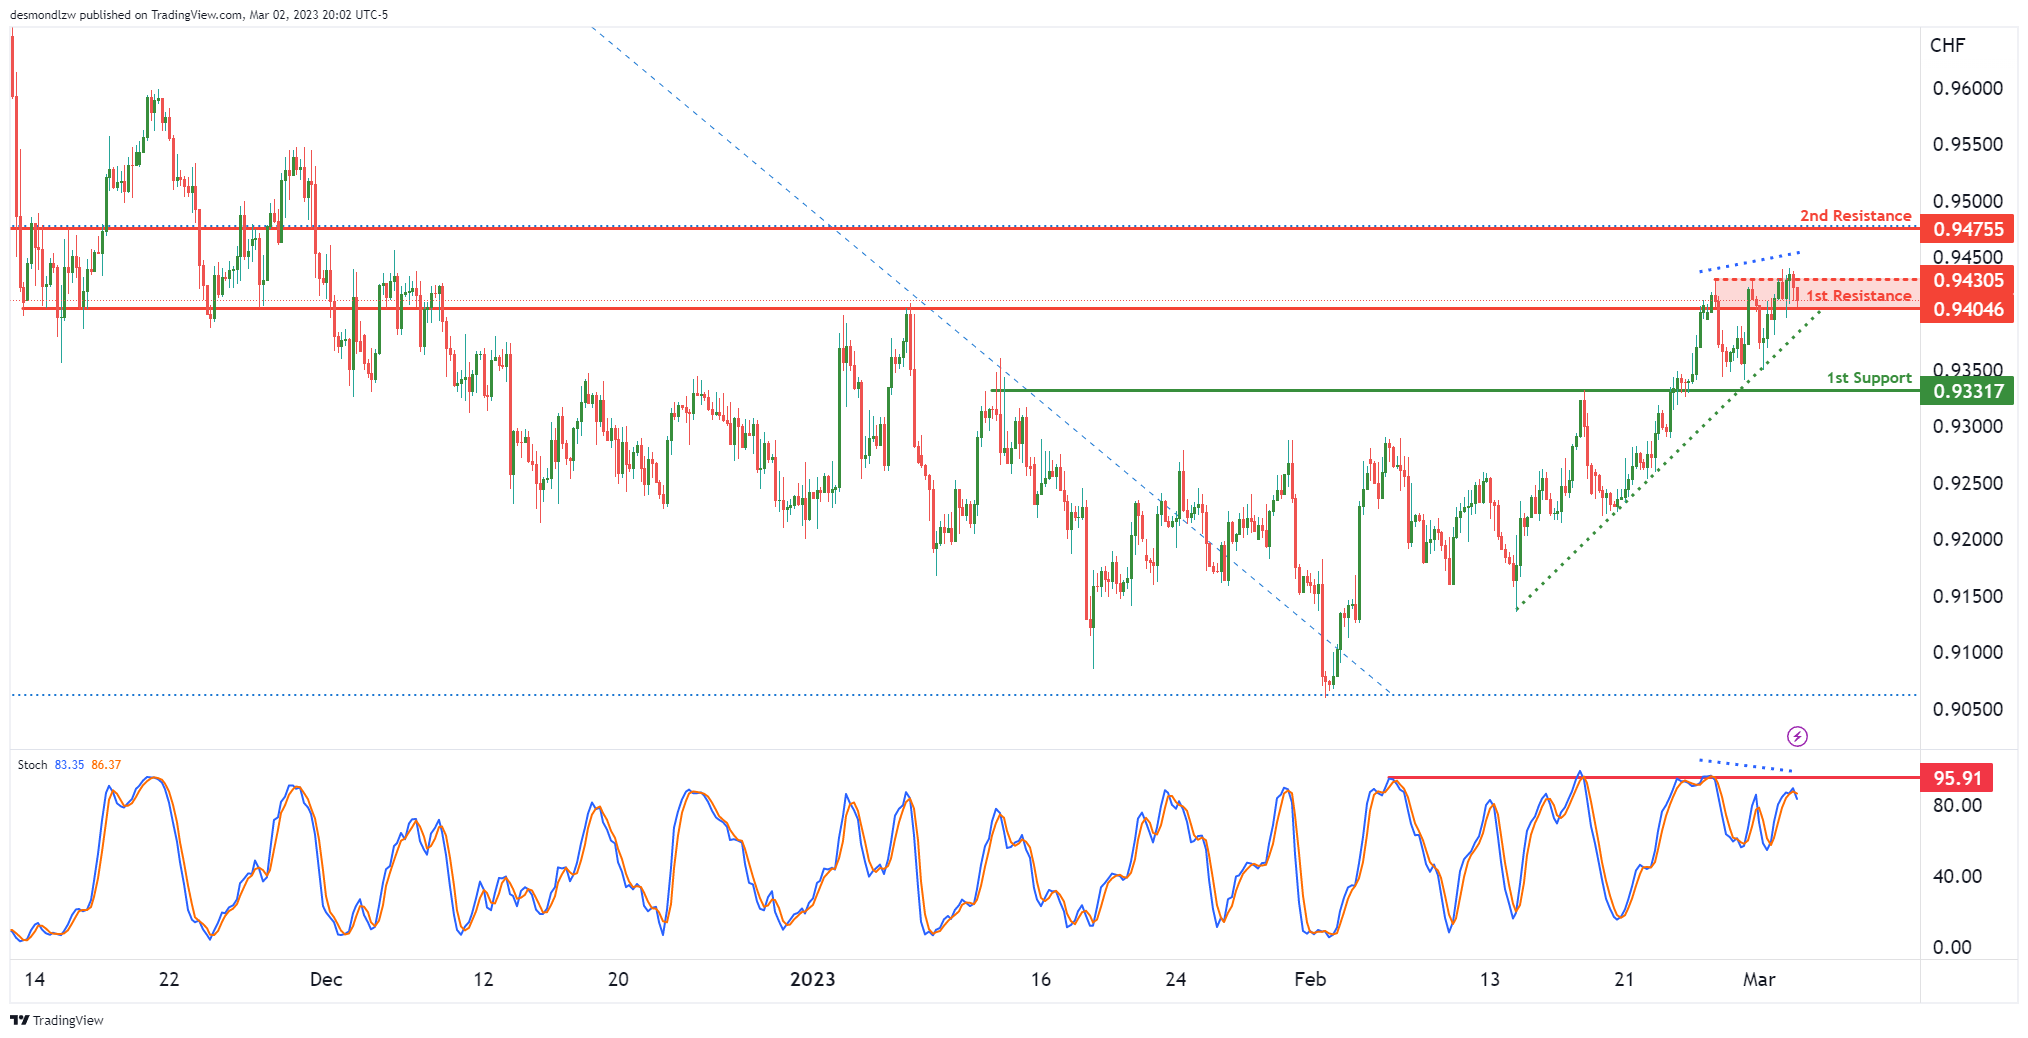
Price is seeing an ascending support line continue to push it up against our 1st resistance area between 0.9430 – 0.9404. If price were to break this level, we could see a further push up to our 2nd resistance 0.9475
However, if prices fail to break the 1st resistance and instead reverse, we could see it drop to the 1st support at 0.9331 which is a strong overlap support. It is worth noting that we are seeing a bearish divergence vs the Stochastic too. Price has also historically reacted off the 95% level on Stochastic.
USD/JPY:
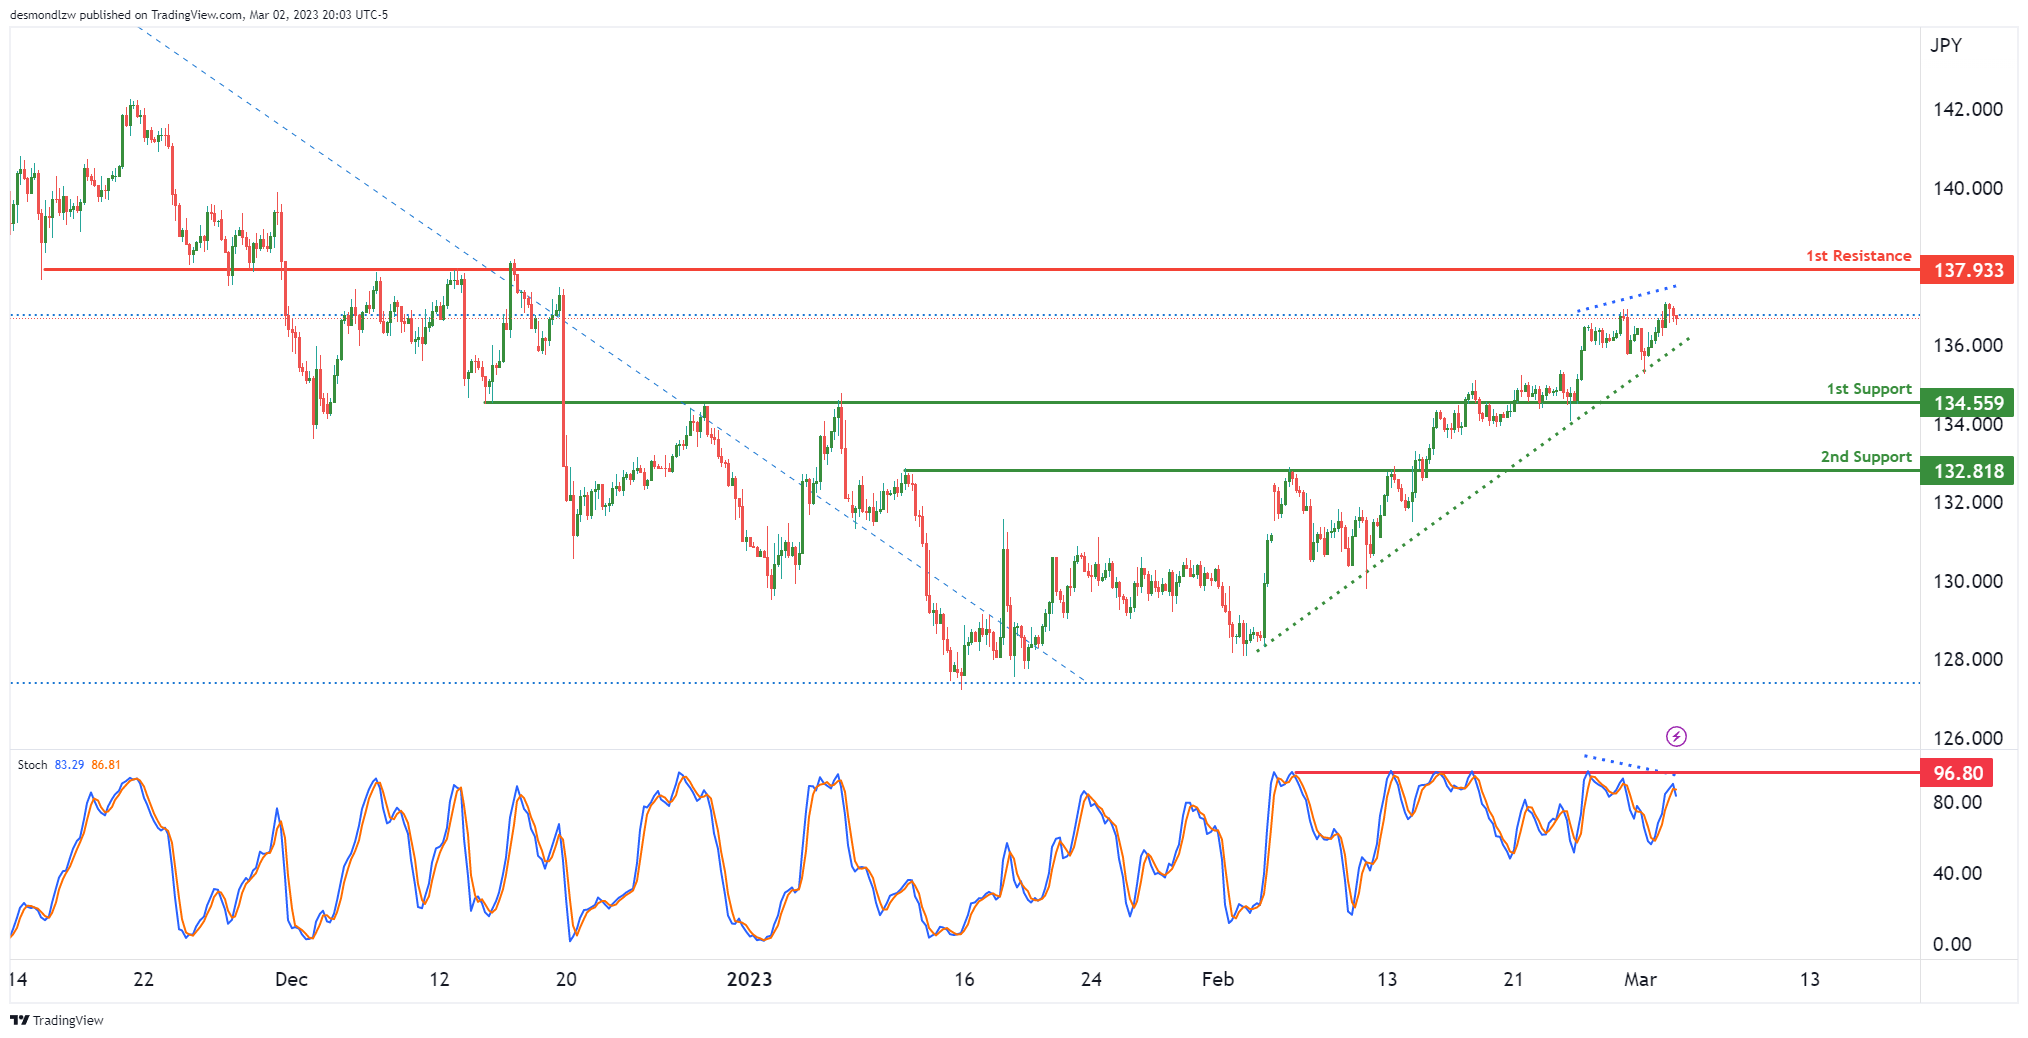
We’re seeing price rise nicely with our ascending trend line. Price could potentially reach our 1st resistance at 137.933 which is a strong overlap resistance.
In terms of support, we can see an overlap support at 134.55 which is our 1st support. Breaking that could trigger a drop to 2nd support at 132.81. We can also see that there is a bearish divergence vs Stochastic which seems to historically react off the 96% level.
AUD/USD:
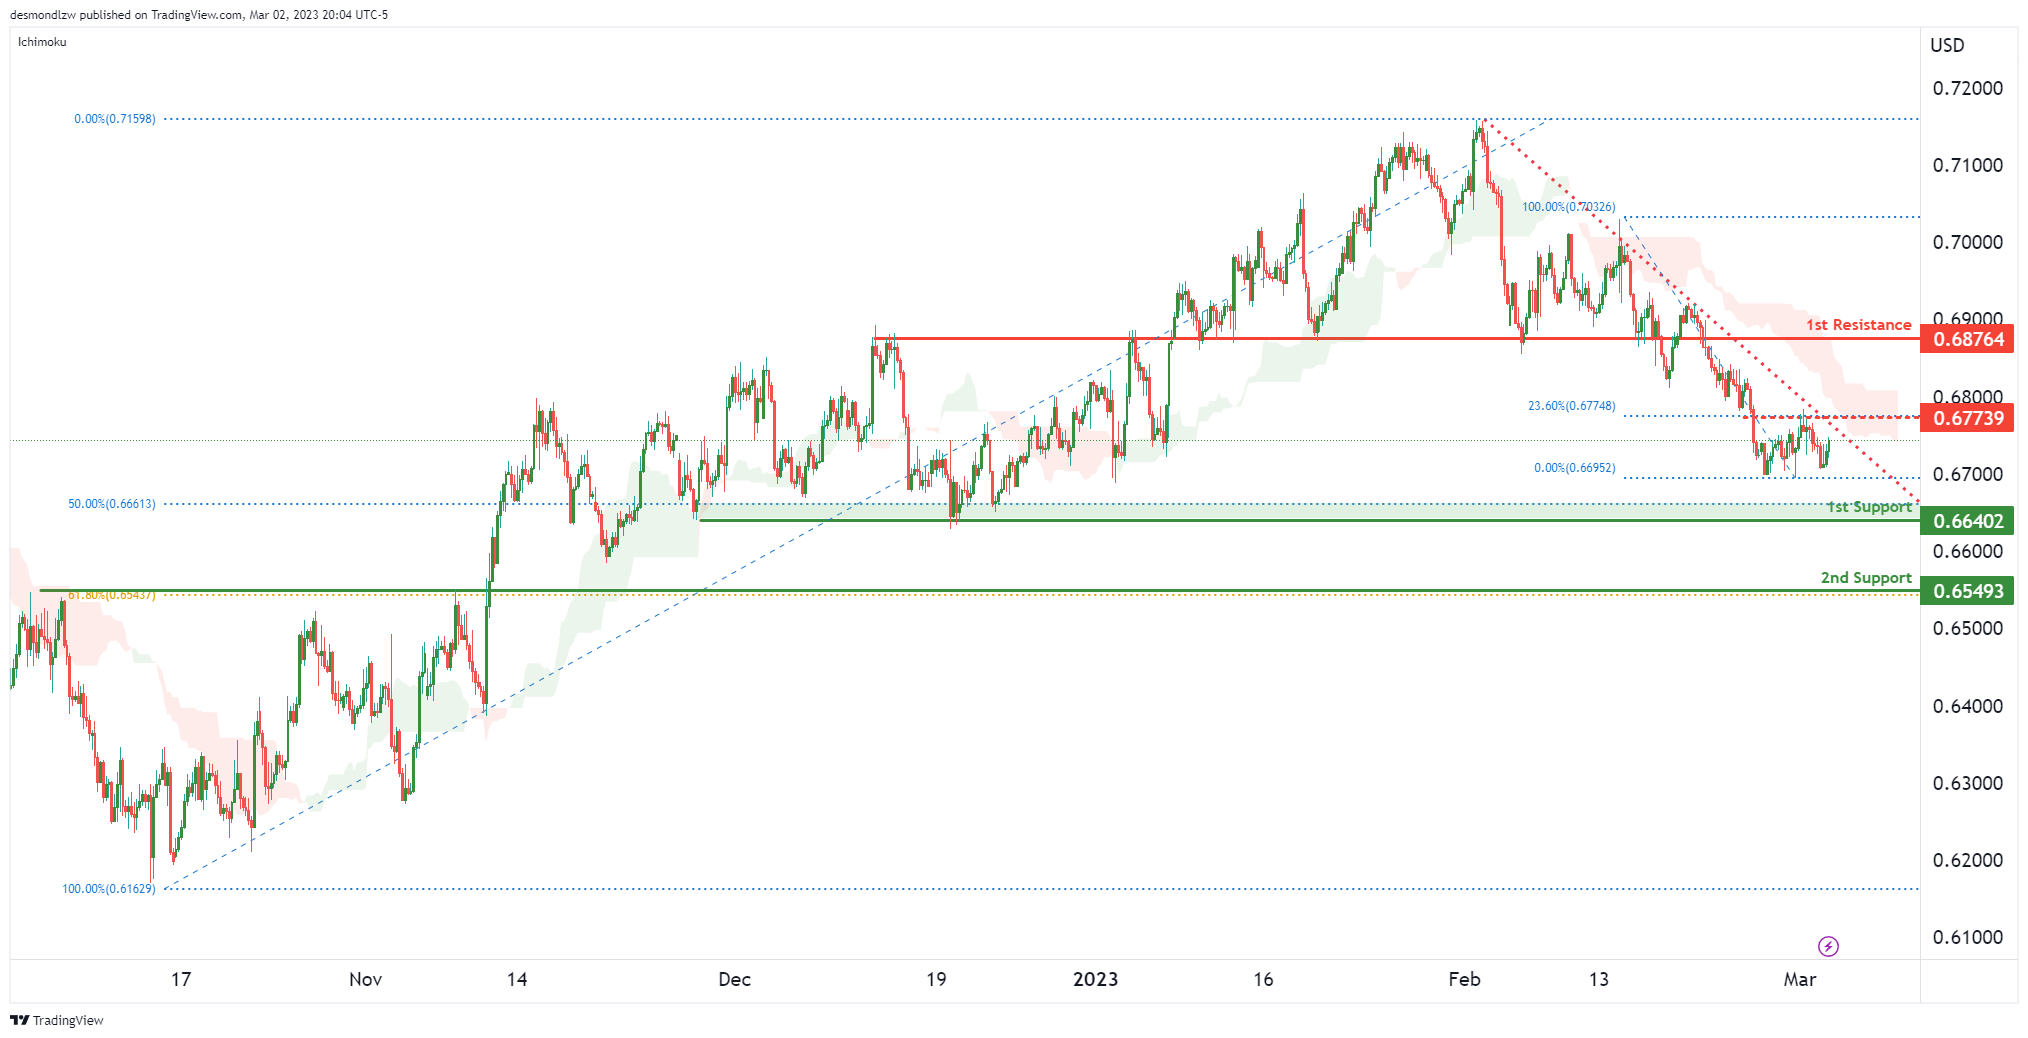
Price is respecting a descending resistance line pushing prices down towards our 1st support at 0.66402 which is a multiple swing low support + 50% Fibonacci retracement. It’s worth noting that price has also reacted off the intermediate resistance at 0.67739 which is an overlap resistance along with a 23.6% Fibonacci retracement.
If prices were to break the 1st support, we could see a bigger drop to 0.65493 which is a pullback support that lines up with the 61.8% Fibonacci retracement.
NZD/USD:
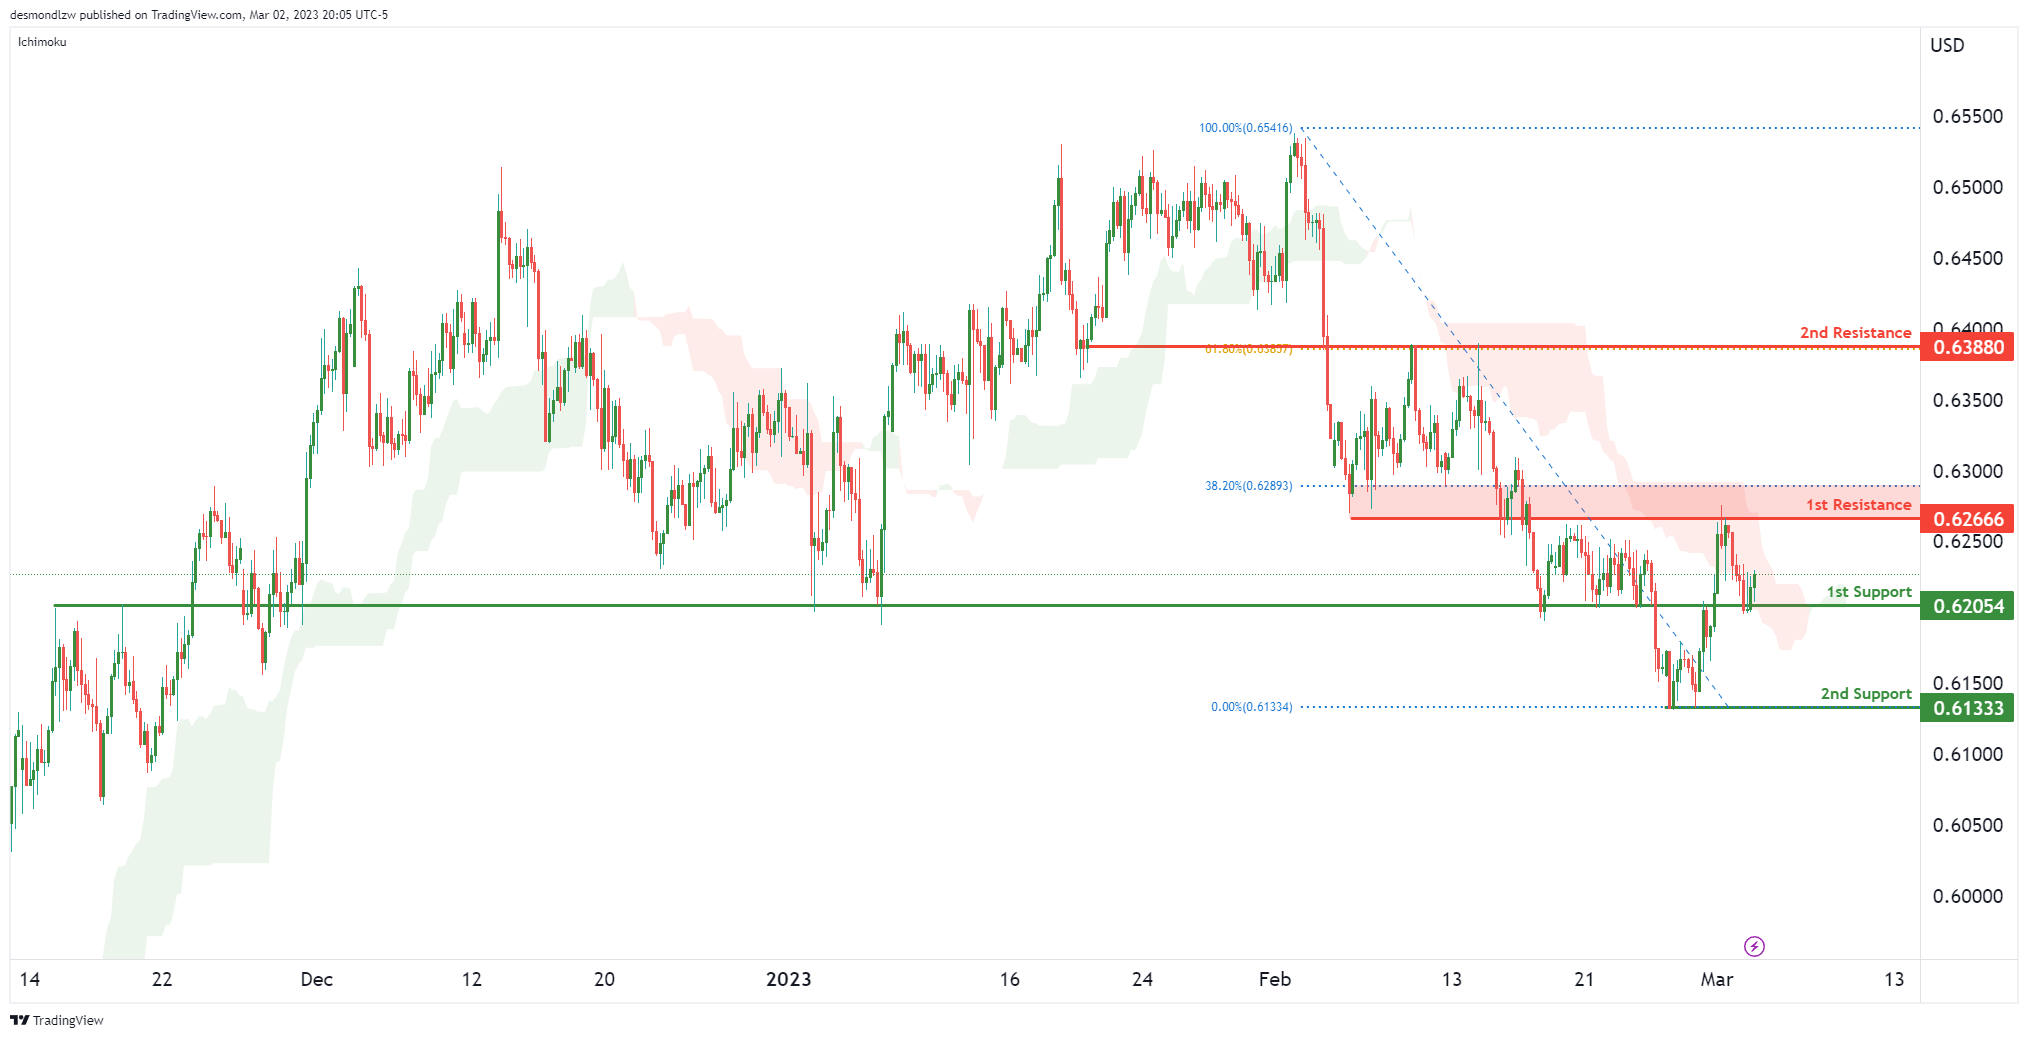
Price reached our 1st resistance at 0.62666 and came down to our 1st support at 0.62054 which is strong overlap support. If prices were to rise from here, it has to break our 1st resistance and price could potentially go up to our 2nd resistance at 0.63880 which is a 61.8% Fibonacci retracement and an overlap resistance.
If price were to reverse and break our 1st support instead, then we could see a drop towards 0.6133 which is our most recent swing low support. It’s worth noting that price is in the middle of a strong bearish Ichimoku cloud which might provide the momentum for it to drop further from here.
USD/CAD:
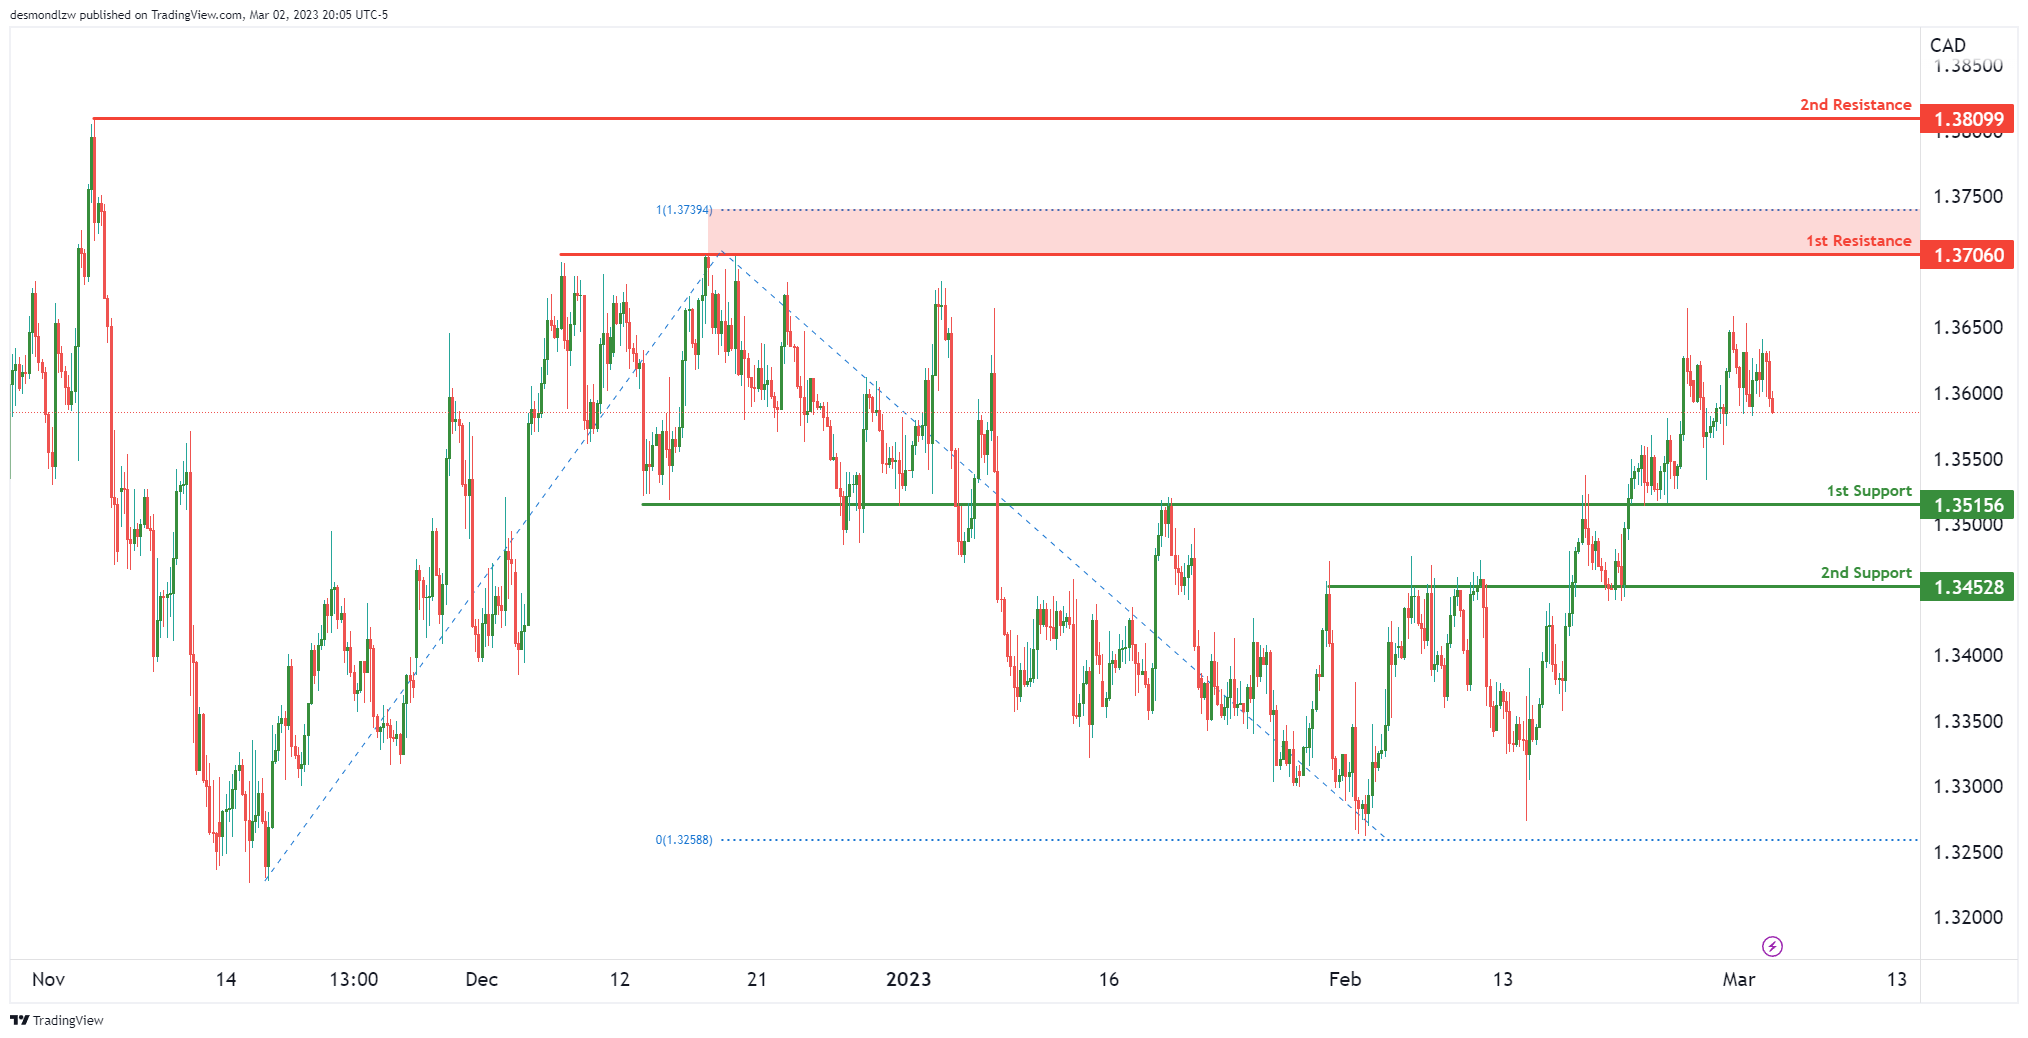
We’re seeing prices hover between two major levels. The 1st resistance of 1.3706 which is a multiple swing high resistance level and the 1st support of 1.3515 that is a strong overlap support level. Breaking either of these levels could trigger moves up to the 2nd resistance at 1.3809 or the 2nd support at 1.3452 which is another overlap support.
DJ30:
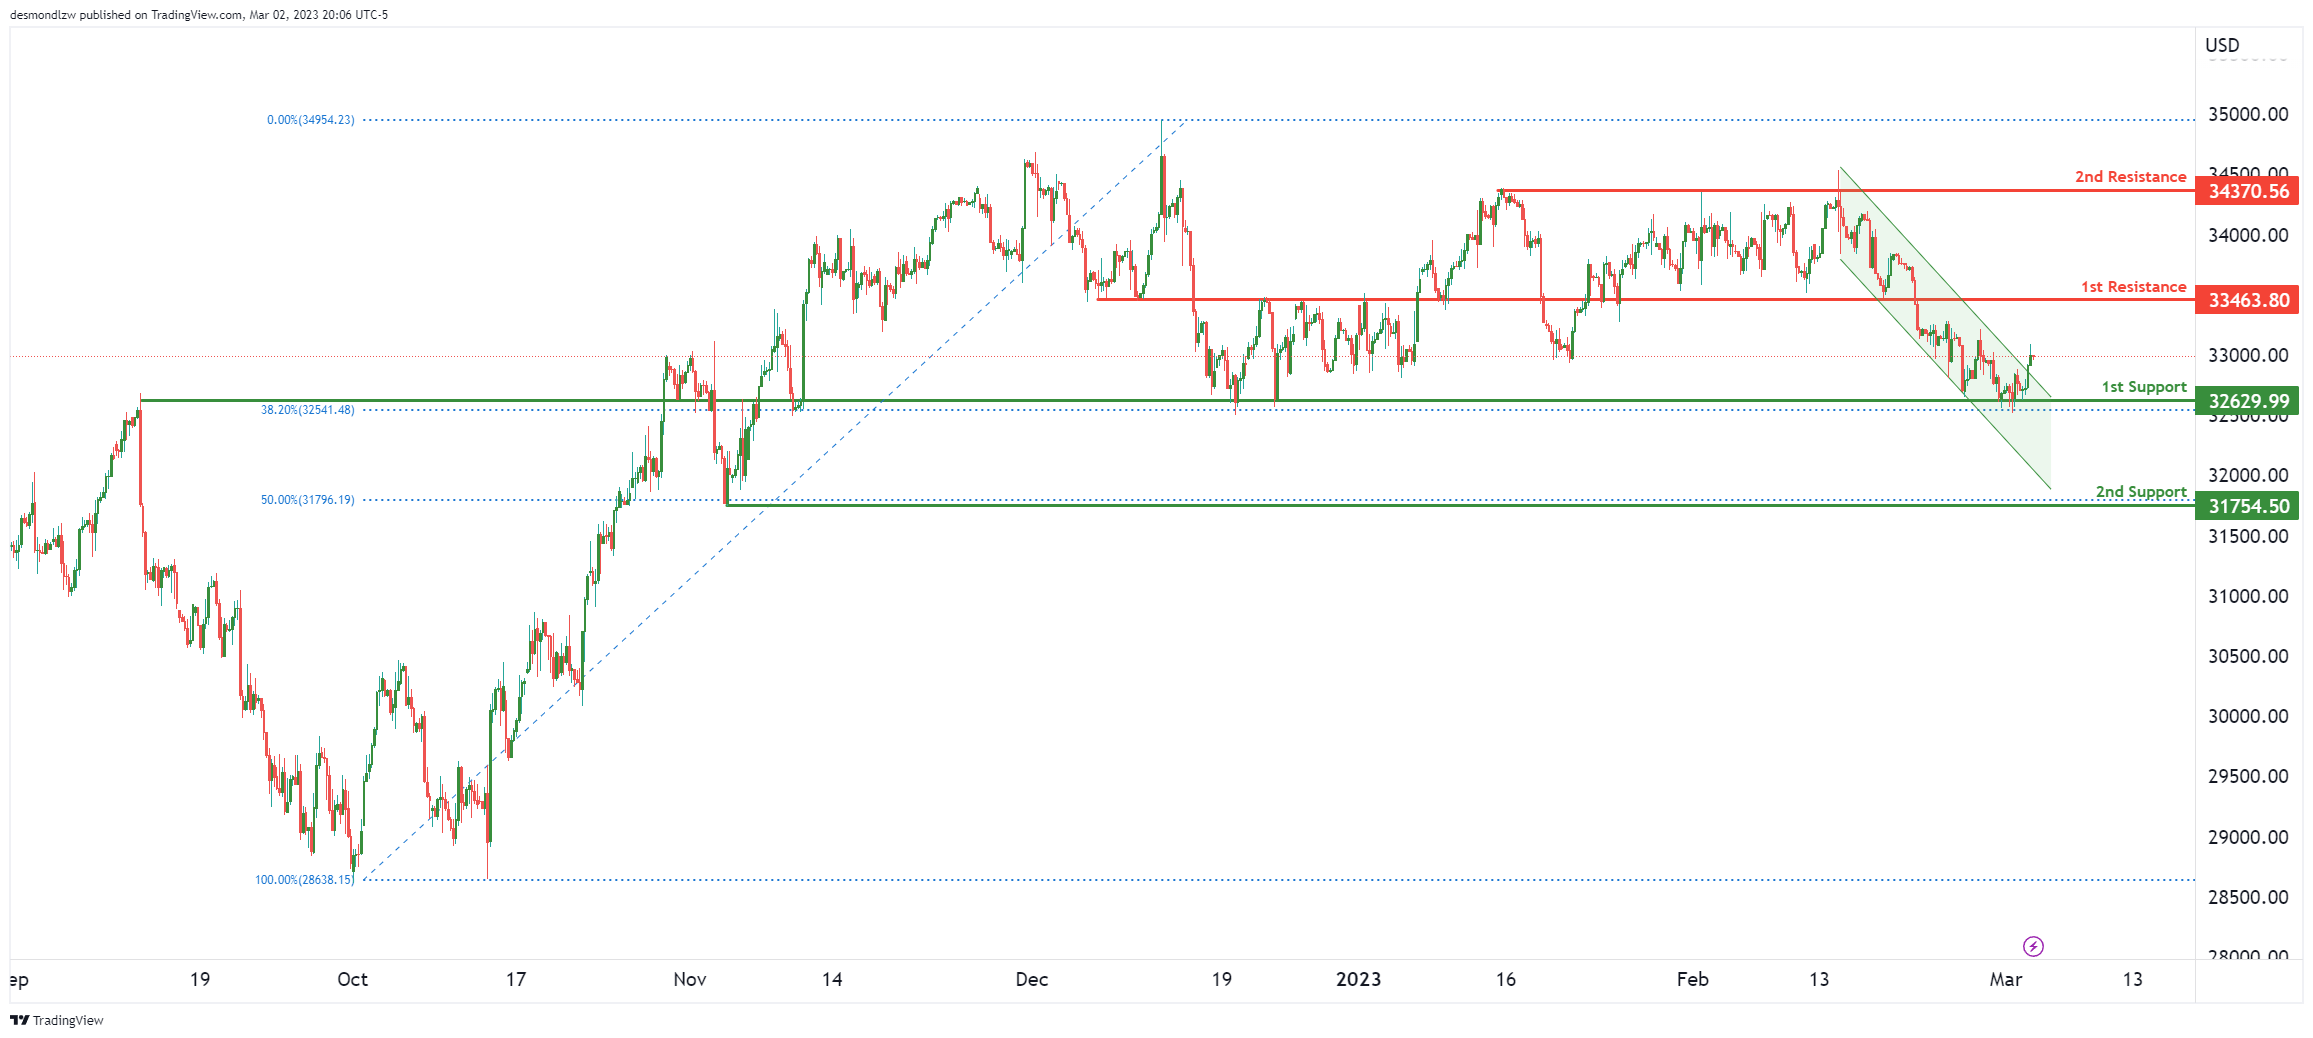
Price is testing our 1st support at 32629 that happens to be an overlap support and a major 38.2% Fibonacci retracement. Also, the price has broken from the descending channel triggering a bullish exit. If price were to bounce from here, it can make a further push up to 1st resistance at 33463 which is an overlap resistance.
Were prices to break the 1st support, the next key level to watch out for is the 2nd support at 31754 which is a smaller swing low support that lines up with the 50% Fibonacci retracement.
GER30:
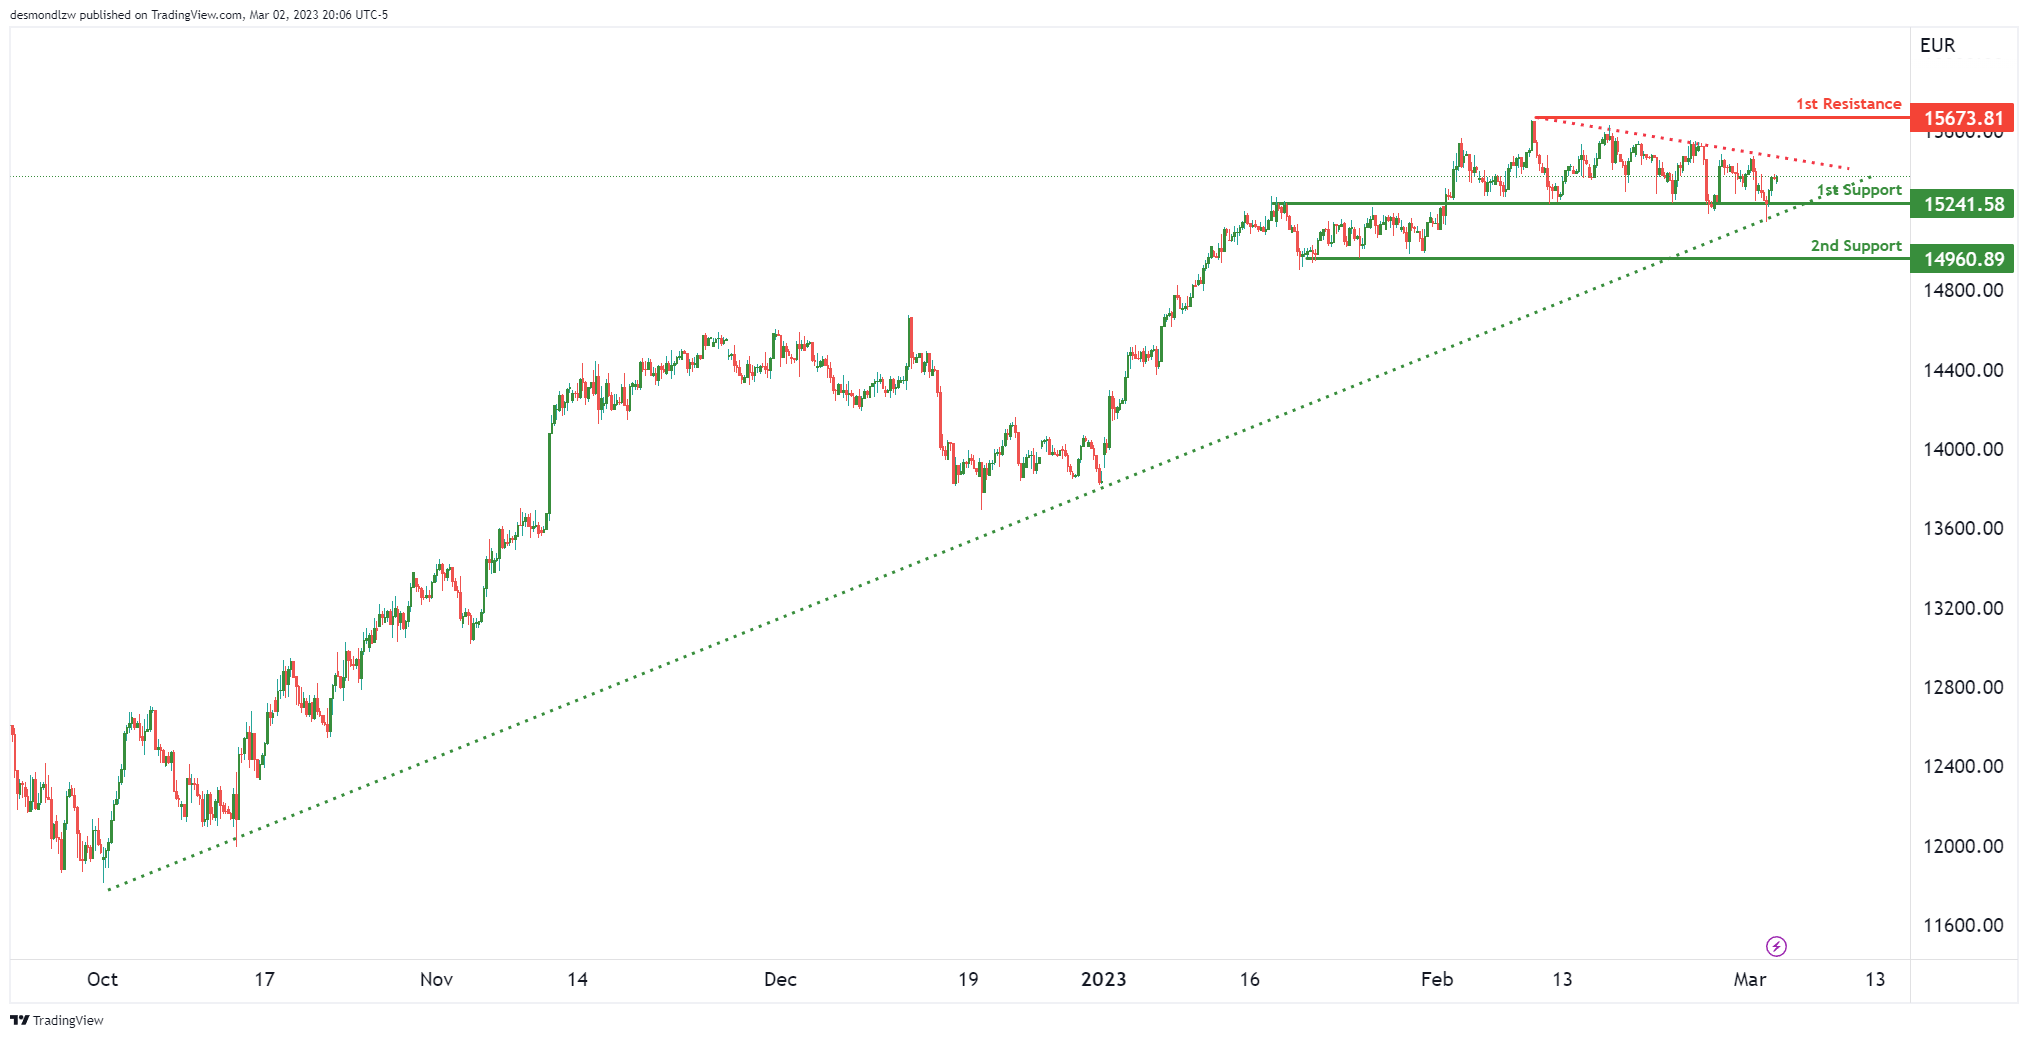
Price has respected our support trendline and price bounce up from our 1st support at 15241 where there is overlap support. However, if prices were to break the descending resistance price could rally up to our 1st resistance at 15673. However if price were to break ascending line, we could see price drop to our 2nd support at 14960
BTC/USD:
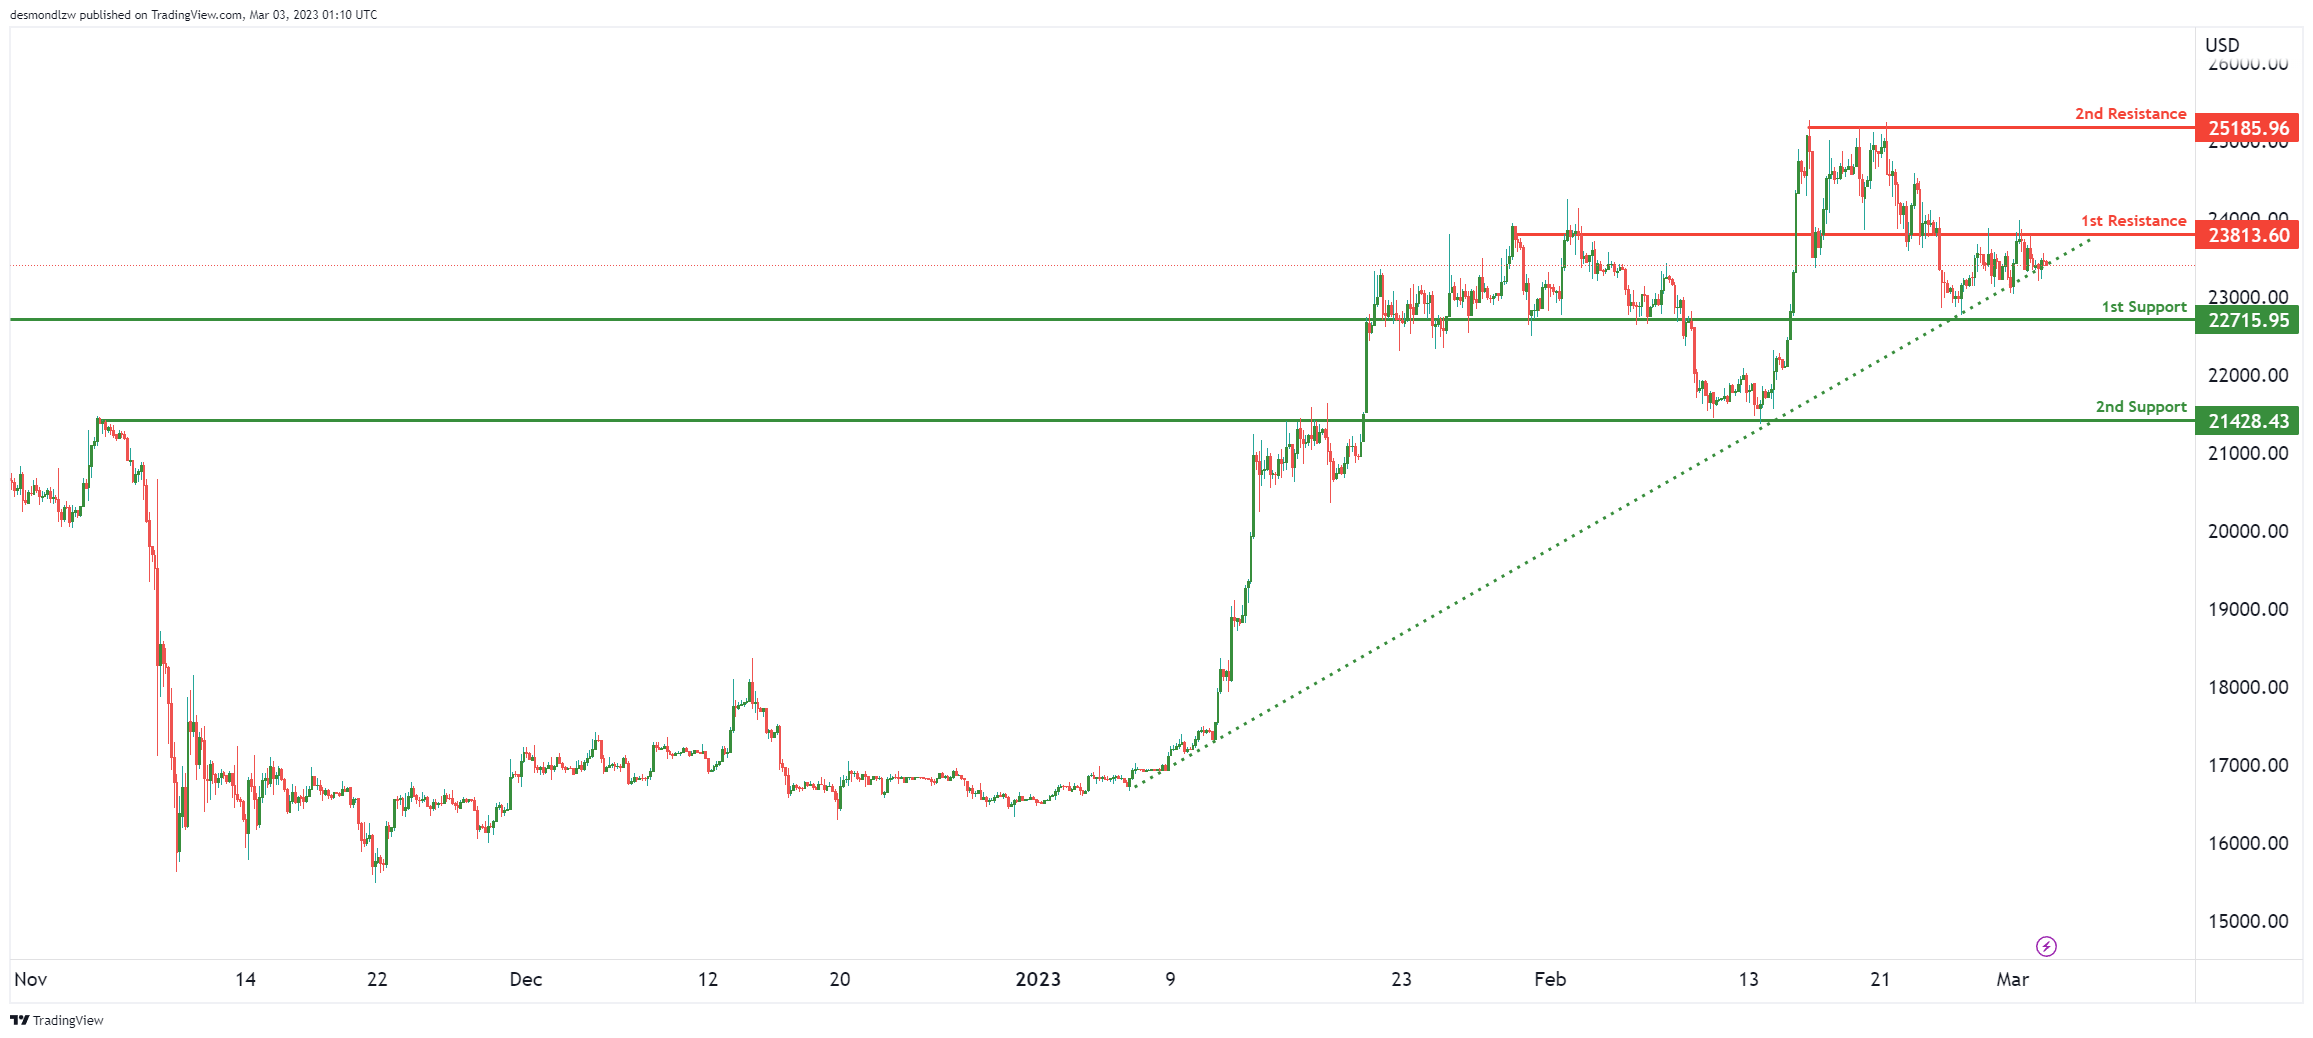
Price is seeing an ascending support line squeeze prices against the 1st resistance at 23813 which is an overlap resistance. If prices were to break past the 1st resistance, we could see a rally up to recent swing high resistance at 25185.
However, if prices were to break the ascending support line, we could see a drop to 1st support at 22715 which is a long-term overlap support.
US500
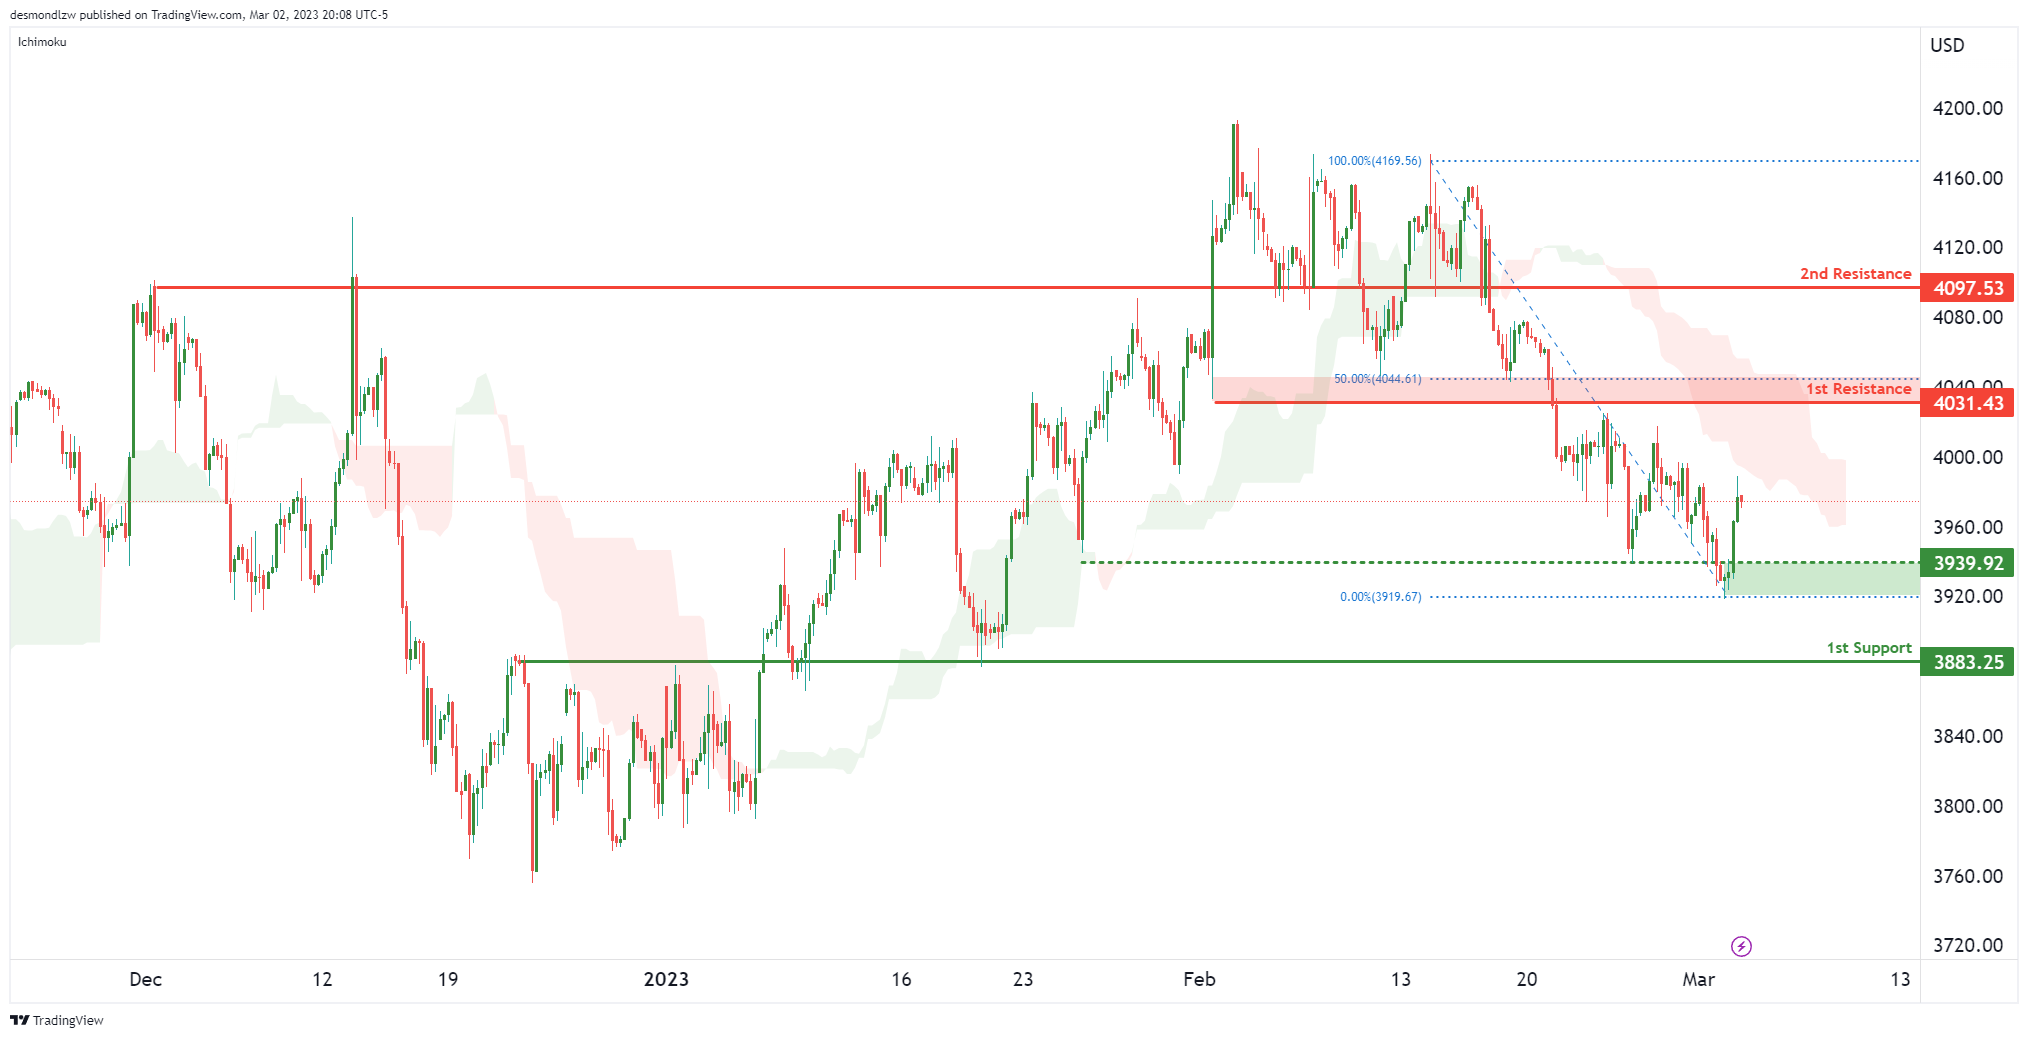
We are seeing price test our 1st support at 3939 and this could see a bounce that pushes it up to our 1st resistant at 4031 which is a pullback resistance along with a 50% Fibonacci Retacement. If price were to break this level, we could potentially see price push up to our 2nd resistance at 4097 which is an overlap resistance.
However, if price could not break through our 1st resistance, we could potentially see price drop to our 1st support at 2883
ETH/USD:
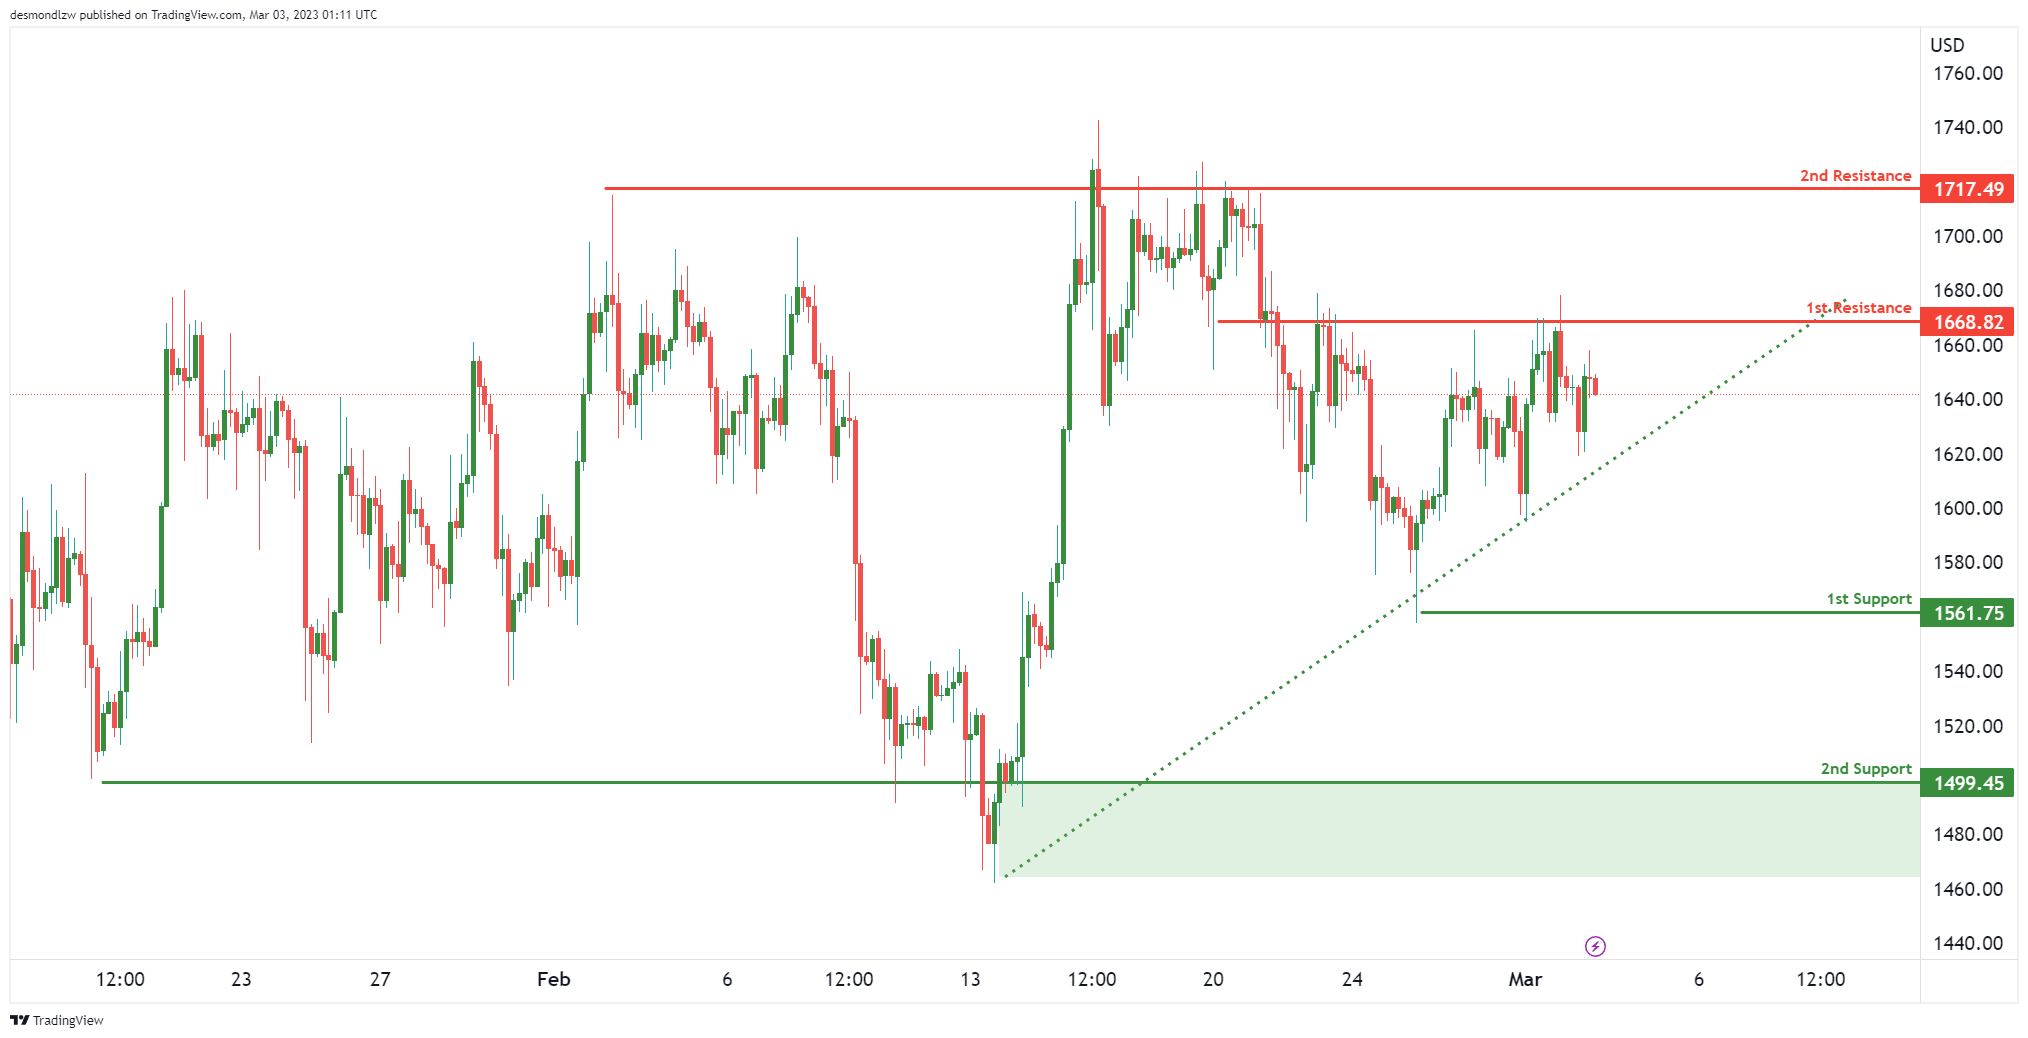
Price is testing our 1st resistance at 1668 where the overlap resistance is. At the same time, it is being pushed up by our ascending support trend line. If prices were to break our 1st resistance, we could see a bigger push up to 2nd resistance at 1717 which is a major swing high resistance.
However, if prices were to break the ascending support line, we could see a drop to 1561 which is our 1st support that coincides with the swing low support.
BCO/USD:
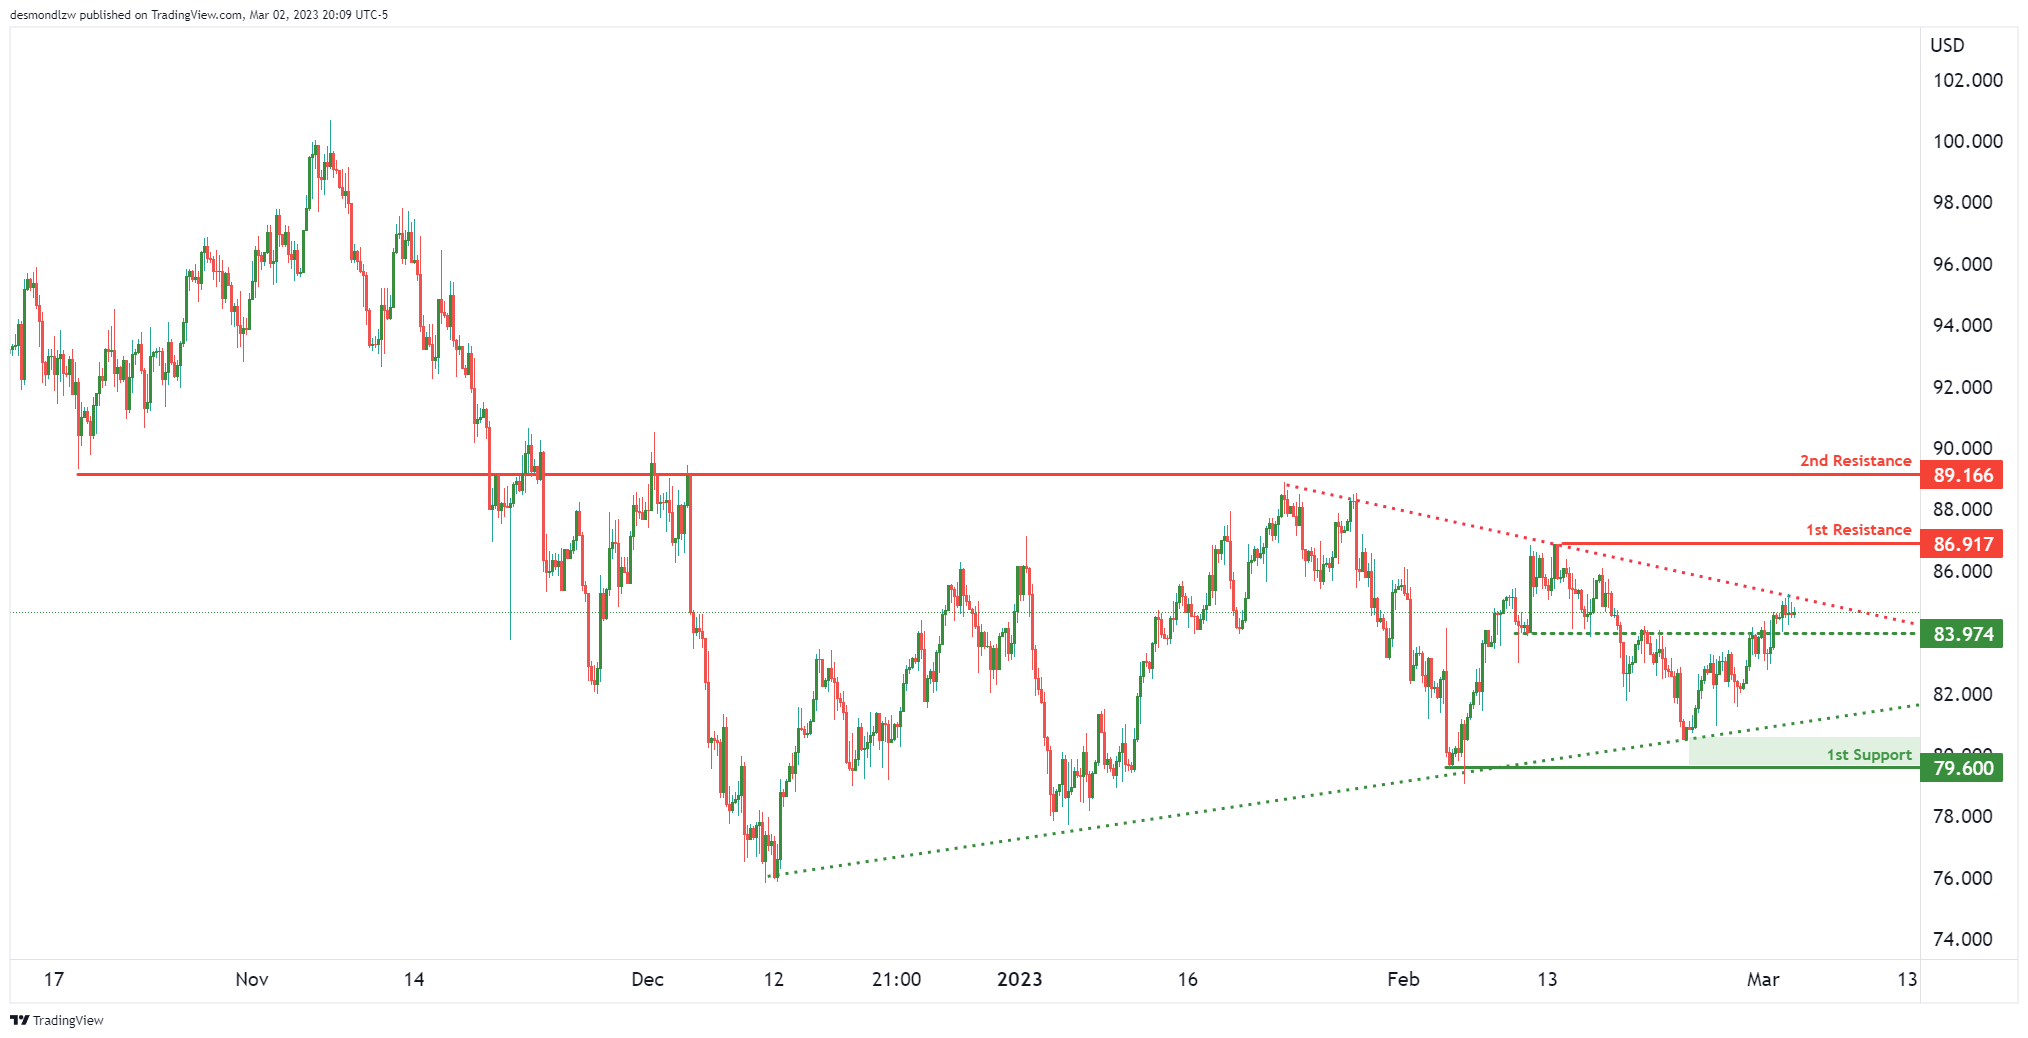
We’re seeing a long term ascending support line and a descending resistance line squeeze prices together. There is an intermediate support at 83.97 which is pushing prices up against the descending resistance line. If prices were to break that descending resistance line, we could see a bigger push up to 86.91 which is our 1st swing high resistance. Breaking that level, a bigger push up to 89.16 is possible which is a big overlap resistance.
However, if prices were to react off the descending resistance and make a push down, the 1st support is at 79.60 which is a recent swing low support.
XAU/USD (GOLD):
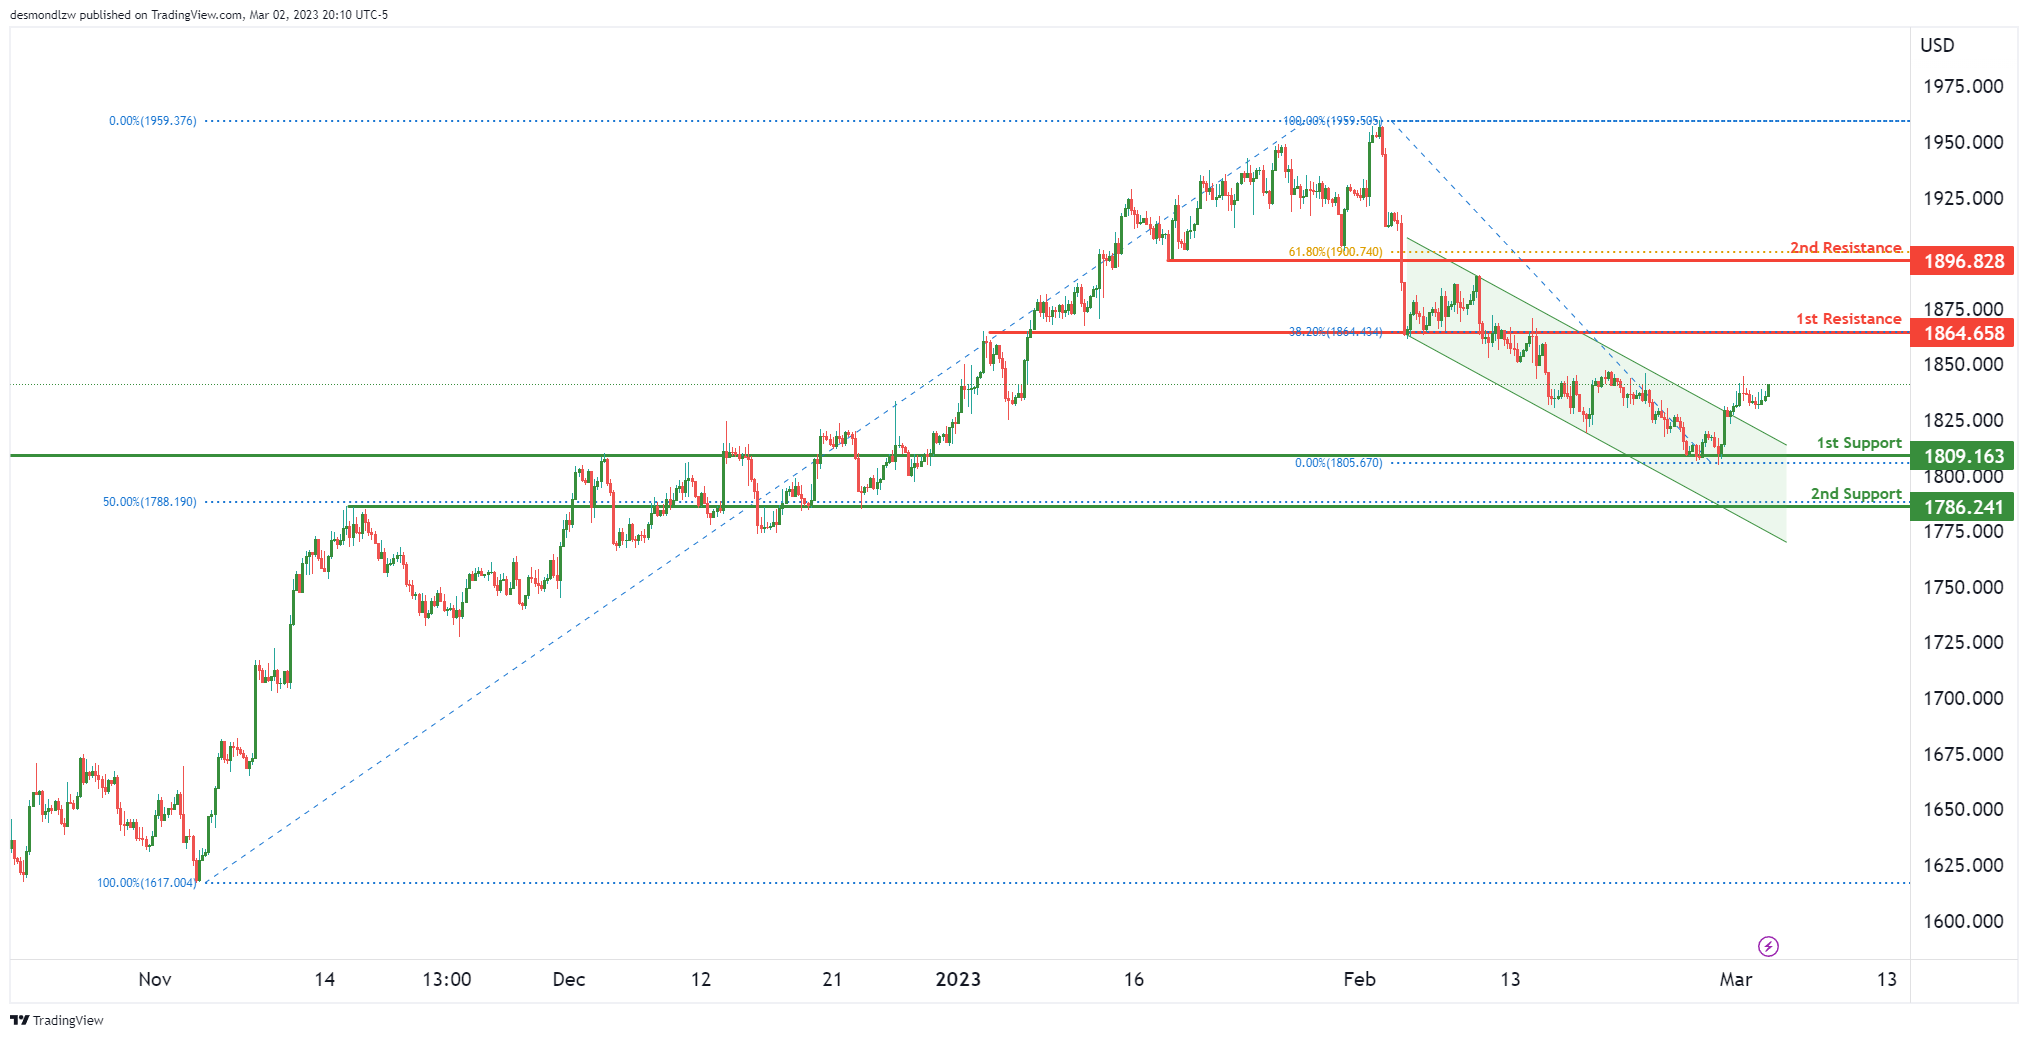
Price has broken out of a recent bearish channel suggesting a bullish move might be on the cards. We’re seeing the 1st resistance at 1864 which is an overlap resistance that lines up with the 38.2% Fibonacci retracement. If prices were to break that level, the next key resistance is at 1896 which is a pullback resistance lining up with the 61.8% Fibonacci retracement.
In terms of support, we have an overlap support at 1809 and a further 2nd support at 1786 which lines up nicely with our 50% Fibonacci retracement.
China PMI services rose to 55.0, composite rose to 54.2
China Caixin PMI Services rose from 52.9 to 55.0 in February, above expectation of 54.7. That's also the highest reading since April 2021. PMI Composite rose from 51.1 to 54.2, highest since May 2021.
Wang Zhe, Senior Economist at Caixin Insight Group said: "Both manufacturing and services activity recovered gradually. Production, demand, including external demand, and employment all grew, with services activity showing a stronger recovery than manufacturing output. Input costs and prices charged remained stable, and business owners were highly optimistic."
Fed Waller: May need rate above 5.1-5.4% if data continue to be too hot
Fed Governor Christopher Waller said that "a barrage of data" in February has challenged high view that FOMC was "making progress in moderating economic activity and reducing inflation."
"It could be that progress has stalled, or it is possible that the numbers released last month were a blip," he said.
"If job creation drops back down to a level consistent with the downward trajectory seen late last year and CPI inflation pulls back significantly from the January numbers and resumes its downward path, then I would endorse raising the target range for the federal funds rate a couple more times, to a projected terminal rate between 5.1 and 5.4 percent," he said.
"On the other hand, if those data reports continue to come in too hot, the policy target range will have to be raised this year even more to ensure that we do not lose the momentum that was in place before the data for January were released," he added.