

Sample Category Title
USD/JPY Bounces Back
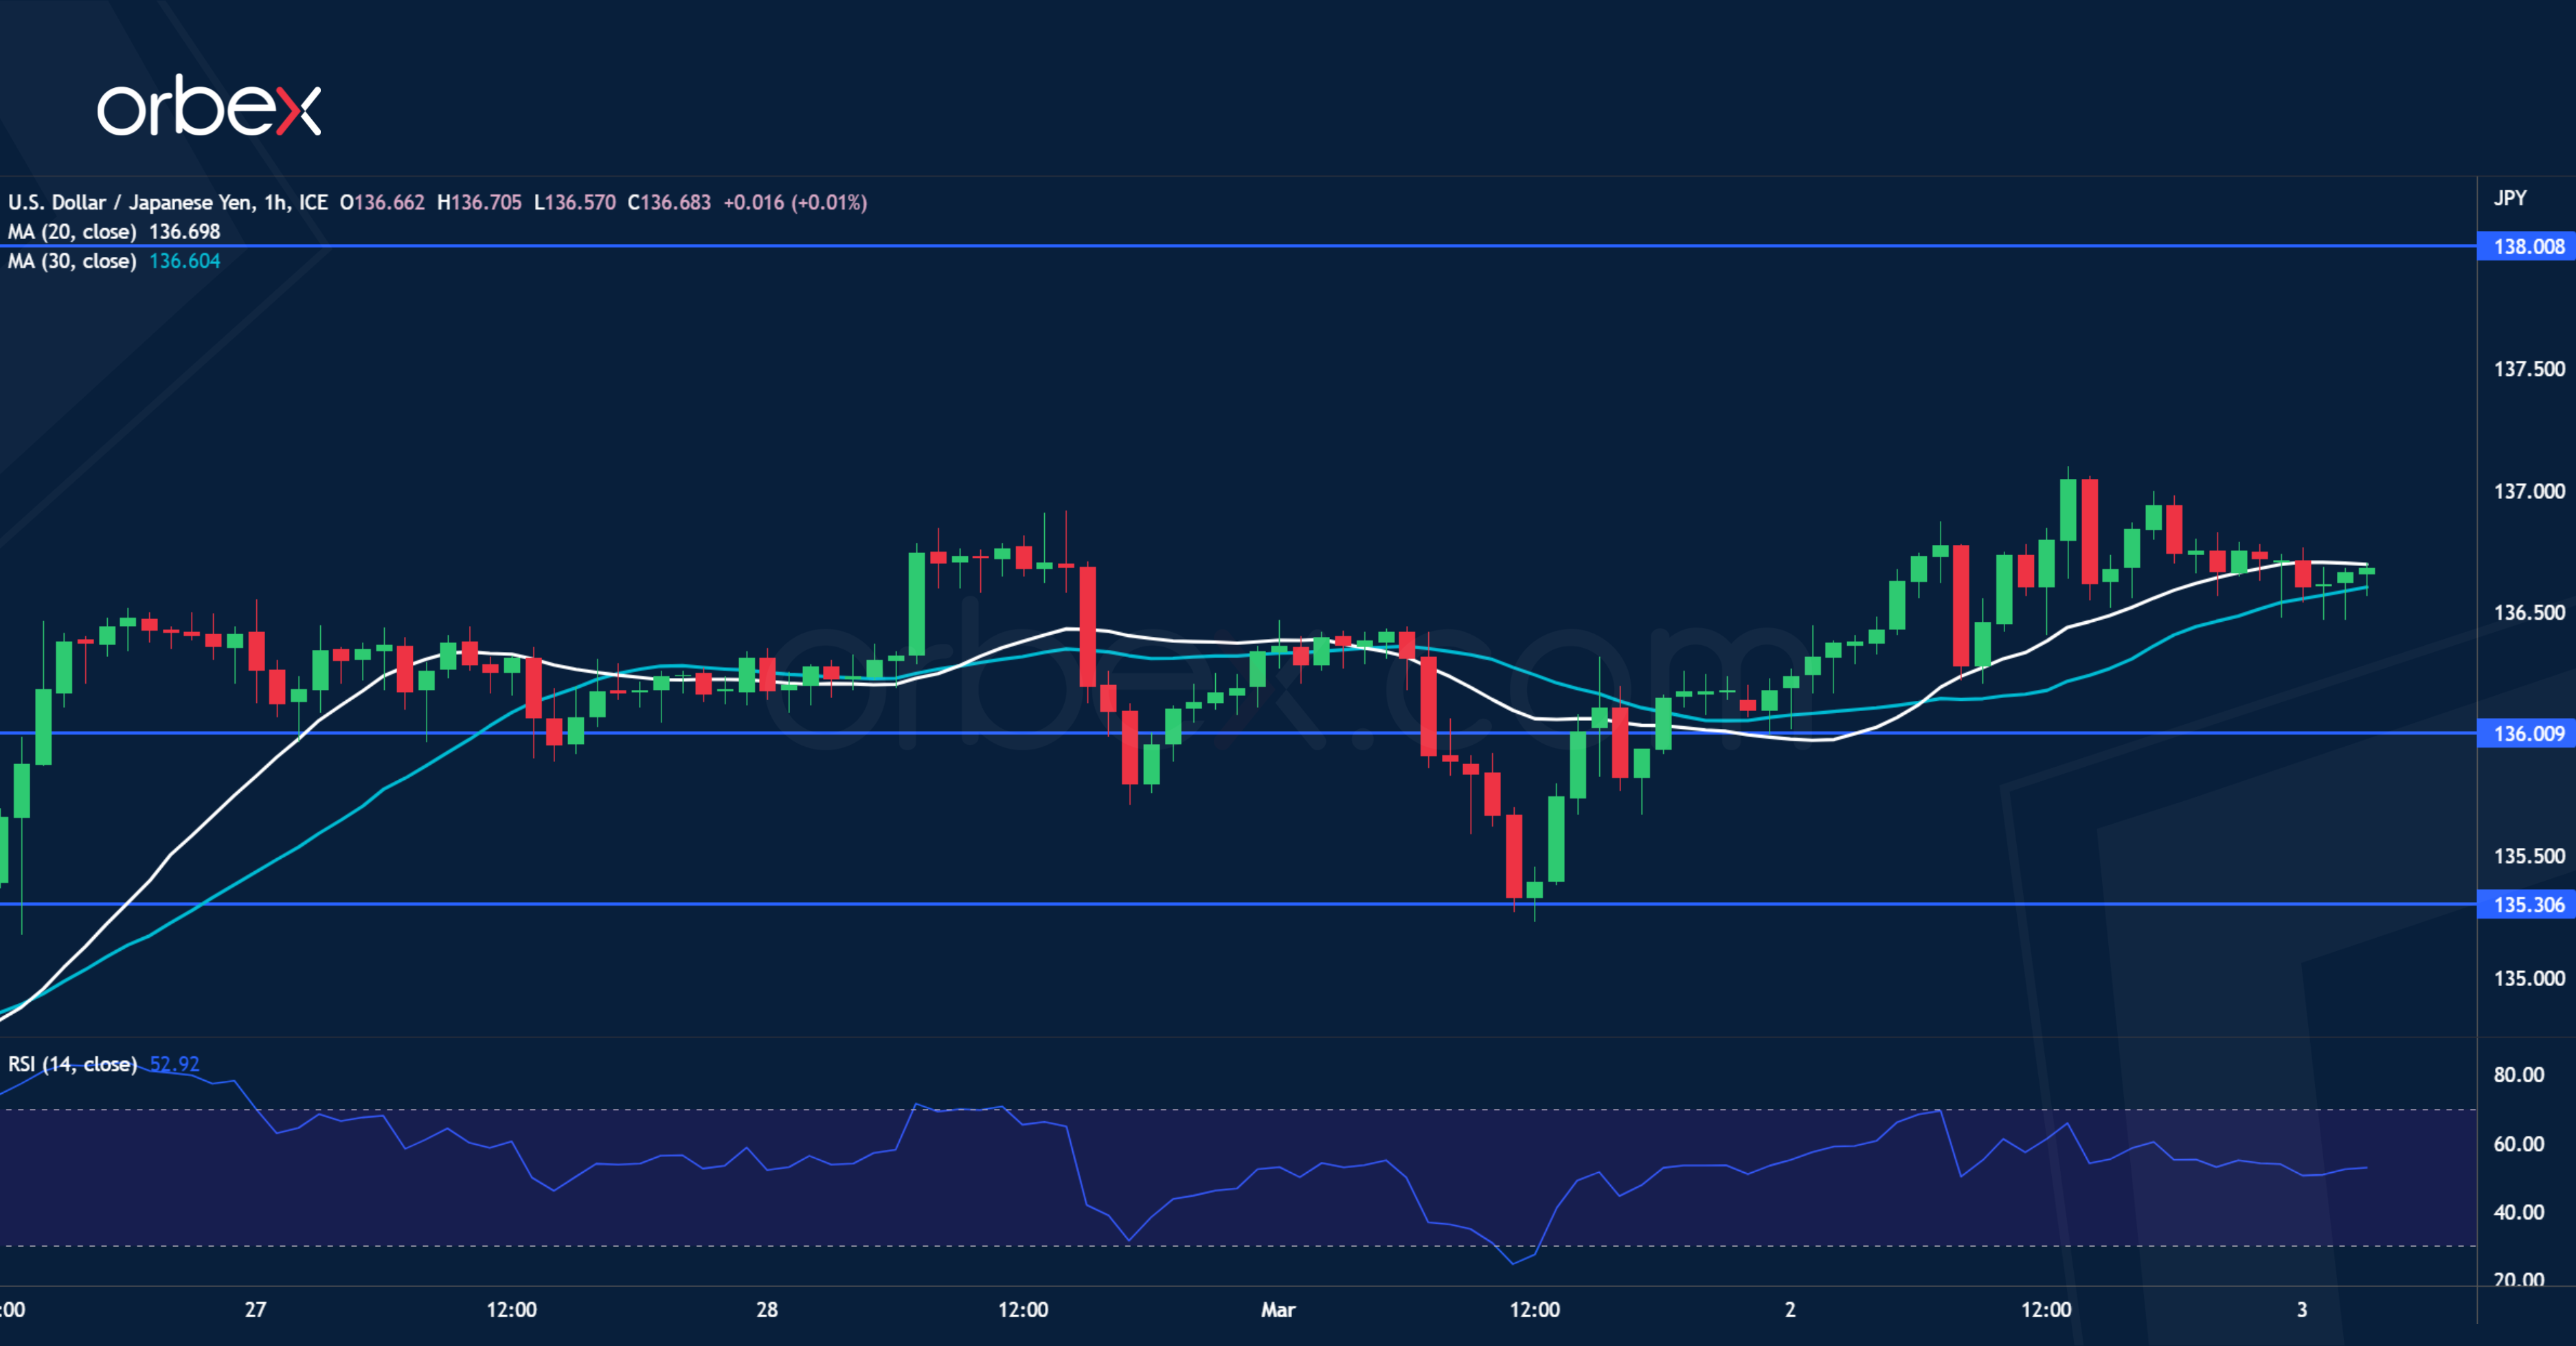
The Japanese yen recouped some losses after a drop in the January unemployment rate. A relentless rally shows that the US dollar’s recovery is still going strong. A brief pullback has met strong buying interests at the resistance-turned-support of 135.30. A subsequent break above 136.40 suggests that the bulls are still in the game and a close above 136.90 would seal the deal by flushing out the remaining bears. December’s high of 138.00 would be the next resistance. 136.00 is the closest support in case of further hesitation.
Market Focus Will be on US Services ISM
Markets
EMU February CPI data logically summarized/confirmed evidence from national data. At 0.8% M/M and 8.5% Y/Y, EMU headline inflation ‘slowed’ (8.6% in January) far less than hoped for. Core inflation even set a new high, rising from 5.3% to 5.6%. In the run-up to the CPI release, ECB Lagarde already reiterated that the ECB will be as tight as necessary to arrest inflation. German yields trended higher in the run-up to the CPI, but fell prey to a mild ‘ buy-to-rumour, sell-the-fact’ reaction afterwards. Minutes of the February ECB meeting didn’t bring much news for markets. Sticky inflation justifies the ECB’s ‘higher for longer approach’ and there is no risk of overtightening yet. At the same time, some (dovish) ECB governors warned to be cautions to focus too much on core inflation. At least for now, this concern isn’t confirmed by the data. In this respect, ECB’s Wunsch said that if underlying prices pressures stay elevated, ‘looking at rates of 4% would not be excluded’. German yields closed the session between 1.1 bp (2-y) and 4.7 bps higher. US eco data at first looked second tier. Weekly jobless claims again printed at a very low 190k, confirming a persistent tight labour market. Remarkably, US yields jumped a few bps higher on an what normally would be considered an ‘outdated’ upward revision of Q4 unit labour cost data (3.2% from 1.6% initially). In a steepening move, US yields closed the session between 0.9 bps (2-y) and 6.3 bps (10-y) higher. Intraday, also the 30-y temporary jumped above 4%. The rise in LT US yields was again mainly driven by higher inflation expectations rather than by real yields. Fed governors Bostic and Waller reconfirmed a data dependent approach, meaning that they are prepared to raise the policy rate beyond the December dots if inflation and labour market data continue to hold stronger/higher than envisaged earlier. The mild rise in real yields still gives some comfort to equity investors. The EuroStoxx 50 overcame an earlier loss of about 0.8% to close 0.6% in green. US indices gained between 0.73% (Nasdaq) and 1.05% (Dow). The dollar this time rebounded despite a constructive equity sentiment. DXY closed just below the 105 mark (open about 104.40). The post CPI ‘easing’ on European yield markets at the same time also triggered some euro profit taking. EUR/USD dropped from an open near 1.0665 to close near 1.06. In technical trading, EUR/GBP held a very tight sideways range in the upper half of the 0.88 big figure.
Asian equities join the positive mood on WS yesterday evening, with the Nikkei outperforming. The dollar eases slightly after yesterday’s rebound. US Treasuries gain marginally. Later today, the market focus will be on the US services ISM. Together with next week’s payrolls and the US CPI (14 March), this will be a last important input for the March 22 Fed meeting as services inflation is a key factor in the Fed’s policy assessment. A mild easing to a still solid 54.5 (from 55.2) is expected. After the recent protracted rise in yields, a substantial upside surprise is probably needed to trigger a further upleg in US yields. Nevertheless the trend remains firmly in place. Aside from the CPI data, plenty of ECB and Fed governors speak. If risk sentiment remains constructive, the dollar might cede some further ground. However we would be surprise to see EUR/USD break out of the 1.06/1.07 ST consolidation pattern.
News Headlines
Headline Tokyo inflation slowed from 4.4% Y/Y to 3.4% Y/Y in February with government subsidies for electricity and utilities being responsible for this significant slowdown. This becomes most visible in the CPI metric excluding fresh food and energy costs, which accelerated from 3% Y/Y to 3.2% Y/Y, the highest level since the early ‘90s. It shows evidence of still rising prices for processed food and for consumer durables and suggests a strong underlying (core) inflation trend. It will be interesting to see in coming weeks whether BoJ governor-nominee Ueda hides behind the drop in headline inflation or picks up the baton against strong core inflation. Today’s Japanese labour market data showed the jobless rate falling from 2.5% to 2.4% in January with the job-to-applicant ratio marginally lower at 1.35 from 1.36. The Japanese yen holds near weakest levels since the start of the year with USD/JPY trying to take out 136.67 resistance (38% retracement on October to January decline).
GBP/JPY Daily Outlook
Daily Pivots: (S1) 163.01; (P) 163.47; (R1) 163.87; More...
Intraday bias in GBP/JPY stays neutral at this point, as consolidation from 165.99 is extending. Further rally is still expected as long as 161.18 support holds. As noted before, corrective fall from 172.11 should have completed at 155.33 already. Break of 165.99 will target 169.26 resistance first, and then 172.11 high.
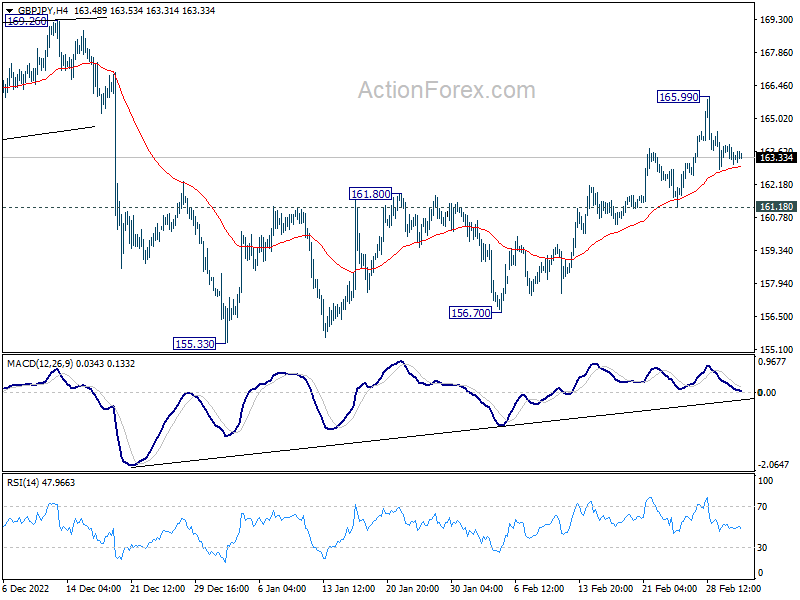
In the bigger picture, corrective decline from 172.11 medium term should have completed at 155.33. With 38.2% retracement of 123.94 (2020 low) to 172.11 (2022 high) at 153.70 intact, medium term bullishness is retained. That is, larger up trend from 123.94 (2020 low) is still in progress. Break of 172.11 high to resume such up trend is expected at a later stage.
EUR/JPY Daily Outlook
Daily Pivots: (S1) 144.62; (P) 145.09; (R1) 145.41; More....
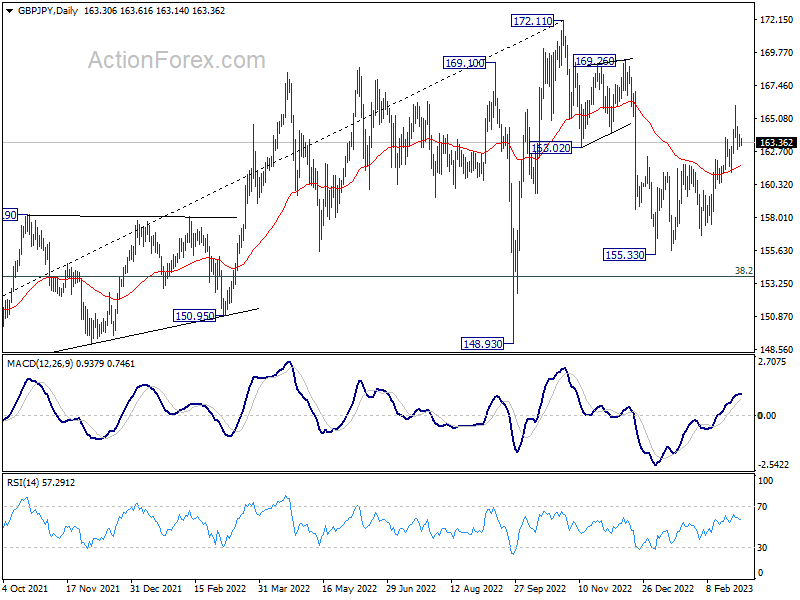
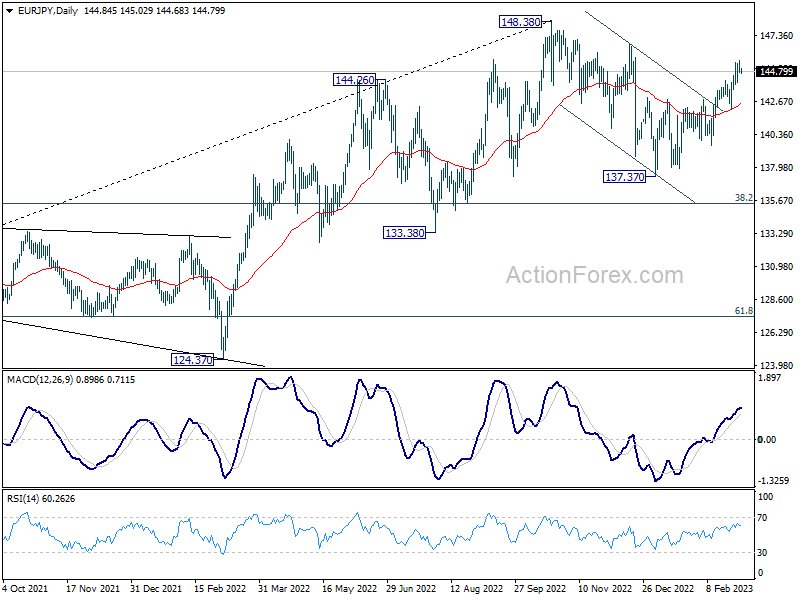
EUR/JPY lost momentum quickly after edging higher to 145.55 and intraday bias is turned neutral first. Further fall is expected as long as 142.13 support holds. Corrective fall from 148.38 has completed at 137.37 already. Break of 145.55 will resume the rise from1 37.37 to 146.71 resistance and then 148.38 high.
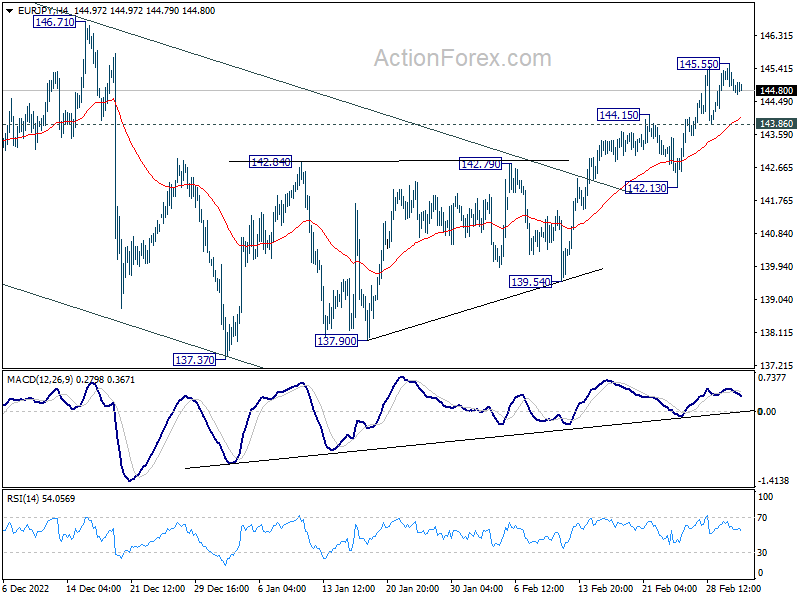
In the bigger picture, as long as 55 week EMA (now at 139.42) holds, larger up trend from 114.42 (2020 low) is still in progress for 149.76 long term resistance. However, firm break of 55 week EMA will bring deeper fall to 38.2% retracement of 114.42 to 148.38 at 135.40. Sustained break there will raise the chance of trend reversal, and target 61.8% retracement at 127.39.
EUR/GBP Daily Outlook
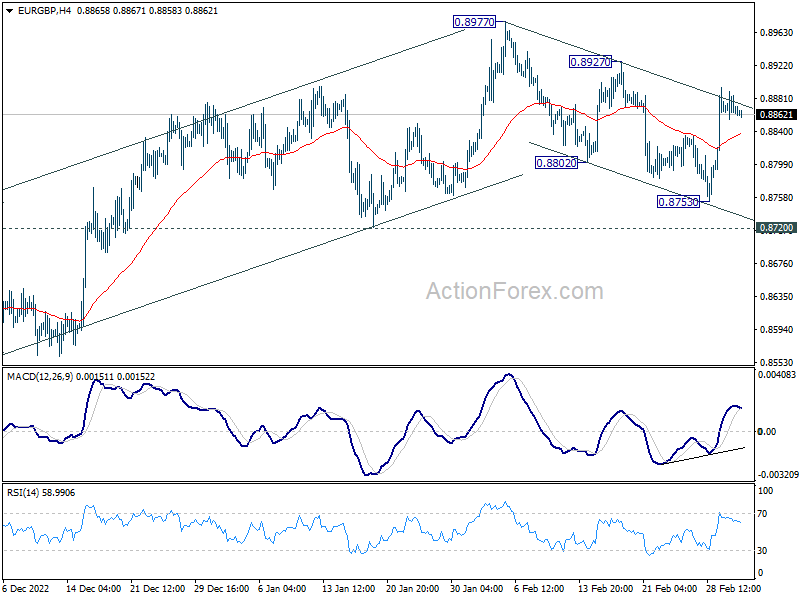
Daily Pivots: (S1) 0.8853; (P) 0.8872; (R1) 0.8889; More...
Outlook in EUR/GBP remains unchanged and intraday bias stays on the upside. Corrective fall from 0.8977 should have completed with three waves down to 0.8753, ahead of 0.8720 support. The development in turn suggests that rise from 0.8545 is not over. Further rise should be seen back to retest 0.8977 next.
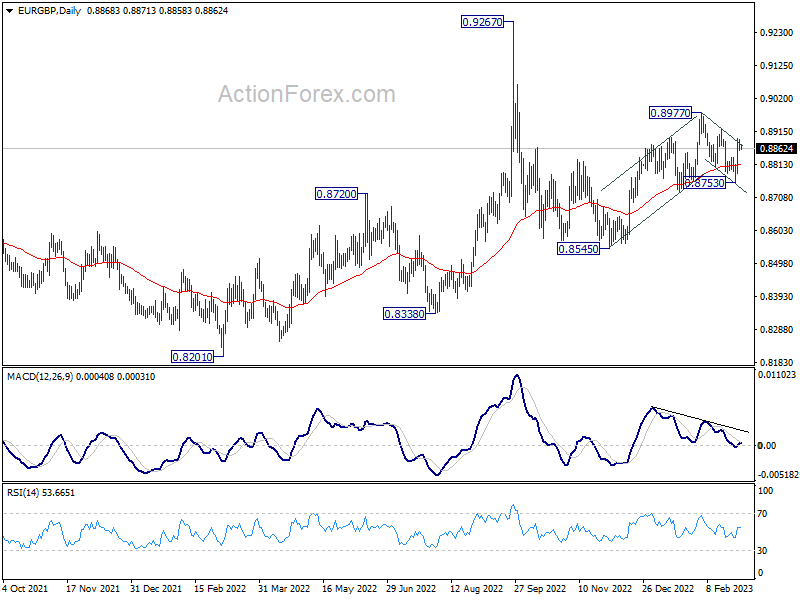
In the bigger picture, outlook is rather mixed for now, except that price actions from 0.9267 (2022 high) are part of the long term range pattern from 0.9499 (2020 high). With 0.8720 support intact, rise from 0.8545 is in favor to continue through 0.8977. However, firm break of 0.8720 will argue that such rebound has completed, and open up deeper fall through this support level.
EUR/AUD Daily Outlook
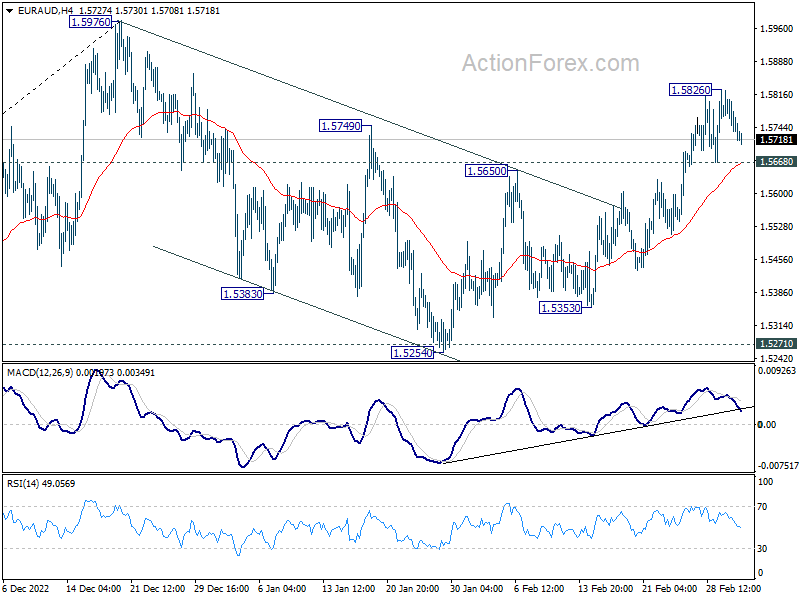
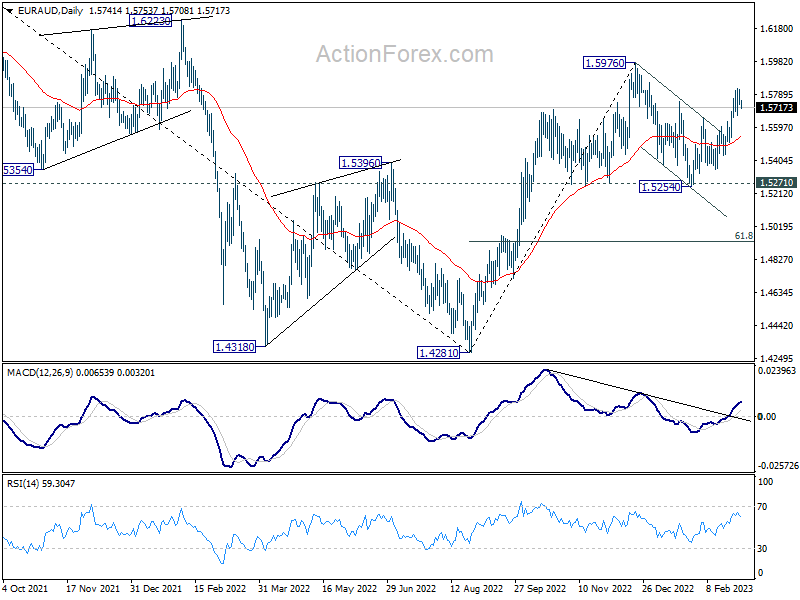
Daily Pivots: (S1) 1.5714; (P) 1.5770; (R1) 1.5801; More...
Intraday bias in EUR/AUD is turned neutral again as it retreated after hitting 1.5826. Outlook is unchanged that corrective fall from 1.5976 has completed at 1.5254. Further rally is expected as long as 1.5650 resistance turned support holds. Break of 1.5826 will target a test on 1.5976 high.
In the bigger picture, it's still early to confirm if rise from 1.4281 represents bullish trend reversal. But as long as 1.5271 support holds, such rally is in favor to continue. Break of 1.5976 will target 1.6434 key resistance next. On the other hand, firm break of 1.5271 will retain medium term bearishness instead.
EUR/CHF Daily Outlook
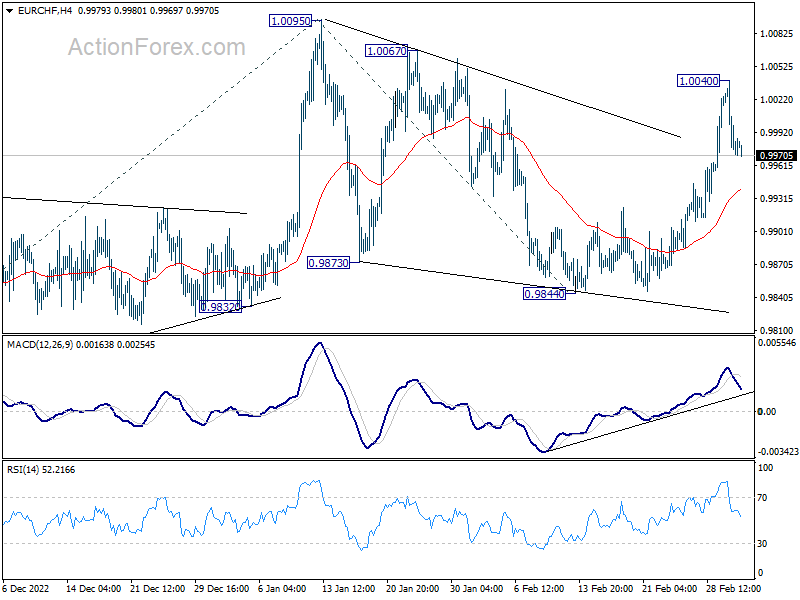
Daily Pivots: (S1) 0.9959; (P) 1.0001; (R1) 1.0027; More....
A temporary top was formed at 1.0040 with current retreat. Intraday bias is turned neutral first. Outlook is unchanged that corrective pattern from 1.0095 should have completed with three waves down to 0.9844. Above 1.0040 will bring retest of 1.0095 high. However, sustained break of 4 hour 55 EMA (now 0.9930) will delay the bullish case and bring deeper pull back first.
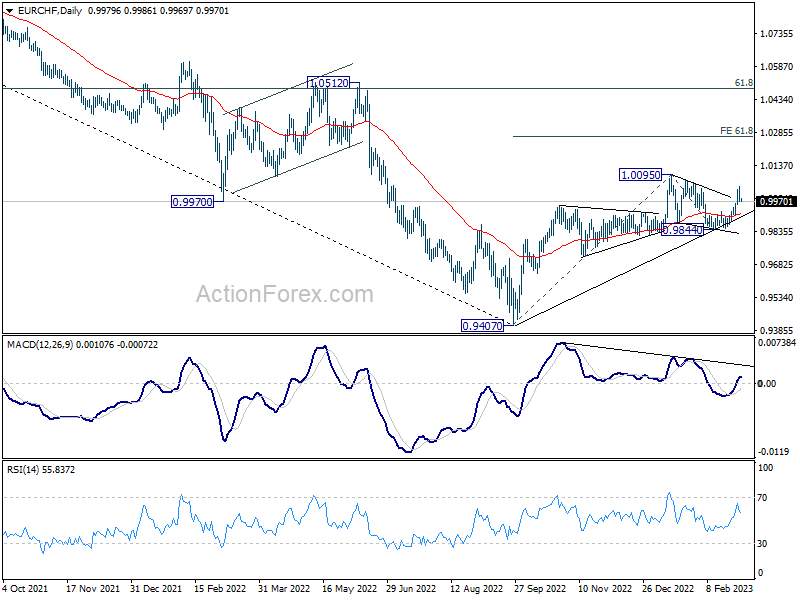
In the bigger picture, with 0.9832 support intact, rise from 0.9407 (2022 low) is still expected to continue. Break of 1.0095 and sustained trading above 55 week EMA (now at 1.0021) will be a medium term bullish signal, and bring further rally to 1.0505 cluster resistance (2020 low at 1.0505, 61.8% retracement of 1.1149 to 0.9407 at 1.1484). However, firm break of 0.9832 support will revive medium term bearishness and bring retest of 0.9407 low instead.
Elliott Wave View: Sideways Price Action in Oil (CL) May Result to the Upside
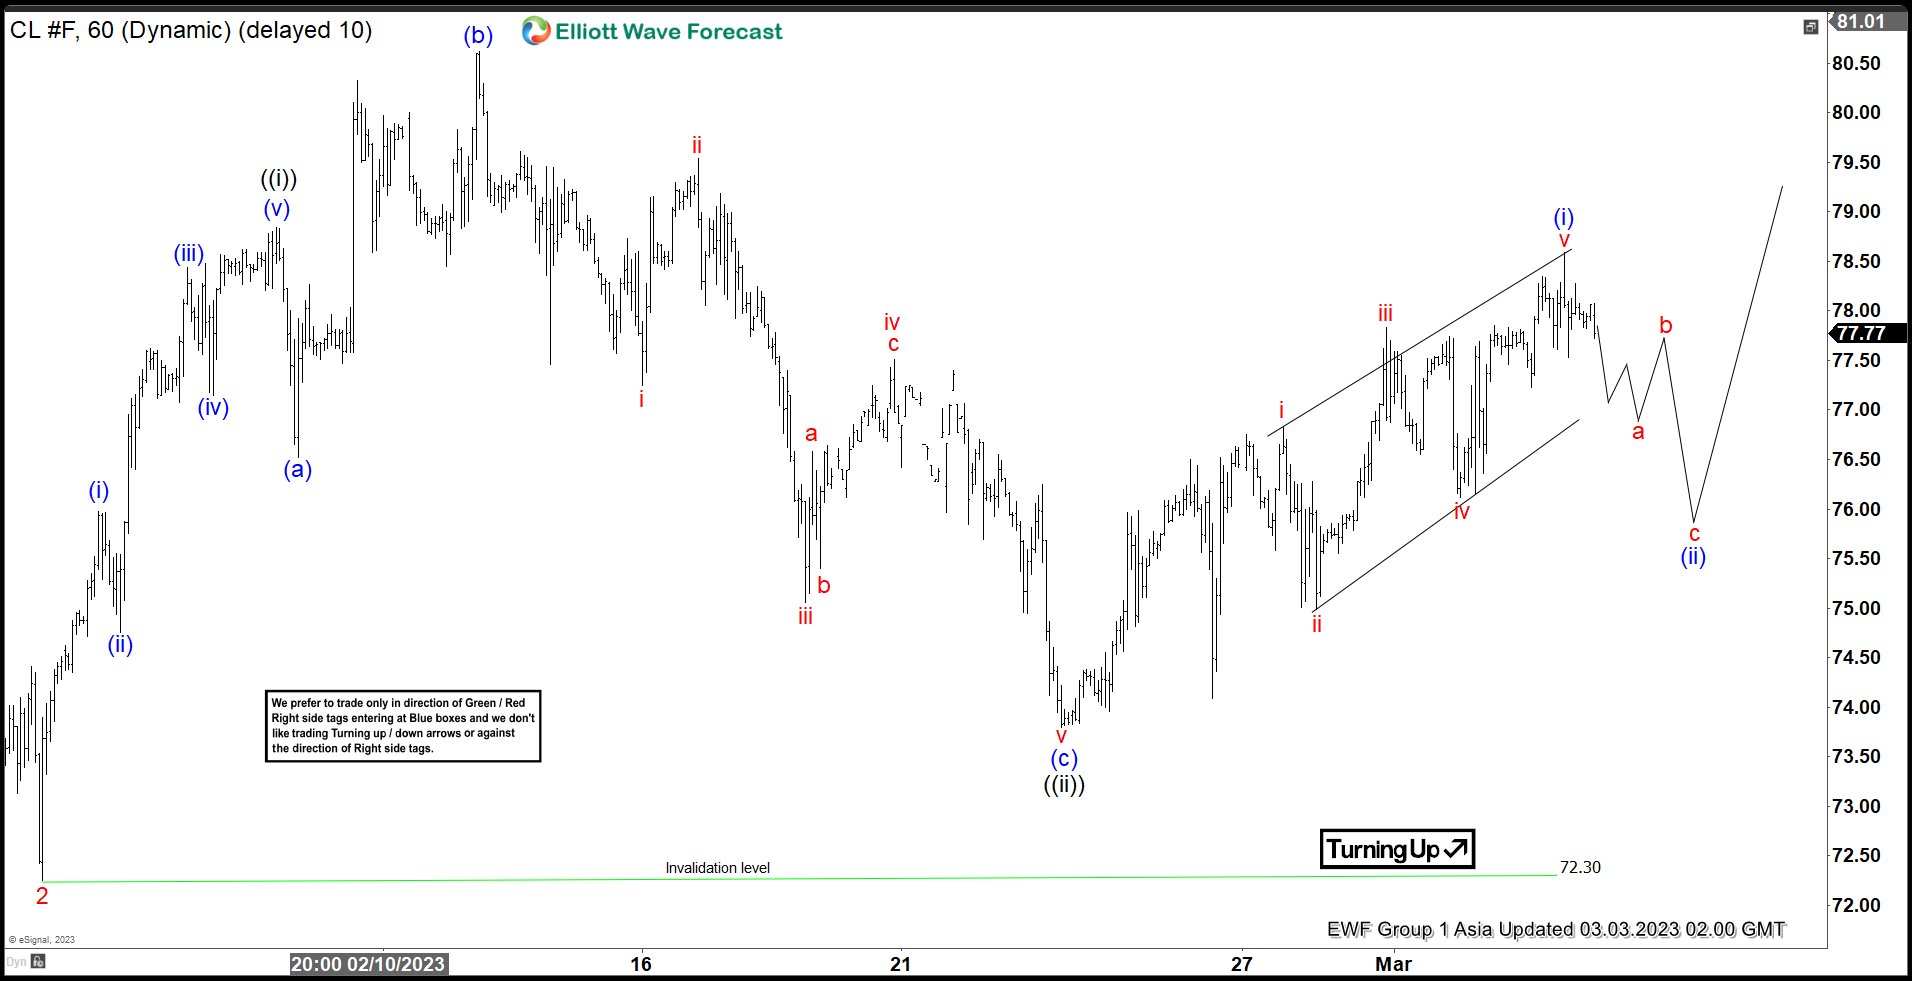
Cycle from 12.9.2022 low is in progress as a 5 waves impulse Elliott Wave structure. Up from 12.9.2022 low, wave 1 ended at 82.64 and pullback in wave 2 ended at 72.31. Internal subdivision of wave 2 unfolded as a zigzag Elliott Wave structure. Down from wave 1, wave (i) ended at 79.45 and rally in wave (ii) ended at 82.48. Oil then extends lower in wave (iii) towards 79.04 and wave (iv) ended at 80.49. Wave (v) ended at 76.55 which completed wave ((a)) in higher degree. Rally in wave ((b)) ended at 79.73.
Oil then extended lower in wave ((c)). Down from wave ((b)), wave (i) ended at 74.97 and rally in wave (ii) ended at 78. It then extends lower in wave (iii) towards 73.1, wave (iv) ended at 74.41, and final leg wave (v) ended at 72.31. This completed wave ((c)) and 2 in higher degree. Oil has turned higher in wave 3 with internal subdivision as another impulse. Up from wave 2, wave ((i)) ended at 78.84. Pullback in wave ((ii)) ended at 73.80 with internal subdivision as an expanded flat. Down from wave ((i)), wave (a) ended at 76.52, wave (b) ended at 80.62, and wave (c) ended at 73.80. Oil has turned higher in wave ((iii)). Near term, as far as pivot at 72.31 low stays intact, expect pullback to find support in 3, 7, 11 swing for further upside.
Oil 60 Minutes Hour Elliott Wave Chart
Inflation, Central Bank Hawks, and China
The Eurozone’s flash CPI estimate looked as ugly as it smelled beforehand. Inflation in the Eurozone is estimated to have barely eased to 8.5% from 8.6% printed a month earlier, while core inflation advanced to a record of 5.6%, from 5.3% printed previously.
Inflation has not been transitory, but disinflation could be.
The latest CPI update confirmed the European Central Bank (ECB) hawks’ aggressive positioning for further rate hikes. The ECB head Christine Lagarde told the Spanish TV that the rate hikes will continue beyond the next 50bp hike. The ECB meeting minutes showed that policymakers are betting for a soft landing at this point, and they are not worried about a too aggressive policy tightening.
All that pushed the European yields further up yesterday.
The kneejerk reaction from the equity markets was a selloff. The Stoxx 600 dived to a month low, but then rebounded as a big part of the disappointment was already broadly priced in and out, so tactical investors took profit on a bearish trade and walked away.
As a result, and despite higher yields across the board, the Stoxx 600 closed Thursday’s session 0.50% higher.
Stickiness doesn’t only concern inflation, but also the bullishness of equity investors.
The euro, on the other hand, gave a timid reaction to the CPI data and spent most of the day giving back field against the dollar. The EURUSD is around 1.06 at the time of writing.
From a technical standpoint, the bullish trend remains intact but looks vulnerable due to potentially stronger Federal Reserve (Fed) hawks. The key support is seen between 1.0470/1.05, including the 200-DMA, and the major 38.2% Fibonacci retracement on September to February rally.
The only silver lining in the inflation data is that, February is the last month where we compare the war times to no-war months. Therefore, the base effect should ease the positive pressure on fresh figures starting from March. But this is just an expectation. It is not a certainty. Until we have the certainty, the yields are up, and outlook for equities is… well, AT RISK.
The gowing gap between the stock and bond markets is alarming. The most likely scenario is a significant correction in stock valuations. A stock rally is unsustainable if yields are headed higher.
Latest jobs figures heats inflation worries
Fresh jobs data came to fan the inflation worries yesterday in the US. Weekly jobless claims came in lower than expected, unit labour costs surged 3.2% in Q4, much slower than the 8.2% printed at the Q1 of last year, but twice as fast as predicted by analysts. For the full year of 2022, unit labour costs surged 6.6%, compared to only 2.6% printed for 2021.
Fresh data is just another piece of a puzzle where we start getting a bad sense of what’s next.
But again, 2021 was a peaceful year, while 2022 was a war set up. We will start seeing an important easing just due to the base effect in the coming months. Is this what keeps equity investors swimming against the tide? Hope that the latest uptick in inflation is transitory?!
The US, the 2-year yield came a notch closer to the 5% mark, the 10-year yield advanced further above the 4% level, while the 30-year yield hit 4% for the first time since November.
There is no doubt in the bond markets about the direction. It’s down.
What’s bizarre is the reaction in equity markets. Yes, the S&P500 kicked off the day in the negative, even tipped a toe below the so-closely-watched 200-DMA. But the index rebounded on the back of dovish comments from Raphael Bostic, who said that the Fed should pause the rate hikes sometime this summer.
Well, if the equity rally is holding on to a few dovish-sounding comments, defying fresh data that goes clearly in the direction of further rate hikes, then the correction could in fact be ugly.
Ugly, yes, because, the widening gap between stock and bond markets becomes more alarming by the day. And the equity rally is not on solid ground.
Looking at the S&P500, the index closed yesterday a touch below the 50-DMA, further selloff below the 200-DMA was avoided thanks to Raphael Bostic…(?) But the outlook isn’t any brighter. On the contrary, the chance of a selloff intensifies by the day.
FX & energy
The US dollar trades in line with the hawkish Fed expectations, and the USDJPY has now stepped into the bullish consolation zone, having cleared the major 38.2% Fibonacci retracement on October to January retreat, to the upside.
In energy, oil bulls are working hard to drill above the 50-DMA resistance, and further good news from China is supportive. After encouraging manufacturing PMI data earlier this week, the Caixin services PMI printed the fastest growth since last August.
China is not China we knew.
Yet, the strong data from China is shadowed by Xi Jinping’s new crackdown on bankers, China’s close relationship with Russia and the deteriorating ties with the US, and China’s changing landscape due to Xi’s economic and political policies.
Nothing in China will be as bright as before 2020.
Therefore, the China factor could not be enough to convince the oil bulls to break the back of the 100-DMA resistance.
And pray for the 100-DMA to remain tight, because if energy prices gain momentum, the inflation discussion will get uglier.
ECB Has a Lot More Hiking to Do
Market movers today
Today we get service PMIs for a number of countries. After falling in most of 2022, they have generally shown signs of bottoming, as is the case with manufacturing PMIs.
In the US, ISM non-manufacturing is also due. It has moved higher the past two months from very low levels. Focus will also be on the employment index ahead of the non-farm payrolls release next week.
Tonight Fed members Bowman and Bostic will be speaking.
The 60 second overview
ECB: We now expect ECB to hike to 4% in July (previously we expected ECB to hike to 3.25%). Inflation remains stubbornly high in the Euro Area which was evident from the February inflation numbers. ECB's Pierre Wunsch indicated yesterday that it was not unreasonable to expect ECB to hike to 4%. We look for Danmarks Nationalbank to follow ECB and hike to 3.60%.
Fed: Board member Christopher Waller said he would endorse a terminal rate between 5.1-5.4%, if inflation and payrolls data cool again. If not, the target range would have to be raised above this level.
Japan: Tokyo CPI inflation dropped by a little less than expected in February to 3.4% from 4.4%. Core inflation rose to 3.2% from 3%. The effect of government energy subsidies caused inflation to drop. The smaller decline may indicate that inflationary pressures in Japan continue to build.
US: Unit Labour Costs rose much more in Q4 than previously expected. ULC growth was revised up to 3.2% from 1.1% in the preliminary release.
Equities: Equities were higher yesterday despite a lift to yields on the back on yet another set of higher-than-expected CPI data. Interesting to see the yield and equity correlation shifting back into positive. This happens only because of the stronger than expected CPI data comes along with stronger-than-expected growth data. This also tells us the overheating is still the dominating investment narrative. That is also the reason why argue that the most likely scenario in the coming months is a close to zero or negative correlation between yields and equites. The sector and rotation yesterday was not easy to digest with the odd couple utilities and tech outperforming at the same time. In the US yesterday, Dow +1.1%, S&P 500 +0.8%, Nasdaq +0.7% and Russell 2000 +0.2%. Asian markets are higher this morning and the same goes for European futures. US futures are slightly lower after the rally yesterday taking place in the last hours of cash trading session.
FI: European rates ended around 4bp higher at 2.74% (Bunds) with intra-euro area spreads showing modest changes to Bunds. The market reaction to the 5.6% euro area core inflation print was relatively muted with ECB policy peak briefly touching above 4%, but ended 1bp lower on the day. We adjusted our ECB rate call for a policy peak to 4% which will be reached via a 50bp rate hike in both March and May and 25bp hike in June and July, see more in our Preview here ECB Preview - Higher for longer - now seen at 4%, 2 March. European curves steepened from the long end weighed by Austria announcing a 30y sale next week.
FX: EUR/USD back around 1.06, as the USD erased recent losses and broadly strengthened on the back of US economic data and higher US yields, which momentarily sent USD/JPY above 137. EUR/SEK and EUR/NOK both had a quiet day yesterday after significant increases on Wednesday trading at 11.13 and 11.07 this morning, respectively.
Credit: Credit markets sold slightly off yesterday where iTraxx Xover widened 4bp and Main 1bp. Following a quite long period of elevated activity, primary market took a breather yesterday with no EUR BM transactions priced.
Nordic macro
Norway. Norwegian unemployment has remained surprisingly low despite leading indicators pointing to softer labour demand. We expect the jobless rate rose moderately to 1.7% (s.a.) in February, which would be marginally below Norges Bank's projection in the December monetary policy report. It was a huge surprise to see housing prices rise in December and holding steady in January after falling during the autumn. We expect housing prices to fall 0.2% m/m (s.a.) in February, as the effect of higher mortgage rates is not yet fully reflected in house prices. The OBOS-figures released earlier this week point to a small upside risk to our forecast.